
Abstract
There is accumulating evidence for positive effects of green spaces on mental and brain health. Here we investigated whether differentiating the types of green spaces may be relevant. On longitudinal data of children (N = 95) from the Netherlands, we quantified the link between green space exposure at home from birth onwards and MRI brain structure at 12.5 years. We differentiated between green space resulting from trees versus open green spaces and also associated visibility of sky (sky view factor) with brain structure (200 m buffer around home address). We observed a positive association between grey matter volume in different prefrontal clusters and green open space coverage as well as sky view, but a negative association within prefrontal clusters for tree cover density. Most importantly, in the medial prefrontal cortex, the only region in which all three analyses overlapped, the visibility of sky was the most important predictor. Our findings advance knowledge on health-promoting, evidence-based urban planning.
Increasing numbers of individuals live in growing urban settlements (United Nations Department of Economic and Social Affairs, 2019). This urbanization process has been described as one of the most important global health issues of the 21st century, in particular since mental health problems seem to be more frequent in cities (Peen et al., 2010). To safeguard mental and physical well-being in cities, research is needed that is targeted at identifying salutogenic factors of living environments. These insights could then be used to foster sustainable and health-promoting urban planning.
There is accumulating evidence for the positive effects of green spaces on mental health. A scoping review of interventional studies, in which participants were sent for a walk in a natural versus urban context, concluded that 70% of the studies demonstrated exposure to green spaces to be beneficial for aspects of human well-being (Wendelboe-Nelson et al., 2019). Similar short-term nature exposure studies have meta-analytically shown moderate increases in positive affect and smaller, yet consistent, decreases in negative affect (McMahan & Estes, 2015). However, in order to inform urban planning it might be more appropriate to focus on studies investigating the effects of long-term green space exposure in the living environment of individuals, since this is likely to elicit more long-lasting effects. The present literature linking long-term green space exposure to mental health indicates a positive association between the amount of green space around the home address and life satisfaction (hedonic wellbeing) (for a review, see Houlden et al., 2018). Also, in children and adolescents, green space exposure around the home address is associated with positive outcomes, including fewer emotional and behavioral difficulties as well as less hyperactivity and inattention problems (for a review, see Vanaken & Danckaerts, 2018). Moreover, there is some evidence suggesting a positive association between green space around the home address and well-being in children and a negative association with depressive symptoms in adolescents and young adults (Vanaken & Danckaerts, 2018). The most prominent exception to the benefits of green space on mental health seems to be observed in older adults, where dementia is reported to be less frequent in urban compared to rural areas and cognitive performance seems to be higher in more urban areas (Georgi et al., 2019; Robbins et al., 2019). To better understand the potential underlying brain-based mechanisms of these mental health effects of green space exposure, neuroimaging studies are needed, that associate green space with brain structure. Knowledge on the brain regions involved can help to unravel whether the effects are driven by more cognitive or affective/stress-related mechanisms. Moreover, this research could in the long run help to disentangle which brain variations in mental health are driven by environmental versus genetic effects. However, at present, the existing body of environmental neuroimaging studies is scarce.
So far, most of the existing neuroimaging studies exploring associations between living environments and brain structure have quantified the effects of urban upbringing, by assessing how many years participants lived in urban, suburban or rural areas, defined based on population density of the respective city, town or area, during the first 15 years in life. Here, the consistent pattern in adults (from Western societies) has been that more years spent in urban areas during upbringing were associated with lower volume or cortical thickness in the prefrontal cortex, while controlling for education (Besteher et al., 2017; Haddad et al., 2015; Lammeyer et al., 2019). The relevance of the structural volume and thickness of the prefrontal cortex for mental health has been highlighted by a meta-analysis showing that deficits in prefrontal structure are associated with the presence of psychiatric disease (Goodkind et al., 2015). And more generally the “bigger is better” hypothesis with regards to brain volume (Yuan & Raz, 2014) has been supported by studies showing an association between prefrontal cortex and intelligence (Basten et al., 2015) and other cognitive abilities that rely on executive functioning (e.g. self-control, decision-making, planning and problem solving). Although these results could be taken to highlight the negative effects of urbanicity, it may reversely be read as indicating, that more rural, and therefore likely more exposure to green spaces (also urban green spaces) during upbringing, may be associated to higher brain volume/thickness.
Although most of the existing literature has focused on the differences between rural and urban upbringing, defined based on population density, these findings are not particularly helpful in informing concrete steps for urban planning to improve mental health. In order to provide guidance for urban planning, the identification of concrete “active ingredients” is needed that characterize the respective living environment (e.g. tree cover density). A study that goes beyond the urban versus rural definition based on population density is one in which green space was quantified and defined by means of the normalized difference vegetation index (NDVI) on satellite data, which was conducted in 7-10-year-old children in Barcelona (Dadvand et al., 2018). The results of the study support the postulated positive link between urban green space exposure and prefrontal cortex volume. However, a drawback of the quantification of green spaces via satellite data in the abovementioned work is that it cannot discriminate whether the green results from tree canopy or from grass and other more open green spaces (fields, pastures, etc.) with little or no tree canopy (Nieuwenhuijsen, 2015; Reid et al., 2017). But, this difference could be crucial for several reasons: tree canopy and open green spaces likely differ in the amount of brightness and daylight exposure they permit for human beings, which in turn is known to be relevant in depression (Humble, 2010). The prospect-refuge theory (Appleton, 1996) suggests that humans derive the feeling of safety and pleasure from environments that offer free views (prospect) and a sense of enclosure (refuge). In particular the part on prospect, which has been recently supported by a meta-analysis (Dosen & Ostwald, 2016), would predict more beneficial effects for open green spaces, where the green is represented by grass and shrubs, but not by trees, so that high visibility of the sky and therewith prospect in the horizontal and vertical domain is granted in contrast to areas with high tree cover density, that preclude sky visibility (vertical) as well as horizontal free view. Most importantly, identifying the actual type of green space that is beneficial for brain health would be relevant in order to derived more concrete recommendations for urban planning.
Purpose of the Present Study
To fill this research gap the aim of the current study (the preregistration of the data analysis can be found here: https://aspredicted.org/ib4sf.pdf) was to distinguish between different types of vegetation, namely areas with trees and open green spaces where the green is basically situated below the eye level of humans and to test for the association of brain structure with visibility of the sky. In order to do so, we extracted tree canopy from tree cover density maps, land use classes that comprise grass and other open green spaces where the sky is not concealed by trees from Corine Land Cover atlas, as well as the visibility of sky by means of segmentations of Google Street View pictures. Subsequently, we investigated the link between the two categories of green space exposure (tree vs. open green space) from birth until 12.5 years of age and sky exposure at age 12.5 years at the respective home address with brain structure at the age 12.5 years. The participants consisted of a low-risk community cohort in the Netherlands that was followed from pregnancy onwards. We hypothesized that open green space rather than tree cover density would be positively associated with prefrontal grey matter volume; and reasoned that this is potentially due to the fact that open green spaces provide higher visibility of the sky and therefore lead to higher brightness and more daylight exposure.
Method
Sample and Study Design
Healthy pregnant mothers were recruited in midwife practices to participate in a prospective longitudinal study, in which mothers and children were to be followed from late pregnancy onwards (Beijers et al., 2010). They received information packages and could proactively send a paper via mail to enroll in the study. Participants were then called by the researchers, who provided more information on study details and after this they received an information package with a summary of the information given verbally. At the same time, they received the informed consent letter that needed to be sent back to the researchers. Participants mainly came from the region of Nijmegen and Arnhem, the Netherlands. Inclusion criteria were singleton pregnancy, absence of drug use during pregnancy, absence of severe physical and/or mental health problems, and mastery of Dutch language. Initially, 220 mother-infant dyads were enrolled in the study, of which 193 actually participated; at 12.5 years of age, 160 mothers and their children were still in the study. Mothers and their children were assessed regularly from pregnancy (week 37) until now. At each occasion, the home address was assessed. Brain imaging was assessed at age 12.5 years. The ethical committee from the Faculty of Social Sciences of Radboud University approved the earlier assessment waves of the study (#ECG300107, #ECG13012012, # SW2017-1303-498). The 12.5-year MRI assessment wave was approved by the local medical ethics committee (CMO region Arnhem—Nijmegen). Parents were informed in detail about the procedures, in accordance with Dutch medical ethical standards. Informed consent was obtained from the children (orally) and both parents (in writing) prior to participation.
The families were incentivized by being told they would receive a copy of the videos taken during the visits with their infant, a report on their infant’s temperament, and small gifts as a thank you. These gifts (that were not announced to the mothers) were a “BIBO” bib at birth, small cuddly WWF monkey toy during the visits of 6 weeks and 5 months, a shape sorter game at 12 months, and a ball and booklet at 30 months. Mothers were informed that they could stop participation in the BIBO study at any moment and without the need for giving a reason.
Anatomical MRI scans were acquired for 97 children as part of a larger data collection wave at age 12.5 (M = 12.78, SD = 0.27). Children were excluded from MRI assessment if they had a severe physical or mental disability, as well as standard counter-indications for MRI. All children had normal or corrected-to-normal vision and were familiarized with the scanning environment prior to the actual MRI session (simulation scanner without the presence of a magnetic field).
MRI Image Acquisition
Brain image acquisition was performed using a 3T MAGNETOM PrismaFit MRI scanner (Siemens AG, Healthcare Sector, Erlangen, Germany) with a 32 channel-coil. The children underwent imaging in the supine position. Structural whole brain T1-weighted images were acquired using a MPRAGE sequence (TR = 2,300 ms, TE = 3.03 ms, 192 sagittal slices, voxel size = 1.0 × 1.0 × 1.0 mm, FOV = 256 × 256 mm). The field of view was positioned perpendicular to the long axis of the right hippocampus on a sagittal view of the T1 image.
MRI Preprocessing
Structural T1-weighted images were preprocessed using Statistical Parametric Mapping (SPM12, see www.fil.ion.ucl.uk/spm), which is implemented in MATLAB (version 2019a). The raw T1 images were checked for anatomical abnormalities, movement artifacts and alignment to the anterior commissure. The Template-O-Matic (TOM; version 1: http://141.35.69.218/wordpress/software/tom/) toolbox was used to create a custom pediatric tissue probability map based on age and sex of the sample. The TOM-toolbox provides reference data, based on imaging data from the National Institutes of Health (NIH) study of normal brain development for creating customized tissue probability maps. Diffeomorphic Anatomical Registration Through Exponentiated Lie (DARTEL) algorithm was used for tissue segmentation and inter-subject registration of the grey matter images to a group average template image. The customized DARTEL template was used for the normalization of the grey matter images into Montreal Neurological Institute (MNI) space and images were smoothed using 8 × 8 × 8 mm FWHM Gaussian kernel. Data quality of the normalized and smoothed grey matter maps was checked using the “Check Sample Homogeneity” function of the Computational Anatomy Toolbox 12 (CAT12). Data of six children were indicated as potential outliers—based on a mean correlation of the sample below two standard deviations. After visual inspection, data of two children were excluded from further analysis due to insufficient data quality (final sample size n = 95).
Georeferencing Data
Tree cover density (TCD)
Data was taken from the Copernicus Website, provided by the European Environment Agency that constitutes a study of TCD in Europe (https://land.copernicus.eu/pan-european/high-resolution-layers/forests/tree-cover-density). The maps rely on information derived from multispectral high resolution (HR) satellite data using very high resolution (VHR) satellite data and/or aerial ortho-imagery as reference data. TCD is assessed on VHR sources by visual interpretation following a point grid approach on images acquired from March to October and subsequently transferred to the HR data by a linear function. The map therewith provides information on the proportional crown coverage per pixel. Its resolution is 20 × 20 m and tree cover density ranges from 0 to 100%. TCD is available for 2012 and 2015. We used the map from 2012 for the years 2006 to 2013, the map from 2015 for the years 2014 to 2017 and 2018 for the years 2018 to 2020.
We extracted the mean TCD in radii of different sizes (200 m, 500 m, 1 km) around the home address of the children for each year separately using QGIS (QGIS.org, 2019) to account for the different radii that have been used in the relevant previous literature (Dadvand et al., 2018; Kühn et al., 2017) (Figure 1A). To derive a measure of capturing the average tree exposure until the age of 12.5 years, we computed the mean over the years that a participant lived at a particular location, accounting for when participants relocated, however the addresses were assessed on a yearly basis, resulting in some degree of imprecision if participants moved in a particular year.
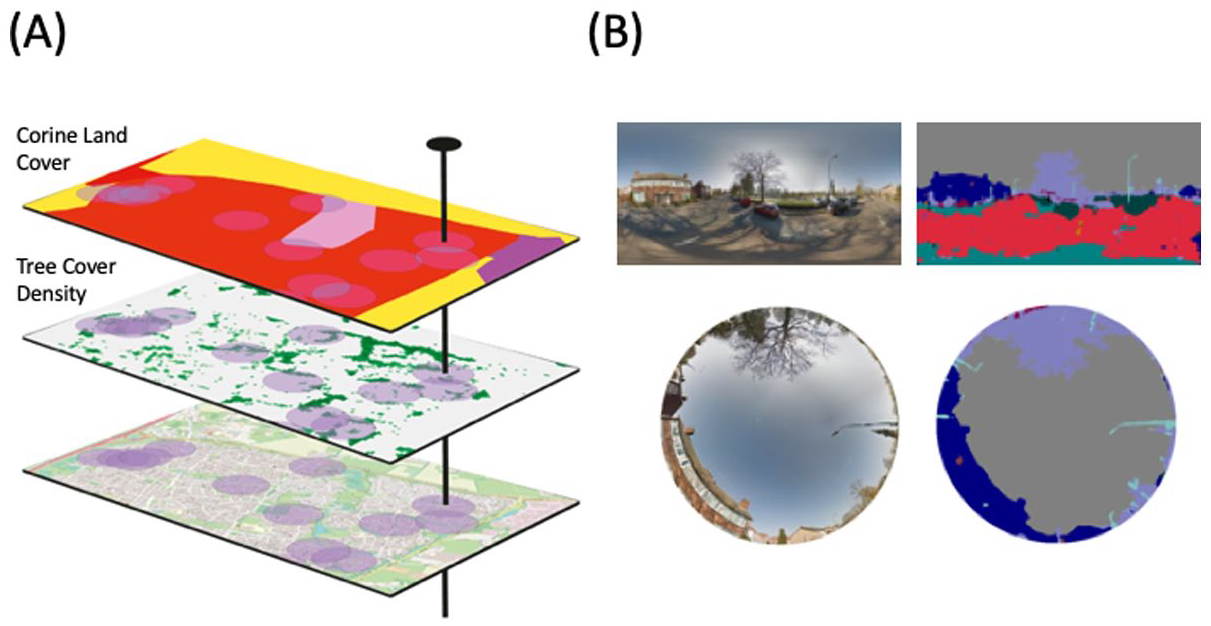
Illustration of the different geodata used: (A) illustration of the overlay of different geo data: Corine Land Cover Atlas on top, Tree Cover Density in the middle, and Open Street Map on the bottom; the purple circles represent buffers around the home addresses of the participants, and (B) illustration of Sky view segmentation with a fisheye picture from Google Street View on the left and a segmented version of the same picture on the right.
Corine land cover (CLC) inventory to define open green space (OGS)
The inventory provided by the European Environment Agency (EEA, https://land.copernicus.eu/pan-european/corine-land-cover) was developed in a bottom-up approach with national teams producing the database for their own country, which is then integrated at a European level. In most countries, the inventory was produced by visual interpretation of high-resolution satellite imagery. The CLC consists of 44 different land cover classes (e.g., forest, urban fabric, agricultural areas, etc.) and uses a minimum mapping unit of 25 ha for areal phenomena. The positional accuracy of the inventory is around 100 × 100 m or better. In contrast to TCD, our goal with using the land use classes was to capture areas that would also appear green on satellite images but would not consist of trees and therefore rather constitute open green landscapes, namely: 2.1.1. non-irrigated arable land, 2.1.2. permanently irrigated land (not present in this sample), 2.3.1. pastures, 2.4.1. annual crops associated with permanent crops (not present in this sample), 2.4.2. complex cultivation patterns, 2.4.3. land principally occupied by agriculture, 3.2.1. natural grassland, 3.2.2. moors and heathland, 3.2.3. sclerophyllous vegetation (not present in this sample). We extracted the percent coverage of the land classes of interest in radii of different sizes (200 m, 500 m, 1 km) around the home address of the children for each year separately using QGIS (QGIS.org, 2019) (Figure 1A, Supplemental Table for percentages per buffer size). To derive a measure capturing the exposure until the age of 12.5 years, we computed the mean coverage over the years considering when participants relocated based on the yearly acquired address data that we gathered. To derive a measure summarizing several land use classes (see above), we summed the respective land use coverage in the respective radii of interest.
Sky view factor (SVF)
To extract the amount of sky visible on panorama photographs (Figure 1B) from Google Street View in Google Maps (acquired at about eye level height) we used GSV2SVF (https://github.com/jian9695/GSV2SVF) (Liang et al., 2020). The photos are classified into multiple classes including sky, tree and building and then transformed to a fisheye image. The three classes (sky, tree, building) represent the areal proportion of the fisheye image with a range between 0 and 1 (video illustrating the results can be seen here https://youtu.be/k00wCnuzuvE). GSV2SVF makes use of Caffe-SegNet deep convolutional framework (https://github.com/alexgkendall/caffe-segnet) to classify street images. We extracted all available Google Street View photographs within a radius of 200 m around the home address of the participants at the time of the MRI assessment (2019/2020). Since only recent photo material (accessed 2021) was available, we refrained from computing SVF across the whole lifespan of the participants and instead only have a momentary assessment of the Sky View Factor around the time of the MRI acquisition. We only used the radius of 200 m since we assumed that the sky view and therewith light accessibility directly around the home address was relevant.
Voxel-Based Morphometry
We conducted whole brain multiple linear regression analyses with summed mean Tree Cover Density (TCD) over the lifespan and average percentage of coverage of open green spaces (OGS) as well as sky view factor as predictor variables and grey matter volume as the outcome variable. Total intracranial volume (TIV), child sex at birth, age at MRI-scan, and maternal education were used as confounding variables, which is commonly done in neuroimaging studies since grey matter volume is known to be affected by age, sex and TIV (Barnes et al., 2010). Maternal education was controlled for as a proxy of socioeconomic status (SES), since the living environment is known to be influenced by SES. We reported the separate analyses first instead of one analysis considering tree cover, open green space, and sky view at the same time. With this approach, we aimed to demonstrate how different the results appear when deciding for one or the other aspect of green, which has been common practice in the field so far. The resulting brain maps were thresholded with p < .001, and the statistical extent threshold was used to correct for multiple comparisons combined with a non-stationary smoothness correction based on permutation (Hayasaka & Nichols, 2004) as implemented in the CAT12 toolbox (Version r2000). Results are displayed on the MNI152 template using MRIcroGL.
Results
Descriptive Statistics
The participants of the present sample were on average exposed to TCD of 9.41% (SD = 5.43, range: 0–27.66) in a 200 m buffer, 9.34% (SD = 5.04, range: 0.64–27.36) in a 500 m buffer, and 9.25% (SD = 5.95, range: 0.38–34.67) in a 1 km buffer around their home addresses until the age of 12.5 years. Average OGS coverage was at 8.73% (SD = 14.32, range: 0–57.14) in a 200 m buffer, 14.43% (SD = 14.52, range: 0–57.14) in a 500 m buffer, and 21.53% (SD = 21.13, range: 0–57.14) in a 1 km buffer, mostly driven by the land use classes pastures (2.3.1) and complex cultivation patterns (2.4.2) (see Supplemental Table for details). TCD and OGS coverage was negatively associated (200 m: r (95) = −0.389, p < .001; 500 m: r (95) = −0.402, p ≤ .001; 1 km: r(95) = −0.333, p = .001). The sky view factor (SVF) the participants were exposed to around their home address where they lived at the time of MRI assessment was 63.5% (SD = 11.94, range: 27.96–87.95) on average in a 200 m buffer.
Tree Cover Density
In a whole-brain linear regression analysis, we observed a negative association between lifespan TCD exposure in 200 m radii around the home addresses and grey matter volume in multiple clusters within the fronto-median wall, bilateral lateral prefrontal cortex, as well as right middle temporal and left middle occipital gyrus (Figure 2—left, Table 1) while controlling for sex, age, TIV, and maternal education (for a rational for the choice of confounding variables see Methods section). In the 500 m radius the effect was still visible, but the clusters were smaller. In the 1 km radius, the effect was no longer significant. No significant positive associations were observed.
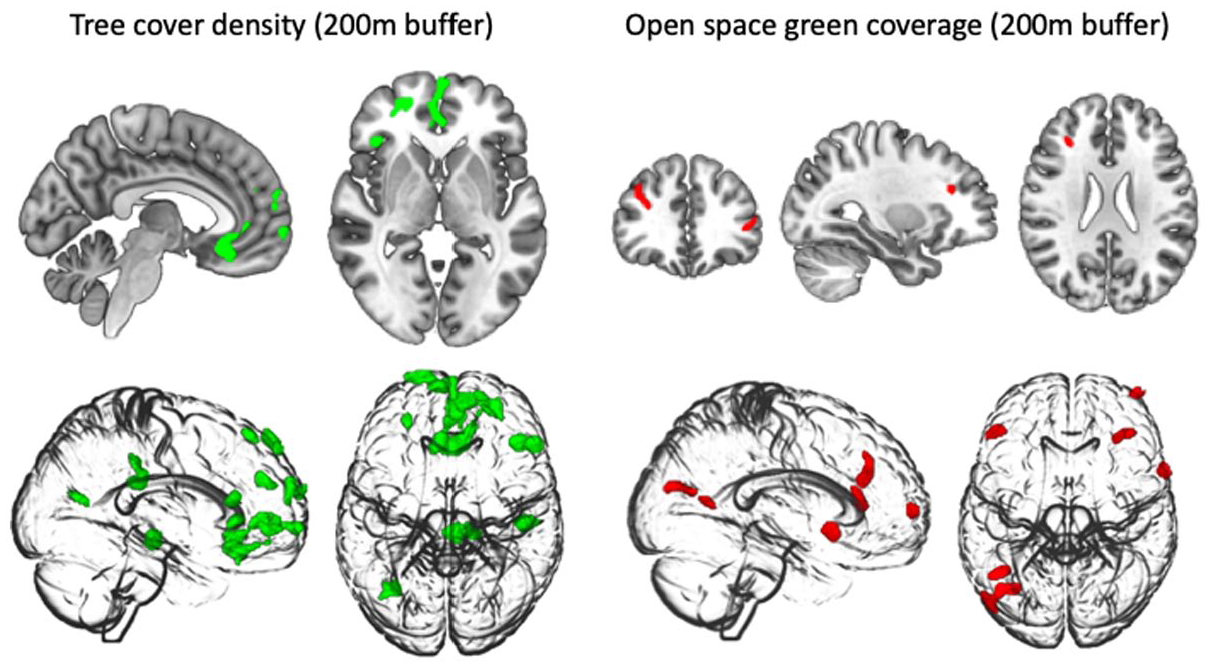
Results of linear regression analysis on regional grey matter volume with different geo-parameters as predictors: Tree cover density and open green space.
Clusters of the Whole Brain Regression Analysis Associating Tree Cover Density (TCD), Land Use Coverage of Open Green Space Areas and Sky Extracted From GoogleStreetView With Grey Matter Volume Maps.
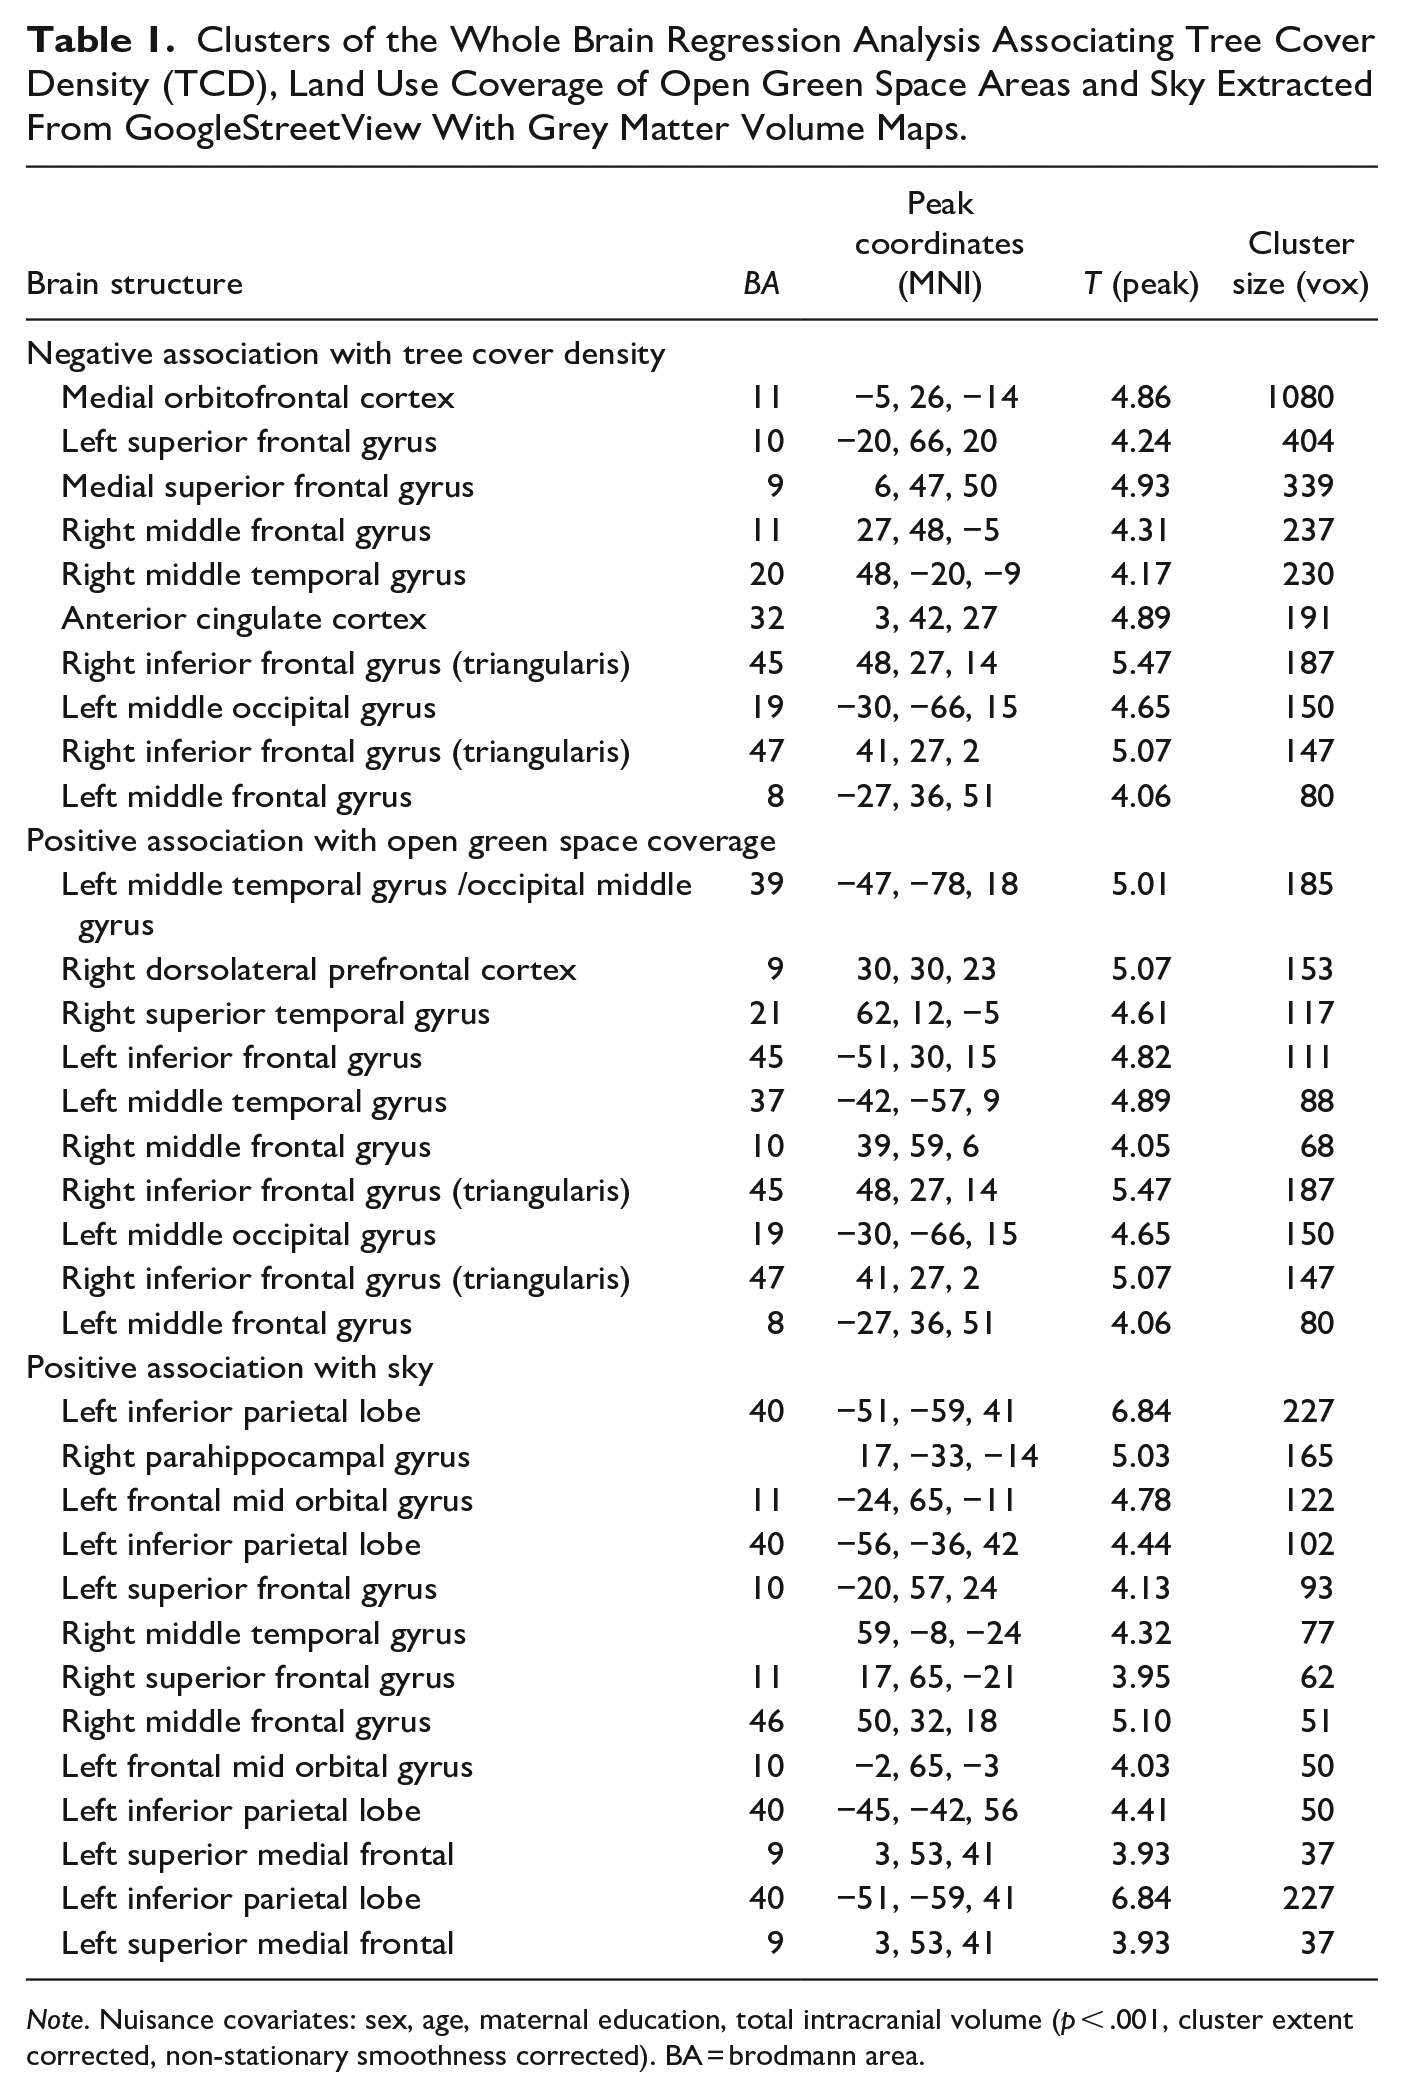
Note. Nuisance covariates: sex, age, maternal education, total intracranial volume (p < .001, cluster extent corrected, non-stationary smoothness corrected). BA = brodmann area.
Open Green Space
In a separate whole-brain linear regression analysis, we found a positive association between open green space land use coverage in 200 m radii around the home addresses and grey matter volume in several clusters in bilateral prefrontal cortex and temporal cortex (Figure 2—right, Table 1) while controlling for the covariates as above. In the 500 m radius, same as above the effect was still visible, but the clusters were smaller. In the 1 km radius, the effect was not significant anymore. No significant negative associations were observed.
The pattern of results reported above was similar when both regressors (i.e., TCD and OGS) were jointly entered in a single whole-brain analysis.
Sky View Factor
In a whole-brain linear regression analysis that went beyond our preregistered analysis plan (https://aspredicted.org/ib4sf.pdf), we aimed to test, whether the observed positive association between open green space and grey matter volume in prefrontal cortex could potentially be due to the fact that open green spaces are confounded with a free view onto the sky. In line with this hypothesis, we observed a strong negative association between sky view factor (SVF) and tree view factor as segmented from the same Google Street View photographs, r (91) = −0.91, p < .001. Likewise, we observed a negative association between SVF and TCD, r (91) = −0.55, p < .001, and a positive association between SVF and open green space in a radius of 200 m, r (91) = 0.24, p = .023)
In a whole-brain analysis, we found a positive association between SVF in a radius of 200 m around the home addresses at the time of scanning and grey matter volume in several bilateral prefrontal areas and parietal lobe (Figure 3, blue, Table 1), while controlling for sex, age, TIV, and maternal education. No significant negative associations were observed.
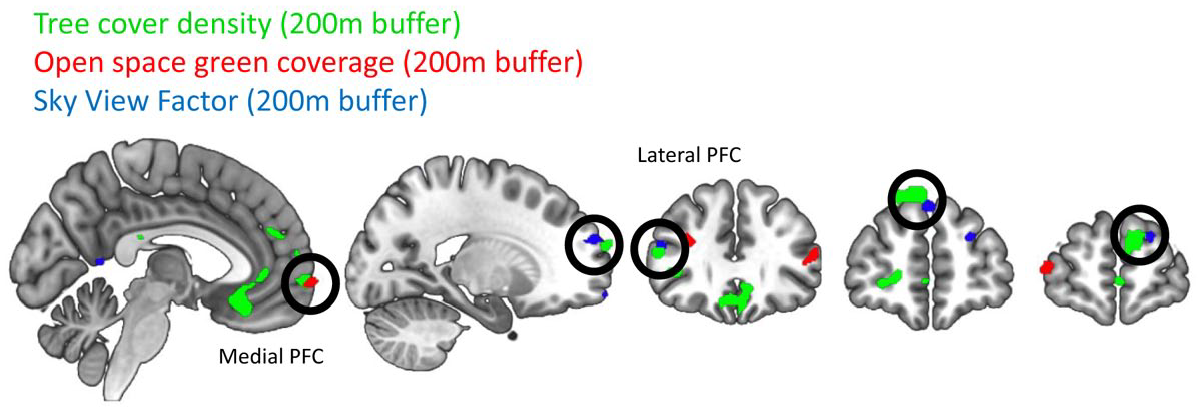
Overlap between results of linear regression analysis on regional grey matter volume with different geo-parameters as predictors: Tree cover density, open green space, and sky view factor.
Overlap Between Different Analyses
Moreover, we observed overlap between brain regions positively associated with sky and brain regions positively associated with open green space and those negatively associated with tree cover (Figure 3). All three contrasts overlap within the medial orbitofrontal cortex (BA 10, MNI: −1, 63, −4). When extracting the raw grey matter probability from the medial prefrontal brain region in which all three contrasts overlap and running a regression with all the predictors: TCD, open green space coverage, SVF as well as age, sex, TIV, and maternal education; neither TCD (β = −.177, p = .145) nor open green space coverage (β = .186, p = .094) was a significant predictor anymore, but SVF remained significant (β = .237, p = .036).
Discussion
We set out to investigate how different types of green space in the living environment of children from birth until early adolescence are related to brain structure in early adolescence. A previous study focussed on the child brain as an outcome used satellite images to quantify the amount of green space using a radius of 100 m around the home address of the participants from birth until the time of MRI acquisition (Dadvand et al., 2018). The authors reported that more lifetime neighborhood green space was associated with higher grey matter volume in bilateral prefrontal cortex in children living in and around Barcelona. In line with the findings from Barcelona, we observed a positive association between open green space coverage and grey matter volume in bilateral prefrontal cortex. In contrast, we found a negative relation between tree cover density (TCD) in multiple clusters in bilateral lateral and medial prefrontal cortex. Interestingly, Sky view factor (SVF), as a quantification of how much sky can be seen from an eye-level perspective, was also positively associated with clusters in lateral and medial prefrontal cortex. The SVF, which was highly correlated to OGS, was the most important predictor of grey matter volume in the medial prefrontal region, where all three analyses (trees, open green space, sky exposure) overlapped.
Prefrontal Cortex
The prefrontal cortex as a location in the brain can be considered a highly relevant brain region since it orchestrates thoughts and action. In addition, mental health disorders have consistently been associated with deficits in prefrontal cortex (Goodkind et al., 2015). Moreover, it is prominently implicated in executive functions (Yuan & Raz, 2014), including functions such as planning, decision-making, cognitive flexibility, the inhibition of impulses and attention; all processes that are highly valued by our Western society.
The prefrontal cortex can be subdivided into the lateral and medial portion. In terms of function the medial prefrontal cortex has been interpreted as reflecting a monitoring function, such as the detection of action conflict or also decision uncertainty and reward expectations, while the implementation of appropriate regulatory control measures is usually ascribed to the lateral prefrontal cortex (Botvinick et al., 2001; Duverne & Koechlin, 2017; Ridderinkhof et al., 2004). Tree cover density was mostly negatively associated with grey matter volume in medial brain regions that are prominently related to reward and affective processing, whereas open green space was positively associated with volume in lateral portions of the prefrontal cortex, associated with cognitive control functions.
Result in the Light of Previous Studies
Comparing the present results to the previously presented data from children in Barcelona (Dadvand et al., 2018), one may be tempted to assume that this positive association with prefrontal cortex volume might also be driven by open green spaces instead of trees. A study on a different sample of participants from Barcelona attempted to predict normalized difference vegetation index (NDVI) green space in buffers of 100 and 300 m by means of land use coverage extracted from the same buffers. They reported that variability in NDVI green space estimate was mainly explained by urban green and natural green areas (Gascon et al., 2016). Since urban green and natural green areas, per definition includes forest; it remains unclear, whether a clear distinction between trees and OGS would have yielded similar brain findings in the sample of children from Barcelona. Based on the reported results here, we would like to recommend that future studies discriminate between TCD and OGS when investigating associations with brain and/or mental health, to further our understanding on which type of green space is most beneficial.
As usual in studies working with geographic information systems (GIS) methodology, the choice of the radii from which geographical information is extracted is arbitrary. This phenomenon is described in the literature as the modifiable areal unit problem. In the present study we decided against the use of a radius of 100 m since land use coverages can be heavily zero inflated when the buffer size is small. In a previous study that associated geo-characteristics around the home address with the brain structure in older adults, we used a larger radius of 1 km (Kühn et al., 2017). We followed the rationale that areas in a 1 km radius are within walking distance of older adults. However, for children this might be different, as especially young children likely spend more time in and around their house, and the radius is likely considerably smaller. This might also explain why we find effects for 200 m radii for all geo-indicators: tree cover density, open green space, and sky view, but less extensive ones for 500 m radii and no significant effects for 1 km radii. This could be taken suggest that urban planning should focus specifically on providing open green spaces and sky exposure for children in close proximity to their home.
In an above-mentioned previous study of our group, we investigated the association between structural integrity in different brain regions of interest, namely amygdala, dorsolateral prefrontal cortex, and dorsal anterior cingulate cortex, with land use coverage in a 1 km buffer in a sample of older adults (Kühn et al., 2017). In this analysis, we discriminated between forest, urban green (a land use category from the European Urban Atlas comprising parks, zoos etc.), water, and wasteland, but observed only a significant positive association between forest and amygdala integrity, and no significant relation between urban green and any prefrontal region.
In another whole-brain analysis on the same data set of older adults, we observed a positive association between urban green in a 1 km radius around the home address and pregenual/subgenual anterior cingulate cortex, also a region within the prefrontal cortex (Kühn et al., 2021). Note, however, that the buffer size (1 km) was larger than in the present study and the target population was older than in the study reported here.
We found one previous study that also made the attempt to discriminate between trees and OGS when associating environmental factors with self-reported health, on participants from New York (Reid et al., 2017). Interestingly, the authors reported a positive association between tree density in a 1 km buffer and the likelihood to report “very good” or “excellent” health. However, when the authors looked at a 300 m buffer instead (i.e., closer to our 200 m buffer), they did not find a positive effect of trees. However, in contrast to our findings, they observed a negative association between self-reported good or excellent health and grass within this 300 m buffer. Although the percentage of open green space coverage around the home address in our sample from Nijmegen (8.29%, 200 m buffer) and in this study in New York (9.2%, 300 m buffer) was comparable, we observed a significant negative association between TCD and open green space coverage, while the sample from New York showed a positive association of moderate effect size (r = .41), potentially hinting at differences in the characteristics of green spaces and tree coverage between the two geographical regions. Another crucial difference between the studies is the buffer size in which the positive effects were observed, which was 1 km in the New Yorker adult sample and 200 m in the Nijmegen sample of children.
Potential Pathways and Working Mechanisms of the Observed Association of Green Spaces and Sky Visibility and Brain Structure
Whenever associations between green space exposure with brain are demonstrated, the question should be raised how these potential effects might have come about. Although the data presented here does not allow causal conclusions, we would like to speculate on potential pathways. Generally, the effects could be transmitted via the visual pathway, where the color of green (Akers et al., 2012; Lichtenfeld et al., 2012) or brightness in open green spaces might play a role, or the auditory pathway, where typical sounds present in green spaces, for example, bird songs could be relevant (Stobbe et al., 2022) or the olfactory pathway, since Terpenes of trees have been suggested to induce positive health effects (Cox-Georgian et al., 2019; Guzman-Gutierrez et al., 2012). Since we observed a result pattern consisting of a negative association between TCD and a positive association between SVF and prefrontal brain volume this may hint at a potential detrimental effect of a high density of trees in the direct living environment. In terms of mechanisms, this effect could be potentially explained by trees precluding daylight exposure. Daylight has been shown to induce positive effects on affect and stress-reduction (Beute & de Kort, 2018). Likewise, humans show an explicit preference for light as opposed to dark, and sunny as opposed to overcast (and natural as opposed to urban) scenes (Beute & de Kort, 2013). Beute and de Kort reason that both natural environments and daylight exposure often coincide and should be preferred, since both constitute important components of survival. The most well-known association between daylight and mental health is probably the link to seasonal affective disorder (Rosenthal et al., 1984), for which it has been shown that exposure to daylight can relieve symptoms, an effect that may be mediated by vitamin D and in turn the production of serotonin that positively affects mood (Humble, 2010; Wirz-Justice et al., 2021). This mechanism may also explain differences of results between sunnier countries such as Spain, where tree cover might have a more positive effect, since inhabitants still receive plenty of sunlight and rather suffer from high temperatures, and less sunny countries such as the Netherlands, where tree coverage may have more detrimental effects because it obstructs the scarce resource of daylight.
The opposition of trees and visibility of sky has recently been demonstrated in a study (Mascherek et al., 2022) attempting to replicate the well-known window study by Ulrich that has shown that hospital windows facing a tree instead of a brick wall lead to shorter hospital stays in surgery patients (Ulrich, 1984). In this study on depressed psychiatric inpatients, we also quantified brightness and observed a suppression effect between the amount of green from trees and brightness. Both variables were negatively related to the length of stay of patients, but only, when both variables were entered in the same model, indicating that green in form of trees may work against the other salutogenic factor, namely brightness.
One may argue, that as opposed to trees, open green spaces optimize the exposure to both daylight and green. Our exploratory analysis of the amount of sky visible in Google Street View pictures taken at eye level in a radius of 200 m around the home address at the time of MRI acquisition confirmed this notion. We observed a positive association between SVF and several clusters in the bilateral prefrontal cortex and an overlap of all three contrast results in a cluster in the medial orbitofrontal cortex. The linear regression analysis, in which all factors (i.e., tree cover, open green space, and sky visibility) were entered as predictors, revealed that only the predictor sky visibility reached significance. This suggests that the amount of visible sky is the strongest predictor in the context of the other green space variables, which may be seen as arguing in favor of the idea that sunlight/brightness is the most prominent driving mechanism of the observed brain effects. Recent research demonstrating the light sensitivity of the prefrontal cortex in humans, might be interpreted to support this notion (Sabbah et al., 2022). The authors of this study state that their findings offer a functional link between light exposure and PFC-mediated cognitive and affective phenomena.
Strengths and Limitations
A clear strength of the present data and analysis is, that it results from longitudinal data that was acquired prospectively and therewith overcomes many of the biases observed when participants have to retrospectively recollect where they lived during different stages of their lives. Moreover, it is a developmental study which provides evidence on how childhood exposure to green living environments may affect brain structure at age 12.5 years, which may guide future urban and educational building endeavors for children and adolescents towards offering more open green spaces with high sky visibility. A limitation of the present study is that it is an observational study, which means that we cannot infer the causal directionality of the effects reported. One may be tempted to argue that children likely do not self-select their environment (if so, the parents do), but nevertheless intervention studies, for example using virtual reality (VR) setups, or longitudinal studies following individuals who move to different places, or studies following children while their environment changes (e.g., renovation of playgrounds), are needed to disentangle cause and effect.
As is common in studies using geographic variables, there is a modifiable areal unit problem (MAUP) in our study, meaning that the results depend on the spatial units that we chose for the analysis and those somewhat arbitrary choices sometimes make it difficult to compare the present results to other findings reported previously that used different spatial units.
Another limitation could be seen in the fact that the TCD estimate we used, utilized satellite images acquired between March and October. For deciduous trees this might have contained times, where the leaves already changed their green color to red/yellow/brown. Future studies may want to limit the season across which the satellite images are used to determine TCD to the summer months.
A potential disadvantage could be that the present population consisted of healthy, relatively highly educated families. However, this implies that even under quite optimal conditions, the environment may play a role in brain development.
Future research may want to additionally consider presence of blue spaces, namely coasts, rivers, lakes, around the home address as an additional factor, since water reflects the sky and likewise appears blue to the human eye. In addition, future studies should investigate to what extent the brain structures associated with green/sky exposure are in turn related to mental health, to potentially establish a mediation model.
Conclusion
To summarize, we set out to differentiate green space in the living environment of children into green from trees and open green spaces. Since those two categories likely differ in the amount of brightness and daylight exposure it permits as well as the perceived space and openness, we also took visibility of sky into account. In contrast to a similar previous study that linked green space in general (combining trees and open green spaces) to larger prefrontal cortex volume in children from Barcelona (Dadvand et al., 2018), we observed a negative association within prefrontal cortex for tree cover density, but a comparable positive association between prefrontal cortex volume and green open space coverage. Most importantly, the visibility of sky, which was highly correlated with the presence of open green spaces, was the most important predictor of grey matter volume in the medial prefrontal cortex where all separate analyses overlapped. The positive association between open green space and visibility of the sky with prefrontal cortex volume may pave future research aimed at guiding evidence-based urban planning, as it suggests that open green spaces and high visibility of the sky could be beneficial for children and might therefore be relevant when building playgrounds, kindergartens and schools. However, further studies with larger data sets are needed to replicate the results and enable the entry of more predictive variables at the same time to identify the best predictor of prefrontal cortex volume.
Supplemental Material
sj-docx-1-eab-10.1177_00139165231183095 – Supplemental material for Green Is Not the Same as Green: Differentiating Between the Association of Trees and Open Green Spaces With Children’s Brain Structure in the Netherlands
Supplemental material, sj-docx-1-eab-10.1177_00139165231183095 for Green Is Not the Same as Green: Differentiating Between the Association of Trees and Open Green Spaces With Children’s Brain Structure in the Netherlands by Simone Kühn, Katharina Schmalen, Roseriet Beijers, Anna Tyborowska, Karin Roelofs and Carolina de Weerth in Environment and Behavior
Footnotes
Acknowledgements
We would like to thank Tim Metzner and Thomas Feg for their help with the sky view extraction.
Declaration of Conflicting Interests
The author(s) declared no potential conflicts of interest with respect to the research, authorship, and/or publication of this article.
Funding
The author(s) disclosed receipt of the following financial support for the research, authorship, and/or publication of this article: SK has been funded by the Max Planck Society, the European Union (ERC-2022-CoG-BrainScape-101086188) and the Jacobs Foundation (JRF 2016-2018). KR was funded by a VICI grant (#453-12-001) from the Netherlands Organization for Scientific Research (NWO) and a consolidator grant from the European Research Council (ERC_CoG-2017_772337), also supporting AT. RB has been funded by a VENI grant from the Netherlands Organization for Scientific Research (016.Veni.195.197). CdW’s work was supported by the Netherlands Organization for Scientific Research VIDI grant (575-25-009) and VICI grant (016.Vici.185.038), and a Jacobs Foundation Advanced Research Fellowship.
Supplemental Material
Supplemental material for this article is available online.
Author Biographies
References
Supplementary Material
Please find the following supplemental material available below.
For Open Access articles published under a Creative Commons License, all supplemental material carries the same license as the article it is associated with.
For non-Open Access articles published, all supplemental material carries a non-exclusive license, and permission requests for re-use of supplemental material or any part of supplemental material shall be sent directly to the copyright owner as specified in the copyright notice associated with the article.