
Abstract
Task–Environment fit, a special case of Person–Environment fit, has been suggested as the central mechanism through which Activity-Based Working (ABW) Environments support productivity and employee wellbeing, here operationalized as team functioning and concentration troubles. We extend previous work in this space by testing the asymmetric effect (where deficient supply is worse than excess supply) usually assumed, with a new statistical approach—cubic polynomial regression—capable of such tests. The complex models gained only partial support and none for a strict congruence effect. Results are more in line with previous work on P–E fit showing that higher levels of needs met are more valuable, and with previous ABW work showing that the supply of suitable environments has the largest impact on outcomes.
Keywords
A core tenet of activity-based working (ABW) is location freedom: to choose where to work (e.g., within the office, from home, or other locations) based on employees’ needs and task requirements (van Koetsveld & Kamperman, 2011). Employees are not only allowed but expected to act flexibly and adaptively and to craft one’s daily work in order to achieve a better fit and less strain (Leana et al., 2009). On the one hand, employees gain freedom over where they spend their time; on the other hand, employees are expected to take responsibility for their productivity and wellbeing, making good use of the resources offered by the organization. A concept of importance for understanding activity-based working and its effects on employees, is the fit between work environment and the task requirements. In this study, we examine the concept of Task–Environment (T–E) fit, a specific form of Person–Environment (P–E) fit that is especially salient in activity-based working environments, and its relationships with wellbeing and performance in activity-based work.
The relationship of work environment and its match to the requirements that work tasks pose onto employees might be conceived (a) as a matter of fit, where the optimum is a perfect match, (b) as a matter of more supply being simply better, or it might be (c) that the supply of working environments functions as a hygiene factor. That is, they may be a possible de-motivator, rather than something that motivates or creates positive feelings (Herzberg, 1968). A poorly fitting working environment related to the work tasks at hand would then be a distractor or frustrator, whereas a well-fitting work environment might become an “invisible” background factor.
This paper makes several contributions. First, we contribute to the literature on P–E fit by elaborating the concept of Task–Environment fit. T–E fit speaks to the daily matching process and is especially salient in flexible workspaces. Second, we answer calls for further research emphasizing the context of work (Johns, 2006) and especially how the physical workspace impacts employee outcomes (Ashkanasy et al., 2014). We investigate with a fine-grained methodology whether Task–Environment misfit in focus and collaboration is related to concentration problems or team functioning, respectively, two of the most important outcomes discussed in relation to activity-based work. Third, we contribute to the work environment and office space literature by examining activity-based working with a fit perspective. We believe the research on ABW will benefit from a greater connection to theory. Furthermore, few studies consider how current task requirements moderate effects of work environments (Wohlers et al., 2019) though this is a core idea in ABW. To the extent of our knowledge, we are the first to use a cubic response surface analysis, which enables testing an asymmetrical hypothesis, in the domain of Task–Environment fit. This has methodological advantages over both perceived fit, which has been criticized as a weak conceptualization of fit (Edwards et al., 2006; van Vianen, 2018) and difference scores (Edwards & Parry, 2018) in which the component with the larger variance will influence the difference score more, confounding the relative contribution of the components, and treating positive and negative values the same (Cronbach, 1958; Edwards, 1994).
Creating Fit Through Activity-Based Working
Over decades, increased workplace flexibility has been a growing trend for white-collar workers (Appel-Meulenbroek, 2016; Mache et al., 2020). Activity-based working environments describe office types that put variability of work activity at the centre of the design, and are typically intended to be non-territorial (Elsbach, 2003), that is, the workspaces are shared amongst employees. Activity-based working environments provide employees with spatial flexibility and a variety of enclosed, open, and semi-open workspaces with varying degrees of formality or casualness and with the capacity to host a varying number of people (Appel-Meulenbroek et al., 2011; Candido et al., 2019). These offices have become the norm in many European and North American organizations (Sivunen & Putnam, 2020).
Different work tasks pose different demands on employees, and the various spaces in the activity-based environment are intended to support employees in meeting these requirements. Whereas routine tasks pose a low cognitive load on employees and may even benefit from being performed in a more open environment as more stimulation may be welcomed and make certain arousal levels are not too low (e.g., employees become bored; Lavie et al., 2004). More complex tasks pose higher cognitive demands, and thus, it is more important for the employee not to be interrupted or distracted by a variety of stimuli like noise and movement during such tasks. Collaborative tasks benefit from face-to-face interaction as this is a high-bandwidth mode of communication, much richer than, for example, passing emails back and forth (Bernstein & Turban, 2018; Daft & Lengel, 1986). Hence activity-based working is based on the assumption that employees autonomously choose work environments that match the tasks at hand to facilitate the work process, and in the long-run leads to increased employee productivity and well-being (Appel-Meulenbroek et al., 2011). Even though the idea behind activity-based working is compelling, findings related to the activity-based offices have been mixed (for reviews, see Brunia et al., 2016; Engelen et al., 2019; Wohlers & Hertel, 2017). Several studies have found ABW to be related to higher productivity and health (e.g., Candido et al 2019; Kim et al, 2016; Meijer, 2009), to higher autonomy (Bäcklander et al., 2019; Wohlers & Hertel, 2017) and improved communication or collaboration (e.g., Brunia et al., 2016; Danielsson & Bodin, 2008; ten Brummelhuis et al., 2012). On the other hand, several studies have found ABW to be related to lower productivity, health, and satisfaction (e.g., Appel-Meulenbroek et al., 2011; Berthelsen et al., 2018; Nijp et al., 2016). In the Engelen (2019) systematic review of 17 studies, 70% found a positive relationship of ABW and productivity in relation to other offices; associations with privacy were mainly negative compared to cell offices. Therefore, the primary employee outcomes of interest appear to be individual privacy and concentration, a more troublesome area for ABW, and social, collaborative work, which is a significant motive for implementing ABW (Wohlers & Hertel, 2017).
Concentration
Concentration—the ability to stay focused on a task, resist distractions, and shift attention in a controlled manner (Diamond, 2013)—is one of the most studied employee effects of workspaces, particularly in studies of activity-based offices (Engelen et al., 2019). Concentration is of high importance for performing all complex tasks, which typically have a higher cognitive load (Seddigh et al., 2015; Van Der Linden et al., 2005). Experiencing problems with concentration, for example, difficulties making decisions or staying focused is indicative of stress (Diamond, 2013; Stenfors, Marklund, et al., 2013) and may, if the problems persist, lead to burnout (Ekstedt & Fagerberg, 2005; Stenfors, Hanson, et al., 2013; Van Der Linden et al., 2005). A systematic review of 17 field studies by Engelen et al. (2019) found that 8 studies reported negative relationships between ABW and concentration, while 2 found mixed or no relationship and 2 found a positive relationship with concentration (Blok et al., 2012; van der Voordt, 2004). Seddigh et al (2014) found that employees with a high need for concentration reported lower stress levels in cell and flexible offices than in all kinds of landscapes. The provision of quiet workspaces seems a key aspect in determining how ABW affects concentration (Brunia et al., 2016; Haapakangas, Hallman, Mathiassen, & Jahncke, 2018; Haapakangas, Hongisto, Varjo, Lahtinen, 2018; Seddigh et al., 2014). A field study objectively measuring cognitive performance confirmed that performance was better in more quiet areas of ABW (Jahncke & Hallman, 2020).
Communication, Collaboration, and Cohesion
Effects of ABW on social aspects of work is somewhat more mixed. The review by Engelen et al. (2019) identified 12 studies reporting outcomes of communication, interaction, or collaboration, and most of these suggest a positive relationship between ABW and social work aspects, especially communication (Blok et al., 2016; De Been et al., 2015; ten Brummelhuis et al., 2012). There seems to be a tendency toward increasing interactions across departments or teams, while within-team interactions and communication decrease (De Been et al., 2015; Millward et al., 2007; Rolfö, 2018). This effect may partly be due to design, as one stated goal of ABW is to increase interactions across organizational “silos” (van Koetsveld & Kamperman, 2011). Social network analyses show that employee communication is highly contingent on physical proximity (Allen, 2007; Bernstein & Waber, 2019), and so it follows that it would be affected by enforcing more spatial fluidity. A post-occupancy study of a move to ABW found dissatisfaction with within-team communication due to a shortage of spaces dedicated to collaborative work (Rolfö, 2018).
Team communication relates to team performance (Eisenberg et al., 2019). For ABW, this means that the provision of collaborative spaces is likely as important as the provision of focus spaces, as the concern with disturbing others may otherwise hamper face-to-face communication (Parkin et al., 2011). In addition, collaborative work often requires jointly attending to some object (Siposova & Carpenter, 2019), relying on implicit coordination strategies (Shah & Breazeal, 2010), and possible re-arrangement of the physical workspace as office inhabitants appropriate the available spaces (Babapour et al., 2018). Thus, collaborative work would benefit from dedicated, suitable spaces and not, for example, just sitting at adjacent individual workstations (Irving et al., 2020). Further, meeting face to face is a much richer and “high bandwidth” communication experience than computer-mediated communication and benefits collaborative work (Andres, 2002; Daft & Lengel, 1986), especially when tasks are complex (Handke et al., 2020). Face to face interaction also builds interpersonal relationships more than computer-mediated communication does, resulting in greater team cohesion (Furumo & Pearson, 2006; MacDonnell et al., 2009).
Fit Theory, Task–Environment Fit, and Misfit
A theory that can be helpful in the further investigation of the activity-based office and the associated way of working is Person–Environment (P–E) fit theory.
P–E fit theory defines fit as the compatibility of various aspects of a person, for example, values, characteristics, needs, skills, desires, and an environment, usually an organization, job, or vocation (Cable & DeRue, 2002; Caplan, 1987; Edwards et al., 1998; Kristof-Brown et al., 2005). Various kinds of fit have been proposed, for example, person–vocation fit, in which the compatibility of a vocation is assessed in relation to a persons’ personality interests, such as realistic, investigative, artistic, social, enterprising, and conventional (RIASEC; Holland, 1985); person–organization fit in which people seek organizational characteristics that fit with their personality (Cable & Judge, 1996; Schneider, 1987); and person–job fit (French et al., 1982). Person–job fit has mainly focused on job attributes such as demands, job insecurity, promotion opportunities, role ambiguity, supervisor support and autonomy (van Vianen, 2018). Fit can be of a demands—ability kind, dealing with whether a person has the abilities which fit demands in the work role, or a need—supply kind, for example a person may need autonomy and the job may supply autonomy or not (Caplan, 1987).
Studies of P–E fit suggest that fit is related to occupational choice, selection decisions, job satisfaction, performance, organizational commitment, intentions to quit, and psychological and physical wellbeing (Edwards et al., 2006). For example, fit between job demands and employee abilities has been found to relate to lower stress (Edwards, 1996; Kristof-Brown et al., 2005; Schantz, 2018; Xie & Johns, 1995), higher job satisfaction (Erdogan & Bauer, 2005; Kristof-Brown et al., 2005; Livingstone et al., 1997), and job performance (Caldwell & O’Reilly, 1990; Kristof-Brown et al., 2005; Raja & Johns, 2010). The idea is that a fit between commensurate dimensions is favorable, and that deviations from this fit will cause strain, dissatisfaction, or disengagement and so an individual might be motivated to make an adjustive change, either changing something about themselves or about the situation (e.g., quitting their job; Caplan, 1987). For example, having higher work demands than abilities to meet demands will cause strain, but so will having abilities in high excess of demands, though in the form of boredom or frustration with low development opportunities (De Cooman et al., 2019).
In the activity-based office, as employees choose their workspaces based on the activity they have at hand (Appel-Meulenbroek et al., 2011; Hoendervanger et al., 2019), employees are implicitly working toward creating a Task–Environment (T–E) fit. To continuously during the day seek out workspaces that facilitate the completion of the task at hand is a kind of proactive adaptation or regulatory behavior seeking fit (Johnson et al., 2013). For example, when writing a report, where employees might experience the need to work focused and without disturbances, they may position themselves in a so-called silent work zone. Hence, the work environment contributes to employees’ capability to meet task demands by facilitating that employees enter favorable psychological states, such as deep concentration, or by stacking probabilities for employee interaction—either making serendipitous meetings more likely or supporting active collaborations (Irving et al., 2020). Hence employees can create Task–Environment fit by choosing workspaces that provide them with conditions that they need to be better able to meet task demands at hand. Wohlers et al. (2019) conceptualize T–E fit in ABW as a matter of needs–supplies fit, where job requirements for focus or collaboration create a need in an employee and where the environment may supply the resources needed, in the form of suitable workspaces, to meet those needs.
In a special issue on fit theory, De Cooman et al. (2019) mention a recent “misfit turn” in organizational fit research, with interest turning toward the effects of misfit more specifically rather than fit. A misfit happens when there is a discrepancy between what is needed or desired and what is presently the case—and one could add, when such a discrepancy is salient to the focal person. In theory, you have a misfit whenever there is a discrepancy, in either direction, from a perfect match. Such a relationship is illustrated in Figure 1, solid line.
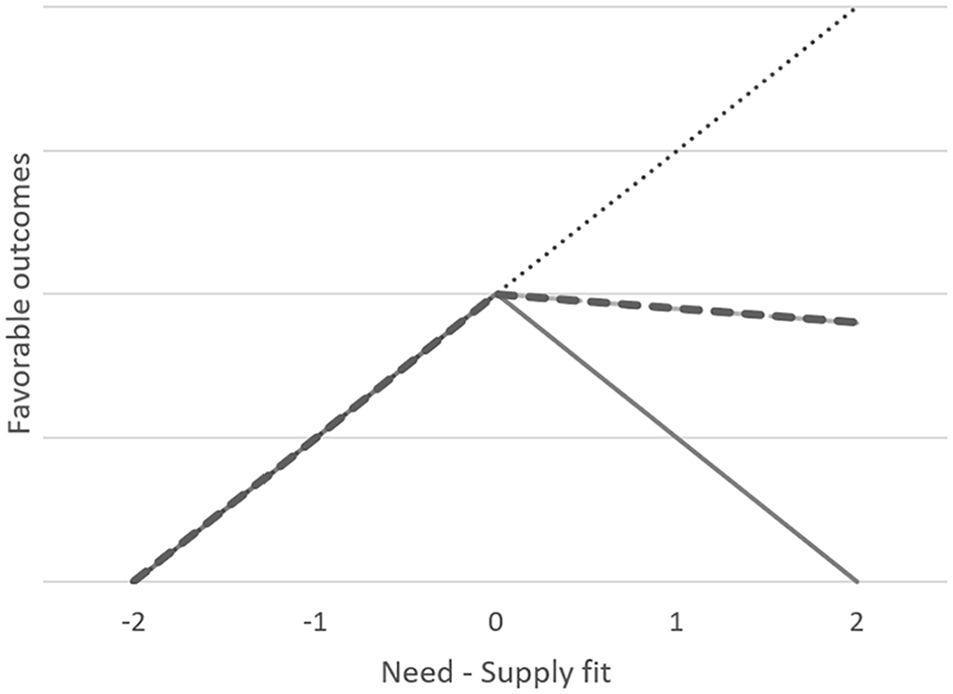
Conceptual illustration of different relationships between fit and outcomes.
Persons experiencing a misfit can adapt themselves to the organization or job, they may try to change the circumstances creating misfit in their jobs or try to change jobs. If few of these options seem open, they can try to ignore the misfit or hide it (impression management). Perceiving a misfit poses a threat to resources, and an inability to either reduce the misfit, manage, or replenish the resources, will result in stress which in turn decreases wellbeing and performance. Passive strategies for dealing with a misfit, such as ignoring it or impression management, provide a poor return on investment (of resources) as the problem remains—this creates a persistent resource drain that is more likely to turn into employee turnover (Wheeler et al., 2013). Enduring consequences of misfit will vary dependent on the content of the relationship in question, but may lead to strain (Edwards & Cooper, 1990; French et al., 1982; Yang et al., 2008), intentions to quit (Edwards et al., 2006), worse performance, and low levels of organizational citizenship behaviors (Vleugels et al., 2018).
A recent review of fit research using polynomial regression found that, in contrast to the assumptions of a strict congruence model, individuals tended to report optimal outcomes when there is a fit on attributes they rate highest (van Vianen, 2018), which can be called a “rising ridge” effect (Humberg et al., 2020). The review also showed that individuals tended to report the lowest outcomes when the environment offers less than they need or desire, not the other way around, suggesting an asymmetric effect (Figure 1, dashed line). This is also how fit is conceptualized in many studies, that is, as a matter of satisficing a need, not matching it perfectly. While having surplus resources may incur some cost of management (Edwards, 2008), it is generally more favorable than a deficiency. One might also have a monotonic relationship in which “more is better” regardless of the level of need (Figure 1, dotted line); demands and resources are often modeled that way in Job Demands–Resources theories (van Vianen, 2018, p. 85). To summarize, not all relationships are the same, and it matters that the model tested statistically, matches the model that is proposed theoretically—in words.
The analytical procedures used, however, have not been suitable to actually test for asymmetric effects (e.g., using quadratic instead of cubic RSA, Humberg et al., 2019), see for example Wohlers et al. (2019), Livingstone et al. (1997). The procedures for doing so and their availability are recent developments that we take advantage of here.
Hypotheses
Based on the arguments above, we set out to test a three-pronged (a–c) hypothesis for each of the outcome variables: (1) concentration troubles and (2) team functioning.
Concentration troubles:
1a. Employees whose task-related focus requirements fit with the supplied work environment experience fewer concentration problems. (Reflecting a congruence effect)
1b. A deficiency of focus environments in relation to task requirements will relate to more concentration troubles for employees with higher focus requirements. (Reflecting a linear, rising-ridge effect)
1c. Employees whose supply of work environments for focus falls short of their task-related focus requirements will have more concentration troubles than those with an excess supply. (Reflecting an asymmetric effect)
Team functioning:
2a. Employees whose task-related collaboration requirements fit with the supplied work environment experience better team functioning. (Reflecting a congruence effect)
2b. A deficiency of collaboration environments in relation to task requirements will relate to worse team functioning for employees with higher collaboration requirements. (Reflecting a linear, rising-ridge effect)
2c. Employees whose supply of work environments for collaboration falls short of their task-related collaboration requirements will have worse team functioning than those with an excess supply. (Reflecting an asymmetric effect)
Methods
Participants and Procedure
The sample was gathered from one large retail organization in Stockholm, Sweden, that relocated to a new, activity-based flex office 12 months prior to this data collection, as part of a project on evaluating implementation of activity-based working. The study was reviewed and approved by an ethics board ahead of time. All employees (n = 1,549) received an invitation to participate to their job email with information about the survey as well as a link to the online survey. Invitees were informed that their participation was not mandatory, and consent could be withdrawn at any time even if they did choose to participate. In total, 584 employees responded (37.7% response rate) and 501 employees had valid data on the study measures, rendering an effective sample of 32.3%. The participants’ age ranged from 24 to 65 years, with a mean of 44 years (SD = 8.97; compared to all employees M = 42 years). The majority was female (61.3%; compared to all employees M = 56%) and had 3 years or more of postsecondary education (66.3%). The vast majority (98.6%) held a permanent contract and worked full time (97%). Tenure ranged from 0 to 39 years (M = 6.8 years (SD = 7.2)). In total, 18% (n = 90) were managers.
Measures
To measure task–environment fit, 14 items from Wohlers et al. (2019) were used. Three items measured focus task requirements (α = .52). A sample items is “My work tasks require me to be able to work without distractions and disturbances.” Two items measured collaboration task requirements (ρ = .66). A sample items is “My work tasks require me to be able to have intensive discussions with colleagues.” The supply of focus supporting work environments was measured with three items (α = .81). A sample items is “My organization offers work environments where I can work without distractions and disturbances.” The supply of collaboration supporting work environments was measured with six items (α = .85). A sample items is “My organization offers work environments where I can have intensive discussions with colleagues.”
Concentration troubles was measured with three items from the COPSOQ-II (Kristensen et al., 2005) subscale for cognitive stress (α = .86). An example item is “In the past 2 months, I have had problems concentrating.”
Team functioning was measured with three items based on Taylor and Bowers (1972) (α = .88). An example item is “In my work group, we communicate effectively.”
Analyses
All analyses were run in R, using the RSA (Schönbrodt & Humberg, 2020), the interactions (Long, 2019) and the lavaan packages (Rosseel, 2012). First, confirmatory factor analyses (CFA) were conducted using ML estimation to examine the distinctiveness of our measures. A full measurement model was compared to five alternative models using Satorra-Bentler (SB) scaled χ2 difference test (Satorra & Bentler, 2001). A variety of fit statistics were used to evaluate the goodness of fit of tested models. Values >0.90 were considered acceptable fit for CFI and TLI (Bentler, 1990; Hu & Bentler, 1999) and values <0.08 for RMSEA and SRMR (Hu & Bentler, 1999; Steiger, 1990). For AIC, being as comparative fit index, lower values indicate a better fit (Akaike, 1987; Kenny, 2020). For χ2 difference test the model with the significantly lower chi-square value is the better fitting model (Kenny, 2020).
Testing the hypotheses
Next, to test the hypotheses polynominal regression analysis was conducted followed by response surface analysis (Edwards, 1994; Humberg et al., 2020).
The main polynomial regression was run to reflect a rising ridge, congruence, asymmetric (RRCA) hypothesis. A quadratic polynomial can only assess a simple congruence hypothesis as the function is always a parabola, symmetrical. To assess a complex hypothesis of asymmetry, where an x > y misfit will be related to a higher z than an x < y misfit, a more complex polynomial regression is necessary (Humberg et al., 2020). A linear rising ridge further allows for main effects of predictors, in contrast to a “strict” model which would allow only for a congruence effect and no linear effect. The RRCA model is simply a special case of a full third-order polynomial model with certain parameter constraints that reflect the form of the hypotheses.
In practice, this meant that the dependent variable (e.g., concentration troubles) was regressed on nine cubic polynomial terms: task requirements (e.g., for focus; N), supply of (e.g., focus) work environments (S), requirements squared (N2), requirements times supply (N × S), supply squared (S2), requirements cubed (R3), requirements squared times supply (R2 × S), requirements times supply squared (R × S2), and supply cubed (S3). N and S was centered around the pooled grand mean before calculating second- and third-order terms (Humberg et al., 2020).
Due to the combination of cubic, quadratic, and interaction terms, interpreting polynomial regression is difficult. We followed the protocol laid out by Humberg et al. (2020) and the accompanying R code from the RSA package (Schönbrodt & Humberg, 2020). To further facilitate interpretation we plotted surfaces (Edwards & Parry, 1993; Shanock et al., 2010), also using the RSA package.
Response surface analyses plots visually the results of polynomial regressions. The x-axis represents the level of task requirements for focus (or collaboration; i.e., the “need” side), the y-axis represents the supply of focus (or collaborative) work environments (i.e., the “supply” side) and z is the outcome variable, either concentration troubles or constructive team problem solving. Each dot in the plot is a study participant. The black encircling line, called a bag plot, holds half the participants while the other half is outside this line.
Testing a rising ridge congruence asymmetric (RRCA) hypothesis entails examining a number of parameters in a sequence. First of all, the RRCA model is compared to the full third-order model, a model with no restrictions. Interpreting the unrestricted full model is not recommended by Humberg et al. (2020) and so, if the tested model (in this case, RRCA) is not significantly worse than this model, you proceed with the tested model.
Examining the regression coefficients
Second, the regression coefficients are examined. First, the parameter b3 is tested against zero to test the suggested congruence (i.e., fit) effect. If it is significantly negative, the surface is highest on the line of congruence (LOC; the diagonal, where x = y, or need = supply); if it is significantly positive, the surface is lowest on the LOC. If this is not significantly different from zero, a congruence effect is not supported.
Second, the parameter b6 is tested against zero to test the suggested asymmetry effect, that is, that the direction of misfit matters. If significantly different from zero, this supports an asymmetry effect where the surface falls faster in the direction of the proposed incongruence.
Third, if the parameter u1 = b1 + b2 is significant, this indicates a linear, rising ridge effect, that is, that having higher needs met is better than lower needs met. Finally, there is a check of how many data points lie behind the second extremum line (E2) and have a significantly higher outcome prediction than points on the line—such points would contradict a hypothesis of congruence, that is, that the further away from fit, the worse the outcome (Humberg et al., 2020).
Results
Preliminary Analyses
Our full measurement model provided a generally good fit and one significantly better than the alternative models (SB − χ2 = 552, df = 155, p < .001; RMSEA = 0.071, SRMR = 0.053, CFI = 0.911, TLI = 0.891), see Table 1 for comparison details. Means, standard deviations, intercorrelations, and Cronbach’s alpha of the variables are reported in Table 2.
Model Fit Measures.
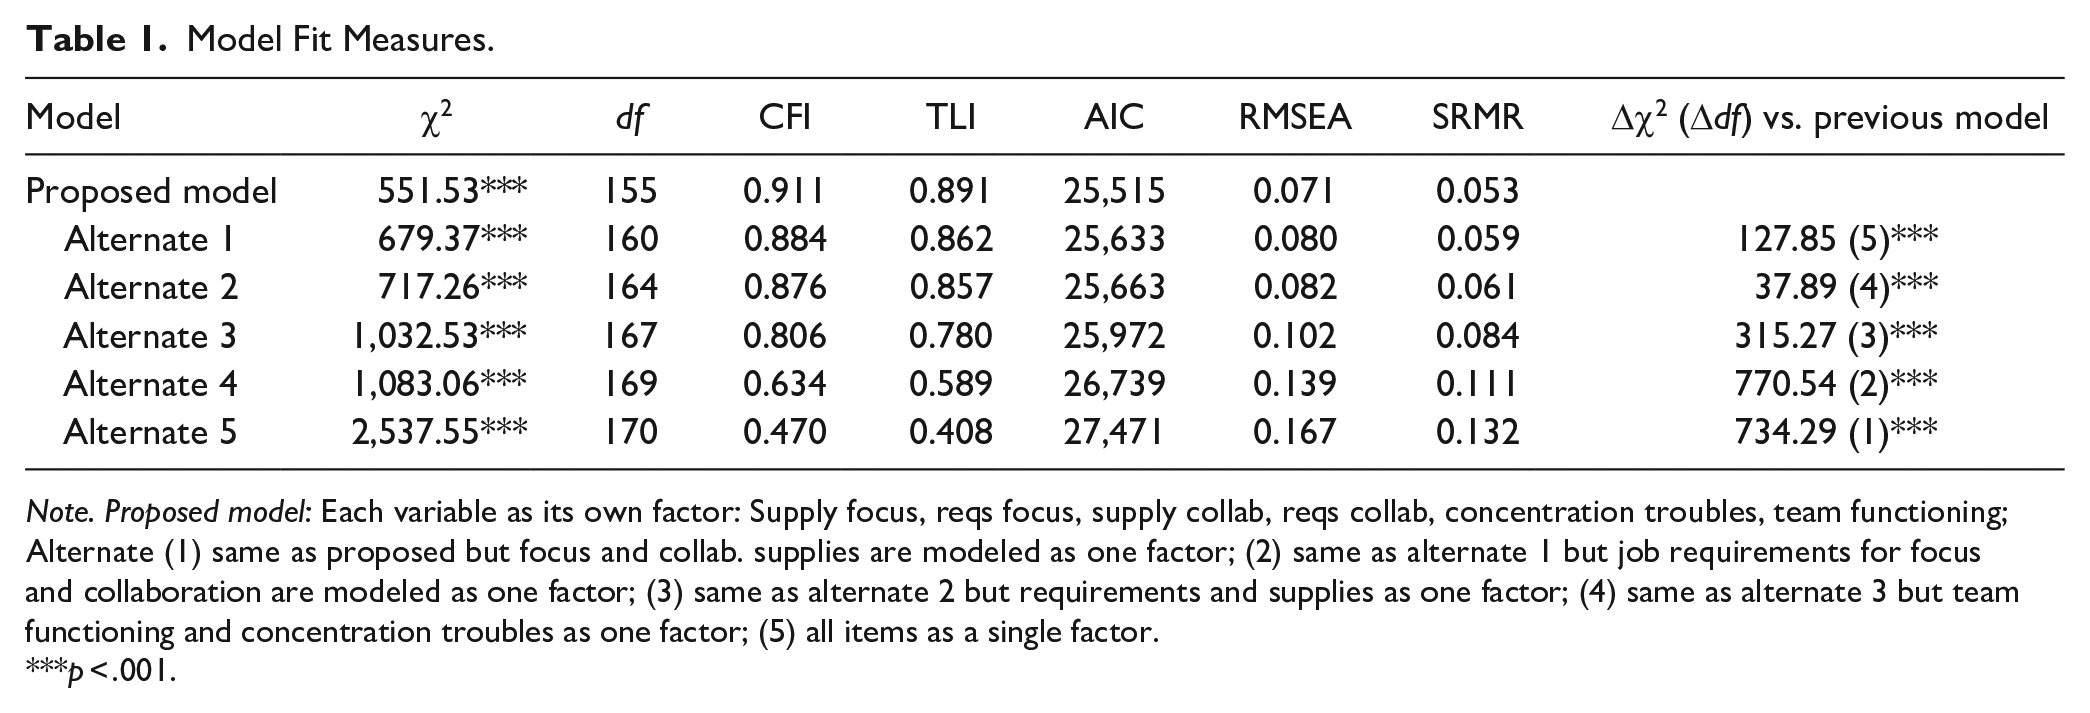
Note. Proposed model: Each variable as its own factor: Supply focus, reqs focus, supply collab, reqs collab, concentration troubles, team functioning; Alternate (1) same as proposed but focus and collab. supplies are modeled as one factor; (2) same as alternate 1 but job requirements for focus and collaboration are modeled as one factor; (3) same as alternate 2 but requirements and supplies as one factor; (4) same as alternate 3 but team functioning and concentration troubles as one factor; (5) all items as a single factor.
p < .001.
Means, Standard Deviations, Correlations, and Reliability Coefficients.
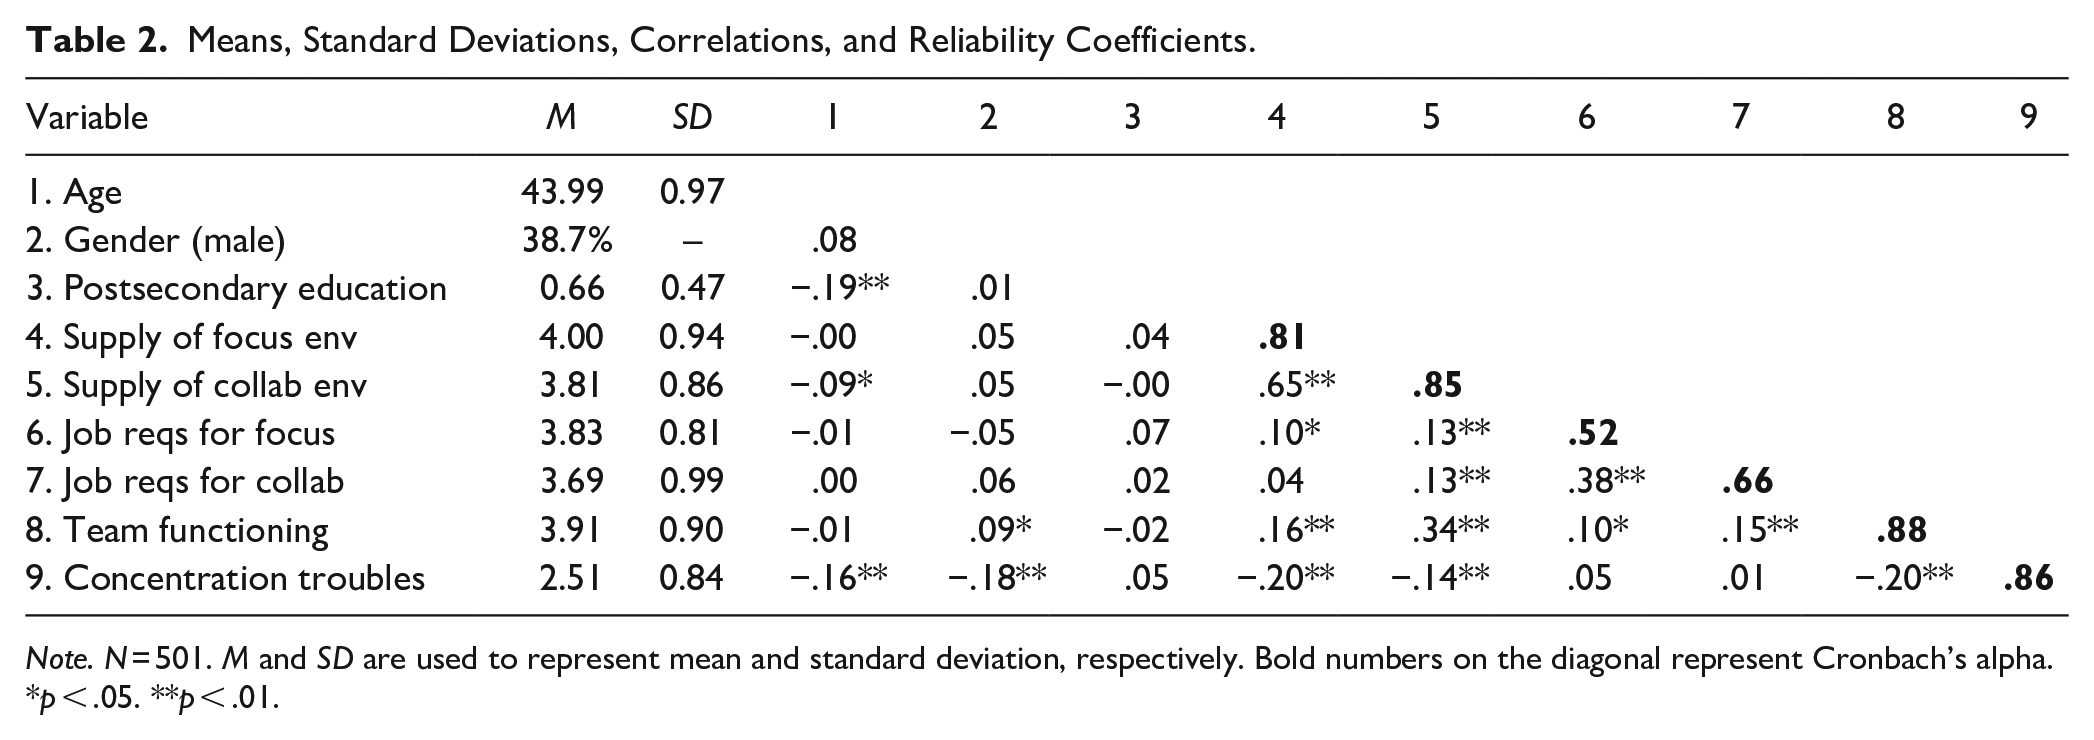
Note. N = 501. M and SD are used to represent mean and standard deviation, respectively. Bold numbers on the diagonal represent Cronbach’s alpha.
p < .05. **p < .01.
For our sample, it was the case that focus requirements (x) were less than the supply of focus environments (y) for 40% of the sample, was congruent for 35%, and requirements exceeded the present supply for 25% of the sample. This means that 75% of the sample had a supply of focus environments that matched or exceeded their job’s requirements. For collaboration, the requirements were lower than the supply for 40% of the sample, was congruent for 33%, and requirements exceeded supply for 27% of the sample which means that 73% of the sample had a supply of collaborative environments that matched or exceeded their job’s requirements.
Hypotheses Tests
Hypotheses 1 and 2 are complex congruence hypotheses that cannot be tested with quadratic models, and so we followed the testing protocol laid out by Humberg et al. (2020) for testing a rising-ridge congruence asymmetric (RRCA) model. We will address concentration troubles (hypotheses 1a–c) and team functioning (hypotheses 2a–c) separately.
Concentration troubles, complex model
First, a RRCA model was calculated and compared with a full cubic model, as suggested by Humberg et al. (2020). Since it is not recommended that the full polynomial model is interpreted, the very first test is whether the RRCA is significantly worse fitting than the full polynomial, which was the case for concentration troubles (R2 = .034, p < .001 compared to R2 = .070, p < .001). Further examination of the RRCA model also confirmed that the estimated parameters are not concordant with the restrictions of a rising-ridge congruence asymmetric model. H1a (“Employees whose task-related focus requirements fit with the supplied work environment experience fewer concentration problems (reflecting a congruence effect)”) was not supported, and further hypotheses 1b and 1c were examined with a simpler model.
Team functioning, complex model
For team functioning, the RRCA was not significantly worse than the full polynomial model. Examining the estimated parameters, we found that the coefficient b3, that reflects a congruence effect, was not significantly different from 0, and there was 4.2% of data points behind the E2 line with significantly higher outcome predictions than would be expected if there was a congruence effect. Hypothesis 2a (“Employees whose task-related collaboration requirements fit with the supplied work environment experience better team functioning (a congruence effect)”) is therefore not supported. The coefficient of the linear effect, u1, was significantly positive (see Table 3), suggesting a linear effect, in support of hypothesis 2b (“A deficiency of collaboration environments in relation to task requirements will relate to worse team functioning for employees with higher collaboration requirements. (a linear, rising-ridge effect)”). The coefficient b6 which reflects the asymmetry effect was significantly negative (b6 = −0.019, p < .01). A negative coefficient means that the surface falls faster in the direction of incongruence where supply < requirements than in the direction of supply > requirements. This supports hypothesis 2c (“Employees whose supply of work environments for collaboration falls short of their task-related collaboration requirements will have worse team functioning than those with an excess supply (reflecting an asymmetric effect)”).
Response Surface Results for Sample.
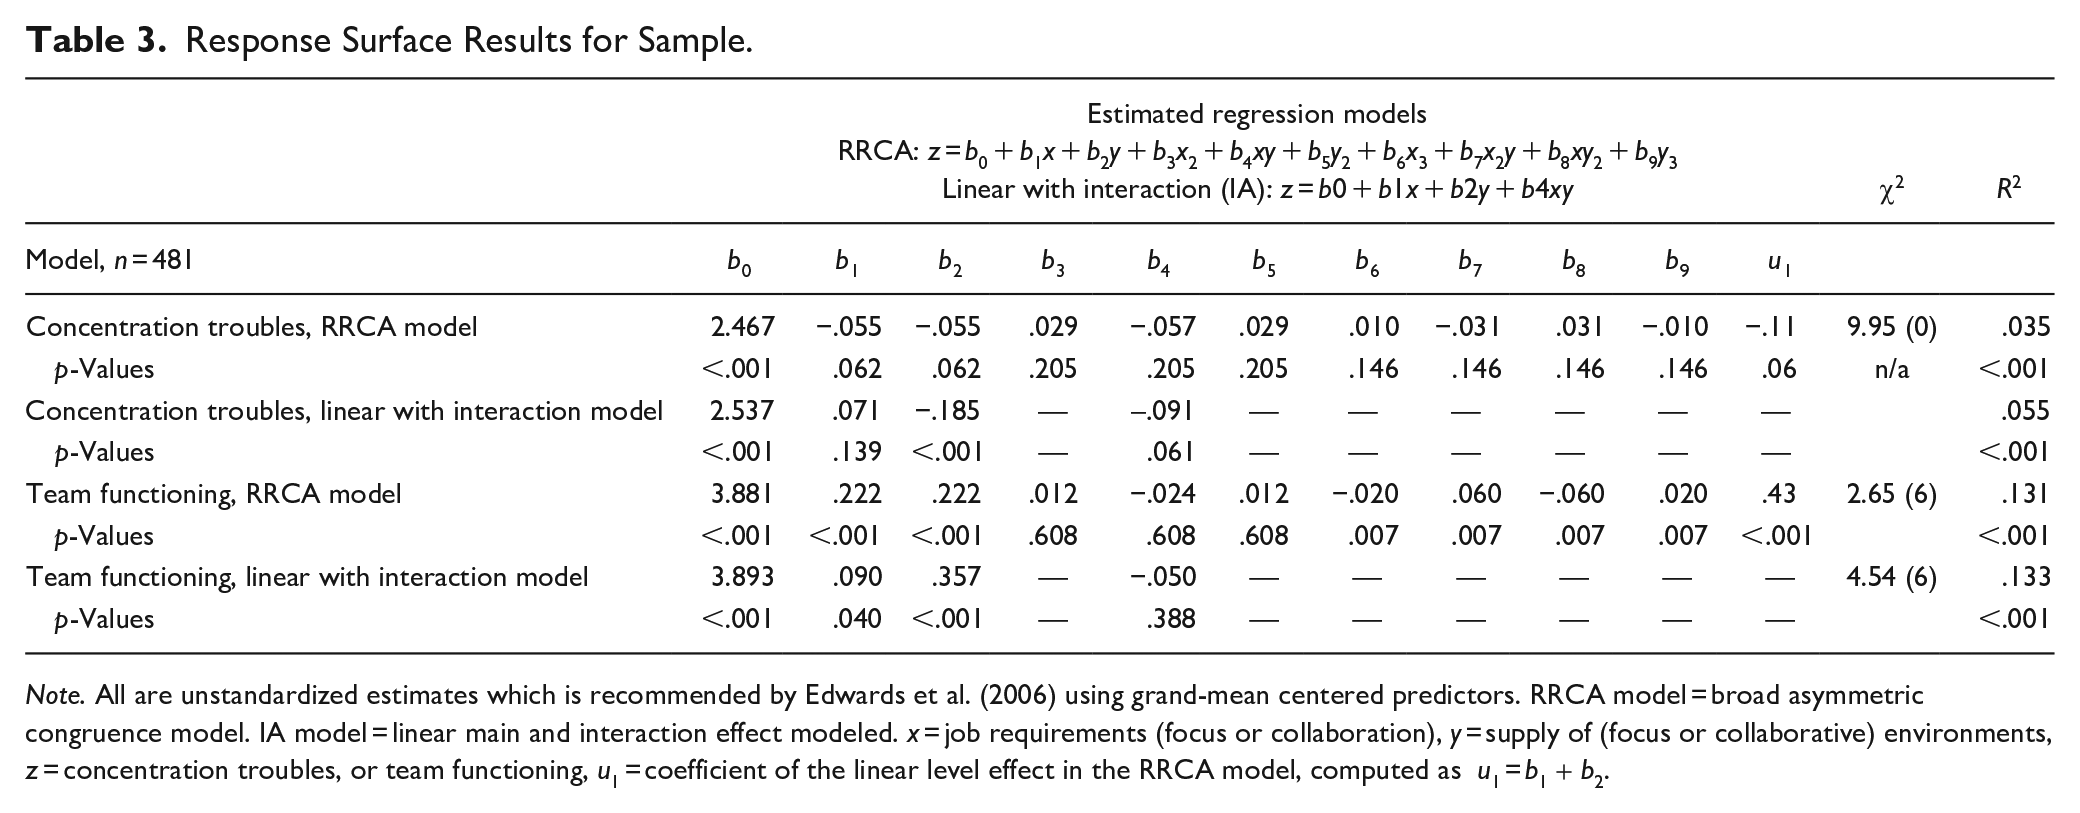
Note. All are unstandardized estimates which is recommended by Edwards et al. (2006) using grand-mean centered predictors. RRCA model = broad asymmetric congruence model. IA model = linear main and interaction effect modeled. x = job requirements (focus or collaboration), y = supply of (focus or collaborative) environments, z = concentration troubles, or team functioning, u1 = coefficient of the linear level effect in the RRCA model, computed as u1 = b1 + b2.
Simpler interaction model
Neither model met the full range of criteria for a rising-ridge congruence asymmetric model. When this is the case, it is suitable to instead model linear main effects of the predictors (Humberg et al., 2020; van Vianen, 2018). We fitted simpler, linear models with an interaction term, IA (z = b0 + b1x + b2y + b4xy), in the RSA package. For concentration troubles, the IA model had an R2 of .055, p < .001, compared to the RRCA model R2 of .035, see table 3. The response surface analysis showed that there was a linear additive effect on the Line of Congruence (LOC). The surface is plotted in Figure 2. For concentration troubles, there was a main effect of supply of focus environments (B = −0.19, p < .001) but no main effect of job requirements for focus. This lends support to hypothesis 1b (“A deficiency of focus environments in relation to task requirements will relate to more concentration troubles for employees with higher focus requirements (a linear, rising-ridge effect)”). The interaction term was not significant (B = −0.091, p = .061), which counters hypothesis 1c (“Employees whose supply of work environments for focus falls short of their task-related focus requirements will have more concentration troubles than those with an excess supply (reflecting an asymmetric effect)”). Looking closer specifically at “misfits” however suggest that a low supply of focus environments was most detrimental for those with high concentration requirements. In fact, there was no significant relationship between supply and concentration troubles for those with low (−1 SD) focus requirements, but a strong correlation for those with high (+1 SD) focus requirements (r = −38, p < .01).
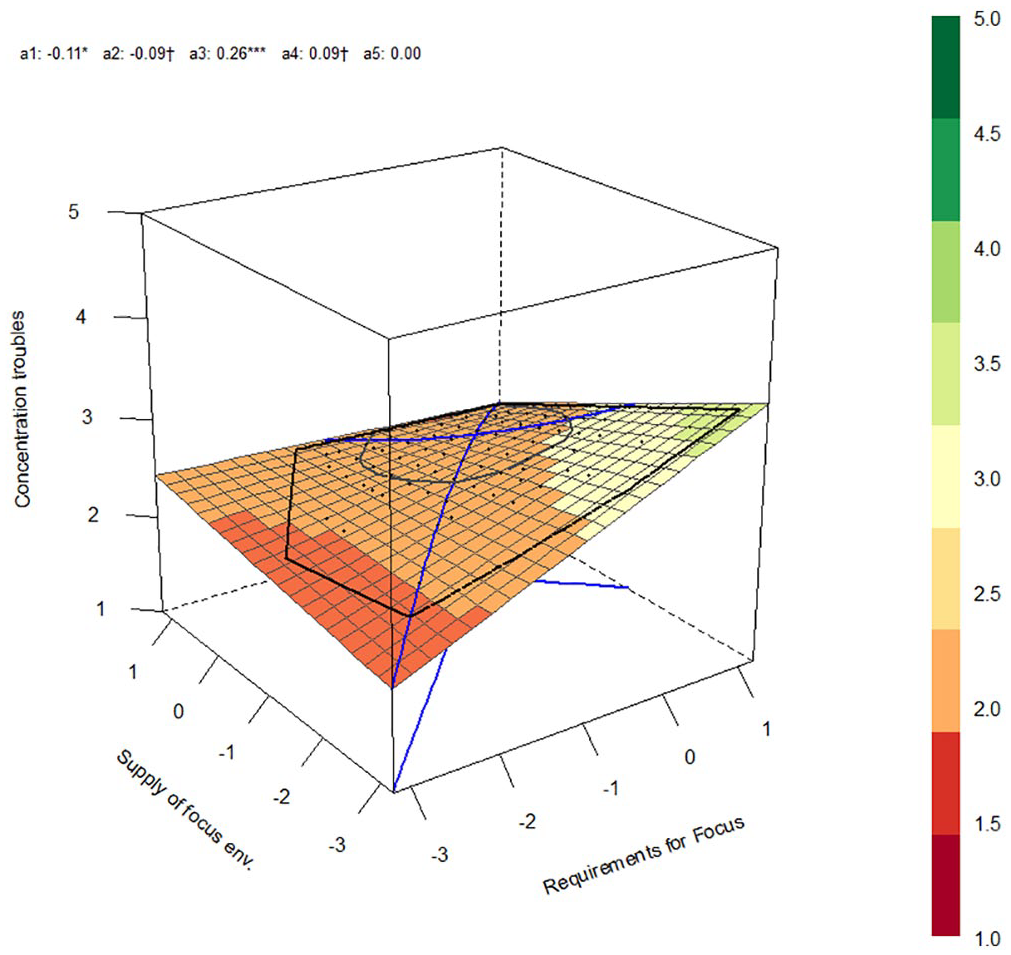
Response surface plot of the IA model for concentration troubles.
For team functioning, the IA model had an R2 of .133, p < .001, compared to the RRCA model R2 of .131, p < .001, see Table 3. The response surface analysis showed a linear additive effect on the LOC. The surface is plotted in Figure 3. For team functioning, there was a main effect of supply of collaborative environments (B = 0.357, p < .001) and a main effect of task-related collaboration requirements (B = 0.090, p < .05), but no interaction effect (p = .388).
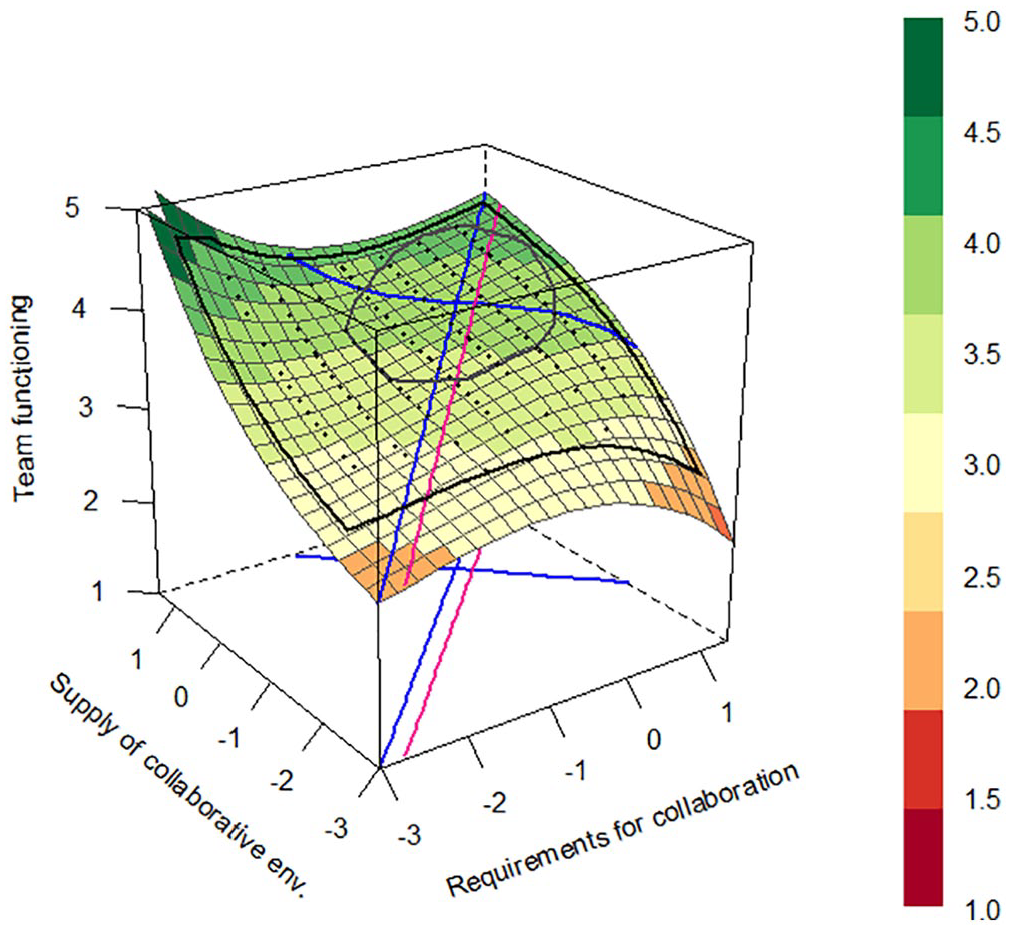
Response surface plot of the RRCA model for team functioning.
The simpler, linear models are visualized in Figures 4 and 5, highlighting the influence of supply of environments depending on level of task requirements.
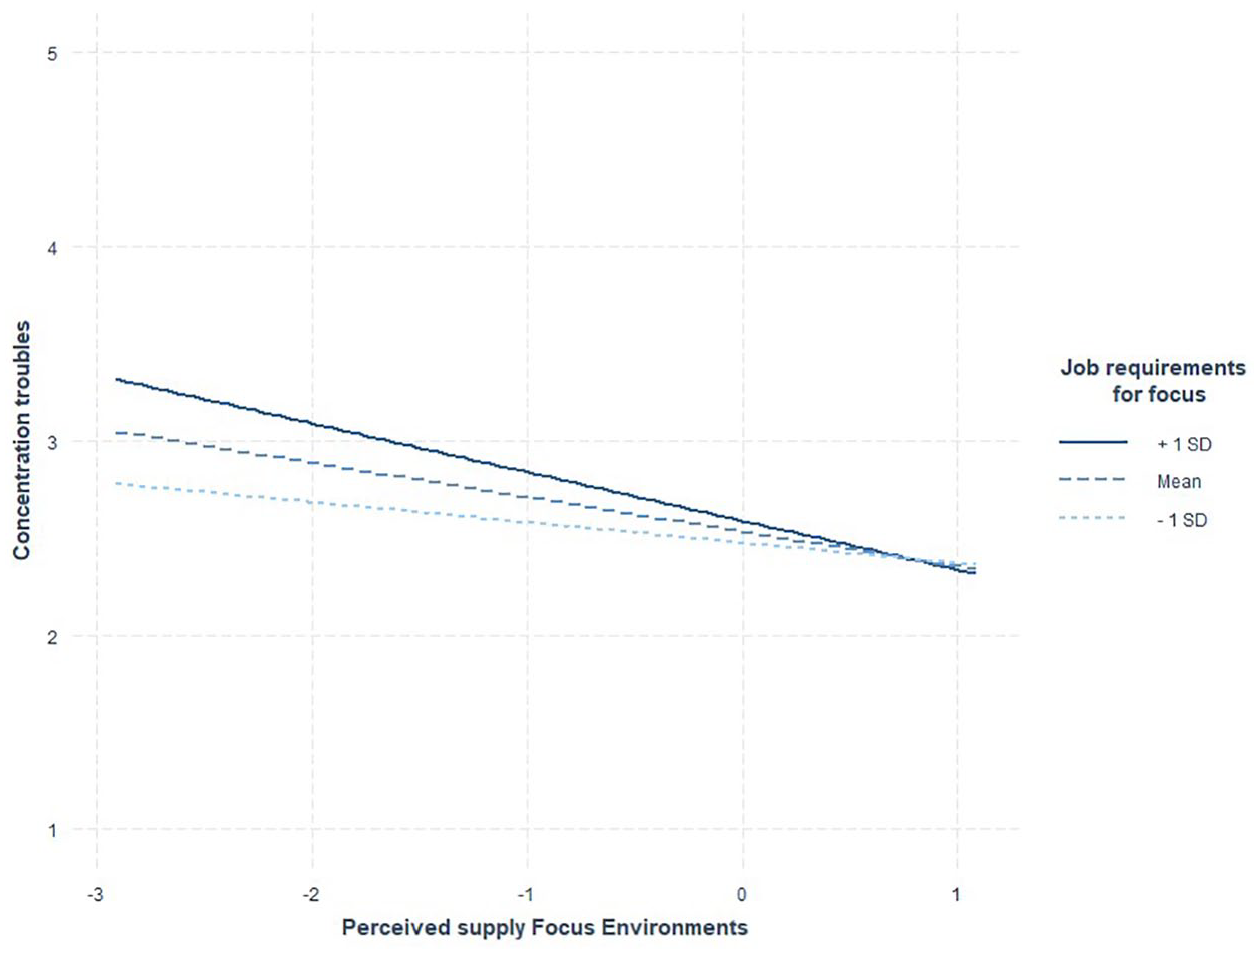
Moderating effect of requirements on the relationship of supply and concentration troubles.
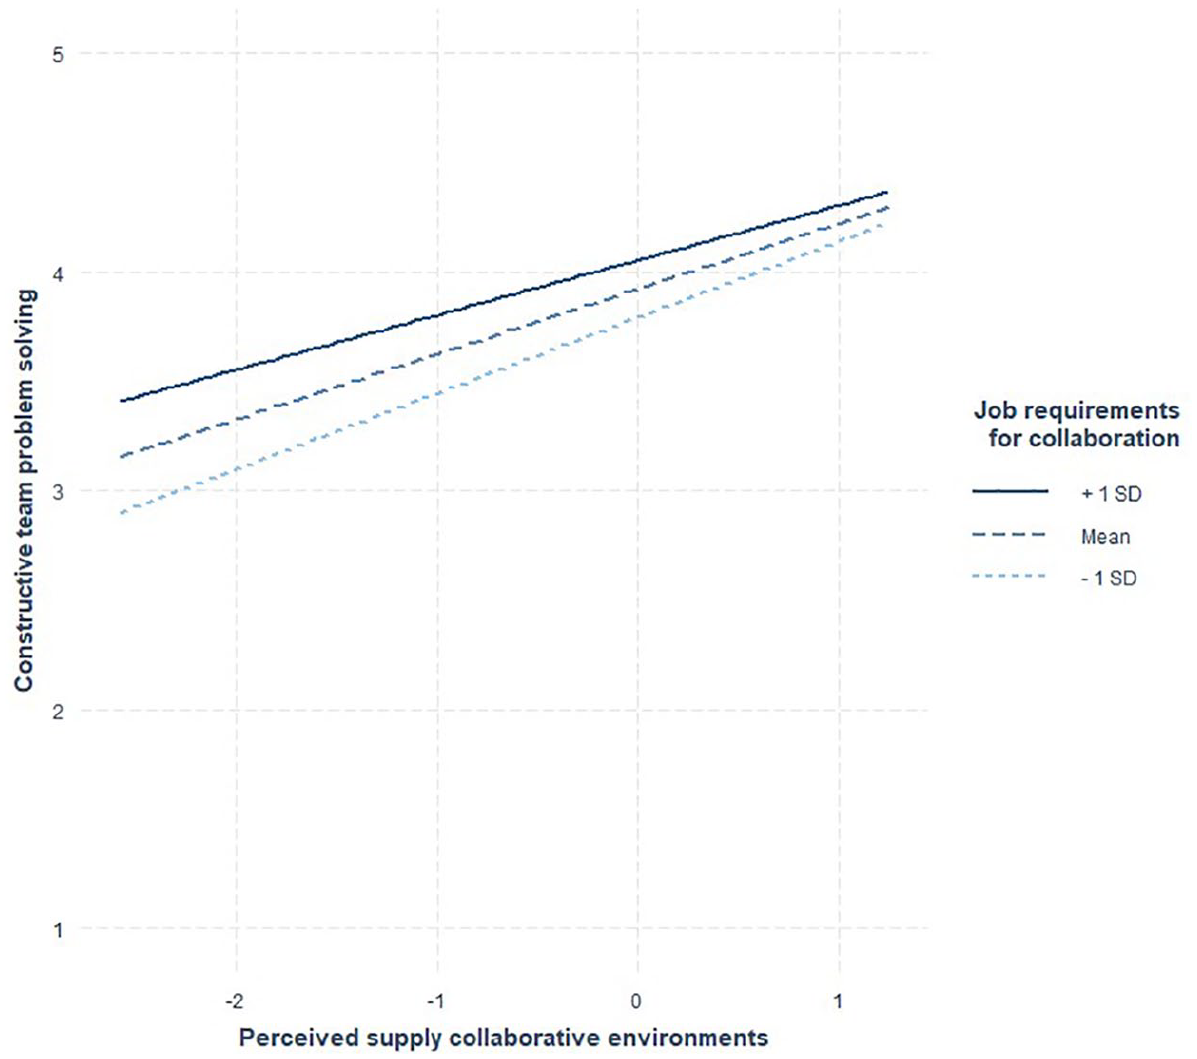
No moderating effect of requirements on the relationship of supply with team functioning.
To sum up, the hypothesis of perfect fit or congruence equaling the best outcomes was refuted for both concentration troubles and team functioning (rejecting hypotheses 1a, 2a). Instead, there were linear, main effects of the supply of conducive environments on outcomes (supporting hypotheses 1b and 2b). There was also a linear relationship between task-related collaboration requirements and team functioning. An asymmetric effect was detected for the relationship of needs–supply for team functioning, but not for concentration troubles (hypothesis 1c rejected, 2c supported); that is, it was better to have excess supply than a deficiency.
Discussion
The aim of this study was to examine the relationship of Task–Environment fit, a central mechanism of ABW, with employee performance and wellbeing. More specifically, we examined T–E fit between task requirements for focus, and collaboration, with organizational supply of workspaces that support focus, and collaboration, respectively, and related this to the outcomes of concentration troubles and team functioning. Our study is unique in that in we tested an asymmetric hypothesis, where a deficiency is predicted to be more harmful than excess supply, with a statistical method capable of actually examining this hypothesis; while asymmetric fit hypotheses are common in the P–E fit literature, matching statistical tests of them are not.
For team functioning but not concentration troubles, we found support for such an asymmetrical effect, indicating that a supply deficiency is considerably worse than having more than you need. For both outcomes, there were main, linear effects of supply of environment. Looking closer, the correlation of supply with concentration troubles was significantly negative for the high (+1 SD) focus requirements group while wholly insignificant for the low (−1 SD) focus requirements group. For team functioning, there was a main effect of both supply of collaboration environments, and of task requirements for collaboration. There was no support for a congruence effect for either outcome, that is, that a perfect fit would be optimal.
The main conclusion to draw from these results is that they align with an idea of fit as satisficing rather than “perfect fit” per se (Edwards et al., 1998; Harrison, 1978). Also, for both outcomes, the supply had a stronger relationship with the outcome than did the requirements. We conclude that “excess” supply of a type of environment would only be a problem if it infringes on another necessary environmental supply. While it is true that if one has very much of one kind, there will be less room for other kinds, it is also quite possible to have enough of each. In our studied organization, this generally seemed to be the case. The supply of focus and collaborative environments was rated as 4.0 and 3.81, respectively, on a 5-point scale, and for roughly 75% of respondents, the supply of environments matched or exceeded their task requirements, which may not be typical for organizations implementing ABW. Compare this with, for example, Hoendervanger et al. (2019), in which 58% of work tasks were “high-complexity tasks,” but the proportion of private office work settings was only 12%.
Our results are similar to others finding main effects between the supply of WEs and employee outcomes such as job attitudes and vitality (Wohlers et al., 2019), productivity and wellbeing (Haapakangas, Hallman, Mathiassen, & Jahncke, 2018), cognitive stress (Haapakangas, Hongisto, Varjo, & Lahtinen, 2018; Seddigh et al., 2014), and performance on cognitively demanding tasks (Jahncke & Hallman, 2020). Other studies have shown that Task–Environment fit is related to performance (Soriano et al., 2020), less distraction, and improved interactions across teams (Gerdenitsch et al., 2018), though, unlike our present study, these are not sensitive to the direction of the misfit in their analyses.
Theoretical Implications
The findings of our study reflect the findings of a recent review of the fit literature and the use of polynomial regression to study fit—namely that the explanatory power of fit (perfect congruence) is of limited use (van Vianen, 2018). Our results, looking at the provision of different workspaces, are in line with the main conclusions of that review, which is that fit is more valuable at high values (i.e., it is most valuable to have high needs met, than low needs met; a rising ridge) and that the direction of misfit matters—a deficit is more harmful than a surplus (asymmetric). In our review of the literature for this paper, we can also conclude that many authors write about fit but do not by this mean a strict congruence model (i.e., where the optimum is a perfect fit) but rather fit-as-satisficing, similar to how hunger and thirst are highly salient needs when not met, but can be satiated (Edwards et al., 1998; French, 1973). What many authors are really hypothesizing, in words, is an effect of a misfit in a specific direction (Edwards, 1996) while testing, in numbers, for strict congruence. Our study contributes to the study of fit theory by matching the test to the hypothesized model, though the complex hypothesized model did not gain full support.
We believe the field of study of ABW would benefit from a clearer theoretical grounding (Hoendervanger et al., 2019), which is what we attempt here by testing P–E fit theory. P–E fit is often mentioned in connection to ABW (Gerdenitsch et al., 2018; Haapakangas, Hongisto, Varjo, & Lahtinen, 2018; Hoendervanger et al., 2019; Wohlers et al., 2019; Wohlers & Hertel, 2017), and on the face of it is a central idea of ABW, as the premise of the concept is to choose different environments based on the demands of the work task (thus “activity-based”; van Koetsveld & Kamperman, 2011). However, based on our results, it seems a congruence model is not the best for describing the relationship between access to workspaces and task needs for collaboration or concentration. One possible explanation for this could depend on the timescale of measurements. At our examined level, it will be important to have enough of each kind of environment so that when a misfit occurs momentarily between the employees’ task requirements and the environment they are currently in, they can switch and thus create fit again. That is, in the exact moment, it may be possible to have too much of the environment one is currently in, but on a more general scale, the individual cannot really have too much because having plenty is what makes flexibility, choice, and fit-creation possible. See Bentley and Kehoe (2020) for a discussion on how slack resources contribute to organizational change capacity.
We propose three alternative ways forward to link ABW to theories of organizational psychology. First, if persisting with P–E fit theory, one should be more stringent about specifying what idea of fit is being hypothesized and not conflate strict congruence, fit-as-satisficing, and monotonic relationships, as is so often done in the literature. Further, one should pick operationalizations and statistical tests that can test the hypothesized relationship (i.e., not test asymmetrical effects with quadratic terms (Humberg et al., 2019)).
Second, though it has been proposed that it is preferable to measure fit between an x and y variable separately rather than construct difference scores or a subjective, perceived fit (Edwards & Parry, 1993), here we might have a case where perceived fit is preferable. Perceived fit typically does not distinguish between excess or deficiency misfits but rather is on a scale from poor fit to perfect fit. In many cases, however, it seems likely that what people answering are mainly considering as a poor fit is a deficiency misfit (Edwards et al., 2006), that is, these measures could capture one-sided misfit hypotheses because the measure is in practice one-sided.
A third way forward might be to not rely primarily on P–E fit theory but link ABW closer to Job Demands–Resources theory (Demerouti et al., 2001) and the related Conservation of Resources (COR) theory (Hobfoll, 1989). With these, one may view the supply of suitable working environments as a resource of which typically “more is better” (monotonic relationship) or where resources up to some level are beneficial but beyond that provide little or no benefit (asymptotic relationship; Edwards et al., 1998; van Vianen, 2018, p. 85). Several studies employing a JD-R or COR perspective show that people behave differently and have different outcomes from having excess versus insufficient resources. For example, Parker et al. (2013) demonstrate that when resources are threatened, individuals seek to protect them against loss. On the other hand, when resources are not threatened, individuals are willing to invest resources to accumulate further resources or expand skill utilization, in line with COR theory. Based on COR theory, one could hypothesize that having insufficient focus or team environments in ABW might cause people to protect these more once they are occupying them, not moving about as much as they might otherwise, thereby exacerbating the deficiency for colleagues even more. Increasing the supply would then enable people to let go of that environment more easily, as they can trust such environments to be available again when they need them, thereby freeing up even more environments and improving the “flow” of people to match activity and environment (as high utilization of resources invariably leads to queues (Thomke & Reinertsen, 2012)).
Practical Implications
Our results demonstrate that having a sufficient supply of both focus and collaborative environments is important. About 55% of work tasks are of a complexity that requires more concentration (Gensler, 2012; Hoendervanger et al., 2019), and for employees who have a considerable need for concentration, the relationship between supply and resulting concentration is significant, as demonstrated both in this study and others (Hoendervanger et al., 2019; Seddigh et al., 2014).
Having dedicated collaborative spaces is also important. Research suggests that simply being located in an open space does not necessarily support collaboration (Irving et al., 2020; Parkin et al., 2011). Instead, the open landscape environment may be most supportive of individual but low complexity tasks that benefit from increased stimulus levels. It may however also be beneficial to collaboration in that it allows for greater visibility and thereby spontaneous questions to collaborators—though that also translates to distractions for others. Team functioning (communication, problem-solving, and cohesion) was related to having access to environments that support social work, meetings, and intense discussions.
In conclusion, our study points to the importance of not making activity-based offices too small. Some slack is necessary to create the conditions in which employees can switch environments based on needs. Organizations need to stay observant about signs of misfit, for example, if many employees prefer to work from home simply because the provided workspaces are crowded and unsuitable. Doing analyses of work before an ABW implementation is good, but updating the office environments to the emergent needs is even more important as being in a new space may itself change how people want to and do work.
Limitations and Future Directions
The present study is not without limitations. As these statistical procedures are quite new, exact power calculations have not been established yet (Humberg et al., 2020). Because of the complex models tested, the variance explained may be on the smaller side: 4.7% in Humberg’s demonstration, which is similar to what we found here for focus (5.4%); for collaborative T–E fit, the variance explained was larger, 13.3%. We should also consider that effects of fit at a task level are a priori expected to be small (Johnson et al., 2013). While our sample size was considerably larger than what Humberg et al. (2020) used to illustrate (n = 501 compared to n = 147), it may still have been too small to reliably detect the smallest effect (for focus) with the most complex model (RRCA).
Further, the breadth of the measures is not great, as for example, collaboration task requirements have only two items left in the measure. Fewer items often mean lower reliability of the measure, and worse overall generalizability of the results, which affects this study as well. For future studies, it is recommended that the used measure, by Wohlers et al. (2019), is not shortened like we had to do here.
We rely on self-reported data to assess our constructs, which always risks introducing common-method bias (Podsakoff et al., 2003). However, we ask about individuals’ assessments of their task requirements and perceptions about the work environment, which are difficult to assess in other ways, and about subjective perceptions of wellbeing and teamwork, for which self-reports are appropriate (Chan, 2009).
We rely on cross-sectional data, mainly because we use a new statistical analysis to test the complex congruence hypotheses and introducing further complexities through longitudinal or multilevel data would have been premature (Spector, 2019, p. 133). However, we believe Task–Environment fit is suitable to examine over time and at a short time scale, for example using a diary method. Employees work on several tasks in a day or a week, and thus, examining employee choice of environment to match tasks at that timescale is reasonable, perhaps seeing fit as an outcome rather than as the predictors. We encourage further research on “fit creating behaviors” of various kinds as these will only become more important as there is an increased reliance on employee discretionary behaviors in fluid work (e.g., activity-based work, remote work).
Finally, we have studied only one organization and one office. This holds constant factors that may vary between organizations while limiting the ecological generalizability of the results. It is interesting that there nevertheless is variability in the “supply” variable, indicating that it is not only the objective physical environment being captured. Social factors such as how many other people are around, what they are doing, norms for speaking or being quiet all likely play into what will constitute a space for focus or collaboration. Individual resourcefulness, seeing how a space might be used, and familiarity and experience with the different environments, may also factor into it. It should be noted again that about 75% of respondents rated the supply of the two kinds of environments as matching or exceeding the need posed by tasks which may not be typical for ABW implementations.
Footnotes
Declaration of Conflicting Interests
The author(s) declared no potential conflicts of interest with respect to the research, authorship, and/or publication of this article.
Funding
The author(s) disclosed receipt of the following financial support for the research, authorship, and/or publication of this article: This research was funded by KK-stiftelsen, grant no 20170116. Open access publication made possible through a national agreement between Frontiers and the National Library of Sweden (NLS), on behalf of the organizations participating in the Bibsam Consortium.