
Abstract
Due to the decline in functional capability, older adults are more likely to encounter excessively demanding environmental conditions (that result in stress and/or mobility limitation) than the average person. Current efforts to detect such environmental conditions are inefficient and are not person-centered. This study presents a more efficient and person-centered approach that involves using wearable sensors to collect continuous bodily responses (i.e., electroencephalography, photoplethysmography, electrodermal activity, and gait) and location data from older adults to detect demanding environmental conditions. Computationally, this study developed a Random Forest algorithm—considering the informativeness of the bodily response—and a hot spot analysis-based approach to identify environmental locations with high demand. The approach was tested on data collected from 10 older adults during an outdoor environmental walk. The findings demonstrate that the proposed approach can detect demanding environmental conditions that are likely to result in stress and/or limited mobility for older adults.
Statistics and projections have shown that the world’s population is aging unprecedentedly; this has aroused great concern worldwide. One major concern is the functional decline (i.e., loss of physical and mental abilities) that accompanies aging (Kalache & Kickbusch, 1997; World Health Organization [WHO], 2007). The traditional urban planning and design that targets the average person may not meet the unique characteristics and needs of the older adults experiencing an age-related functional decline (Cvitkovich & Wister, 2001). This is supported by extant studies that have reported that the desire to reduce encounters with demanding environmental features and conditions has led to a drastic reduction in the mobility of older adults in the outdoor environment (Portegijs et al., 2017; Shumway-Cook et al., 2003; van Heezik et al., 2020). The reduction in the frequency and time older adults spend in the outdoor environment often leads to further deterioration in physical capacity, mental health, and social interactions (Hadavi, 2017; Satariano et al., 2012; Sugiyama et al., 2009).
Identifying environmental conditions that may restrict a person’s access and use of the outdoor environment is a primary step to promote a walkable environment (Duchowny et al., 2019; Joseph & Zimring, 2007; H. Kim et al., 2016). Several assessment approaches have been implemented to identify environmental barriers. The common practices involve people self-reporting their satisfaction with the environmental conditions using instruments such as verbal feedback, questionnaires, photovoice, or visual audit completed by trained auditors (Burton et al., 2011; Inclusive Design for Getting Outdoors, 2010; Michael et al., 2009). However, these assessments are often influenced by people’s recent experiences, momentary emotions, intimacy with the environment, memory lapses, and recall biases. It is important to mention that evaluation approaches such as walking interviews and ecological momentary analysis that do not suffer from these limitations have been used. Although these approaches have contributed to identifying demanding environmental features and conditions, they are manually planned and require older adults’ active participation. Because these approaches are manually planned, they are labor-intensive, laborious, and time-consuming, limiting the scope and frequency of assessing the environment. Active participation of older adults may interrupt their daily lives and routines given the increasing number of demanding environmental conditions due to the aging of the built environment. Recently, passively generated urban data such as infrastructure and global positioning system (GPS) have been used to provide automated and continuous assessment of the built environment (S. M. Lee et al., 2017; Rundle et al., 2016; Talen & Shah, 2007). Although passively generated data are less interruptive and can facilitate extensive evaluation, they cannot adequately capture how the human body responds to the environment. Human-environment interaction is complex and dynamic; the impact of an environmental condition varies from person to person.
Another emerging method is the use of pedestrians’ bodily responses to the environment to detect environmental barriers—a concept called “people-centric sensing” (Chrisinger & King, 2018; Duchowny et al., 2019; H. Kim et al., 2016). Bodily responses are the physiological, behavioral, and cognitive reactions that humans naturally and unconsciously exhibit while interacting with a surrounding stimulus. According to recent studies, such bodily responses contain relevant information that can be used to investigate the walkability of the environment (Birenboim et al., 2019; Duchowny et al., 2019; H. Kim et al., 2016; Triguero-Mas et al., 2017). For instance, pedestrians will adapt to demanding environmental conditions by adjusting their walking behavior (gait), and these changes in gait can provide information about the condition of the environment. People-centric sensing enables an objective assessment of the built environment because individuals are not required to report their current state.
The people-centric sensing approach has been proven to be more appropriate in detecting demanding environmental conditions and improving walkability (J. Kim et al., 2020; G. Lee et al., 2020). However, because people-centric sensing depends on bodily responses, its effectiveness can be easily affected by the informativeness of the adopted bodily response. To improve the effectiveness of people-centric sensing, this study proposes a computational approach that determines bodily responses that contain relevant information about people’s interaction with surrounding environmental stimuli.
Theoretical Mechanism: Human-Environment Interaction
Active aging is a concept deployed by the WHO to evoke the idea of creating an environment that supports and enables older adults to continue participating in social and physical activity in order to enhance their quality of life as they age (WHO, 2018). Older adult’s mobility, defined as an individual’s capability to move about effectively and achieve access to their desired places (i.e., physical environments such as neighborhood facilities) and people (i.e., social, cultural, and civil engagements), is a major prerequisite for active aging (Freiberger et al., 2020; Rantanen, 2013; Satariano et al., 2012; Webber et al., 2010). However, the complexity of outdoor mobility (or out-of-home mobility), the constantly changing environmental conditions, and barriers limit or prevent older adults’ from realizing their outdoor-oriented needs (Clarke, 2014; Duchowny et al., 2019; Mollenkopf et al., 2006).
Several theoretical frameworks have conceptualized that outdoor mobility is determined by the complex interactions between individual capabilities and environmental demand (Lawton, 1982; Verbrugge, 2020; Webber et al., 2010; WHO, 2001). Environmental demand is the combined impact of environmental elements to produce expectations for certain human actions and reactions (Hagedorn, 2001; Torku et al., 2021). Outdoor mobility is realized when an individual’s capability meets the environmental demand. On the other hand, when environmental demand exceeds an individual’s capability, the individual feels stress and/or their outdoor mobility is limited (Lawton, 1982; G. Lee et al., 2020; Mair et al., 2011; Mollenkopf et al., 2006; Webber et al., 2010). Stress is also a type of person-environment interaction which occurs when demand taxes or exceeds the individual’s capability (Lazarus, 1990). Due to the increased risk of a decline in functional capability in old age (Kalache & Kickbusch, 1997; WHO, 2007), the growing population of older adults is more likely to encounter environmental conditions that stress (increasing cognitive and physical workload) and inhibit their outdoor mobility. Hence the need to understand how older adults interact with the urban environment as evinced in their management of stress.
From the environmental psychology perspective, the theory of positive emotions (Fredrickson, 2004), particularly the restorative theory (Kaplan & Kaplan, 1989), asserts that natural environmental conditions facilitate recovery from stress and fatigue through attention restoration mechanisms. Soft fascinating or interesting environmental features (typically present in natural settings) are perceived as intriguing environmental stimuli that promote cognitive recovery from fatigue because they capture attention involuntarily (without depleting direct attention resources). Contrarily, hard fascinating or uninteresting features (typically present in urban settings) are perceived as demanding environmental stimuli that deplete both direct and involuntary attention, increasing cognitive load and fatigue (Aspinall et al., 2015; Cassarino & Setti, 2016; Kaplan & Kaplan, 1989; Ulrich et al., 1991).
A reliable approach to detecting cognitive, emotional, and psychological stress is through sensing and mining the patterns in people’s bodily responses (i.e., physiological, behavioral, and cognitive reactions to the environment; Bower, 2019; Lazarus & Lazarus, 1991). The physiological reactions are involuntary actions or responses that are almost impossible to notice by external observation because they relate to how a living organism or bodily part functions. Behavioral reactions are somewhat voluntary actions that can be externally observed. The cognitive reactions relate to the activities of the brain or mental state (Alberdi et al., 2016).
Photoplethysmography (PPG) and electrodermal activity (EDA) are the most used physiological reactions in affective computing and good indicators of physiological arousal and stress activation (Posada-Quintero & Chon, 2020; Shaffer & Ginsberg, 2017). PPG measures the blood volume pulse (BVP), and it indicates the quantity of blood flowing into the peripheral vessel, which is influenced by the automatic nervous system (Heo et al., 2021). EDA measures sweat gland activation, which is increased through the activation of the sympathetic nervous system (Posada-Quintero & Chon, 2020). Electroencephalography (EEG) is one of the most common sources of information for studying brain function. EEG measures the voltage changes in the brain’s electrical field produced by the flow of ions in the neurons of the brain. This information is encoded in the EEG signal amplitudes and specific frequency components (Subramanian et al., 2018). It can be used to observe fast neural processes because of its high temporal sensitivity (Shim et al., 2018). Research has shown that EEG signals measured from the scalp directly detect the brain dynamics in response to changes in psychological and emotional states due to imposed cognitive load (Aspinall et al., 2015; Jebelli et al., 2018; Saitis & Kalimeri, 2018). Behavioral reaction captured through human gait and motion is an individual movement pattern that can reflect the individual’s emotional state, cognition, intent, personality, attitude, and health (Agmon & Armon, 2016; Sun et al., 2017). The gait pattern of individuals has been continuously monitored to detect the disturbance caused by environmental features. Studies have proved that an individual’s mobility is directly a function of the environment under the individual’s feet (Duchowny et al., 2019; Twardzik et al., 2019).
Wearable Sensing of Human Interaction With the Environment
Researchers have been using various sensors for monitoring bodily responses to represent human-environment interaction; many fall into one of two categories. The first category of sensors is laboratory sensors, and the second category is wearable sensors (Ragot et al., 2017). Laboratory sensors are stationary and deployed in a controlled environment with restrictions on human movements (e.g., subjects are connected to multiple electrodes and wires, usually in the laboratory). In contrast, wearable sensors are mobile and wireless, and can be deployed in a naturalistic environment (Milstein & Gordon, 2020). Utilizing wearable sensors to monitor bodily responses rather than laboratory sensors is more desirable for people-centric sensing because they provide more realistic insights into natural human reactions to the environment (van Beers et al., 2020). These wearable sensing devices have enabled people-centric sensing to be less interruptive because individuals can go about their daily routines while their bodily responses are monitored and collected. As a result, researchers have been deploying wearable sensors to collect a continuous stream of bodily responses linked to spatiotemporal information, such as GPS data, to detect demanding environmental conditions. However, deploying wearable sensors in an ambulatory, real-world environment poses several challenges that can diminish the signals’ informativeness. For instance, a recent study reported that the EDA data collected with a wearable sensor in an ambulatory, urban environment did not show any variation due to the low sampling rate (Birenboim et al., 2019). Another study using a wearable EEG sensor also reported stability issues (Saitis & Kalimeri, 2018). Even stable wearable sensors with sufficient sampling rates usually have fluctuations in their raw signals caused by physiological factors, human variability, sensor variability, environmental conditions, and physical effort resulting from walking (Kyriakou et al., 2019). Although the raw signal can be filtered to remove external interferences, it is still ambiguous what bodily responses contain relevant information about human-environment interaction in an ambulatory, real-world environment.
Prior studies adopting people-centric sensing used a modality (e.g., EEG, PPG, EDA, or gait) or a feature extracted from a modality (e.g., mean EDA, arousal, heart rate, or signal vector magnitude) to represent people’s interactions and experiences in the environment (Birenboim et al., 2019; Chrisinger & King, 2018; H. Kim et al., 2016; J. Kim et al., 2020; Triguero-Mas et al., 2017). Generally, all these modalities and features contain relevant information. However, the relevance of the information is determined by the task to be performed, the environmental stimuli, and the prevailing conditions (Hall, 1999; Mursalin et al., 2017; Muzammal et al., 2020). For example, Birenboim et al. (2019) used EDA, heart rate (HR), and heart rate variability (HRV) to represent people’s interaction with the environment, and their findings revealed that only EDA and HRV were consistent in detecting stressful environmental situations. This implies that although each feature or modality contains information about people’s interactions, some features or modalities could be more informative than others. As a result, people-centric sensing can become ineffective and unreliable when people’s interactions and experiences with the environment are represented with an uninformative modality or feature. In this study, the authors want to encourage researchers and practitioners to assess the relevance and informativeness of people’s bodily responses in the context of their study before making any further conclusions.
Research Objective and Significance
The aim of this study is two-fold: (1) to determine the informativeness of older adults’ physiological, behavioral, and cognitive responses to outdoor conditions with varying environmental demand and (2) to build a model for each modality that can detect outdoor conditions with high or low environmental demand. Overall, this research will enable urban planners and municipal decision-makers to assess and identify environmental conditions that are likely to cause stress and/or limited mobility more efficiently and thus drive age-friendly environmental interventions to promote neighborhood walkability.
Method
Understanding human behavior and cognition in the real-world setting has been a long-sought-after goal in psychological science. However, most of the existing studies in this field were conducted in the laboratory—they often employed stationary sensors. The experiment design used in laboratory or controlled settings to assess human reaction to the environment lack sufficient realism to produce adequately meaningful findings of a person’s interaction with the environment in real life. This study aims to approximate the real world as much as possible and ensure ecological validity, hence the reason for designing the experiment in a natural setting and using wearable sensors. However, conducting this research in a real-world setting makes it impossible to ensure that the environmental conditions remain the same (e.g., weather) and include all environmental features that could affect human perception. Figure 1 shows an overview of the research methodology to achieve the aim.
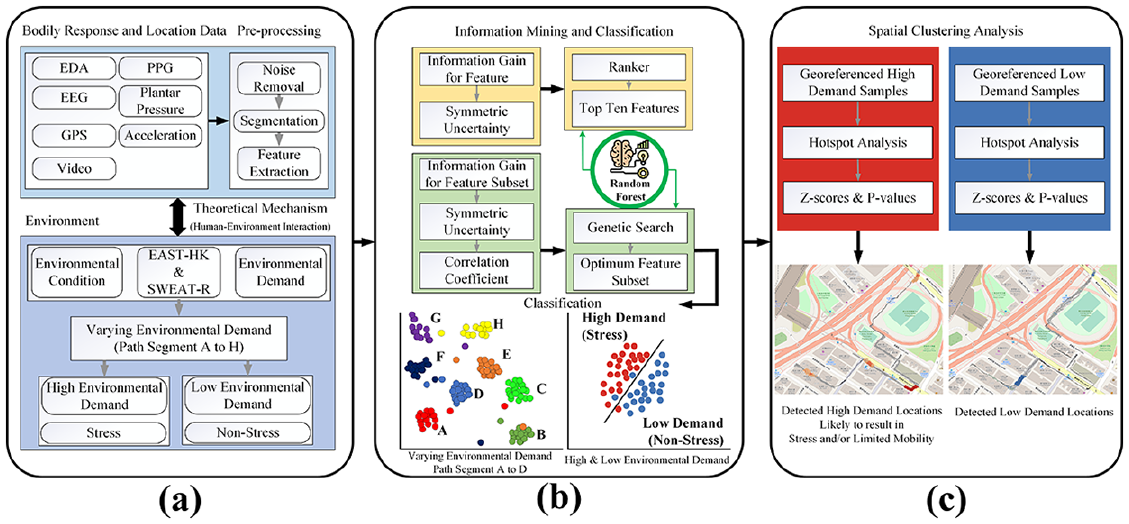
Overview of research methodology.
Experiment Design
The overview of the experimental procedure is presented in Figure 2. Based on the authors’ collaboration with the Institute of Active Ageing, an approximate 570-m walking path was carefully selected in the neighborhood of Hung Hom, Kowloon, Hong Kong, to capture a range of environmental conditions. The Institute of Active Ageing is an interdisciplinary research and academic center in The Hong Kong Polytechnic University located in Hung Hom to advance knowledge and practice to facilitate active aging. The path consists of spacious and narrow streets, green and urban areas, playgrounds, a gas station, a car wash, a car fitting shop, crosswalks (with and without traffic or pedestrian signals), sidewalks with even and uneven slopes, different street materials, among other features. Previous research efforts on human-environment interaction have proven that these environmental conditions stimulate unique human experiences (Birenboim et al., 2019; Duchowny et al., 2019; H. Kim et al., 2016; Triguero-Mas et al., 2017).
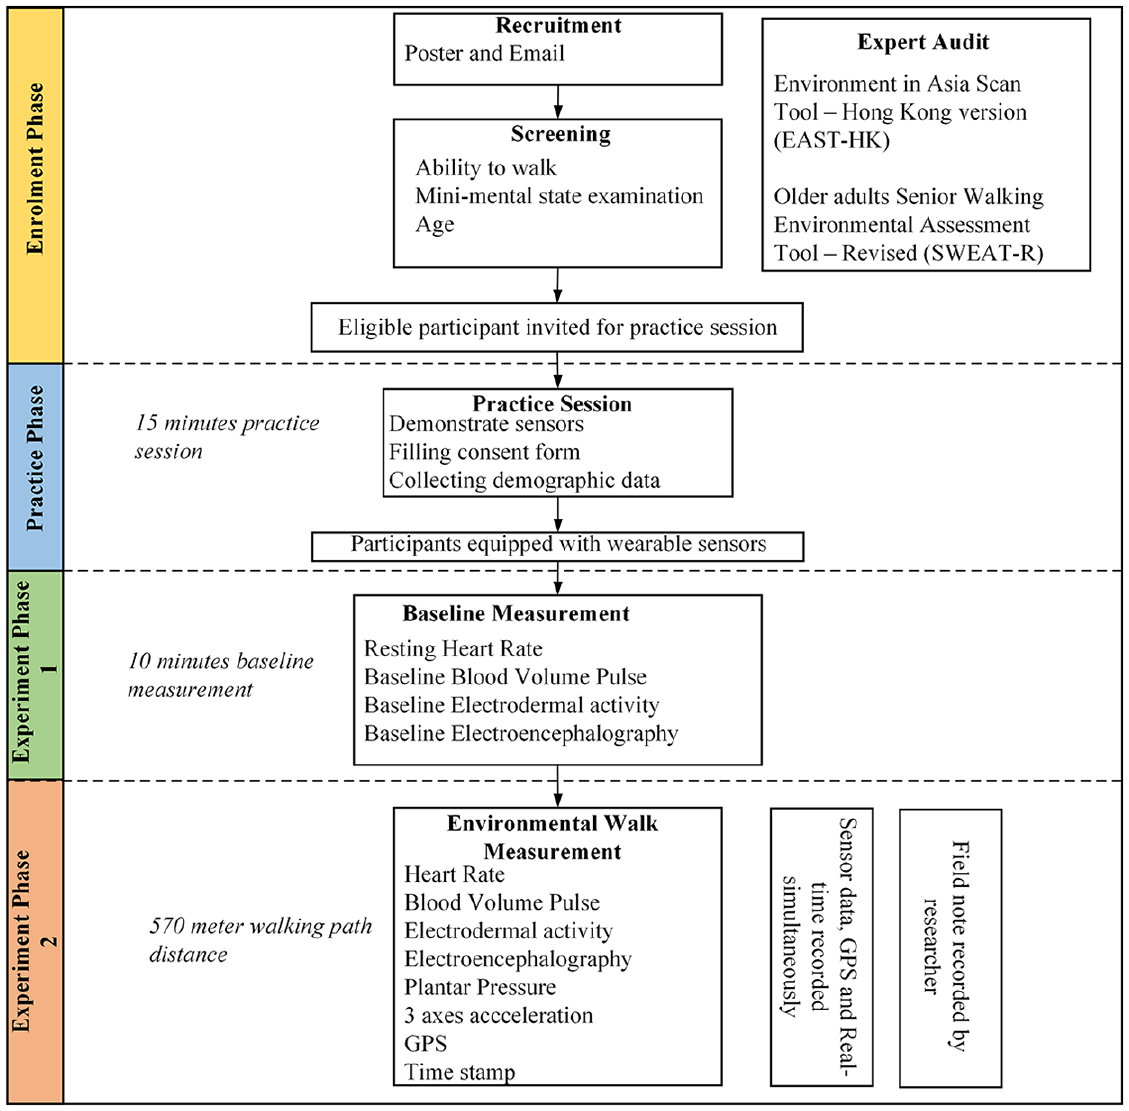
Overview of the experimental procedure.
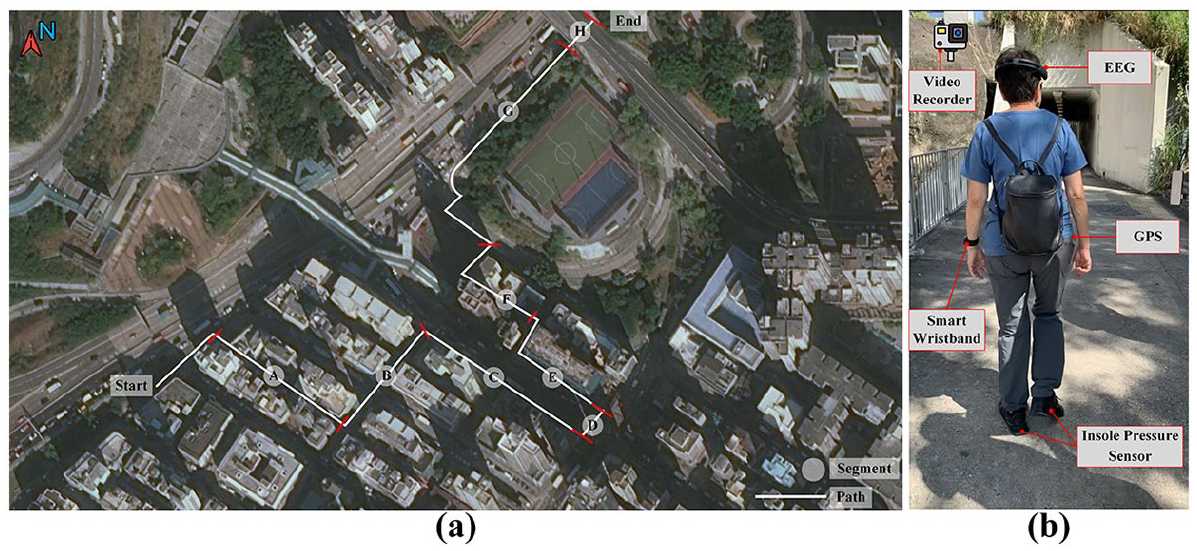
The environmental conditions on the walking path were documented by two trained auditors using the Environment in Asia Scan Tool-Hong Kong version (EAST-HK; Cerin et al., 2011). The EAST-HK is a 91-item tool for assessing aspects of the neighborhood environment that may impact residents’ walking in Hong Kong. The EAST-HK tool was supplemented with the Older adults Senior Walking Environmental Assessment Tool-Revised (SWEAT-R; Michael et al., 2009). The SWEAT-R is a 162-item tool that assesses the presence and quality of built environment characteristics significant for older adult mobility (Michael et al., 2009). Both tools are organized into four built-environment multidimensional domains: functionality, safety, esthetics, and destination (Cerin et al., 2011; Michael et al., 2009). The EAST-HK was chosen because it contains walking-related environmental attributes common to East Asian ultra-dense cities, particularly relevant to Hong Kong. Additionally, SWEAT-R contains walking-related environmental attributes common to most urban environments, designed to be specific to older adults’ needs, but lacks most of the attributes in East Asian ultra-dense cities. Therefore, integrating the EAST-HK with SWEAT-R is necessary for assessing the conditions of the walking route for older adults in Hong Kong. The integrated audit tool and the location of the path were presented to the trained auditors before the path audit. Both auditors have an MSc in urban planning. The auditors assessed the path at the same time but worked independently. The average assessment time was 1 hour 13 minutes. The auditors compared their assessments and discussed any differences in their assessments to reach a consensus, as presented in Table 1.
Audit of the Path.
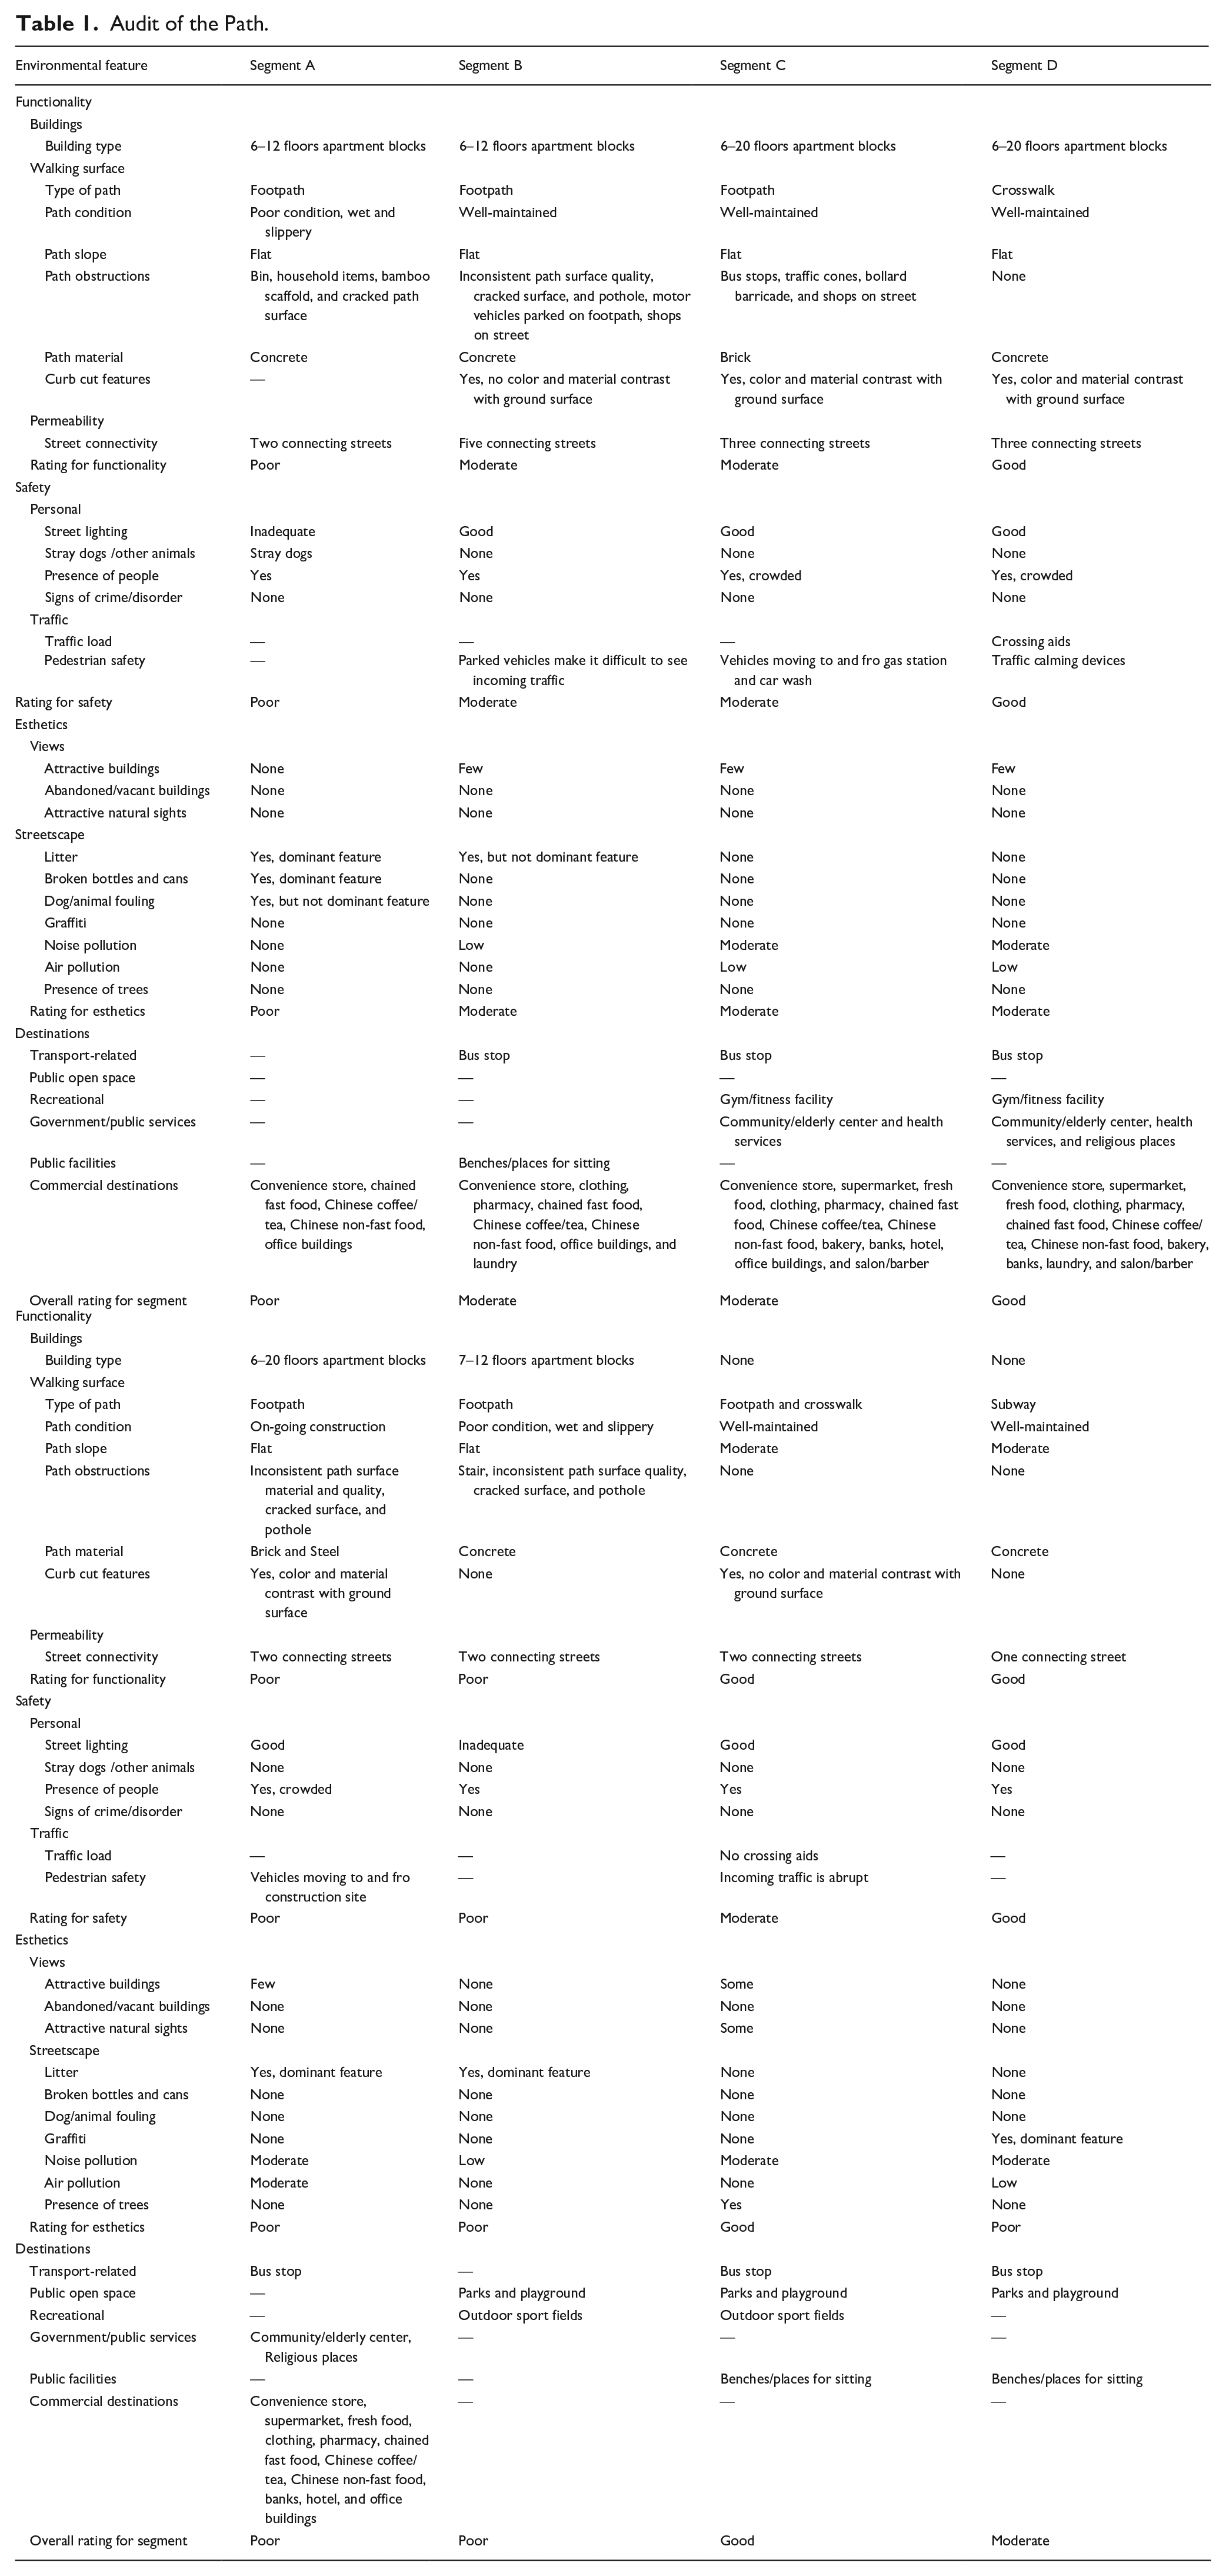
The walking path was divided into 24 sections grouped into eight distinct environment scenarios—segment A to segment H—as shown in Figure 3. The length of each section is about 23.75 m. The segments were defined to cluster sections with a similar environmental condition expected to stimulate similar human experiences. For instance, the participants had to walk through an alley (segment A), walk along a busy street with bus stops (segment C), use a crosswalk with high traffic (segment D), pass through a green space (segment G), and walk through a subway with graffiti (segment H). Following previous research (Duchowny et al., 2019; Michael et al., 2009), each 23.75 m section was classified according to the level of built environmental demand (high or low) for older adults’ mobility based on the integrated EAST-HK and SWEAT-R tool. A section is classified as high-demand if it is dominated by features that negatively impact the functionality (i.e., physical condition of the structural elements), safety (i.e., features that evoke a sense of safety and comfort), or esthetics (i.e., soft fascinating, interesting, attractive, and appealing environmental features on a human visual scale) of the path and vice versa for a low-demand environment (Michael et al., 2009; Pikora et al., 2003; Rebecchi et al., 2019). The path segments A, C, D, E, F, G (first 13%), and H were classified as high demand. The high-demand sections consist of existing built environment features such as path obstructions (32%), unattractive buildings and sights (49%), cracked, uneven, and inconsistent path surfaces (4%), parked and moving vehicles (5%), crosswalk (4%), and graffiti (4%). Similar environmental features were also identified in previous studies as either high-demand (Duchowny et al., 2019), stress-inducing (Birenboim et al., 2019; Chrisinger & King, 2018; H. Kim et al., 2016), or environmental barrier (Lockett et al., 2005; Rosenberg et al., 2013). Path segments B and G (87%) were classified as low demand. A detailed assessment of the path condition is presented in Table 1. The overall condition of the path in high-demand sections were mainly rated as poor/moderate, while low-demand sections were rated as moderate/good. Almost 65% of the path was classified as high-demand: this is plausible because the path is located in an old neighborhood currently undergoing urban renewal.
Experiment location and wearable sensing.
Recruitment posters and emails were distributed to potential participants in the networks of the Institute of Active Ageing. To be eligible for the study, participants had to walk unassisted by another person for at least 15 minutes and meet the recommended cut-off scores for the Cantonese version of the Mini-Mental State Examination (MMSE; Chiu et al., 1998; Lao et al., 2019). The MMSE is a quick, easy-to-use, acceptable, valid, reliable, and widely used screening instrument for assessing cognitive functions in clinical and research settings (Bilgel et al., 2019; Pagliai et al., 2019). Due to the limited resources available for this study, only 10 eligible participants were invited to participate in the environmental walk. All 10 participants achieved scores ≥22 points on the MMSE. A cut-off score of 19/20 is recommended to indicate cognitive impairment among Hong Kong older adults (Chiu et al., 1998; Lao et al., 2019). The demographic information of the participants is presented in Table 2. Only one participant (participant 7) used a walking stick for mobility.
Demographic Information of Participants.
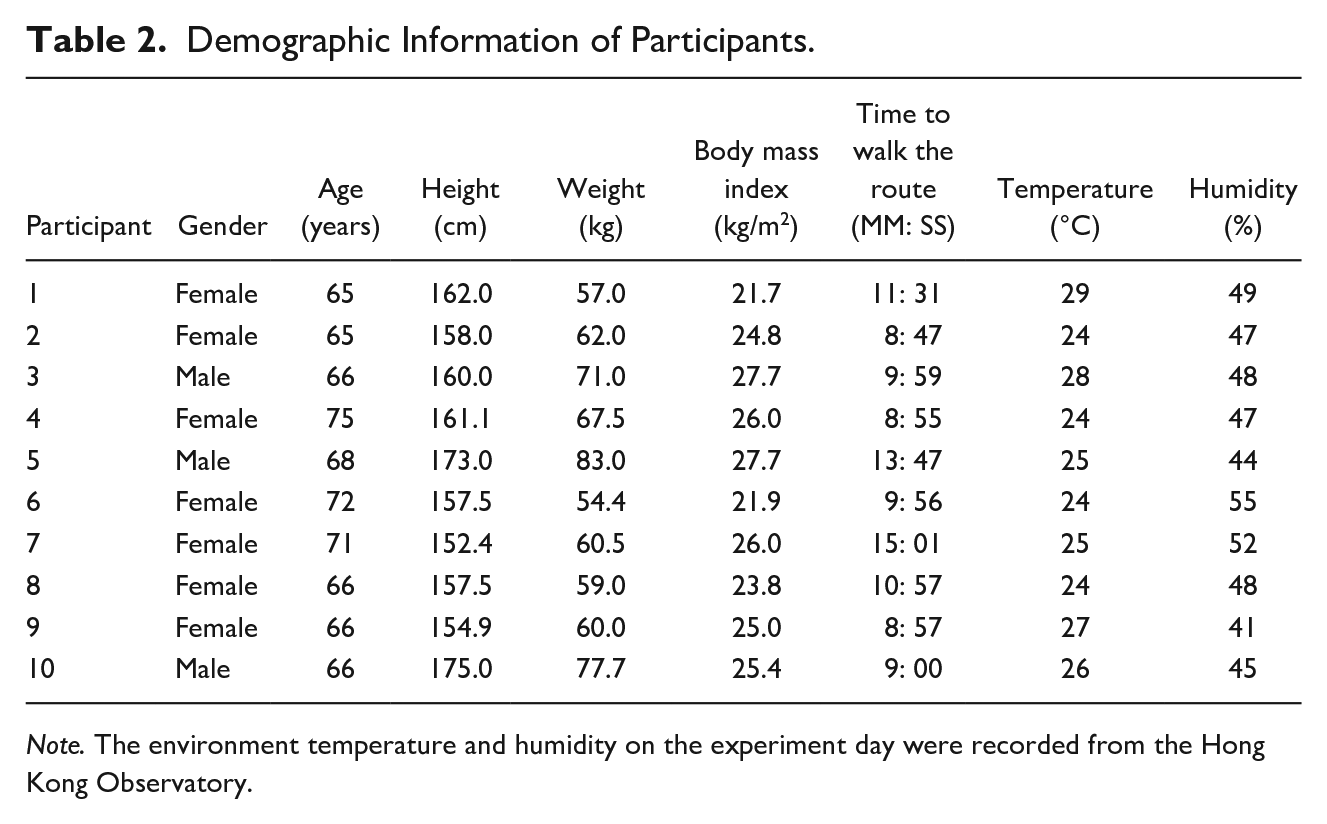
Note. The environment temperature and humidity on the experiment day were recorded from the Hong Kong Observatory.
The wearable sensors deployed in this study were demonstrated to the participants to increase their familiarity and acceptance of the sensors. The participants completed and signed an informed consent form after obtaining written and spoken information about the experimental procedure. Baseline measurements were recorded for 10 minutes. After the baseline measurements, the participants walked the path from start to end (as shown in Figure 3) at a self-directed pace to optimize their experiences and enable ecological validity. The sensor data, GPS, and timestamps were recorded simultaneously during the walk. Two researchers accompanied the participants. One of the researchers was responsible for providing directions if needed, troubleshooting any technical malfunction with the wearable sensors, and serving as a spotter for safety. The other researcher took field notes and recorded a video of the environmental walk. The accompanied researchers remained half a stride behind the participants to allow the participant to determine the pace. The researchers did not talk or walk along with the participant unless they called for assistance. The environmental walk was conducted in November 2019 between 10 a.m. and 4 p.m. The environment temperature ranges from 24°C to 29°C, and the humidity ranges from 41% to 55%. Generally, the infrastructure of the urban environment and the season where the path is located is uniform. The environmental temperature and humidity for each participant on the day the experiment was conducted are presented in Table 2. A shopping voucher of HK$100 was offered as compensation for participation. All study procedures were reviewed and approved by the Human Subjects Ethics Sub-committee of The Hong Kong Polytechnic University (Reference Number: HSEARS20190826002).
Wearable Sensing: Capturing Older Adults’ Physiological, Behavioral, and Cognitive Responses
A wrist-worn biometric sensor, the Empatica E4 (Empatica, 2020), was used to measure BVP (via PPG) and EDA. The Empatica E4 records the BVP signal at 64 Hz and the EDA signal at 4 Hz. The brain electrical activity was recorded non-invasively from the scalp using a wearable EMOTIV EPOC+ 14 channel mobile EEG headset (Emotiv, 2020). The 14 channels correspond to the international 10 to 20 position system (AF3, AF4, F3, F4, F7, F8, FC5, FC6, T7, T8, P7, P8, O1, and O2) with two reference electrodes (P3 and P4). The EMOTIV EPOC+ headset records EEG at 128 Hz. Foot plantar pressure distribution, contact forces, and three-axis acceleration data were collected using Moticon OpenGo insole sensor at 50 Hz (Moticon, 2020). Each insole (left and right side) consists of 16 pressure sensors and six-axis Inertial Measurement Unit (IMU) sensor. GPS coordinates in latitude and longitude were logged using Qstarz BT-Q1000XT (Qstarz, 2020). The environmental walk was video recorded. These wearable devices were chosen for the study because they are commercially available, light-weight, comfortable, easy to install, and use for older adults in outdoor conditions.
Pre-Processing of Signal Data
Given that the bodily responses were recorded during an ambulatory setting, the signal from the wearable sensors is vulnerable to noise and artifacts. In addition, changes in bodily responses are not always due to environmental demands; they could be caused by changes in physical activity levels. The authors adopted the approach of Jaques et al. (2015) to reduce the impact of physical activity. First, the magnitude (Mag) of the acceleration signal,
PPG/BVP signal pre-processing
The pulse wave for the PPG signal was detected using a matched filtering approach (Veen & Van Der Wiellen, 2003). Artifacts in the PPG signal can lead to significant distorting and inaccurate measurements. External interferences (including noises due to environmental electric-magnetic fields and unstable stable contact of electrodes) and internal interferences (including ectopic beats and missing, extra or misaligned beats) were detected and corrected using a proprietary artifact correction algorithm (Tarvainen et al., 2014). Furthermore, the analyzed time series is detrended using a smoothness priors regularization method to remove slow and complex nonstationary trends (Tarvainen et al., 2002). The proprietary correction algorithm is scientifically validated and has been used for data collected in an ambulatory setting (Birenboim et al., 2019; Lipponen & Tarvainen, 2019; Tarvainen et al., 2014). The PPG signal was baseline normalized to compensate for inter-individual variance.
EDA signal pre-processing
Each participant’s EDA data were first normalized against the baseline period to reduce inter-individual variance. The normalized data was filtered with a first-order Butterworth-Lowpass filter with a low cut-off of 0.28 Hz and smoothed with a moving average filter to remove high frequency noises (such as noises due to movement and electrical interference). A low cut-off frequency of 0.28 Hz is recommended when data is recorded during a low-intensity activity such as walking (Posada-Quintero et al., 2018). A minimum skin conductance response amplitude threshold of 0.05 µS was set to eliminate external interferences due to the experimental conditions (such as variations in temperature, humidity, and unstable contact of electrodes) and movement artifacts (Benedek & Kaernbach, 2010; Posada-Quintero & Chon, 2020).
EEG signal pre-processing
The EEG data obtained from the headset were baseline normalized to facilitate comparison between participants. EEG signal is susceptible to frequency noises and often contaminated by electrophysiological signals (such as heart and muscle activity, head and body movements), ocular artifacts (such as eye movements and blinks), and external interferences (such as electrode popping, movement artifacts, environmental noise, and wiring noise; Jebelli et al., 2018; Krishnaveni et al., 2006). A low and high bandpass filter, a notch filter, and a wavelet denoising approach were adopted to denoise the raw EEG signal (Jebelli et al., 2018; Krishnaveni et al., 2006). A bandpass filter with a lower cut-off frequency of 0.5 Hz and a higher cut-off frequency of 64 Hz, and a notch filter at 50/60 Hz were used to remove external interference from the EEG signal (Jebelli et al., 2018). In designing the bandpass filter, the lower cut-off frequency of 0.5 Hz was selected because it is the lowest frequency to detect relevant brain activity or brain waves with surface electrodes placed on the scalp (i.e., delta [δ] [0.5–4 Hz], theta [θ] [4–7 Hz], alpha [α] [7–13 Hz], beta [β] [13–30 Hz], and gamma [γ] [30–higher Hz] frequency bands). The higher cut-off frequency was calculated based on the EEG signal sampling rate (i.e., 128 Hz) and Nyquist frequency (i.e., half of the sampling rate, equal to 64 Hz in this study). The EMOTIV EPOC+ system consists of a built-in digital fifth order Sinc filter and digital notch filters at 50 and 60 Hz (Emotiv, 2020). The notch filter attenuates power line interference over a narrow band of frequencies (e.g., 50 Hz; Ferree et al., 2001). A discrete wavelet transformation—Daubechies wavelet with eight vanishing moments—with decomposition level 8 was adopted to remove ocular artifacts and extract relevant frequency bands. The following relevant frequency bands were extracted from each of the 14 EEG channels: delta [δ] [0.5–4 Hz], theta [θ] [4–7 Hz], alpha [α] [7–13 Hz], beta [β] [13–30 Hz], and gamma [γ] [30–50 Hz] frequency bands.
Plantar pressure sensor and accelerometer signal pre-processing
Human gait signals energy are low-frequency components; thus, the pressure and acceleration signals are easily corrupted by instrumentation noise, random noise, electric, and magnetic noise (Wang et al., 2011). The presence of noise in the pressure and acceleration signals may result in an inaccurate estimation of gait features. The raw data from the pressure and IMU sensors were denoised using a discrete wavelet transformation—Symlet wavelet with two vanishing moments—with decomposition level four. A sure shrink with a soft thresholding technique was adopted to decompose and reconstruct the signals.
Feature Extraction
Feature extraction builds valuable information from the raw data by reformatting, combining, and transforming the raw data—the primary feature—into new features. The sensors deployed in people-centric sensing represent people’s interactions and experiences in the environment as a series of data points ordered in time. The temporal changes and fluctuations in the signal data are reflected in the time-domain, frequency-domain, and nonlinear domain features (Antwi-Afari et al., 2018). Based on a literature review, several time-domain, frequency-domain, and nonlinear domain features commonly used in people-centric sensing were extracted from the physiological (Birenboim et al., 2019; Triguero-Mas et al., 2017; Walford et al., 2017), behavioral (Duchowny et al., 2019; H. Kim et al., 2016; Twardzik et al., 2019), and cognitive signals (Bailey et al., 2018; Neale et al., 2017; Tilley et al., 2017). Because the data points for the recorded signals are large (i.e., 64 data points/second for PPG signal; 4 data points/second for EDA signal; 128 data points/second for EEG signal; and 50 data points/second for plantar pressure sensor and accelerometer signal) extracting the features from one single signal reading is not informative (Jebelli et al., 2018). To address this problem, features were extracted from blocks of continuous readings referred to as windows. Selecting an appropriate window size impacts the informativeness of the features (Antwi-Afari et al., 2018).
The possible features that reflect the conditions of the environment would be a physiological, behavior, or cognitive feature that continuously fluctuated, proportional to the older adults’ experiences throughout the environmental walk. To extract features with such attribute, continuous calculations were conducted using the optimal window size of the respective bodily response and advanced by 1 s for each second of the entire duration of each pedestrian’s walk on the path.
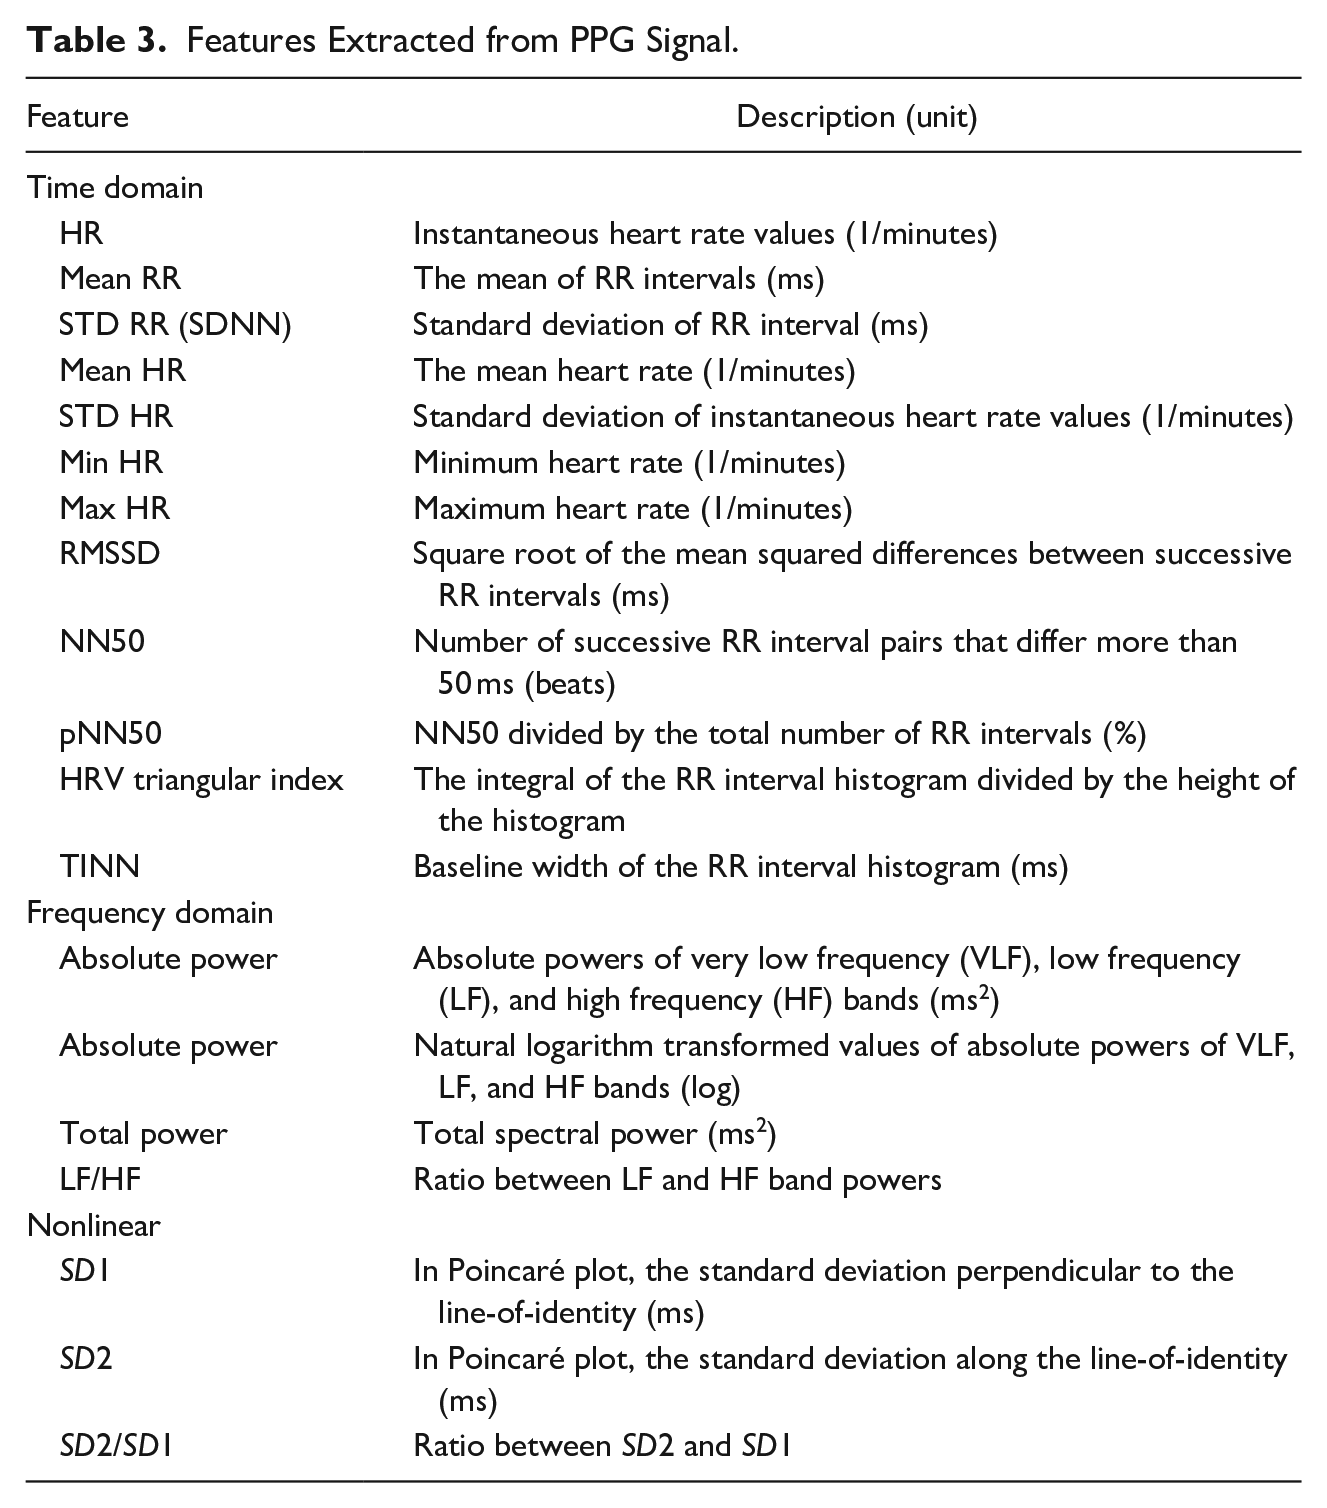
Features extracted from PPG/BVP signal
A continuous time series of PPG features was extracted from a window size of 60 s. Based on previous studies, a short-term window of 60 s can be used to extract informative features from PPG signal (Shaffer & Ginsberg, 2017). The frequently used features for people-centric sensing in the time-domain, frequency-domain, and nonlinear domain were computed, as presented in Table 3. A total of 31 features were extracted from the PPG signal for each participant.
Features Extracted from PPG Signal.
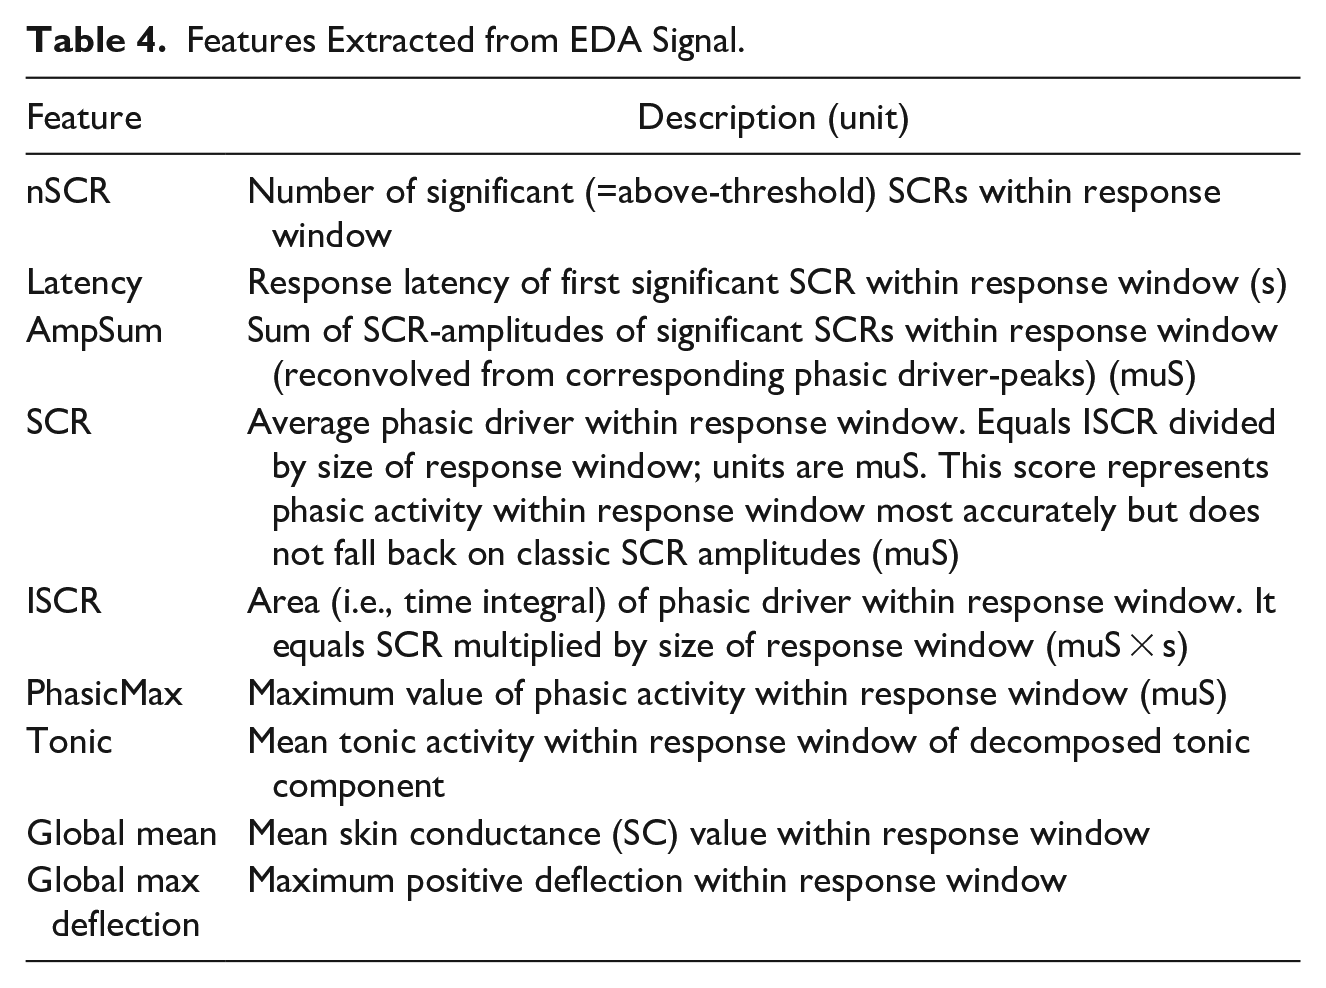
Features extracted from EDA signal
Before EDA feature extraction, the authors first used a continuous decomposition analysis technique to decompose the processed EDA signal into two components: skin conductance level (SCL) and the skin conductance response (SCR; Benedek & Kaernbach, 2010). The SCL reflects the baseline level of skin conductivity (tonic stimulus) and changes slowly over time, while the SCR increases in the amplitude of skin conductivity due to sympathetic stimulation. SCL and SCR features (Table 4) were extracted from a window size of 10 s, with a minimum amplitude threshold of 0.05 µS to eliminate external interferences due to the experimental conditions and movement artifacts (Benedek & Kaernbach, 2010; Posada-Quintero & Chon, 2020). Because a 10 s latency is sufficient for EDA reaction to extinguish after a stimulus (Posada-Quintero & Chon, 2020), it is expected that the informative EDA features will be produced within a window size of 10 s. A total of nine features were extracted from the EDA signal for each participant (Table 4).
Features Extracted from EDA Signal.
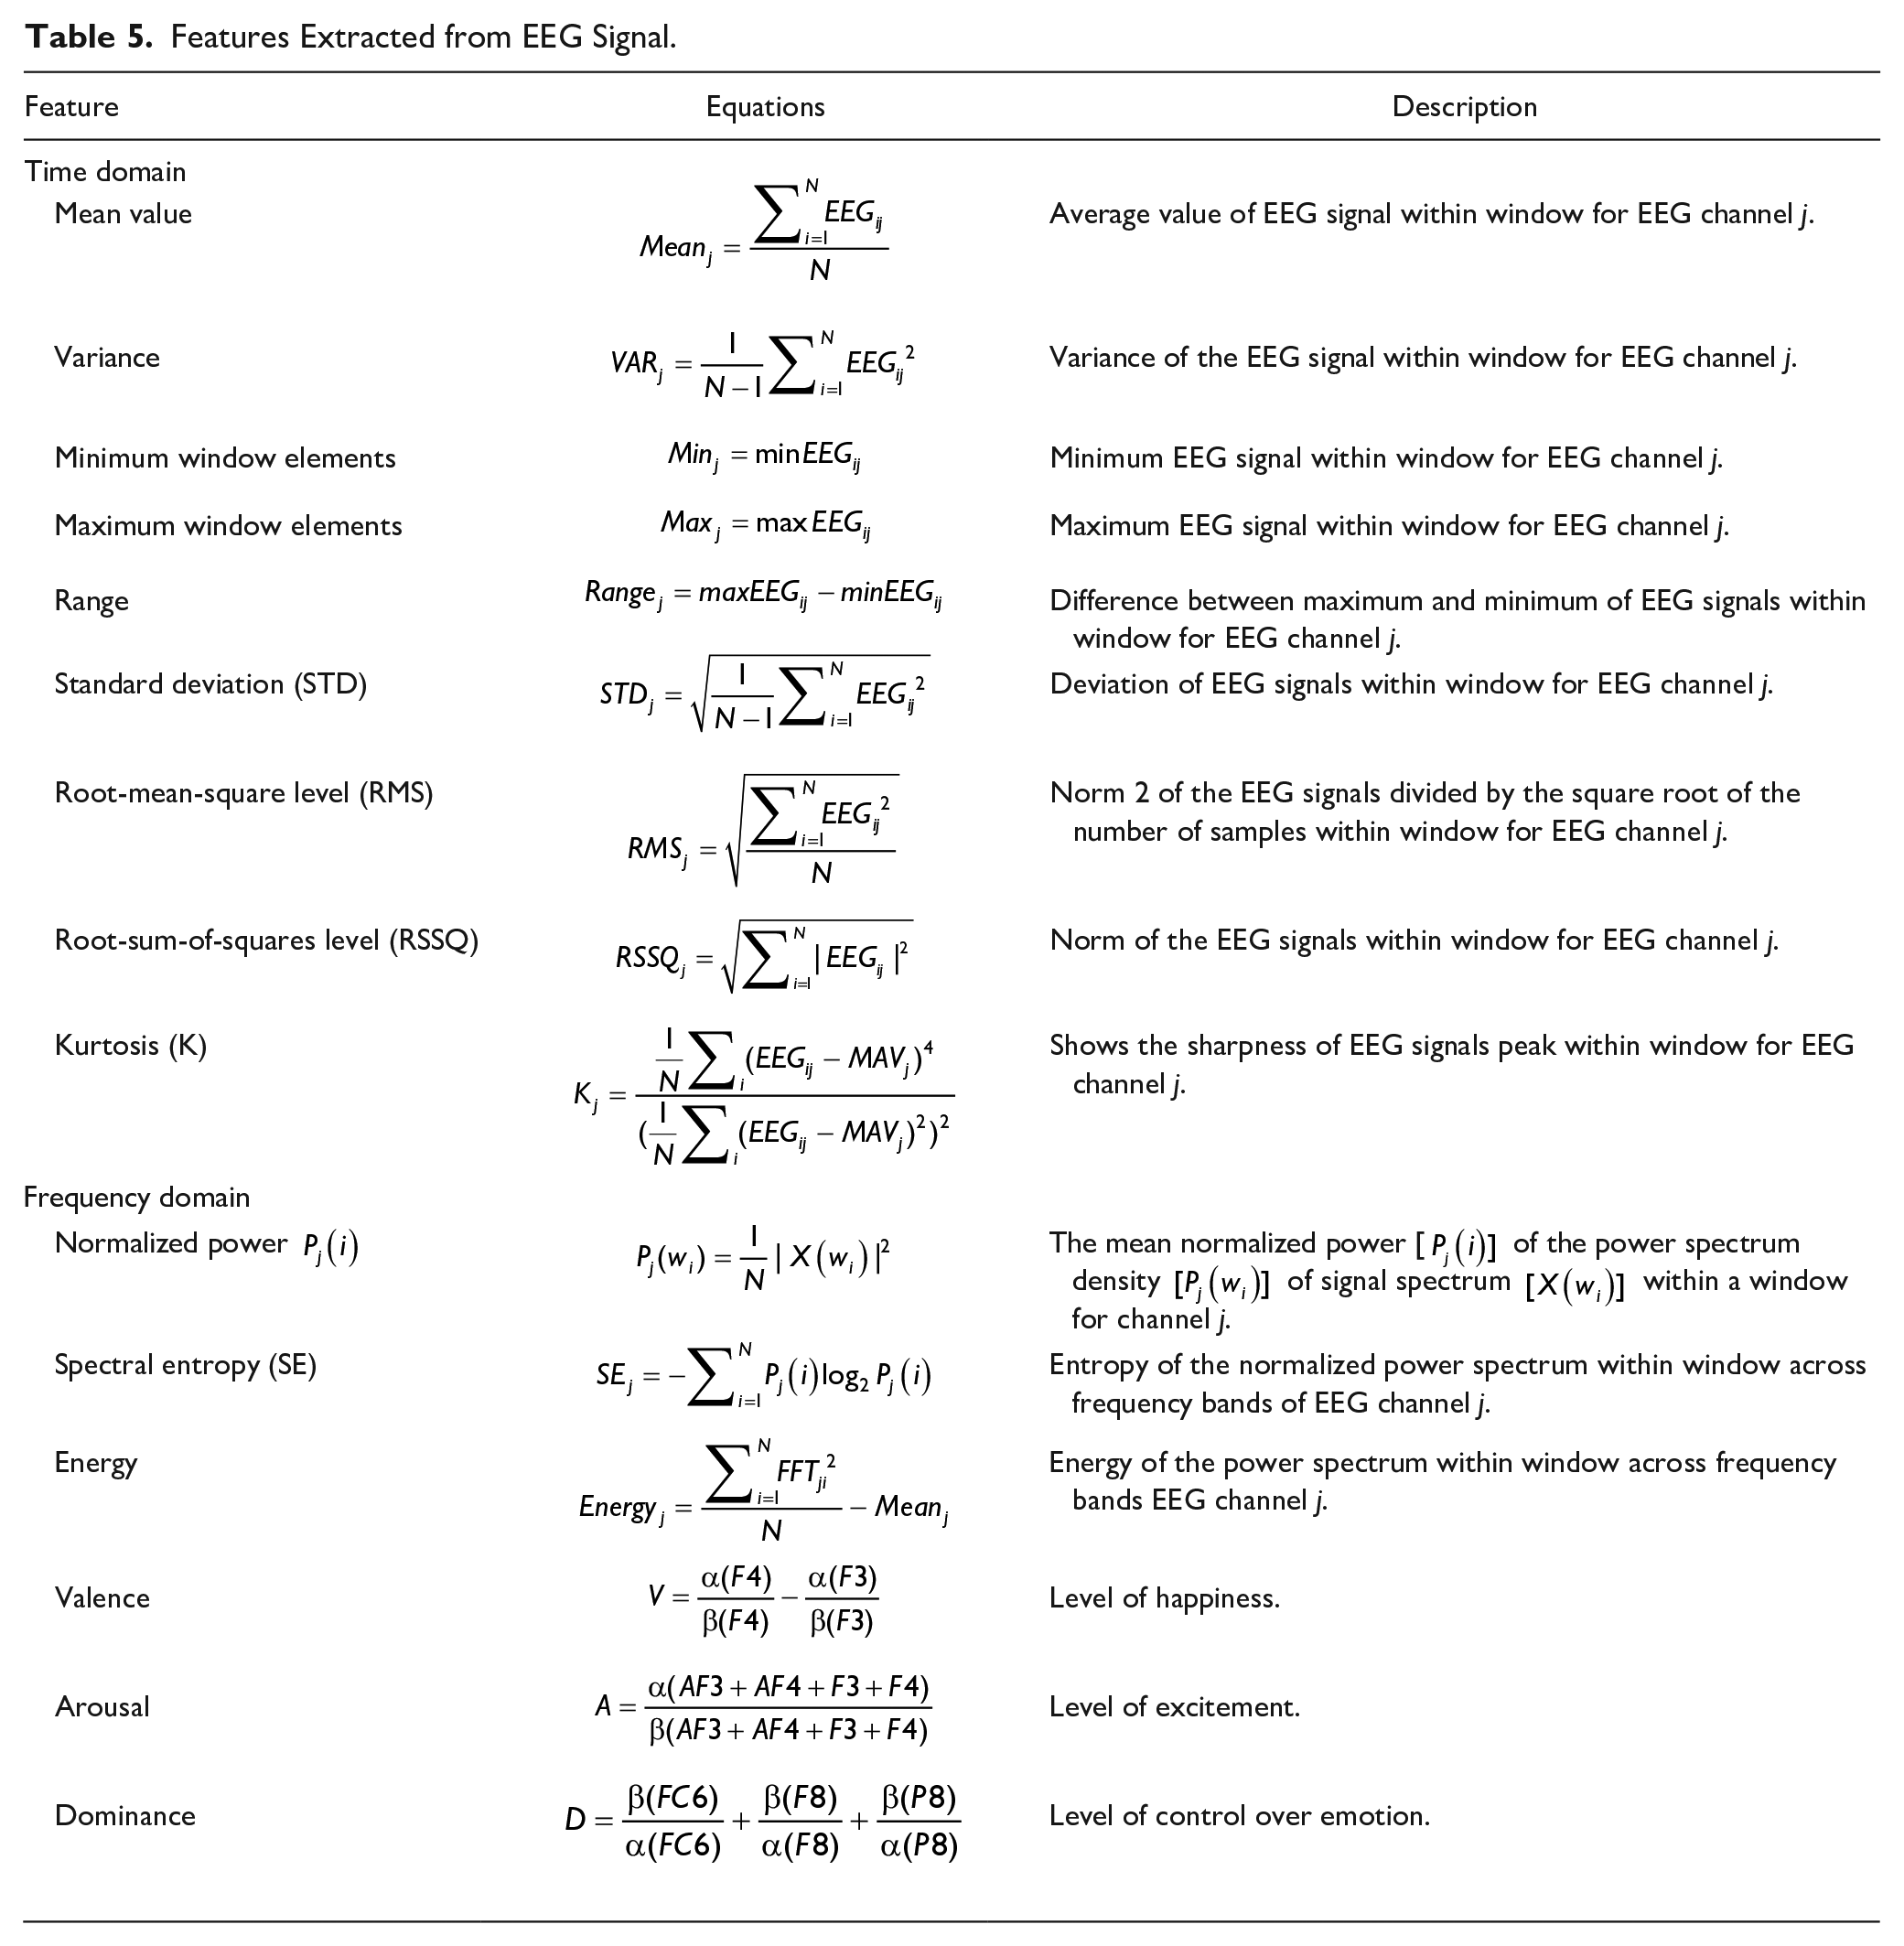
Features extracted from EEG signal
Based on previous studies, a window size of less than 12 s is appropriate for EEG feature extraction (Candra et al., 2015). To find the optimal window size, features were extracted from different window sizes ranging from 1 to 12 s. The window size of 2 s produced the most informative feature; hence 2 s was selected as the optimum window size for this EEG dataset. Time-domain features were computed from each of the 14 EEG channels. Frequency domain features were computed from each of the 14 EEG channels in the δ, θ, α, β, and γ bands. A total of 339 features were extracted from the EEG signal for each participant. The extracted features are listed in Table 5.
Features Extracted from EEG Signal.
Features extracted from plantar pressure sensor and accelerometer signal
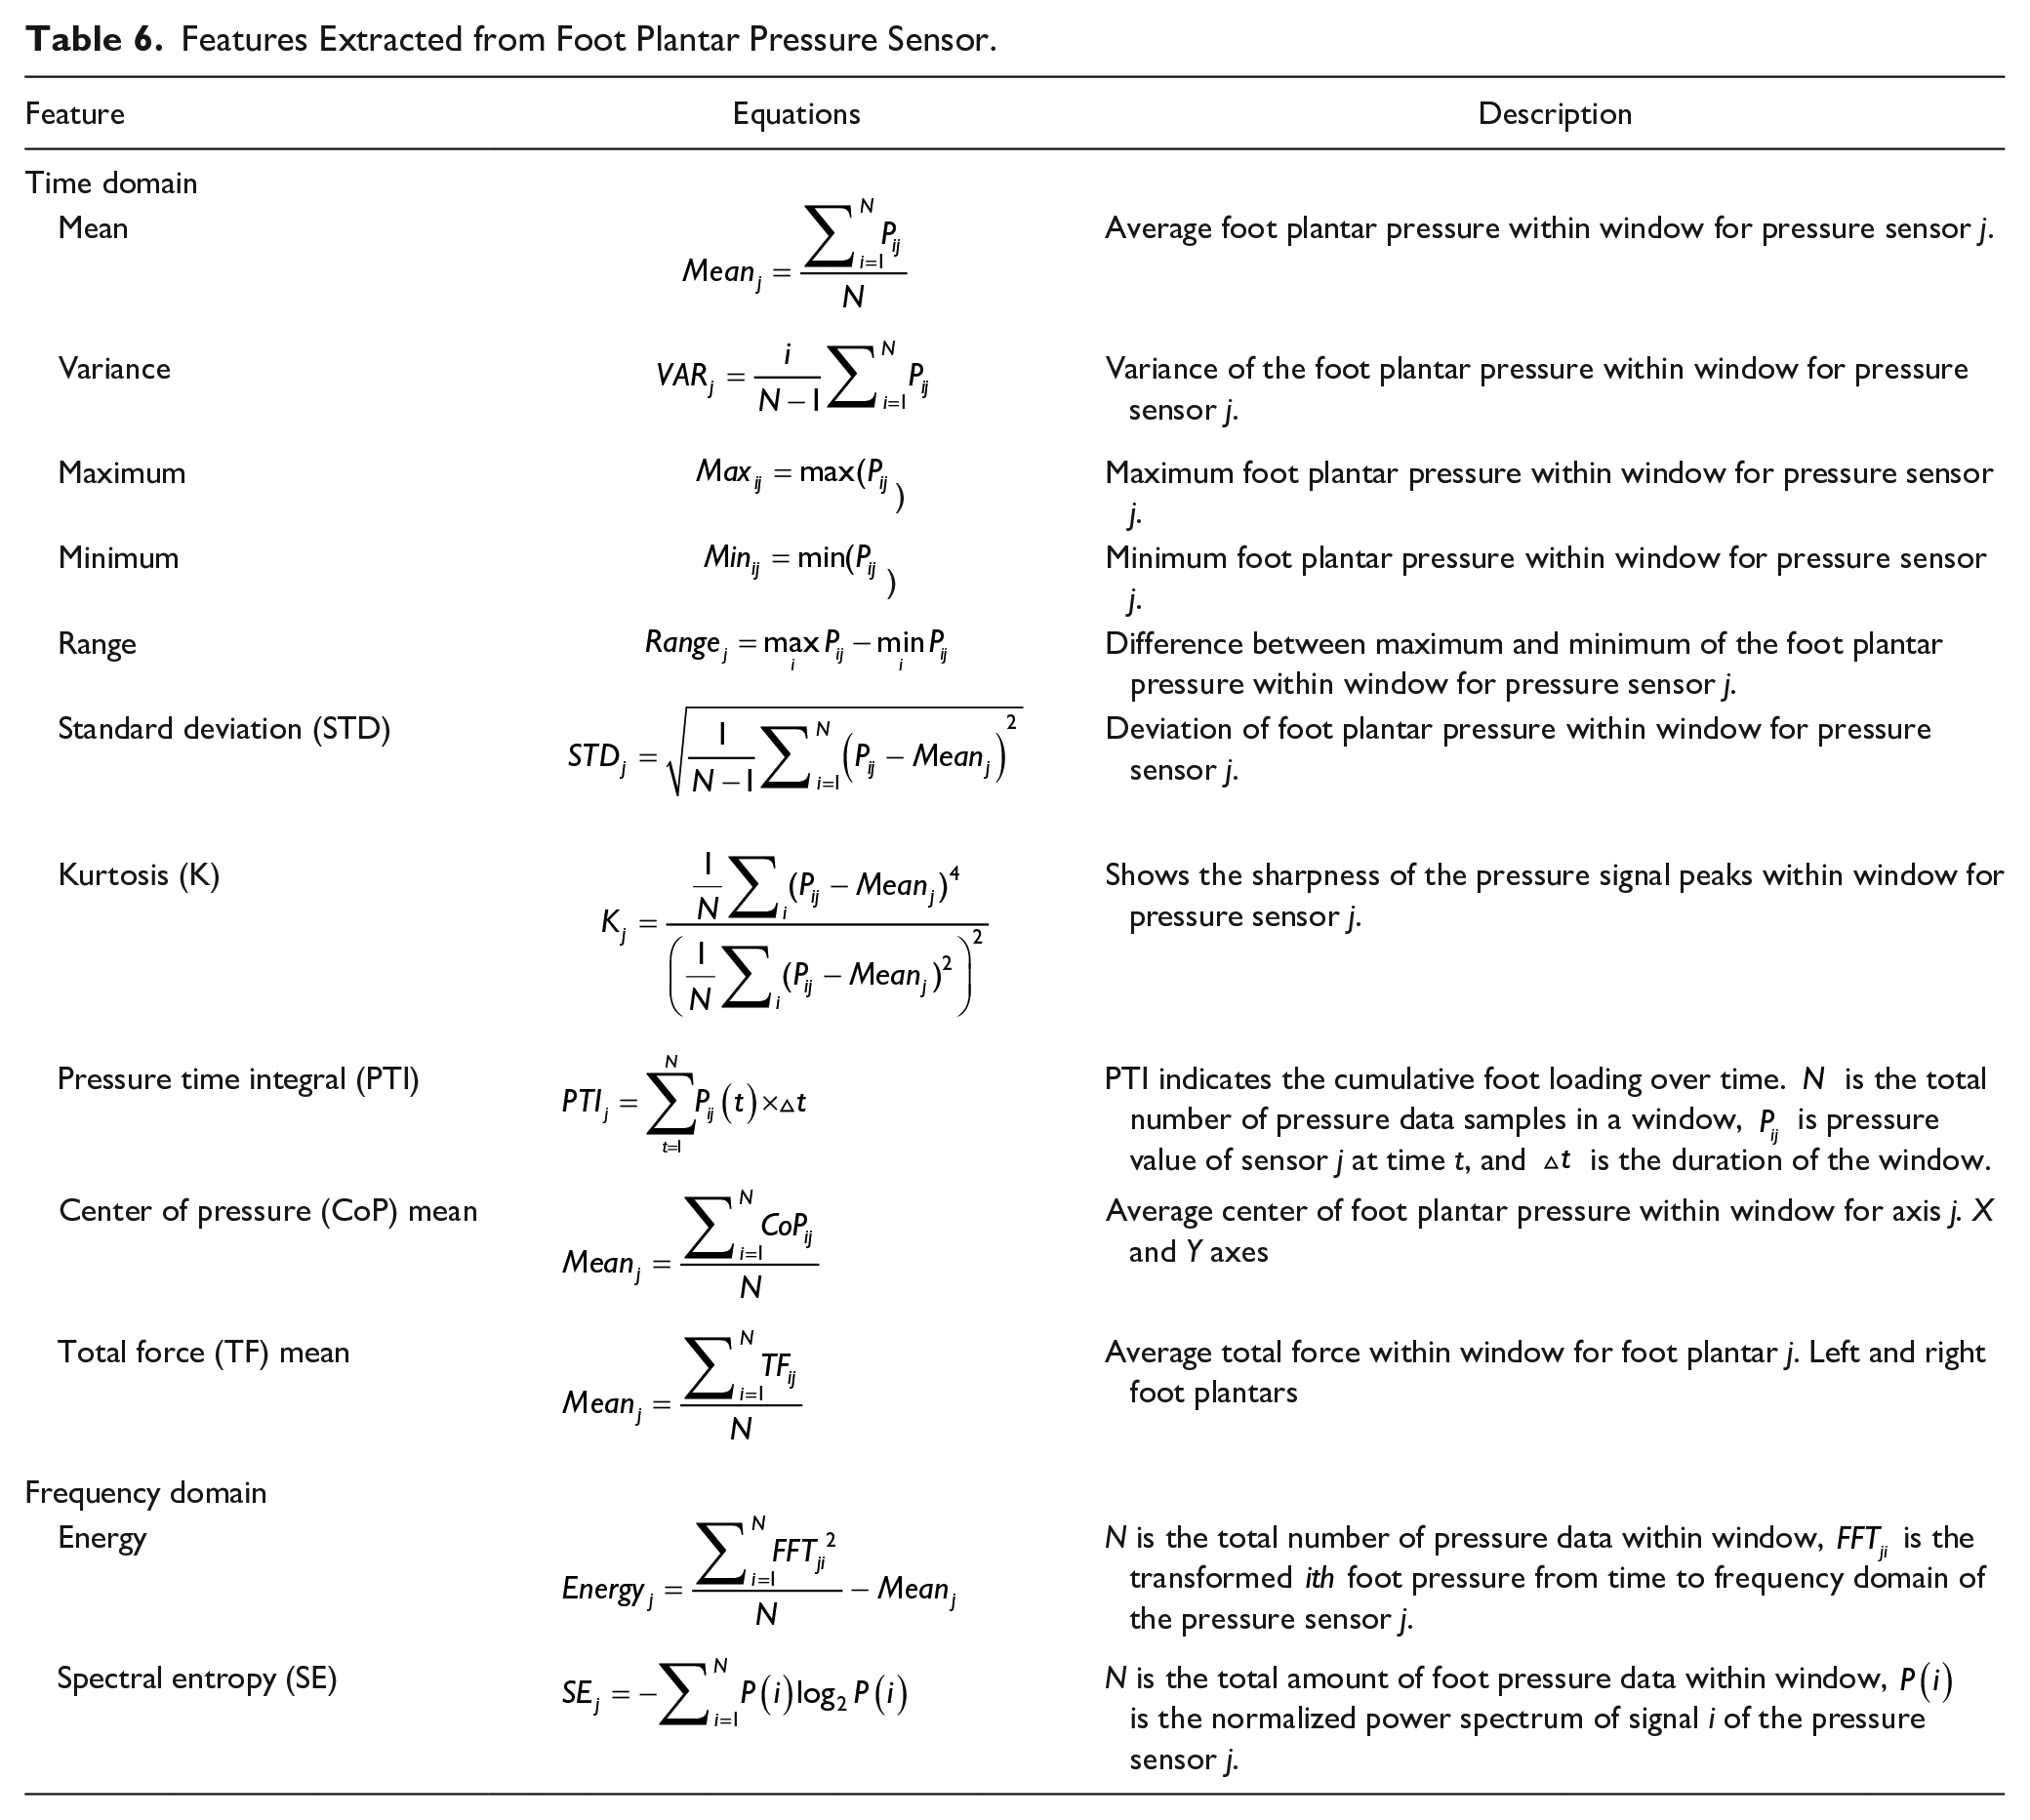
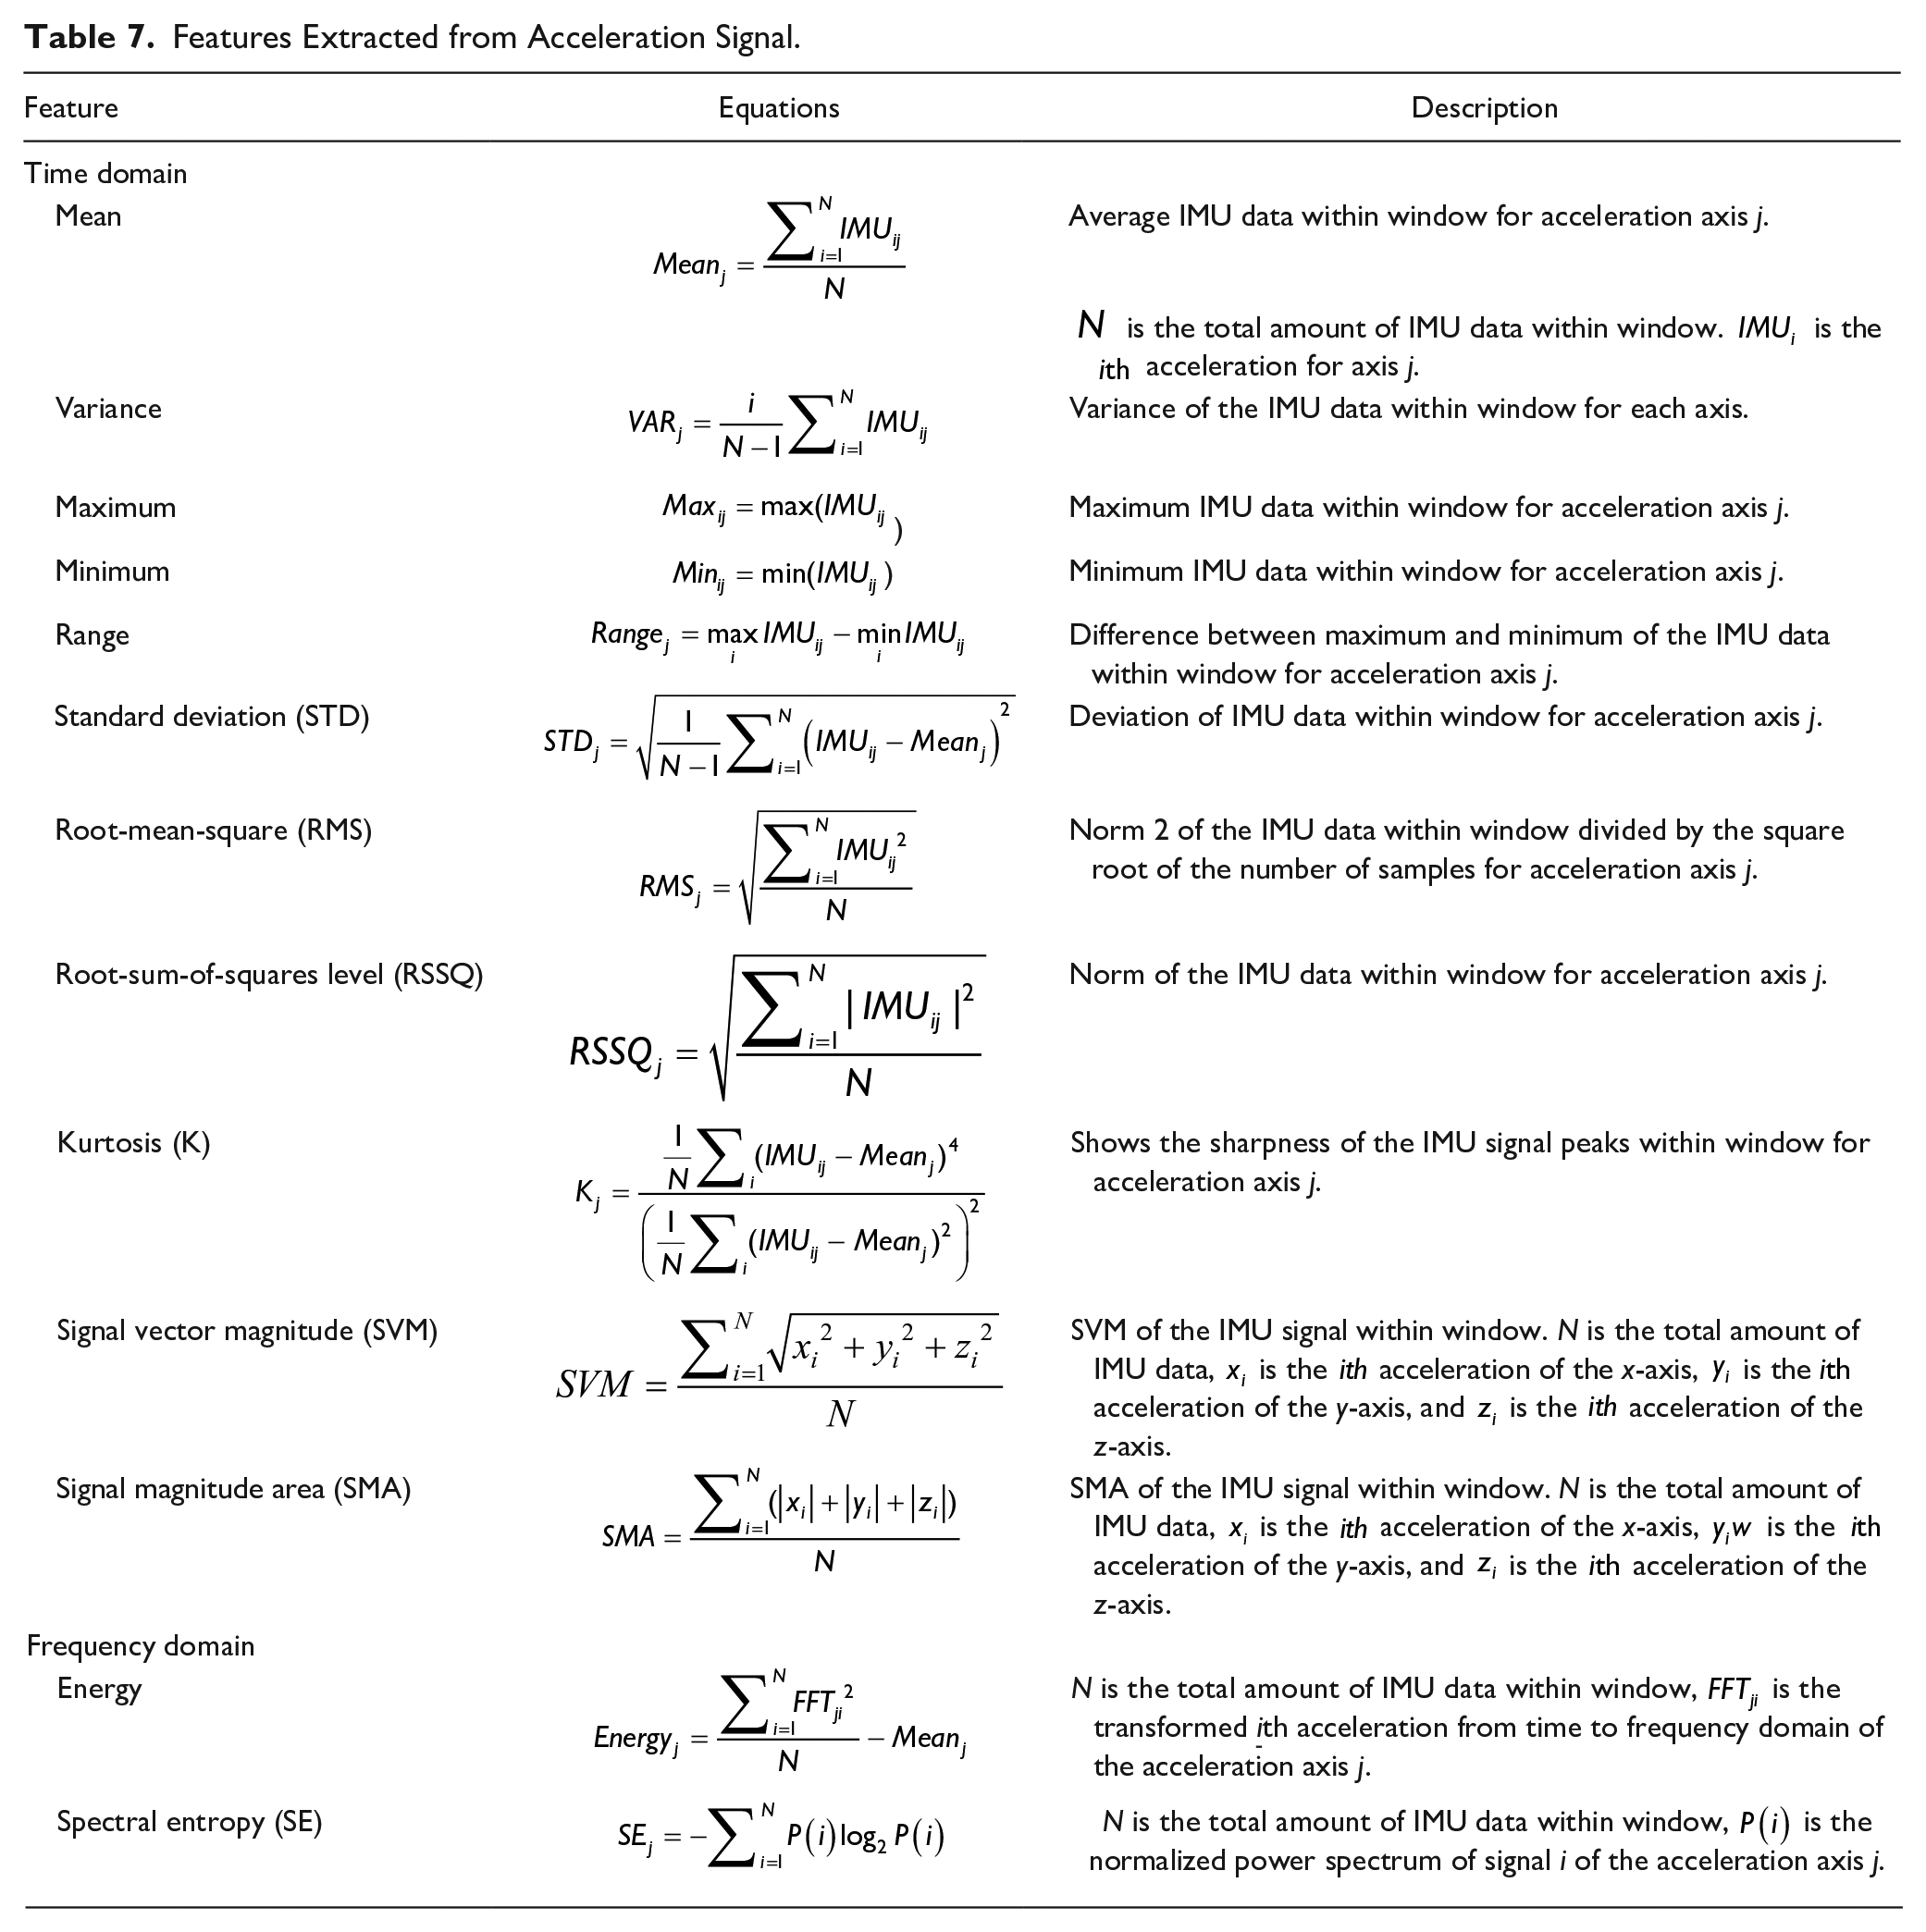
The window size of 5.12 s for pressure data and 10.24 s for acceleration data were the optimum window size for these datasets upon testing different window sizes. Time-domain and frequency-domain features for the foot plantar pressure sensor (Table 6) and acceleration signals (Table 7) were extracted from the segmented data. A total of 326 features from 32 pressure sensors and 70 features from three-axes acceleration sensor were extracted.
Features Extracted from Foot Plantar Pressure Sensor.
Features Extracted from Acceleration Signal.
Assessing the Informativeness of Physiological, Behavioral, and Cognitive Responses to Varying Environmental Demand
AI-based information mining
A feature contains informative and measurable property of a detected signal (Jebelli et al., 2018). In this study, the relevance of a feature was determined by measuring the symmetrical uncertainty of the information gained from people’s interaction with the outdoor environment. First, the impurities in the features are measured using entropy. In information theory, the concept of entropy was introduced as a measure of uncertainty of a random variable in a system (Hall, 1999). The entropy is computed as follows (Hall, 1999)

The entropy of

where


However, information gain is biased toward features with more values. Thus, symmetrical uncertainty (SU) is used to compensate for information gain’s bias, and the resulting value is normalized to the range of [0, 1] using (Hall, 1999)

The Ranker algorithm in Java (Witten et al., 2017) was used to sort the features into rank order of the evaluation based on the SU. The Ranker algorithm returns an array of sorted (highest evaluation to lowest evaluation) features. The top 10 ranked features are reported in this study.
To determine the optimum number of features that gained the most information without over-fitting, the merit of a subset of features was computed using (Hall, 1999; Mursalin et al., 2017; Muzammal et al., 2020)

where
Classification
The human experience in the environment is the human state of being affected by the surrounding conditions (Ojha et al., 2019). It is expected that each segment of the path presents a unique experience (i.e., environmental demand) to the older adults, and this unique experience can be captured through their bodily responses while interacting with the path segment. This means that the most informative bodily responses should capture a distinctive representation of the older adults’ experiences in each path segment. A more informative bodily response should achieve a higher prediction performance of people’s interactions in each segment. Therefore, the authors further performed a supervised classification with path segments A to H as class labels, a Random Forest (RF) classifier, and the following as input features. (1) Each top 10 bodily feature that had the highest information gain. (2) The optimum bodily feature subset that had the highest merit. RF is an ensemble of different decision trees. Each decision tree in the forest gives a classification, and the forest chooses the final classification with the most votes (Lou et al., 2014). The RF classifier was chosen because of its unique advantages in dealing with small sample sizes, high-dimensional space, and complex data structures (Qi, 2012). It is non-parametric, interpretable, efficient, and has high prediction accuracy for many types of data (Fernández-Delgado et al., 2014; Qi, 2012). RF offered the highest classification performance compared to other classification algorithms for the dataset used in this study (see the following section).
The data point for each path segment (A–H) was imbalanced, ranging from 1,218 (segment G, majority class) to 242 (segment H, minority class), which could influence the classification. To extract more accurate information from this imbalanced dataset, the authors adopted a random undersampling technique by keeping all the data in the minority class and randomly reducing the size of the majority class to have equal class distribution. The random undersampling was performed 10 times, resulting in 10 random equally distributed datasets. Each dataset was used as the input for the classification task over 10-fold cross-validation. The average Area under the Receiver Operating Characteristic (AUROC) of the 10 datasets was the performance metric. The Receiver Operating Characteristic (ROC) curve is constructed by plotting the true positive rate against the false positive rate to show the performance of a classification model at all classification thresholds. The AUROC provides an aggregate measure of performance across all possible classification thresholds. AUROC ranges in value from 0 to 1. A model whose predictions are 100% wrong has an AUROC of 0.0; one whose predictions are 100% correct has an AUROC of 1.0.
Detecting Demanding Environmental Conditions
To detect demanding environmental conditions from individual older adults’ bodily responses, machine learning-based classifier algorithms capable of discriminating between bodily responses to high demand environmental conditions and low demand environmental conditions were trained using the data collected from the path. Theoretically, high demand conditions could result in stress which is reflected in the bodily responses (Lawton, 1982; Mair et al., 2011; Mollenkopf et al., 2006; Webber et al., 2010). Therefore, the authors deployed and tested the discrimination performance of five different supervised learning algorithms—Decision tree (J48), k-nearest neighbor (kNN), Naïve Bayes, support vector machine (SVM), and Random Forest—that have been used in previous studies to detect stress from bodily responses (Jebelli et al., 2018; Torku et al., 2021). The information mining approach was used to identify the optimum feature subset with the most information about human interaction with high demand and low demand environmental conditions. The distributions of the bodily responses data across the high demand (3,691 samples) and low demand (1,827 samples) environmental conditions were unequal. To avoid an imbalance classification model, a random undersampling was conducted to achieve an equally distributed dataset. The random undersampling was repeated 10 times resulting in 10 randomly equally distributed datasets. The average performance (i.e., AUROC) of the five algorithms over the 10 different datasets based on 10-fold cross-validation was computed. The algorithm with the highest AUROC was selected for detecting demanding environmental conditions. The authors deployed the selected algorithm to classify each participant’s bodily response collected from the environmental walk into high demand and low demand.
Spatial clustering analysis
The detected high-demand samples for each participant were mapped along the path using their corresponding GPS coordinates. Identifying high-demand locations at the individual level could be impacted by personal factors (e.g., observation level, health condition, and previous experience). Therefore, the authors performed spatial clustering analysis using hot spot analysis to identify the locations on the path where multiple participants interacted with high-demand conditions. Hot spot analysis is a GIS-based mapping cluster tool for identifying and visualizing locations of statistically significant clusters using Getis-Ord Gi* statistics (Ord & Getis, 1995). This process was also repeated for the detected low-demand samples.
Results and Discussion
The walking activity affected the stability and functioning of the EEG sensor for five participants. Participant seven did not have valid PPG, EDA, plantar pressure sensor, and IMU data for analysis.
Informativeness of Bodily Responses to Varying Environmental Demand
Physiological response
In this study, two main physiological responses were collected and analyzed—PPG and EDA. The PPG and EDA features that gained the most information are presented in Tables 8 and 9, respectively.
Most Informative PPG Features.
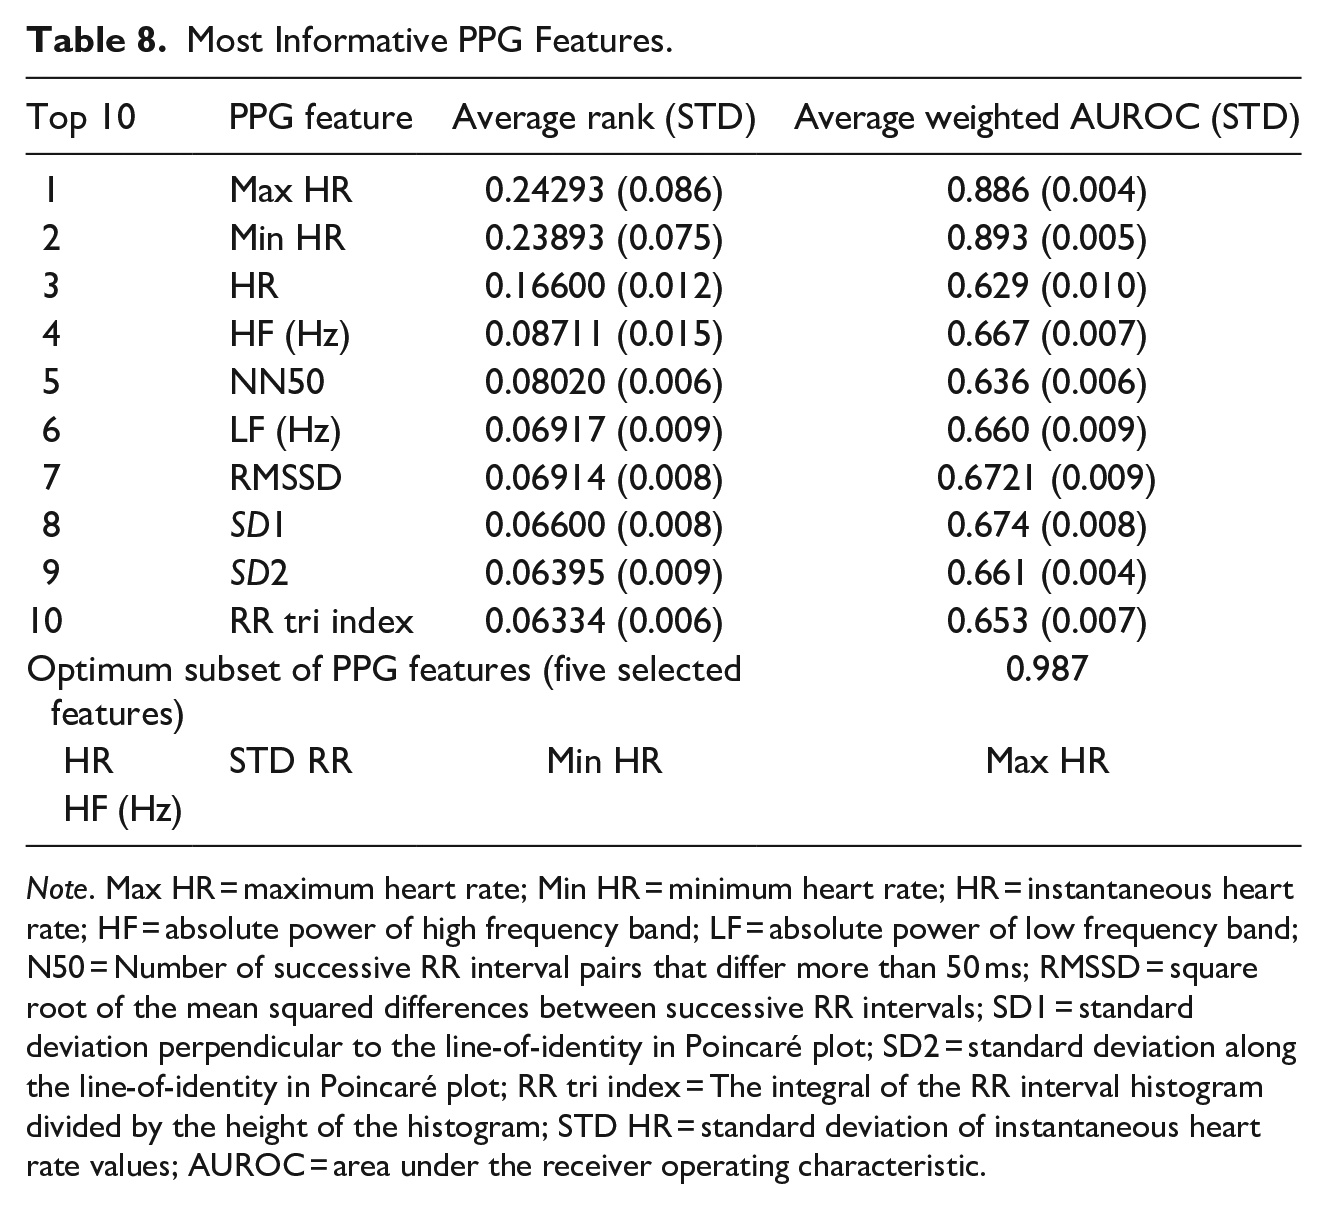
Note. Max HR = maximum heart rate; Min HR = minimum heart rate; HR = instantaneous heart rate; HF = absolute power of high frequency band; LF = absolute power of low frequency band; N50 = Number of successive RR interval pairs that differ more than 50 ms; RMSSD = square root of the mean squared differences between successive RR intervals; SD1 = standard deviation perpendicular to the line-of-identity in Poincaré plot; SD2 = standard deviation along the line-of-identity in Poincaré plot; RR tri index = The integral of the RR interval histogram divided by the height of the histogram; STD HR = standard deviation of instantaneous heart rate values; AUROC = area under the receiver operating characteristic.
Most Informative EDA Features.
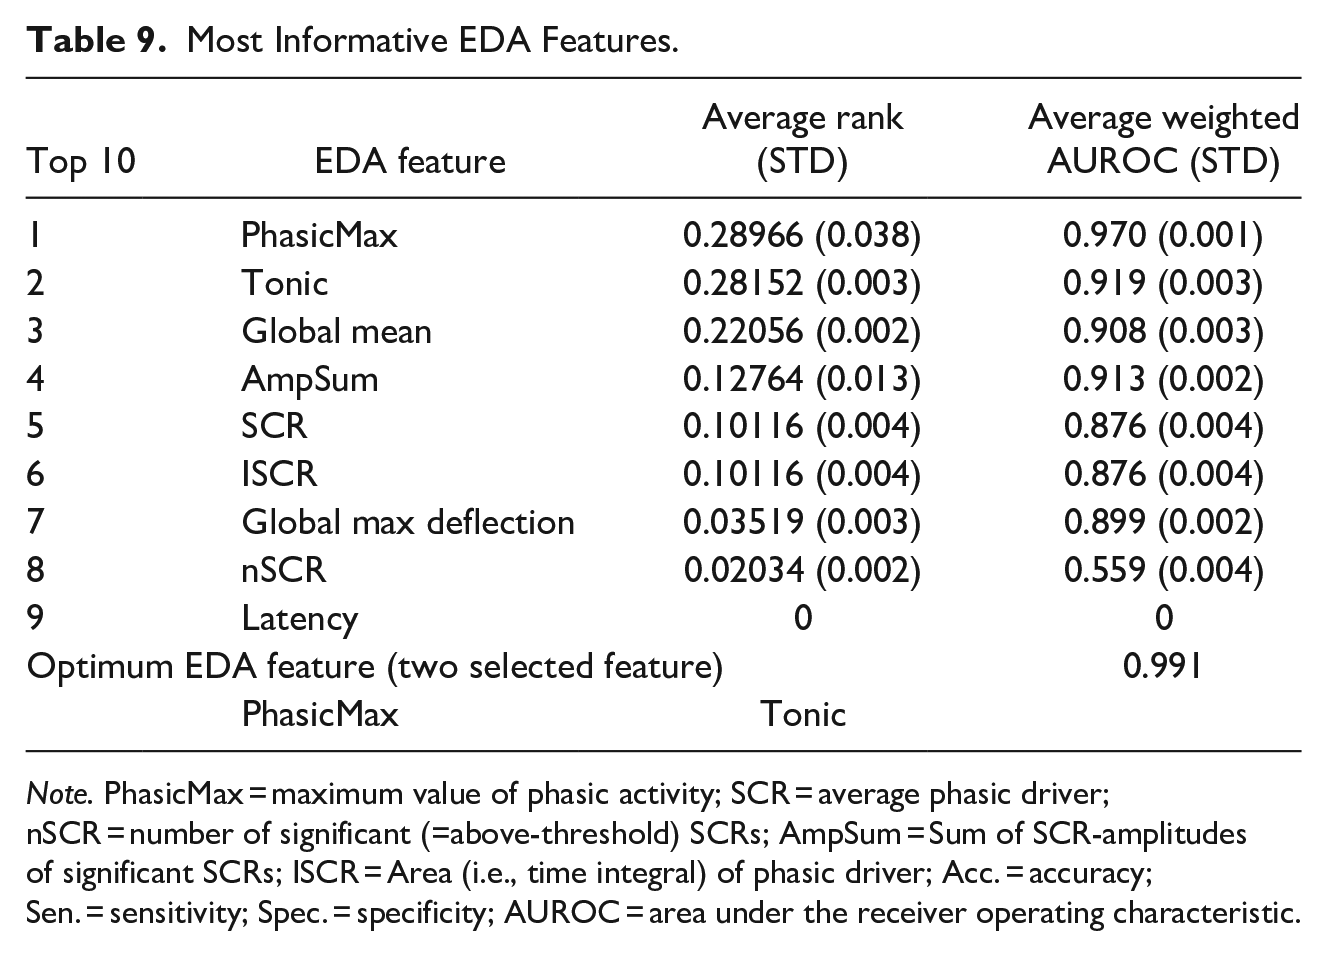
Note. PhasicMax = maximum value of phasic activity; SCR = average phasic driver; nSCR = number of significant (=above-threshold) SCRs; AmpSum = Sum of SCR-amplitudes of significant SCRs; ISCR = Area (i.e., time integral) of phasic driver; Acc. = accuracy; Sen. = sensitivity; Spec. = specificity; AUROC = area under the receiver operating characteristic.
For PPG features, maximum HR (rank = 0.243, AUROC = 0.886) and minimum HR (rank = 0.239, AUROC = 0.893) gained the most information about older adults’ interactions with environmental conditions with varying demand. It is important to mention the inconsistency reported in previous studies considering the use of HR and HRV to represent people’s interactions with the environment. For example, some studies reported that HR and HRV contain relevant information, and other studies reported otherwise (Birenboim et al., 2019; Triguero-Mas et al., 2017). In this study, HR was ranked third but did not gain sufficient information about older adults’ experiences in the environment (rank = 0.166, AUROC = 0.629). Similarly, all HRV features (Table 8) gained very little information about older adults’ experiences in the environment. For example, the highest-ranked HRV feature is HF(Hz) achieved a rank score of 0.087 and AUROC of 0.667. A plausible explanation for this is that the physiological cardiovascular bodily responses are more susceptible to physical activity, and the influence of the walking activity in the experiment might dominate subtle environmental effects.
The findings from this study clarify the inconsistency in the reliability of HR and HRV features in measuring physiological responses by taking into account the information gained by several features. The AI-based information mining model further provided a subset of five HR and HRV features that can collectively gain more information than any single feature. This feature subset (Table 8) attained an AUROC of 0.987. The performance of this feature subset can be attributed to the fact that each feature gained specific information about older adults’ experience in the environment. For example, minimum HR and maximum HR captures environmental conditions that stimulate a state of serenity and stress, respectively (Kreibig, 2010). HR, LF/HF, and SD2/SD1 reflect the parasympathetic-sympathetic balance (Healey & Picard, 2005; Triguero-Mas et al., 2017). The implication drawn from the results is that future studies should consider a subset of features instead of a specific feature in interpreting physiological cardiovascular bodily responses in the outdoor environment.
Considering the EDA features (Table 9), PhasicMax gained the most information about older adults’ interaction with environmental conditions with varying demand, with a rank score of 0.230 and AUROC of 0.970. Although several features gained sufficient information (except nSCR and Latency), only PhasicMax and Tonic were subsequently selected as the optimum features. This signifies that the AI-based information mining model was able to avoid over-fitting by discarding redundant EDA features in order to reduce computational cost and time while achieving high performance. Furthermore, the results support the growing consensus that the phasic component of the EDA signal represents an individual’s response to discrete environmental stimuli (Birenboim et al., 2019; Chen et al., 2018).
Behavioral response
The foot plantar pressure distribution and acceleration of both left and right feet were observed while older adults interacted with the environment. The foot plantar pressure and acceleration features that gain the most information are presented in Tables 10 and 11, respectively.
Most Informative Pressure Sensor Features.
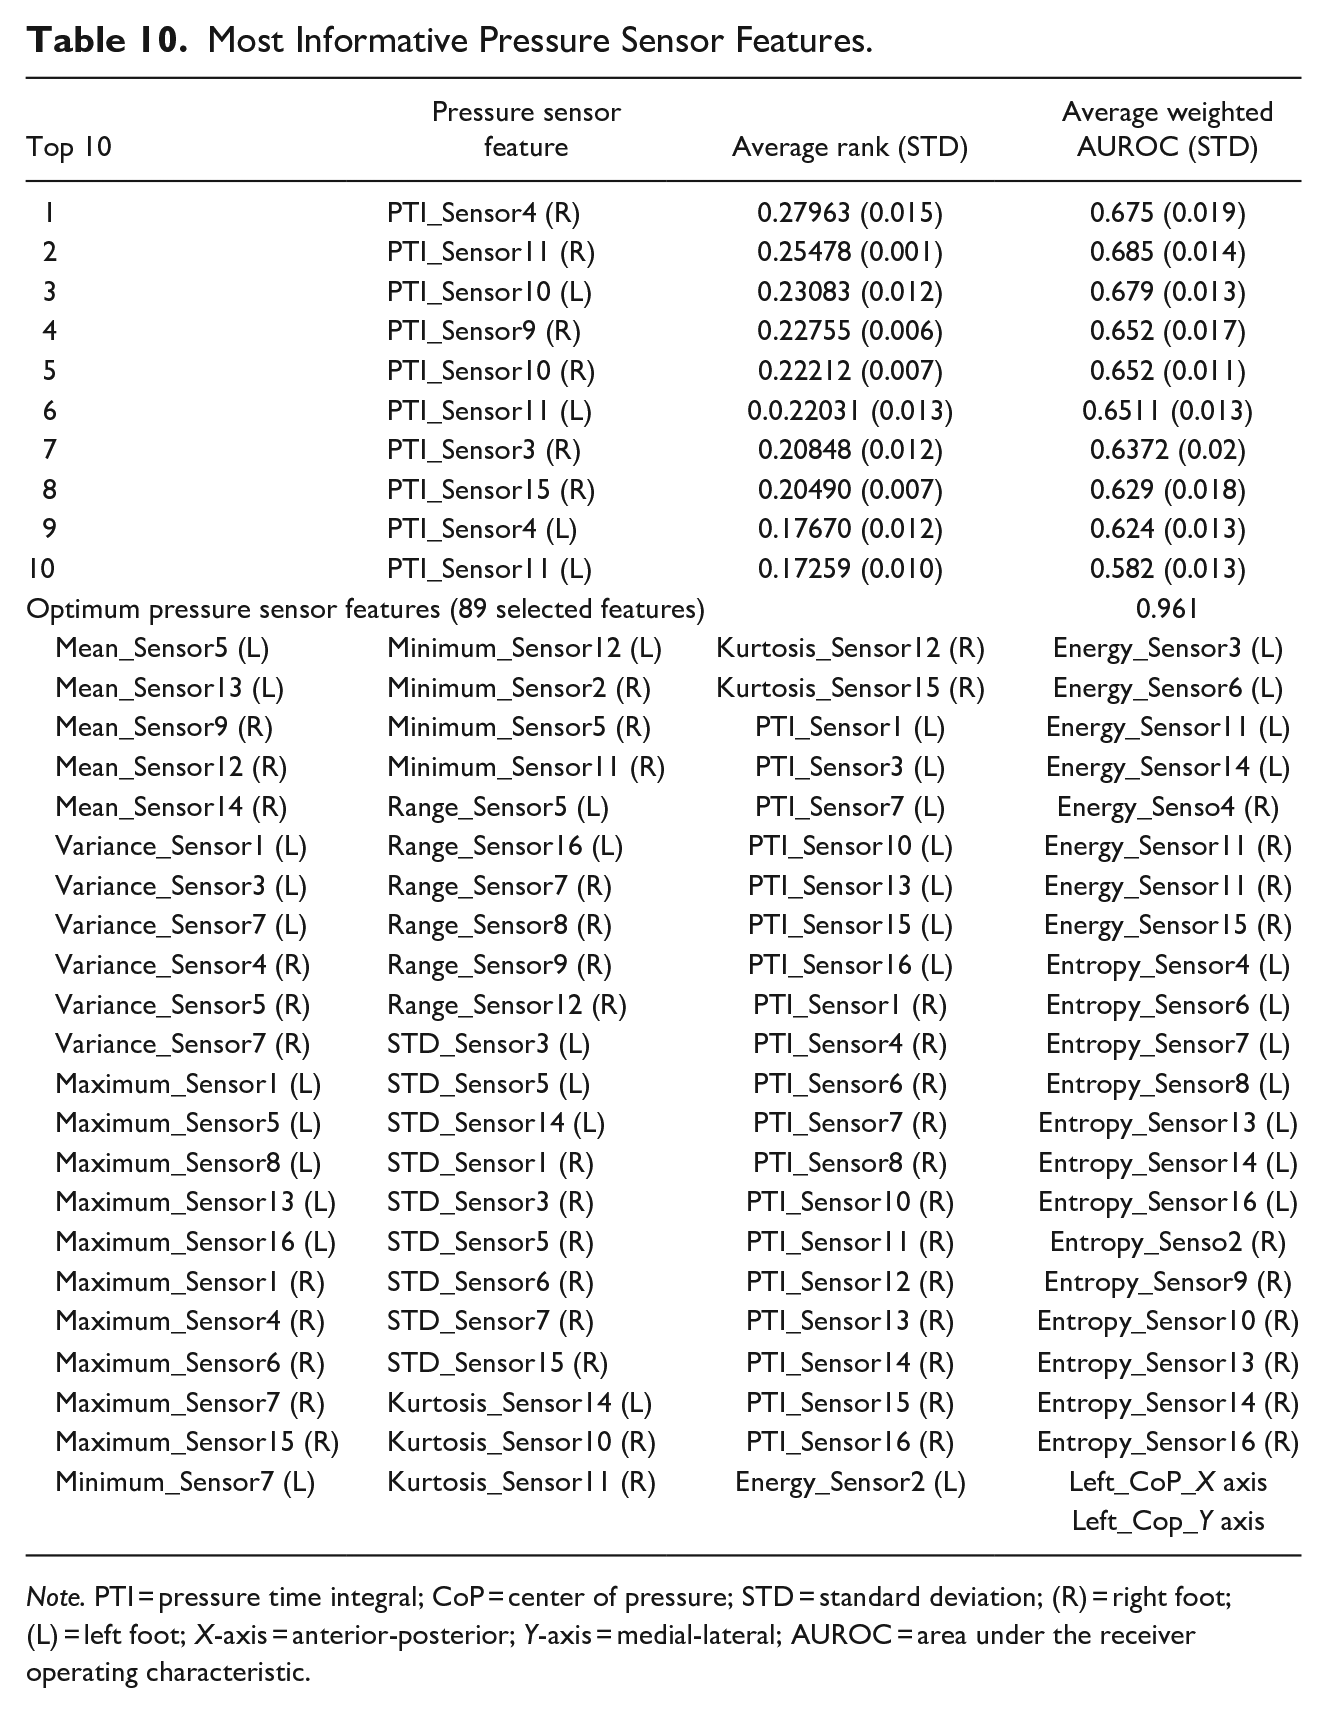
Note. PTI = pressure time integral; CoP = center of pressure; STD = standard deviation; (R) = right foot; (L) = left foot; X-axis = anterior-posterior; Y-axis = medial-lateral; AUROC = area under the receiver operating characteristic.
Most Informative Acceleration Signal Features.
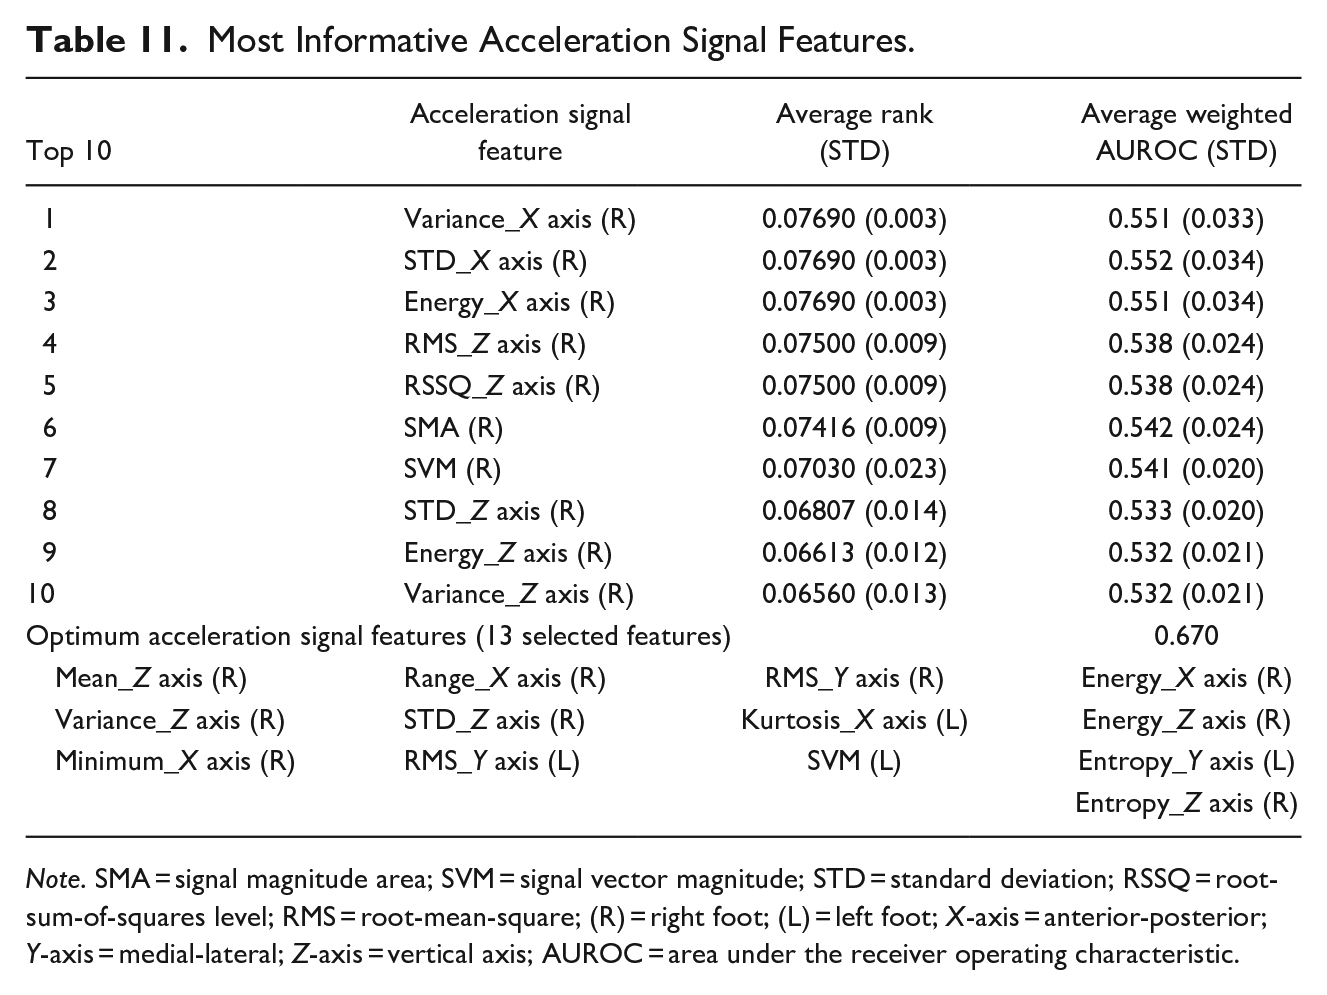
Note. SMA = signal magnitude area; SVM = signal vector magnitude; STD = standard deviation; RSSQ = root-sum-of-squares level; RMS = root-mean-square; (R) = right foot; (L) = left foot; X-axis = anterior-posterior; Y-axis = medial-lateral; Z-axis = vertical axis; AUROC = area under the receiver operating characteristic.
For the foot plantar pressure features (Table 10), pressure-time integral (PTI) gained the most information about older adults’ interactions with environmental conditions with varying demand with a rank score of 0.280 and AUROC of 0.675. All the top 10 ranked features are the PTI in different sensor locations. Although the PTI features were not very informative, the AI-based information mining model identified a feature subset (comprised of 89 plantar pressure features) that was able to gain more information about older adults’ experiences in the environment. The feature subset achieved an AUROC of 0.961.
For the acceleration features (Table 11), Variance X-axis (rank = 0.077, AUROC = 0.551) and STD X-axis (rank = 0.077, AUROC = 0.552) were the most informative features. The AI-based information mining model identified a subset of 13 acceleration features that gained more information than any single acceleration feature with an AUROC of 0.670.
Generally, the acceleration signal and the foot plantar pressure features performed poorly in gaining information about older adults’ experiences in the environment. The poor performance can be attributed to the characteristics of the population being studied—older adults aged 65 or above. Gait usually changes with aging (Salzman, 2010); as a result, older adults tend to have diverse abnormal gait. The diverse abnormal gait affected the informativeness of the foot plantar and acceleration features. The gait abnormality among older adults affected the acceleration signal more than the foot plantar pressure signal. This is because the IMU used to extract the acceleration features tracked movement in three-axes. The X-axis (anterior-posterior) and Y-axis (medial-lateral), as shown in Figure 4, are directed toward space and are more susceptible to gait abnormality among older adults. In contrast, all the foot plantar pressure sensors were directed toward the ground surface and were able to gain distinct information from the ground surface. For example, the plantar pressure distributions between a person’s foot and footpaths with tarmac, paving slab, or gravel surfacing material are different. This distinctive information from the ground surfacing reflected in the Z-axis (vertical axis) of the acceleration signal which is directed toward the ground surface. As a result, the top 10 most informative acceleration features and the optimum subset of informative acceleration features were dominated by features extracted from the Z-axis. Nevertheless, researchers should be cautious when using older adults’ gait to represent their interactions with the environment because older adults’ gait abnormality can overwhelm the result.
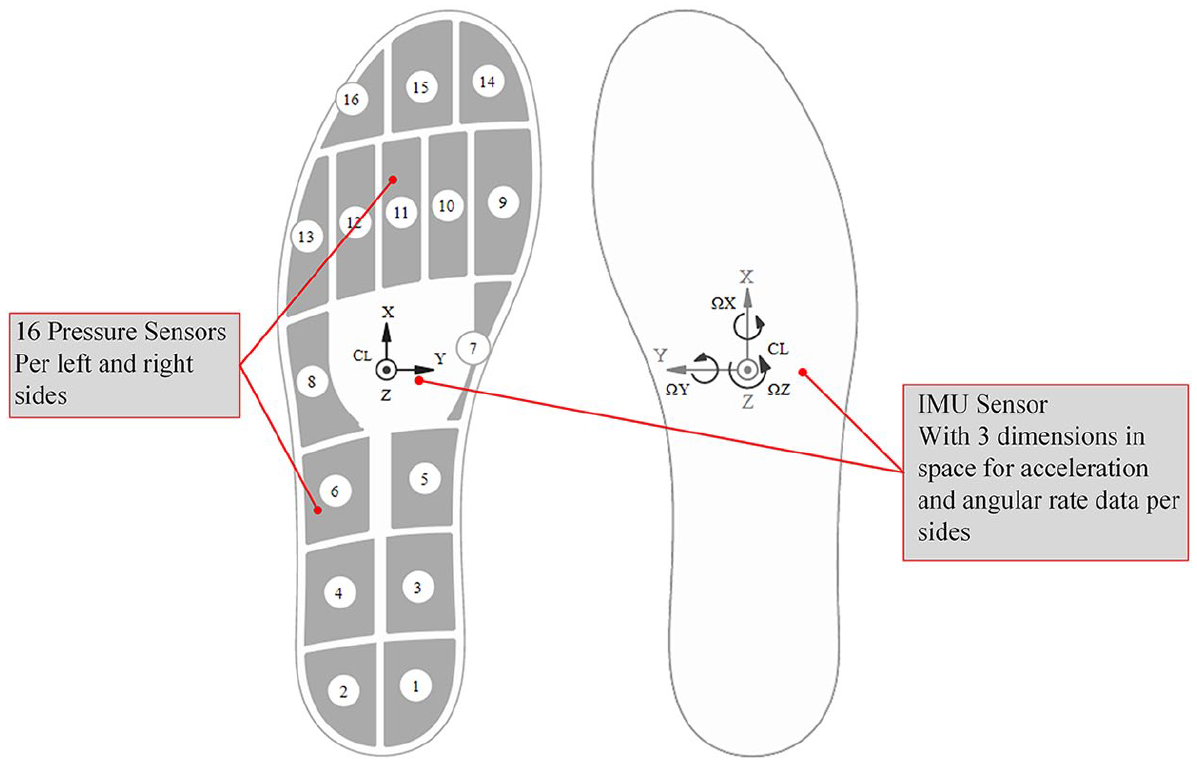
Foot plantar insole sensor.
Cognitive response
All the EEG features gained insufficient information about older adults’ experience in the environment. The highest-ranked EEG feature is variance in the F3 channel, achieving a rank score of 0.121 and an AUROC 0.615 (Table 12). Almost all the top 10 ranked EEG features captured only the activity of the cortical neurons in the frontal lobe (Figure 5). The low performance of the EEG features proves that the urban environment is becoming more complex and cognitively demanding to older adults. Therefore, the brain will require more cognitive resources to gain sufficient information. As a result, the proposed AI-based information mining model identified a subset of 107 features (Table 12) that gained more information than any single EEG feature. The feature subset achieved an AUROC of 0.940. The optimum subset of EEG features is dominated by features extracted from the frontal lobe, followed by the occipital lobe, parietal lobe, and temporal lobe.
Most Informative EEG Features.
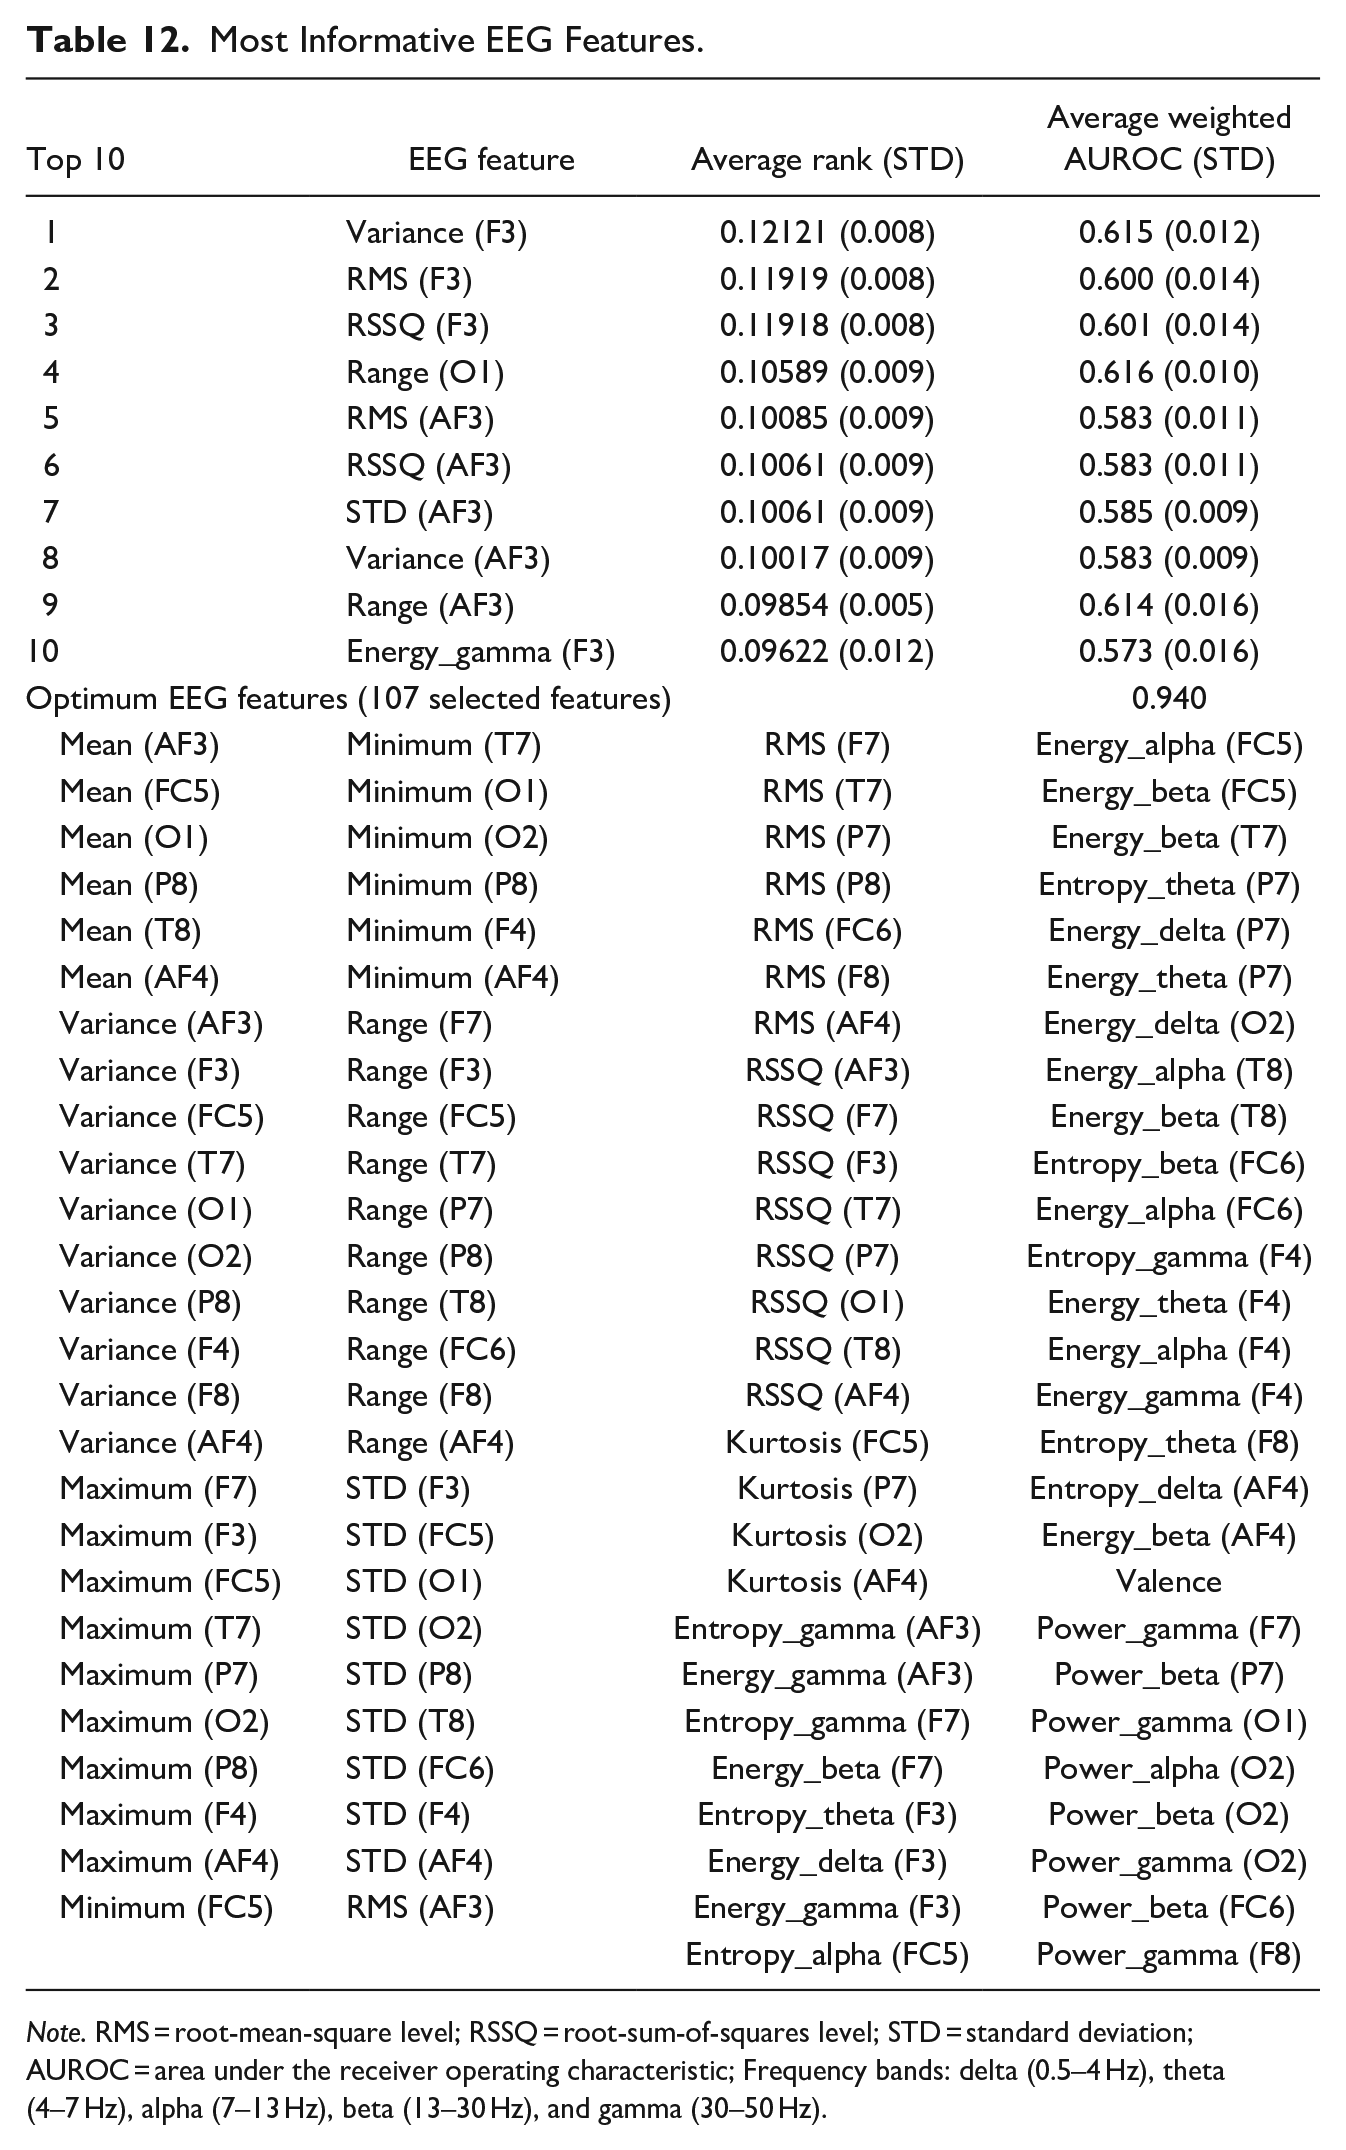
Note. RMS = root-mean-square level; RSSQ = root-sum-of-squares level; STD = standard deviation; AUROC = area under the receiver operating characteristic; Frequency bands: delta (0.5–4 Hz), theta (4–7 Hz), alpha (7–13 Hz), beta (13–30 Hz), and gamma (30–50 Hz).
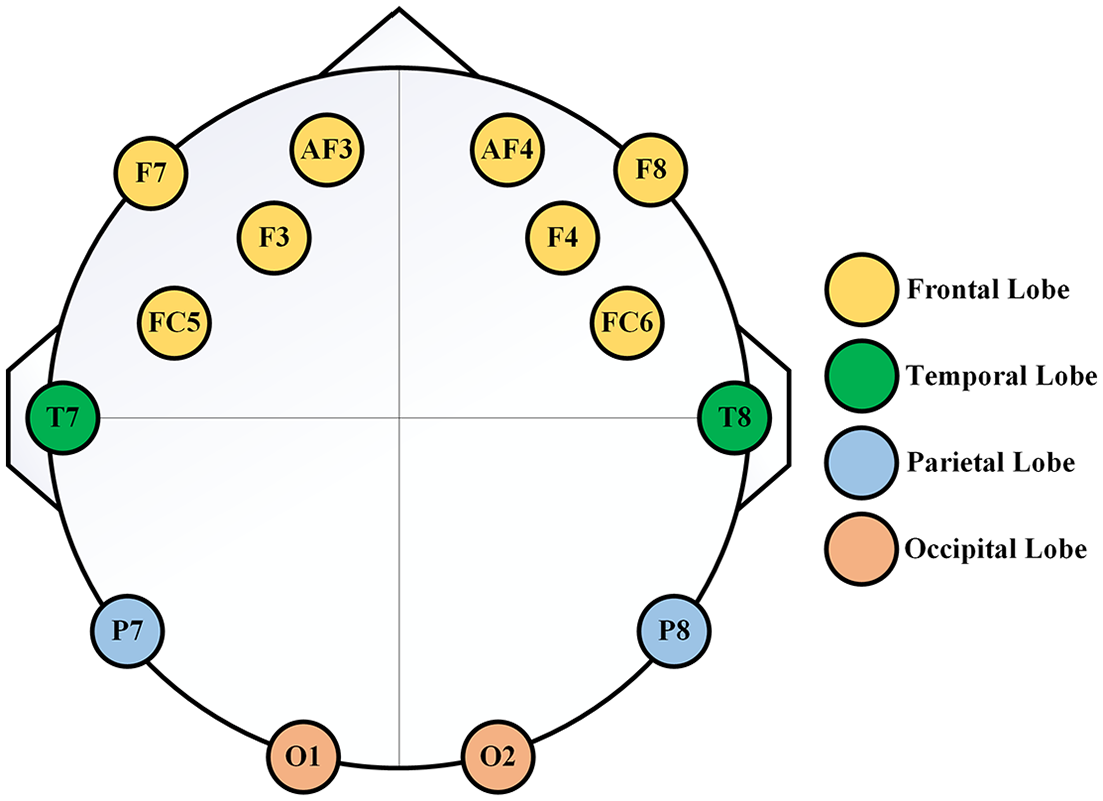
Distribution of the EEG channels across the scalp.
Considering the frequency bands, the optimum EEG feature subset is dominated by the gamma band, followed by the beta band, alpha band, theta, and delta band. The higher frequency band (gamma and beta) correlates with heavy mental loads such as concentration, anxiousness, and stress; the alpha band correlates with a relaxed state of mind; the lower frequency bands (delta and theta) correlate with less intense brain function (Bailey et al., 2018). The results confirmed that walking in different environmental conditions activates millions of cortical neurons and produces an electrical field that can be measured from the human scalp using wearable EEG. The information gained by the cortical neurons is encoded in EEG signal amplitudes, specific frequency bands, and different brain regions; this explains why today’s urban environment is more cognitively demanding. Furthermore, different environmental conditions are associated with distinctive brain activity patterns, which means that humans interact differently with varying environmental conditions.
Detected Demanding Environmental Conditions
Performance of environmental demand detection model
The authors only focused on older adults’ physiological responses (i.e., PPG and EDA) in developing the environmental demand detection model because their behavioral and cognitive responses were significantly impacted by their gait abnormality and EEG sensor instability. Among all the five deployed algorithms, the Random Forest algorithm produced the best performance in discriminating between physiological response to high demand environmental conditions and low demand environmental conditions (AUROC of 98.2% for the PPG data and 96.5% for the EDA data). Table 13 shows the validation performance of deployed algorithms. The confusion matrix of the best performing Random Forest algorithm among the 10 randomly equally distributed datasets is presented in Figure 6.
Performance of the Environmental Demand Detection Algorithms.
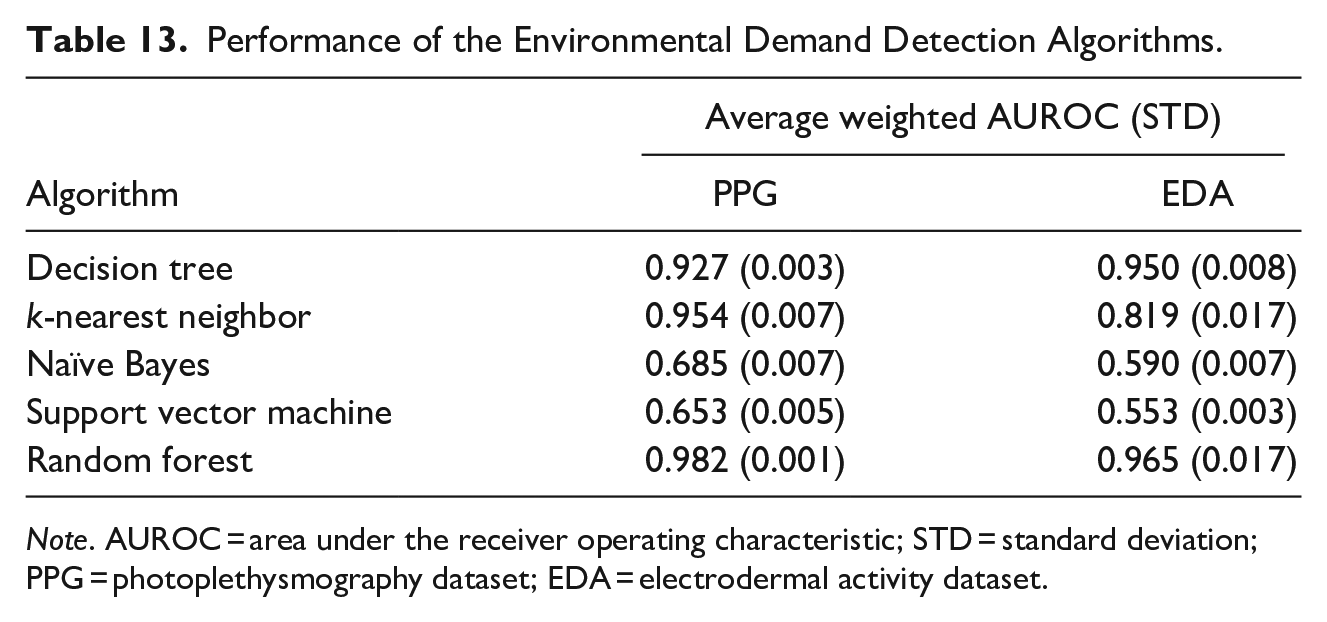
Note. AUROC = area under the receiver operating characteristic; STD = standard deviation; PPG = photoplethysmography dataset; EDA = electrodermal activity dataset.
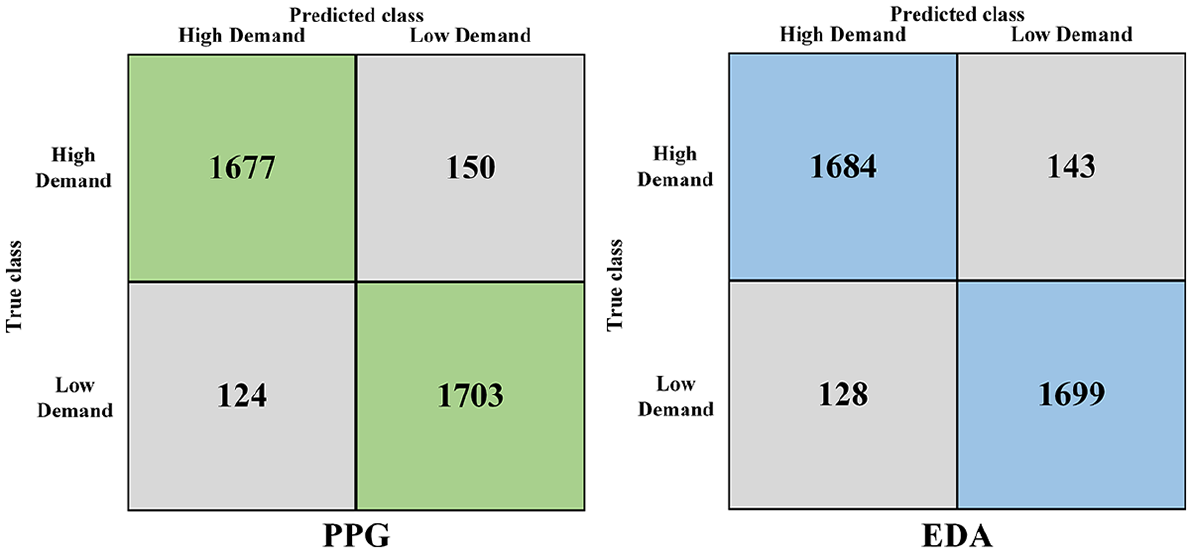
Confusion matrix of best performing random forest algorithm.
Hot spots detected on the path
Based on the developed Random Forest algorithm, each of the 10 older adults’ PPG and EDA responses collected during the environmental walk was classified into high demand and low demand responses. The multiple older adults’ high-demand samples were mapped on the path to perform a hot spot analysis estimated at a 95% confidence level. In order to compare and confirm the results, a separate hot spot analysis was conducted on the PPG high demand sample and EDA high demand samples. Out of curiosity, the authors also performed a hot spot analysis on the low-demand responses. The locations of the detected hot spots are shown in Figure 7. A total of four significant clusters of high-demand spots (PH1, PH2, [PH3 and EH1], PH4) were identified on the path. PH1, PH2, PH3, and PH4 were detected from the PPG samples, and EH1 was detected from the EDA samples. PH3 and EH1 were identified in the same location. High-demand spot PH1 is located on path Segment A—an alley. The spot has several path obstructions, and the path condition was wet and slippery. High-demand spot PH2 is located at a gas and service station on path Segment C—pedestrian-vehicle interaction is expected at this spot. The crosswalk (with pedestrian and vehicles traffic) on path Segment D was detected as a high-demand spot from both the PPG (PH3) and EDA (EH1) data analysis. High-demand spot PH4 is located in a subway with dominant graffiti features on path Segment H. This implies that the environmental features or conditions at these high-demand hot spots could result in stress and/or limit the mobility of older pedestrians using this path.
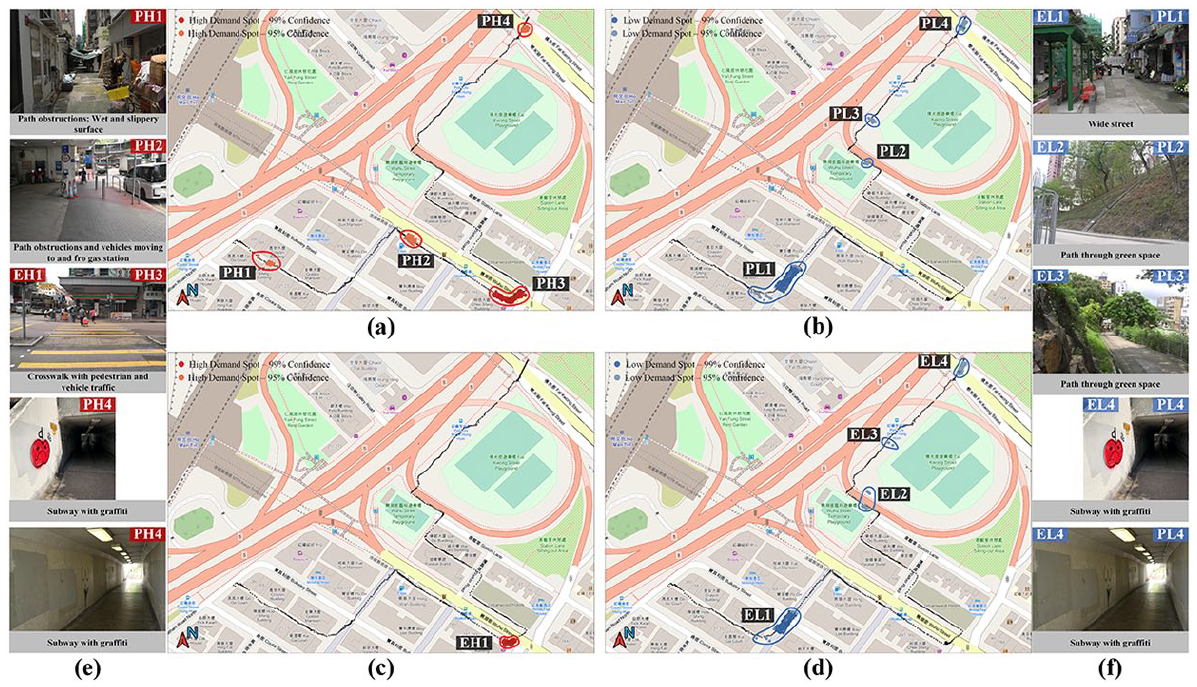
Location of detected high-demand and low-demand spot.
Four significant clusters of low demand spots ([PL1 and EL1], [PL2 and EL2], [PL3 and EL3], and [PL4 and EL4]) were identified on the path. PL1 to PL4 and EL1 to EL4 were identified from PPG and EDA samples, respectively. PL1 and EL1 were identified on path Segment B—a wide street. PL2 and EL2 and PL3 and EL3 were located on a well-maintained footpath through a green space on path Segment G. PL4 and EL4 located in a subway at Segment H were detected as low demand.
Implications
The findings of this study reveal that how people interact with the environment is different depending on the bodily responses used to represent this interaction. For example, while the PPG signal captured environmental demands at four different locations (PH1, PH2, PH3, and PH4, in Figure 7a and e), the EDA signal captured only the environmental demand at one location EHI (Figure 7c and e). The subway at Segment H was detected as high demand (PH4, Figure 7a and e) and low demand (PL4 and EL4, Figure 7b, d, and e); this occurrence resulted from the model misclassifying people’s bodily responses (note that the model achieved 98.2% and 96.5% performance for PPG and EDA data, respectively). At the individual level, it could mean that the subway with graffiti features imposed different demand levels on the participants. Another plausible explanation could be that some participants spent little time experiencing the subway, so there is limited time for the features to reflect in their body responses. Because the source of the physiological data influenced the hotspot detection, it is possible that fusing multiple bodily responses to represent people’s interaction with the environment could provide complementary and supplementary data that improve the performance of the classification model and the effectiveness of the people-centric sensing.
This study shows that assessing the walkability or quality of the built environment features using either a site audit (i.e., EAST-HK, SWEAT-R, or other audit tools) or people-centric sensing (bodily responses) alone does not provide a holistic perspective of the built environment for older adults. It is of paramount importance to measure both the exposure environment and the outcomes of the exposure to the environment in order to understand the potential effect of the built environment on people (Cerin et al., 2011). These findings indicate that the site audit is more accurate at assessing the exposure environment, but it is limited in assessing the outcome of the exposure. However, the people-centric sensing is more accurate at assessing the outcome of the exposure but limited in assessing the exposure environment. For instance, the site auditors can identify demanding environmental conditions, but they cannot differentiate between environmental features that may be demanding for one person and non-demanding for another person. People-centric sensing can determine a person’s reaction to different environmental conditions or how different people react to the same environmental condition but cannot provide a detailed assessment of the underlying environmental conditions.
The combined use of the site audit and people-centric sensing have the potential to improve walkability assessment in cities and communities. With the burgeoning smart cities movement, municipal officials, policymakers, and engineers are enthusiastic about designing, constructing, and managing their cities and communities based on data-driven methods. People-centric sensing has the potential to provide computational and data-driven support to link the built environment to cyberspace and facilitate a continuous and timely assessment of the built environment. Trained auditors can plan, monitor, and prioritize their assessment based on people-centric sensing.
Conclusion
This study presented: (1) an information mining-based approach to assess the informative of older adults’ physiological, behavioral, and cognitive responses to outdoor conditions with varying environmental demands and (2) a machine-learning model and hot spot analysis-based approach to detect outdoor conditions with high or low environmental demand from each older adult’s bodily response. Older adults’ physiological, behavioral, and cognitive responses were monitored using a smart wristband, wearable insole pressure sensors, and EEG sensor during an outdoor environmental walk. Applying the information mining-based approach to older adults’ bodily responses showed that representing people’s interactions with informative modalities and features could improve the effectiveness of people-centric sensing. Among all the trained machine learning algorithms, Random Forest best discriminates between physiological response to high demand environmental conditions and low demand environmental conditions (AUROC of 98.2% for the PPG signal and 96.5% for the EDA signal). The hot spot analysis identified four significant clusters of high-demand spots and low-demand spots. The high-demand spots examination revealed the environmental features or conditions that could result in stress and/or limit the mobility of older pedestrians using this path. Complementing existing site audit tools (such as EAST-HK and SWEAT-R) with people-centric wearable sensing can provide a holistic and timely assessment of the built environment for older adults.
Although the experiment findings are very promising, several limitations need to be mentioned. The authors acknowledge that the number of older adults that participated in the study is relatively small, and future studies should include larger and more diverse participants. The unequal number of male and female participants in the study may affect the results because gender can significantly impact human perception and physiological, behavioral, and cognitive responses to environmental conditions. The ground truth of demanding environments was only based on the EAST-HK and SWEAT-R audit tools. Future studies should consider supplementing the audit tools with subjective measures on demandingness collected from the participants. Although the wearable sensors deployed in this study were demonstrated to the participants to increase their familiarity and acceptance of the sensors, there is a possibility that wearing some of the sensors, particularly, the EEG headset, in public may have negatively influenced the data collection. Unlike the wristband and insole sensor, the EEG headset is not a subtle device. The public’s reactions to the participants wearing this sensor may have caused discomfort and stress to the participants. This shows that the wider public’s perception and acceptance of wearable sensors are critical for effective people-centric sensing in outdoor environments. The EEG headset used in this study had wet electrodes, which means that a conductive gel must be applied between the electrode and the scalp for a reliable measurement. Because this study was conducted in a naturalistic environment, the conductive gel might have dehydrated, which might have affected the stability of the EEG sensor of some participants. Future studies should explore the possibility of using other types of electrodes.
Despite these forward steps in people-centric wearable sensing, there is still room for improvement. The current environmental demand detection model was developed separately for each modality (i.e., PPG and EDA). The future work of this study will be extended to develop a single environmental demand model that learns and integrate the information from both PPG and EDA signal using a multimodal information fusion strategy. Such a learning strategy could improve the generalization and performance of the environmental demand model. In addition, the current learning approach is based on supervised learning, which requires sufficient labeled data for training and could become impractical in large-scale applications. Future works will focus on using semi-supervised or unsupervised learning, which requires smaller labeled data to improve the effectiveness of people-centric sensing in large-scale applications.
Footnotes
Acknowledgements
The authors acknowledge the Institute of Active Ageing, in particular, Prof. Daniel W. L. Lai and Mr. Jeffrey Chan for their support in participant recruitment. The authors also acknowledge Dr. Jackie Yang and Dr. Michael A. Adabre, for their help in data collection.
Declaration of Conflicting Interests
The author(s) declared no potential conflicts of interest with respect to the research, authorship, and/or publication of this article.
Funding
The author(s) disclosed receipt of the following financial support for the research, authorship, and/or publication of this article: This study was funded by the Research Grant Council of Hong Kong through the Hong Kong Ph.D. Fellowship Scheme PF17-02405; and the Department of Building and Real Estate, The Hong Kong Polytechnic University.