
Abstract
Business centers offer flexible shared workspaces and facilities to multiple organizations, which provide more freedom in where to interact with others. However, knowledge on where different types of organizational interactions take place in business centers and how this behavior is influenced is still lacking. Therefore, the aim of this study is to analyze the location choice for different types of face-to-face interactions. Data, collected by means of an experience sampling method (ESM), were analyzed using a mixed multinomial logit (MMNL) model. Results showed that interorganizational interactions take place less frequently at workspaces or formal meeting spaces and more frequently at shared spaces such as the coffee corner or canteen. These interactions are also more likely to be influenced by the physical work environment, as these interactions were found to be mainly coincidental. Results of this study could help office designers with regard to stimulating face-to-face interactions among organizations.
Keywords
More and more organizations are aware of the importance of offering an attractive and supportive work environment to attract and retain talent (Earle, 2003), and there is a growing interest in people’s behavior in different workplace settings (e.g., Vischer, 2008), specifically with regard to workers’ (social) networking behavior (e.g., Sailer, Koutsolampros, Austwick, Varoudis, & Hudson-Smith, 2016; Toker & Gray, 2008). Despite the advancements in communication technology, face-to-face interactions at work remain highly important to increase productivity and job satisfaction and to build trust among workers that eventually leads to better working relationships (e.g., C. Brown et al., 2014; Stryker & Santoro, 2012). Subsequently, this can help to increase the sharing of interpersonal information or knowledge, innovative capabilities of organizations, and organizational success (e.g., Nardi & Whittaker, 2002; Toker & Gray, 2008).
The opportunity for networking with other organizations is one of the main advantages of business centers according to their occupants (Bøllingtoft, 2012; Ketting, 2014). A business center can be described as an office building with a number of spaces and possibly some common facilities and/or services, which are offered to multiple organizations (adapted from Calder & Courtney, 1992; Weijs-Perrée, Appel-Meulenbroek, De Vries, & Romme, 2016). Over the past decades, the number of business centers has increased globally (e.g., Hackett & Dilts, 2004; Weijs-Perrée et al., 2016). Many of these business centers are branded as interactive work environments (e.g., Van Meel & Brinkø, 2014). However, it is still not clear whether and where in these buildings organizations interact and how this behavior is facilitated through their physical work environment.
Previous workplace research on face-to-face interactions within large organizations in single-tenant offices showed that people’s workspace (i.e., desk/workstation), shared workplaces, and meeting spaces are important locations for face-to-face interactions among workers (e.g., Hua, Loftness, Heerwagen, & Powell, 2011; Kabo, Hwang, Levenstein, & Owen-Smith, 2013; Kastelein, 2014; Peponis et al., 2007). Research on face-to-face interactions between smaller organizations (mostly small and medium-sized enterprises [SMEs] or freelancers/self-employed workers) in the context of business centers is still limited. Especially for these smaller organizations, networking with other organizations is important to expand and increase their performance (e.g., Park, Shin, & Kin, 2010). Also, many business centers offer more flexible workplaces and shared facilities, which provide more freedom in where to interact with others than in the fixed and traditional layout of many single-tenant offices used in most previous studies. Furthermore, previous studies also mainly focused on users’ perceptions of interactive behavior or on the frequency of interacting (e.g., Bøllingtoft & Ulhøi, 2005; Peponis et al., 2007) and not on face-to-face interaction behavior (e.g., type or activities, etc.) or by using real-time data to minimize memory effects. Also, knowledge about where people interact with others in business centers is lacking. To obtain more insight regarding employees’ inter- and intraorganizational interaction behavior and where this behavior takes place in business centers, further research is needed. The purpose of this study is to address these research gaps by analyzing the location type choice for inter- and intraorganizational interactions in business centers. Results of this study could help office designers to create interactive work environments that stimulate different types of face-to-face interactions among organizations.
Business Center Concepts
Four types of business centers are distinguished in previous research, namely, regular business centers, serviced offices, coworking spaces, and incubators (Calder & Courtney, 1992; Ketting, 2014; Parrino, 2015; Van den Berg & Stijnenbosch, 2009; Weijs-Perrée et al., 2016). Regular business centers have no specific objectives, offer a low number of shared spaces, and have a low service level. Serviced offices are mostly oriented on SMEs or self-employed people and offer a lot of shared spaces with a high service level (Harris, 2015). Next, coworking spaces have the main objective to stimulate knowledge sharing and to create a working community (e.g., Fuzi, 2015; Garrett, Spreitzer, & Bacevice, 2014; Sykes, 2014). Social interactions and knowledge sharing between tenants are often stimulated by coworking hosts or managers who organize networking activities (Parrino, 2015). Coworking spaces are mainly shared work environments that are highly accessible, whereby office space and meeting spaces are offered based on low rental prices and flexible rental contracts (Spinuzzi, 2012; Sykes, 2014; Weijs-Perrée, Van de Koevering, Appel-Meulenbroek, & Arentze, 2019). They are occupied by a heterogeneous group of workers (e.g., self-employed workers, freelancers, SMEs, employees of large firms; Capdevila, 2015; Fuzi, 2015; Gandini, 2015; Spinuzzi, 2012). Compared with regular business centers, coworking spaces offer more informal spaces such as coffee corners, a kitchen, meeting rooms, printer and copying facilities, and lounge spaces (e.g., Kojo & Nenonen, 2014; Schopfel, Roche, & Hubert, 2015; Sykes, 2014).
Finally, incubators also have the aim to stimulate networking among tenants (i.e., high-tech start-up enterprises; e.g., Cooper, Hamel, & Connaughton, 2012; Grimaldi & Grandi, 2005). However, this is a very specific business center concept that mainly aims to accelerate the successful development of start-up enterprises and support them in the development of innovative products (e.g., Aernoudt, 2004; Lesáková, 2012; Peña, 2004). Previous studies have already analyzed networking behavior in this type of business center concept (e.g., Bøllingtoft & Ulhøi, 2005; Cooper et al., 2012). Therefore, incubators are not considered in this study.
This study focuses specifically on coworking spaces and serviced offices, that is, business centers that offer shared spaces, facilities, and services with the objective to stimulate networking and knowledge sharing among occupants. Coworking spaces distinguish themselves from serviced offices by stimulating networking and collaboration between occupants even more (Kojo & Nenonen, 2014). However, the distinction between the two concepts has become blurred as many serviced offices increasingly offer office space for coworking as part of their building, so both concepts will be considered in this study. Previous studies on serviced offices focused mainly on the supply side, such as valuation issues (McAllister, 2001) and strategies for providing bundles of services for serviced office users (Bröchner, Olsson, & Sinik, 2004). On the contrary, studies on coworking spaces focused on topics such as dynamics of innovation (Capdevila, 2015), contribution of coworking spaces for entrepreneurship in the region (Fuzi, 2015), and the evolution of coworking spaces (Kojo & Nenonen, 2017). Despite the increased popularity of these new office concepts, empirical research on user behavior in these offices is still lacking.
Occupants’ Face-to-Face Interaction Behavior
Social interaction can be described as “a process by which people act and react to those around them” (e.g., Gerdenitsch, Scheel, Andorfer, & Korunka, 2016, p. 2). Two types of interactions can be distinguished, namely, social (informal) and business (formal) interactions (Cooper et al., 2012; Marouf, 2007; Peponis et al., 2007). In addition, Marouf (2007) describes social interactions at work as informal interactions during coffee breaks, lunches, dinners, and so on etc. and business interactions as work-specific interactions. In this study, the definition of social and business interactions by Marouf (2007) is used. As social and business-related interactions differ with regard to their activities, they will probably also differ with regard to the location of the interaction, as demonstrated for single-tenant offices by Hua et al. (2011). They show that individual workstations, kitchen or coffee areas, and meeting rooms are used the most for casual conversations (i.e., social interactions), while for collaborative work (i.e., business-related interactions) workers more often used closed meeting rooms, individual workstations, and open meeting areas. Desks or meeting rooms are also recognized by other studies to be important locations for business-related interactions (e.g., Appel-Meulenbroek, de Vries, & Weggeman, 2017; Staplehurst & Ragsdell, 2010). In addition, Davenport and Bruce (2002) show that a café area is most often used to share personal expertise (e.g., do-it-yourself tips) or work gossip and not to share people’s work expertise. Therefore, we formulate the following hypothesis for business centers (coworking spaces and serviced offices), which is similar to results of previous studies in single-tenant offices:
The study by Cooper et al. (2012) suggests that the main activities of face-to-face interactions in incubators are small talk, brainstorming, giving and receiving advice, and feedback sessions. Another study in single-tenant offices found that meetings and discussions are important face-to-face interaction activities for sharing knowledge within an organization (Kastelein, 2014). These different activities/types of interactions probably will take place at different locations in single-tenant offices and business centers. For example, it is expected that a café facilitates more informal activities such as casual conversations (e.g., Davenport & Bruce, 2002; Hua et al., 2011) and formal meeting rooms facilitate more formal activities such as discussions and brainstorming (e.g., Staplehurst & Ragsdell, 2010). Based on the literature reviewed above, the following additional hypothesis is proposed for business centers:
Previous studies in single-tenant offices show that being a member of the same group (e.g., same department) increases the number of interactions, which reflects homophily (i.e., similar people are more likely to interact; Agneessens & Wittek, 2012; Kabo, 2017; Wineman, Kabo, & Davis, 2009). People with similar job status are also found to use the same locations/spaces more often, which could lead to more face-to-face interactions (Zahn, 1991). Thus, we expect that face-to-face interactions between people from different groups (i.e., organizations) take place more frequently at locations that are shared by different organizations (e.g., coffee corner or canteen/restaurant/café), and face-to-face interactions between people from similar groups (i.e., within the organization) take place more frequently at locations that are shared within the organization (e.g., workplace). Hence, we formulate the hypothesis for business centers (coworking and serviced offices):
Furthermore, it is relevant to analyze the relationship between the strength of a tie and the location type choice. Xerri and Brunetto (2010) define strong ties as relationships with a high level of interaction, emotional intensity, and reciprocity (e.g., family members, close friends/colleagues). They define weak ties as relationships with a low level of interaction, emotional attachment, and reciprocity (acquaintances, friends of friends, and distant colleagues). Granovetter (1973) suggests that weak ties are more important for sharing new information because weak ties provide access to new information and resources beyond the social circle. Strong ties could hinder the sharing of new information. Ramasamy, Goh, and Yeung (2006) suggested that when the strength of the relationship between two organizations is low, knowledge sharing can still occur. Also, Levin and Cross (2004) found that (trusted) weak ties provided the most useful (new) knowledge. On the contrary, weak ties are mostly of short duration and appear less frequently (Chell & Baines, 2000). As there are several differences recognized by previous studies between weak ties and strong ties, the face-to-face interaction location will probably also differ.
Business centers offer more flexible and shared work environments, which provide more freedom in where to interact with others (i.e., strong and weak ties) than many single-tenant offices that offer mainly a traditional and fixed layout. In addition, a strong tie (i.e., friend or close colleague) is related to the level of interaction and closeness of the relation (Xerri & Brunetto, 2010). Therefore, we expect that face-to-face interactions with strong ties are more likely to take place at more private and most frequently used locations (e.g., people’s workspace). With regard to face-to-face interactions with weak ties (i.e., distant colleagues or people from other organizations), we expect that they are more likely to take place at public, shared, and less frequently used locations in the business center (e.g., canteen/restaurant/café). This brings us to the following hypothesis for business centers.
Evidence furthermore indicates that the design of the physical work environment of single-tenant offices could particularly stimulate unplanned face-to-face interactions (Peponis et al., 2007; Toker & Gray, 2008). The intentionality of interactions could therefore also be relevant for the location type choice in business centers and vice versa. For example, planned face-to-face interactions are more likely to take place in formal meeting spaces than in the hallway or at a coffee area. Therefore, for business centers we postulate the following additional hypothesis:
Interactions are important for organizations to get access to (new) knowledge and eventually increase their innovation capabilities (Cabral & Van Winden, 2016; Marouf, 2007; Suckley & Dobson, 2014). Knowledge can be shared through face-to-face interactions between individuals (Ipe, 2003) and can be described as “a process where individuals mutually exchange their knowledge to create new knowledge” (e.g., Van Den Hooff & De Ridder, 2004, p. 118). It is recognized that knowledge sharing in SMEs is most effective through informal face-to-face interactions to be creative and innovative (Ngah & Jusoff, 2009). As knowledge sharing depends on social and work-related interactions, the location of these interactions could also differ. A study in single-tenant offices showed that workspaces and meeting rooms are the most important knowledge sharing facilities (Kastelein, 2014). Therefore, it is also important to analyze the locations of inter- and intraorganizational face-to-face interactions in business centers whereby knowledge is shared versus interactions where no knowledge is shared. With regard to the location choice, we expect similarities between interactions whereby knowledge is shared in single-tenant offices and business centers. Hence, we propose in addition the following hypothesis for business centers, similar to that for single-tenant offices:
Office Type, Workspace Use, and Social Interaction
Although it is expected that face-to-face interactions among occupants are increased through the use of business centers because of shared spaces and facilities (e.g., Cabral & Van Winden, 2016), research on actual face-to-face interactions among occupants is still limited. Previous research on networking behavior mainly focused on single-tenant offices. Also, it showed conflicting results with regard to office concepts. Boutellier, Ullman, Schreiber, and Naef (2008), for example, found that a multispace office concept (i.e., high diversity of workspaces for different activities) facilitates more (short) face-to-face interactions among employees compared with a cellular office concept. Furthermore, Becker and Sims (2001) found that a more open work environment supports face-to-face interaction between workers better. Opposite results were found by Brennan, Chugh, and Kline (2002), who found that after the relocation from a traditional cellular office to an open-plan office, the relations between coworkers decreased due to increased disturbances and decreased privacy. Therefore, we propose the following hypothesis related to this:
As the workspace appears to be an important location for face-to-face interactions in single-tenant offices (e.g., Rashid, Kampschroer, Wineman, & Zimring, 2006), it is expected that the use of the workspace in business centers is related to people’s interaction patterns as well. There are three workspace types, namely, a personal workspace (i.e., fixed workspace), a shared workspace on a rotating basis, or a nonterritorial workspace (i.e., flexible workspace; adapted from Van Meel, 2000). The commonly used workspace in business centers is the nonterritorial workspace (i.e., unassigned seating). Inamizu (2014) suggests that one of the main benefits of a nonterritorial workspace is the increase in unplanned communication among workers. Overall, in line with insights from studies in single-tenant offices, we hypothesize that interaction behavior and thus also the location type choice for face-to-face interactions are associated with the workspace use:
Overall, the main purpose of this research is to analyze the location type choice for face-to-face interactions between users in business centers by testing the above set of hypotheses. To test the hypothesized relations, we control for differences in personal and work-related characteristics (e.g., age, gender, education level, organization type), which can also be related to interaction behavior (e.g., Greve & Salaff, 2003; Klyver & Grant, 2010; Zengyu Huang, Nandialath, Alsayaghi, & Karadeniz, 2013).
Method
Participants
Business center owners who participated in a previous study (Weijs-Perrée et al., 2016) were first asked to distribute the questionnaire about users’ personal characteristics and characteristics of their work environment (i.e., office concept, workspace type, and workspace use) among all their tenants. Subsequently, the tenant organizations were asked to distribute the questionnaire by email among all their employees. Eventually, seven business centers participated in this study. To increase the response rate, the seven business centers were also visited to ask all present individual users in person to participate in this research.
The seven business centers, where users were asked to participate, were all located in the Netherlands. Characteristics of these business centers are shown in Table 1. The business centers were coworking spaces and serviced offices or a combination of these two concepts. The main focus of these seven business centers is to stimulate networking, knowledge sharing, and creating a community among organizations. They offer office space for self-employed people, independent workers, SMEs, start-up enterprises, and large companies. All business centers offer networking events as a service to their tenants. In addition, four business centers also offer workshops/lectures. The gross floor area (GFA) of the business centers differs from 4,500 to 55,000 m2. Furthermore, the number of tenants per business centers differs from six tenants to 180 tenants.
Characteristics of the Seven Business Centers.
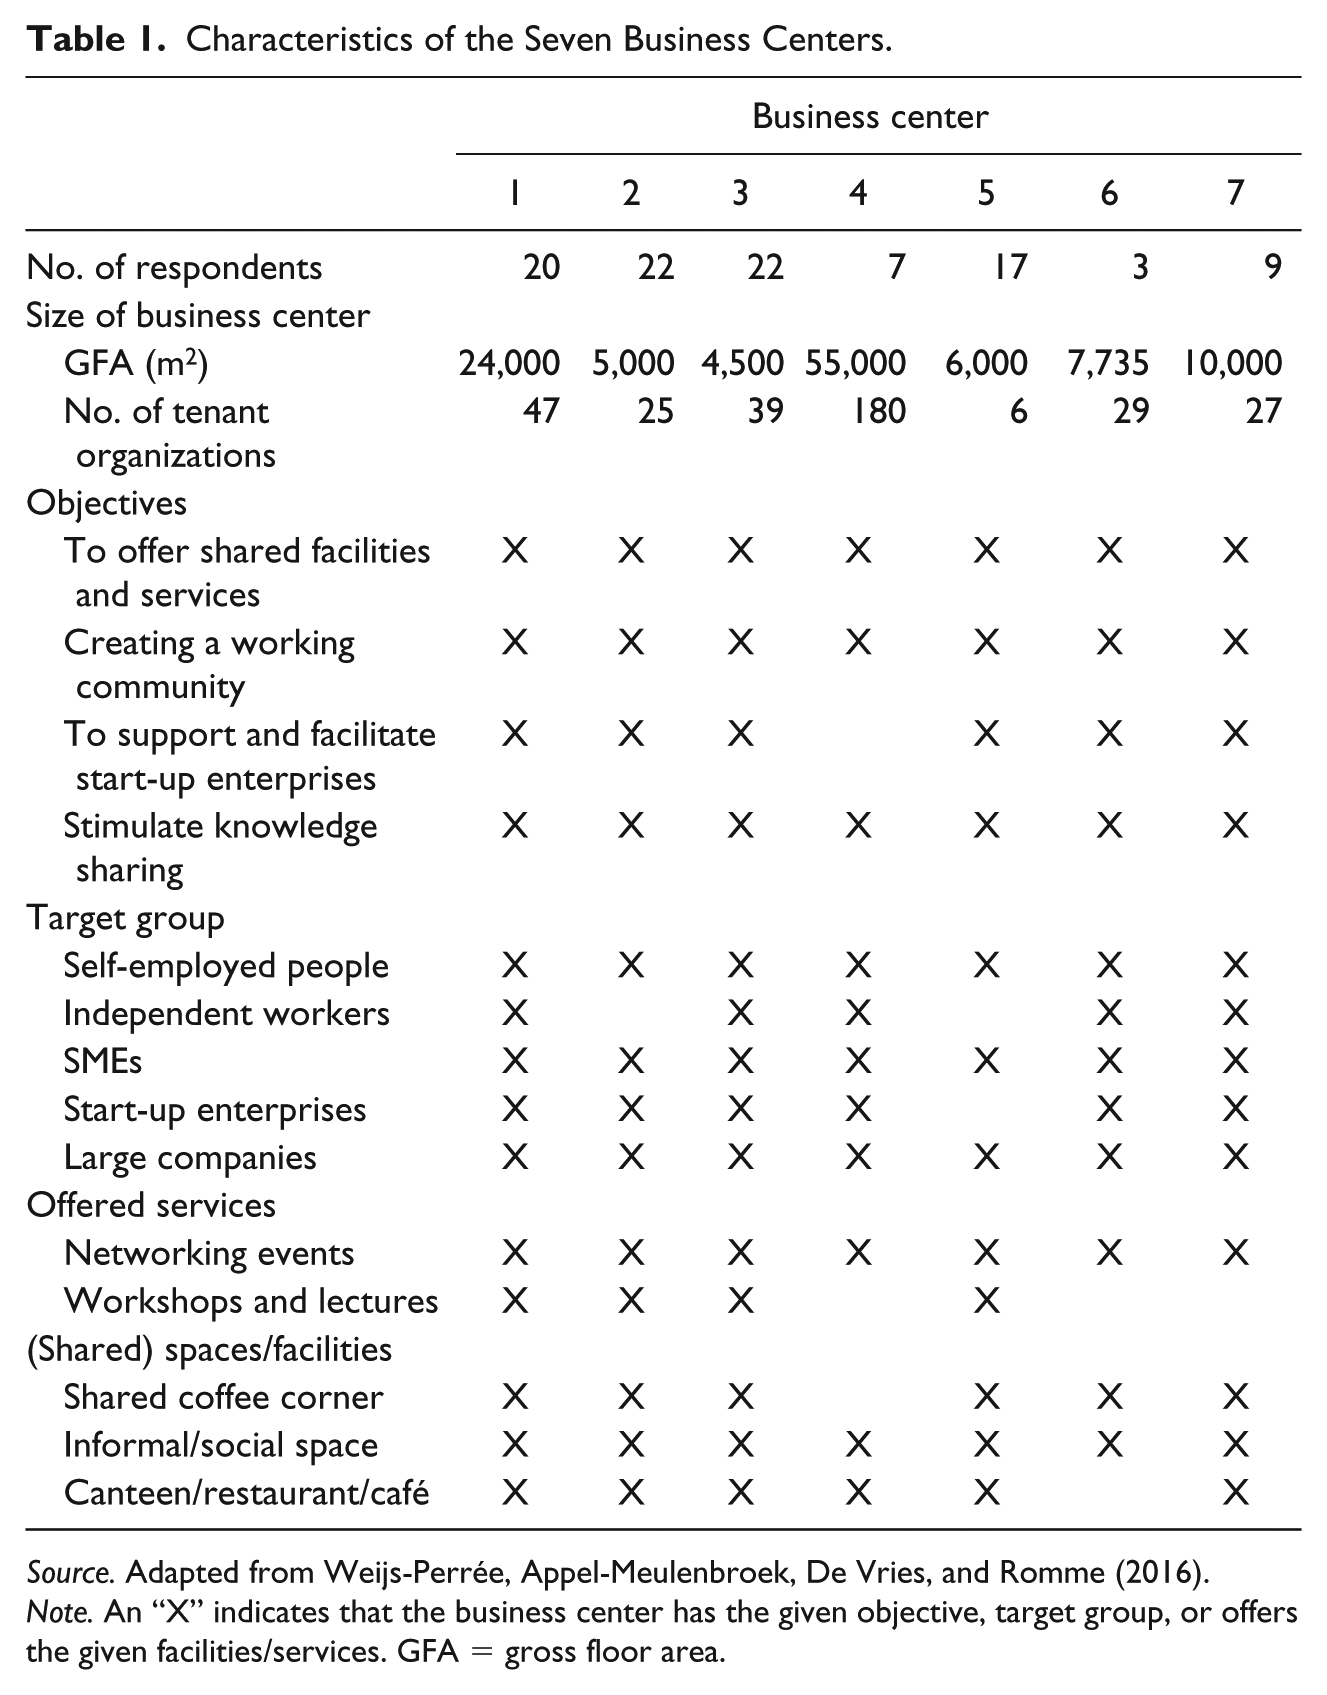
Source. Adapted from Weijs-Perrée, Appel-Meulenbroek, De Vries, and Romme (2016).
Note. An “X” indicates that the business center has the given objective, target group, or offers the given facilities/services. GFA = gross floor area.
Procedure
The data collection consisted of two parts. The first part was a questionnaire about demographics, work-related characteristics, and characteristics of the physical work environment of business center users. Respondents were also asked to indicate whether they were willing to participate in the second and main part of the research. If they were willing to participate, they were asked for their email address or mobile phone number for the second part of the research.
In the second part, longitudinal data were collected using an experience sampling method (ESM) to measure users’ face-to-face interaction patterns and the locations of these interactions. ESM is a useful method to analyze interpersonal interactions and to obtain a representative sample of individuals’ behavior (e.g., Fisher & To, 2012; Uy, Foo, & Aguinis, 2010). Compared with traditional diary surveys, this method minimizes memory biases because participants report their events when they occur.
There are three types of experience sampling methods, namely, the signal contingent, interval contingent, and event contingent method (Fisher & To, 2012; Reis & Gable, 2000; Uy et al., 2010). In this study, the signal contingent method was used, whereby respondents were asked to report characteristics of face-to-face interactions that took place in the business center and were more than just a greeting, 60 min prior to three random times a day for 10 workdays. At these random times, signals (i.e., smartphone and email prompts) were sent to respondents. In these prompts, respondents received a link to the online questionnaire where they had to report their interactions. The time slot was based on the start and end times of a normal workday that was reported by each respondent in the general questionnaire. So, this could differ per respondent.
Measures
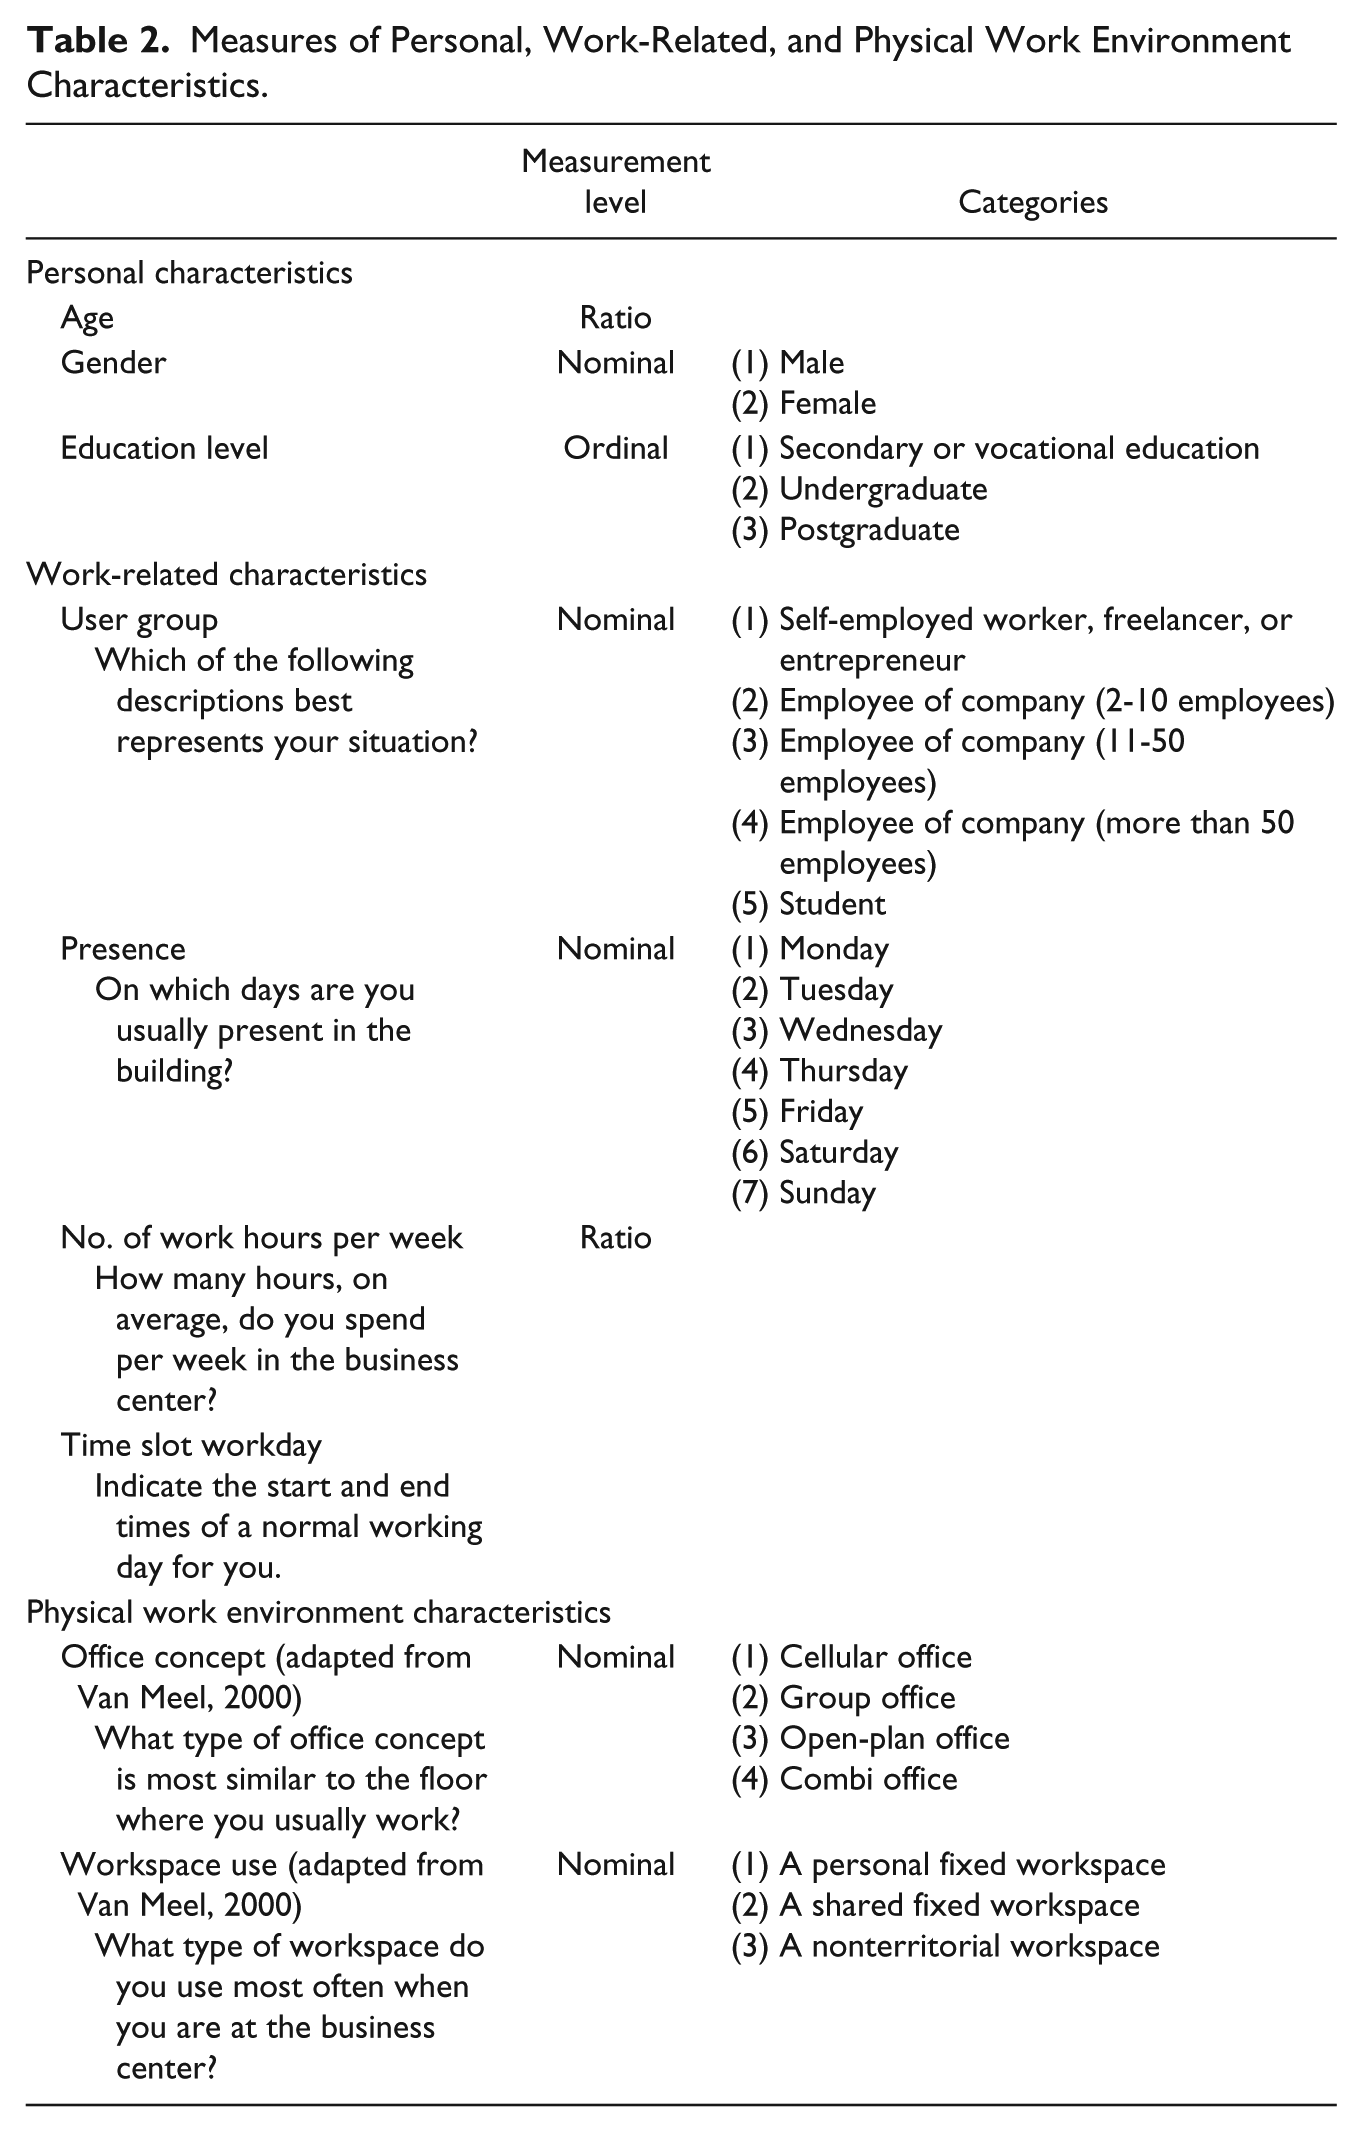
Tables 2 to 4 provide the details of the measures. The general questionnaire consisted of open and closed questions about relevant demographics, work-related characteristics, and characteristics of the physical work environment of business center users. First, respondents were asked about their age, gender, income, and education level. Next, respondents were asked to indicate the start and end of a normal workday and working hours per week on average in the business center. Furthermore, they were asked about the user group, that is, the type and size of the organization they work for. The following user groups were distinguished: student, freelancer or self-employed worker, and organization with two to 10 employees, with 11 to 50 employees, and with more than 50 employees (adapted from Hartog, Weijs-Perrée, & Appel-Meulenbroek, 2018). Students and freelancers/self-employed workers were also included as user group categories because these are recognized to be important business center user groups (Kojo & Nenonen, 2014; Weijs-Perrée et al., 2016).
Measures of Personal, Work-Related, and Physical Work Environment Characteristics.
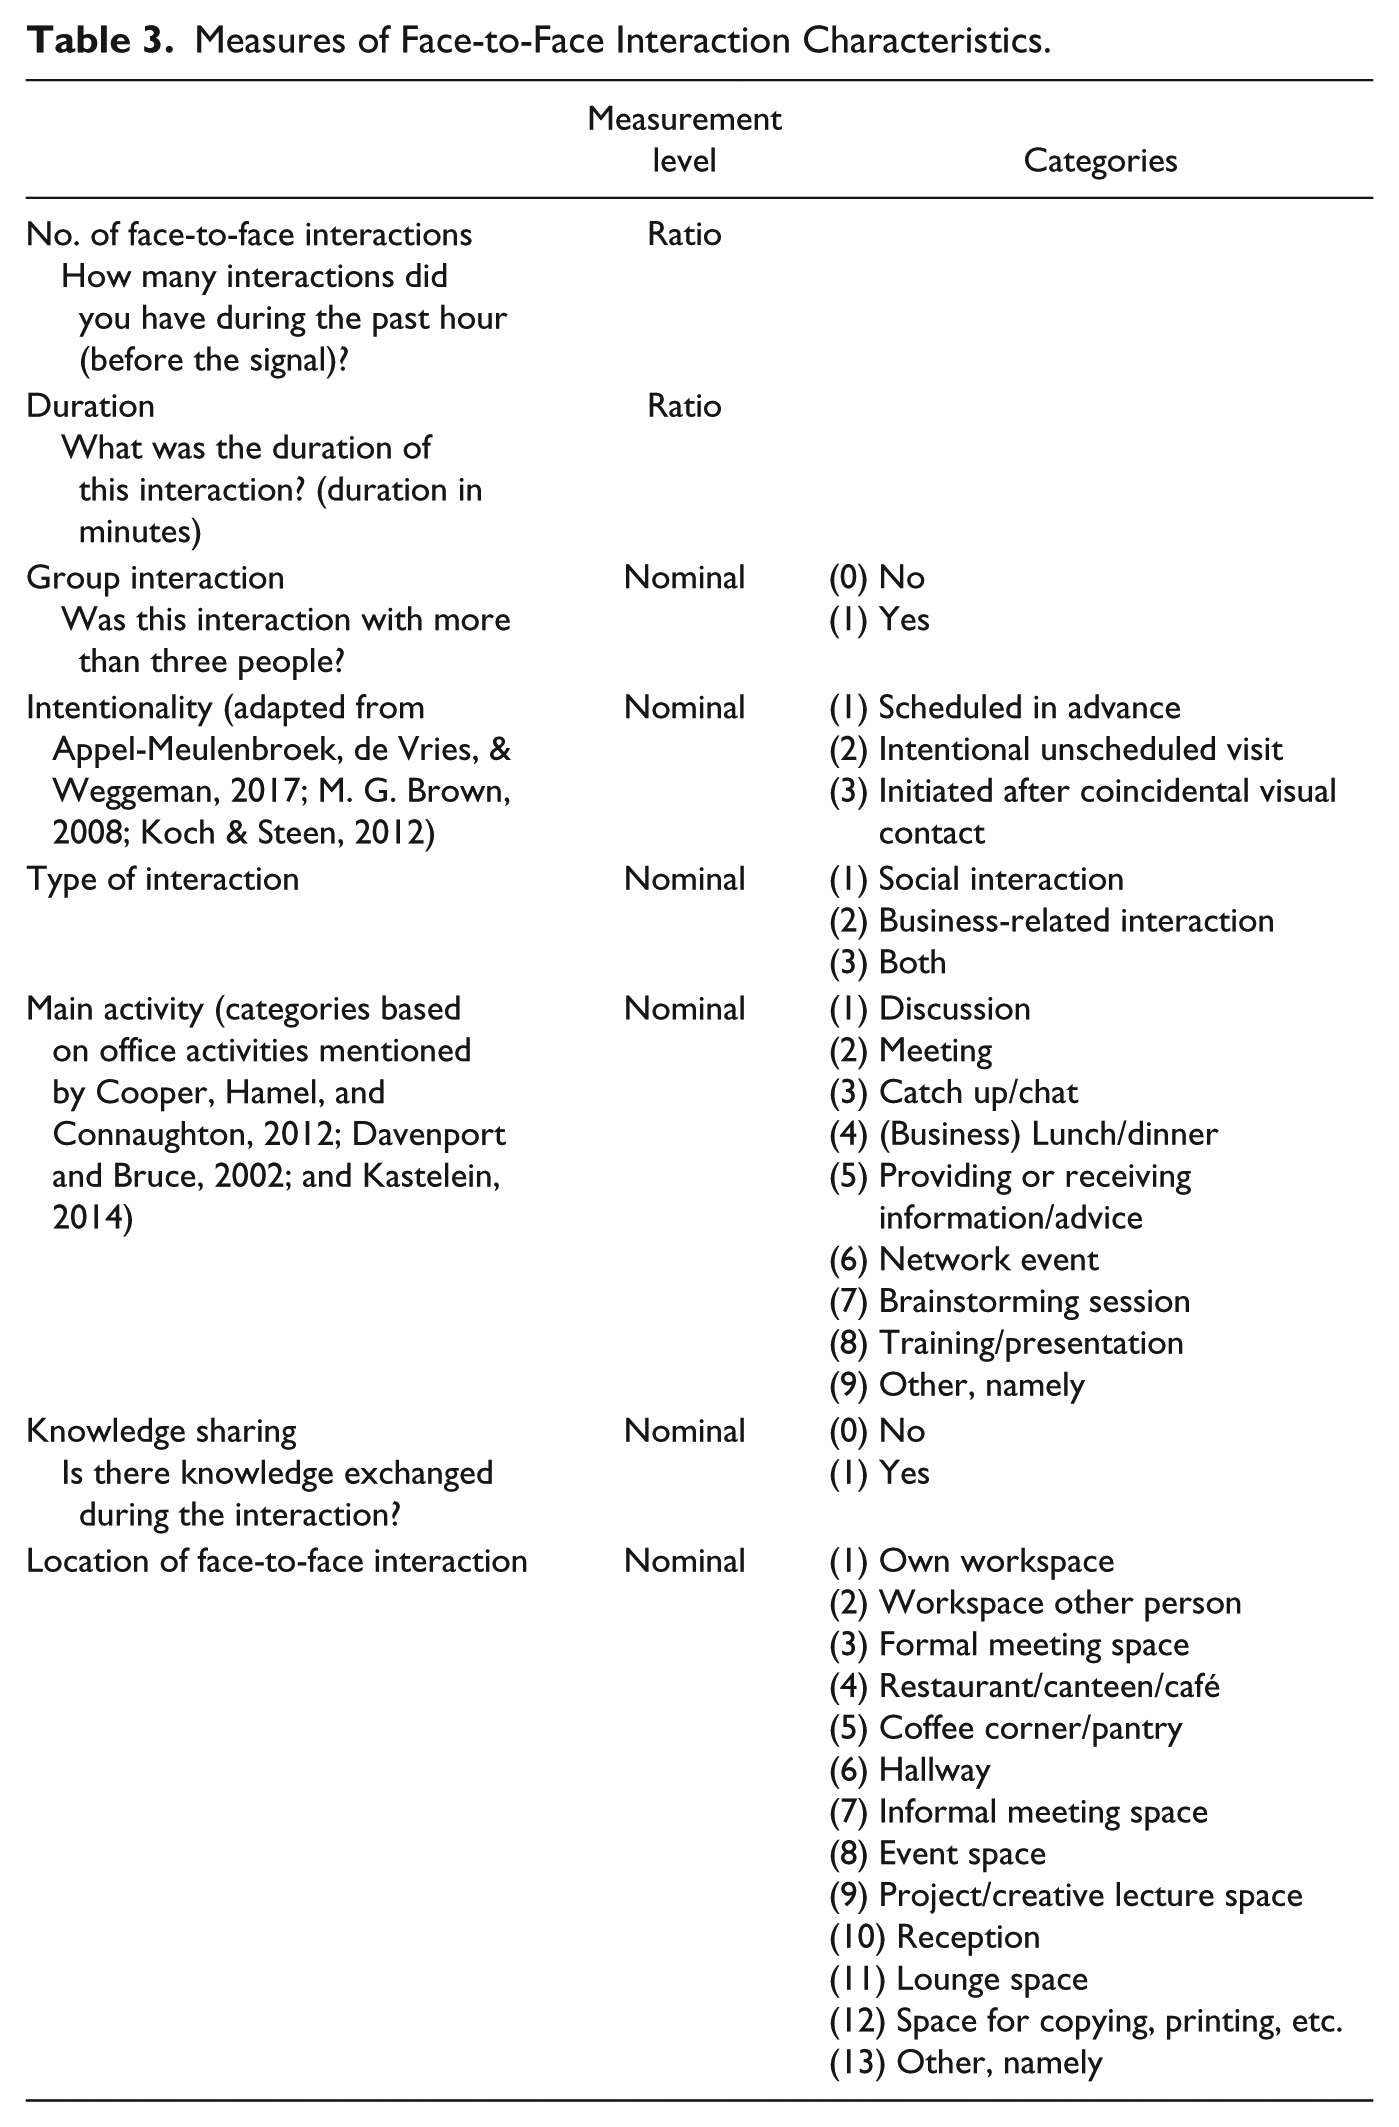
Measures of Face-to-Face Interaction Characteristics.
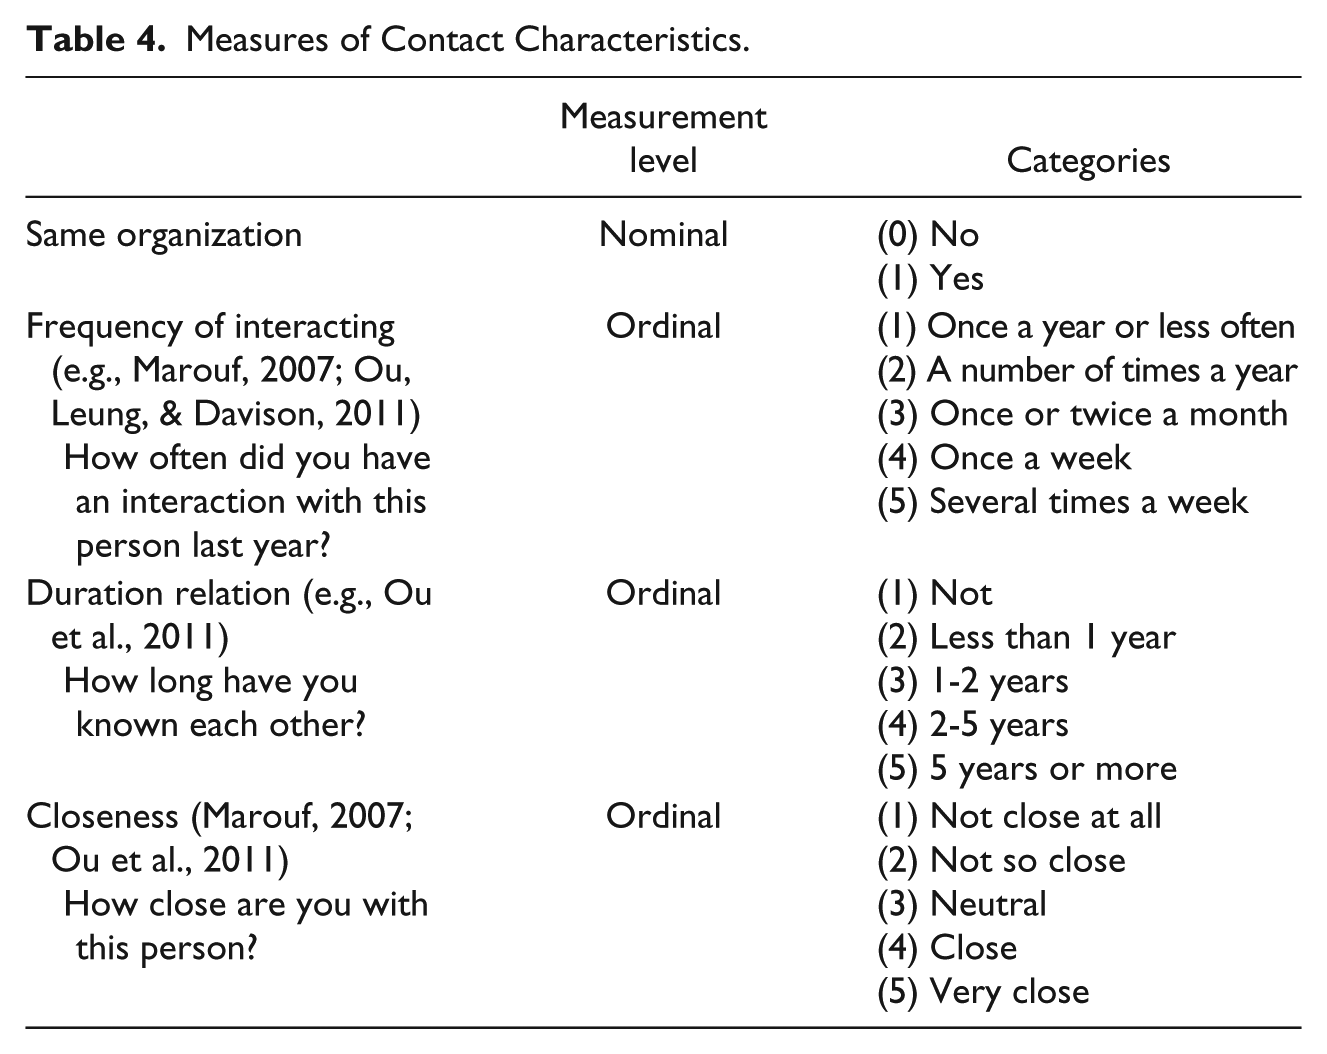
Measures of Contact Characteristics.
With regard to the physical work environment, respondents were first asked to indicate the office concept of the floor where they mostly work. The categories used were adapted from Van Meel (2000) and include cellular office, group office, open-plan office, half open-plan office, and a combi office. Next, they were asked about the use of their workspace. Respondents were asked to indicate whether they have a personal office, a shared office on rotating basis, or a nonterritorial office (adapted from Van Meel, 2000). In the ESM questionnaire, respondents were asked about the duration of the interaction and whether the interaction is preplanned, intentionally unscheduled, or coincidental (Appel-Meulenbroek et al., 2017; M. G. Brown, 2008; Koch & Steen, 2012). Respondents were also asked to indicate whether the interaction is a social (informal) or work-related (formal) interaction. Furthermore, they had to indicate the main activity of their interaction, namely whether the interaction was a discussion, a meeting, a chat/catch up, business lunch or dinner, a way to provide/receive information or advice, a network event, a brainstorm session, or a workshop/presentation. Next, respondents were asked whether they shared knowledge during the interaction.
For each interaction, respondents were also asked to provide information about the person (i.e., contact) with whom they had a face-to-face interaction. If the respondents indicated that the interaction was with more than three people, the interaction was reported as a group interaction. For interactions with three or fewer than three people, respondents were asked whether this person was a colleague or a person from another organization. Furthermore, to measure the strength of ties respondents were asked about the frequency they interact with the person(s) on a 5-point rating scale, ranging from (1) once a year or less to (5) multiple times a week. In addition to the frequency of interactions, the duration and closeness of the relation are also important indicators of tie strength (e.g., Hansen, 1999; Marouf, 2007; Marsden & Campbell, 2012). Therefore, respondents were asked about the closeness of their relation on a 5-point rating scale, ranging from (1) not close at all to (5) very close. They were also asked about the duration of the relationship with this person by indicating how long they had known each other—that is, not (1), less than 1 year (2), 1 to 2 years (3), 2 to 5 years (4), 5 years or longer (5). To obtain a measure of tie strength, the sum score of the frequency of interaction, duration, and closeness of the relationship was determined. These items were adapted from Ou, Leung, and Davison (2011). In general, a Cronbach’s alpha higher than .70 is seen as an acceptable level of reliability (Nunnally, 1978). In this study, the value of Cronbach’s alpha is .67, which is below the .70 level. However, the difference is small, and therefore, we think that the scale is usable for this study.
Last, respondents were asked to indicate the location type of the interaction. They could choose between different types of spaces/facilities that are usually offered in a business center, as determined in the study by Weijs-Perrée et al. (2016). The types include workspaces, café/restaurant, formal meeting spaces, informal/social meeting spaces, project/creative spaces, event spaces, space for copying/printing, reception, kitchen, restaurant/café, coffee corner/pantry, and lounge space. As these are all common spaces/facilities, no definition of each space/facility was provided. Respondents could also report another location if the space/facility they used was not listed in the questionnaire.
Analytic Approach
A mixed multinomial logit model (MMNL) was used to analyze the expected relationships with the location type choice. The MMNL method is a state-of-the art discrete choice model for analyzing panel data (Hensher & Greene, 2003; McFadden & Train, 2000). The MMNL allows for heterogeneity in choice behavior by offering the possibility to use random parameters in the utility functions of, in this case, location type alternatives for face-to-face interactions in business centers. The model provides much flexibility because the random components of the utility functions may be assumed to have any distribution (Train, 2009).
A face-to-face interaction is the unit of analysis, and the dependent variable is the choice of the location of the interaction in the estimated model. A random parameter was estimated for the utility constant term for each location alternative to capture possible heterogeneity in base preferences for locations. In addition, preferences for location alternatives may be correlated due to similarities between location type choices. To allow for these correlations, we estimated the correlations between error terms of utilities of alternatives simultaneously using the method of Cholesky decomposition (see Hensher & Greene, 2003, for an extensive explanation and examples).
To enable testing of the stated hypotheses, independent variables (i.e., interaction characteristics, demographics, work-related, and work environment characteristics) were included as interactions with all the location type alternatives (e.g., Social Interaction × Location Type 2). To reduce degrees of freedom, the coefficients of the interaction terms are estimated as nonrandom parameters. Furthermore, a stepwise model selection was used by adding interaction terms for one independent variable at a time. Interaction variables that were nonsignificant were subsequently removed. This process was repeated until a model is estimated with only significant relationships. The (random) parameters of the final model were estimated by using 1,000 Halton draws, which is a more efficient way to probe a distribution compared with just random draws (Bhat, 2003).
Results
Descriptive Statistics
A total of 4,074 prompts with a link to the online questionnaire were sent to 179 business center users. These 179 respondents also completed the first questionnaire and agreed to participate in the second part of the study. One hundred twenty-two responded to 1,592 of 4,074 prompts (39%). Of these 122 respondents, 22 users indicated that they were not at the business center the time they received the prompt (489 times) or did not have a face-to-face interaction during the hour before they received the prompt (579 times). Overall, 100 respondents reported a total of 658 face-to-face interactions during 10 workdays.
The final sample of business center users consists of a higher share of males (61%). The average age of the users is 39 years. Most respondents in the data set have a moderate or high education level (i.e., undergraduate or postgraduate; 81%). In the data set, 22% are self-employed workers, 27% work for a company with two to 10 employees, 25% work for a company with 11 to 50 employees, and 26% work for a larger company with more than 50 employees. Most respondents work in the business service sector, in the building sector, or in the information and communication technology (ICT)/media sector. The average number of hours that business center users work at the business center, during a normal work week, is 32 hr.
Figure 1 shows the interactions reported per workday and the average reported interactions over 10 workdays. As can be seen, most interactions are reported in the first days. The maximum number of reported interactions by respondents per day was 10. Some respondents reported zero interactions on a day. As can be seen in Table 5, most interactions are work-related (61%) and overall have an average duration of 30 min. In 41% of the reported interactions, the initiator has consciously sought the other(s) without a preplanned appointment; 33% of the interactions are preplanned and 26% of the interactions are coincidental. Interorganizational interactions are more frequently coincidental than are intraorganizational interactions. The main activities of most interactions are a discussion or a catch up/chat. The main activity during interorganizational interactions is more frequently a catch up/chat than during intraorganizational interactions. Most interactions are nongroup interactions. Of all interactions, including the group interactions, 26% are interactions with minimally one person from another organization and 63% are interactions with at least one strong tie.
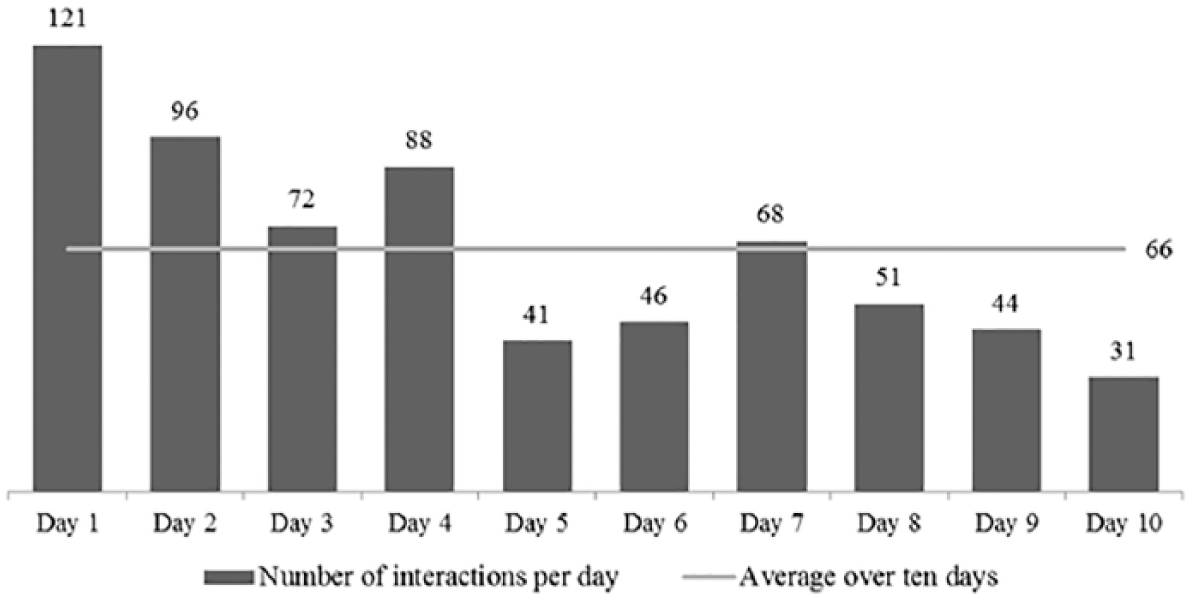
Reported interactions per day.
Face-to-Face Interaction Characteristics (N = 658).
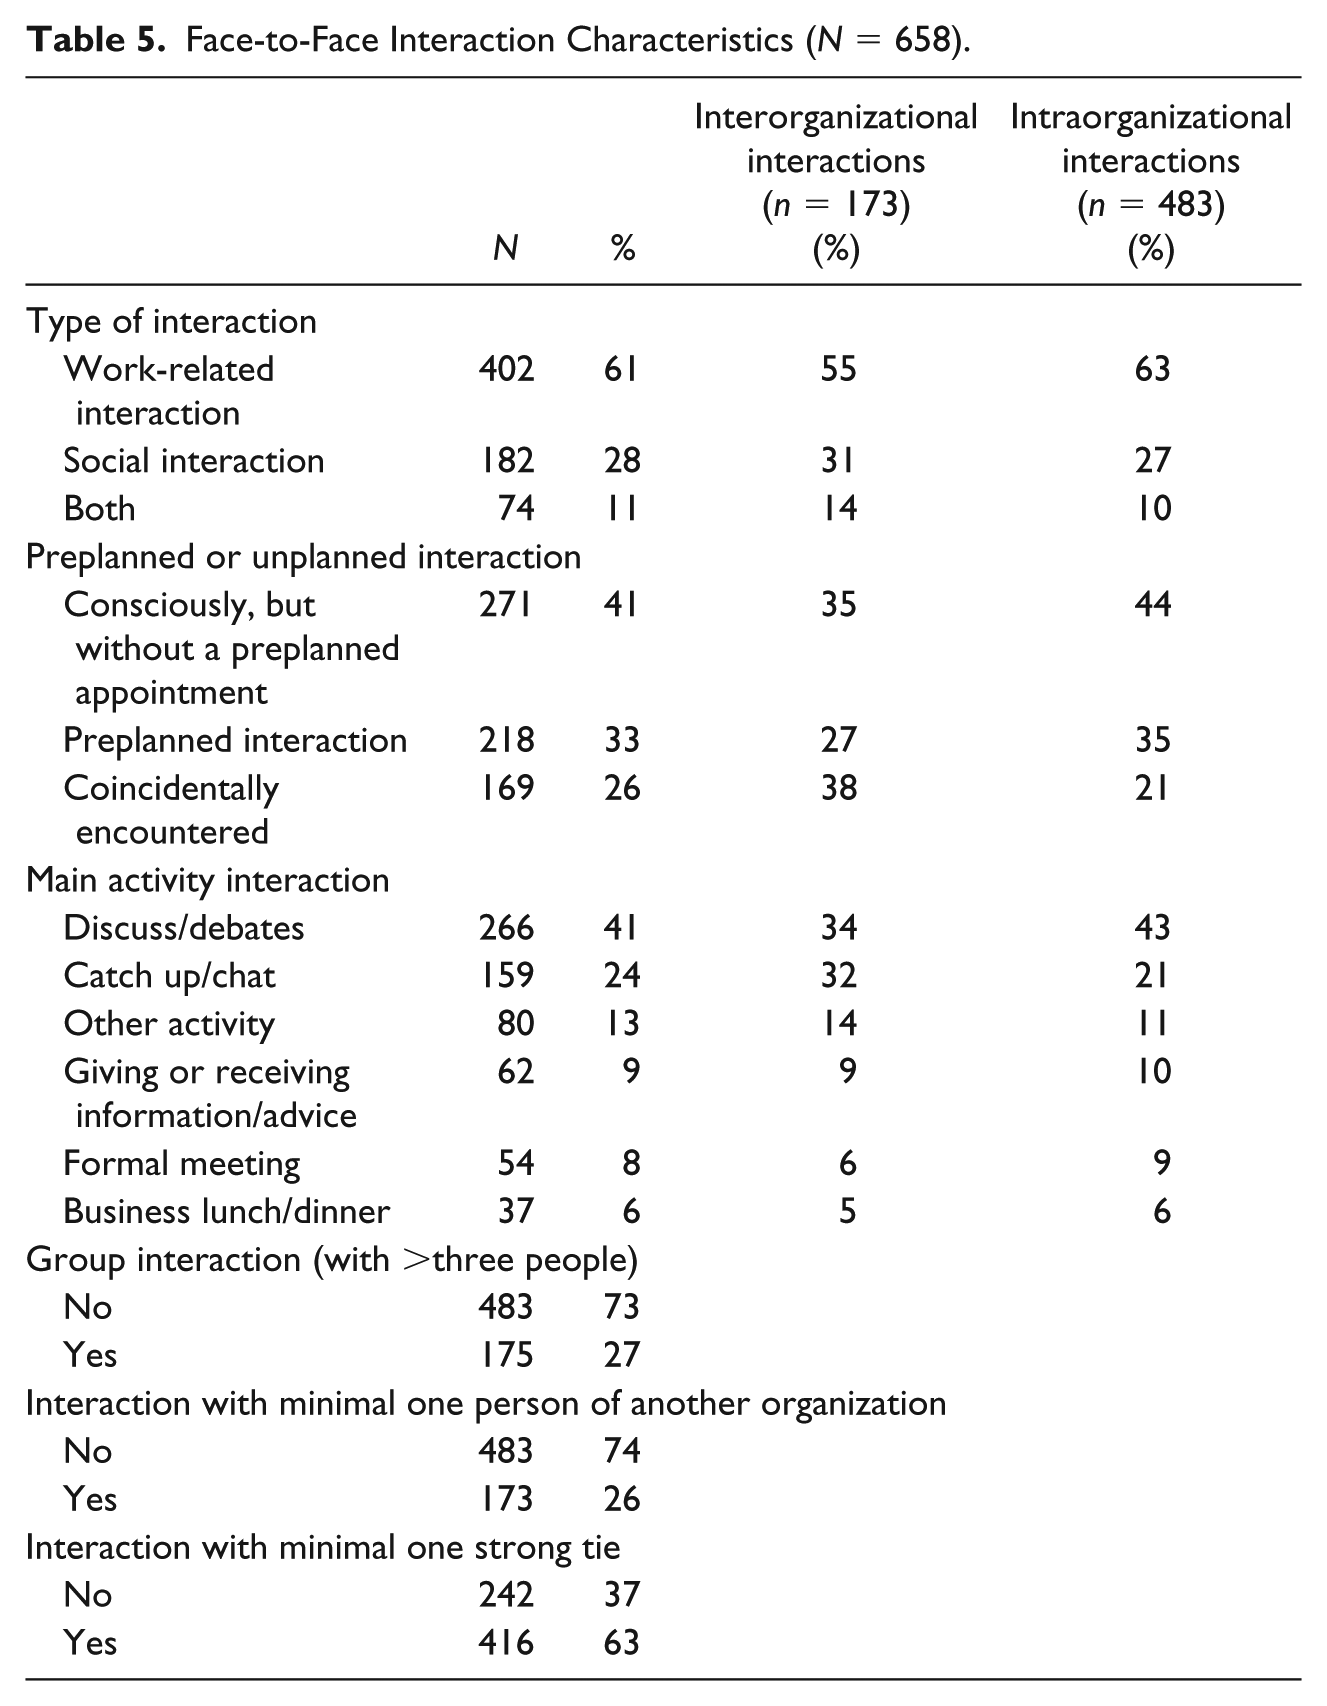
Also, several characteristics of the (unique) contacts of the interactions were identified. The respondents reported 362 unique contacts for the 658 interactions. Most contacts are colleagues and working in the same building. The respondents most often have contact with these contact persons multiple times a week and are often close or very close to these contact persons. The average tie strength (i.e., sum score of the frequency of interaction, duration, and closeness of the relationship) is 3.35 with a minimum of 1 and a maximum of 5 (SD= .886). So, most respondents have a strong connection with the contact persons. In this study, this variable is recoded into a dummy interaction variable with two categories, namely (1) interactions involving at least one strong tie (i.e., a tie strength of more than 3) and (0) interactions with no strong ties. As can be seen in, Table 5, 63% of the interactions are with minimally one strong tie, 27% are group interactions, and thus 10% are interactions with no strong tie.
For the model-based analysis, the location alternatives for face-to-face interactions are categorized into five location types. These location types are reported most often by respondents and are also identified as important locations for face-to-face interactions in single-tenant offices (e.g., Boutellier et al., 2008; Hua et al., 2011; Kastelein, 2014; Staplehurst & Ragsdell, 2010):
Location 1: Workspace (own or other person(s))
Location 2: Formal meeting space
Location 3: Coffee corner/pantry (i.e., a space with a coffee machine and/or small kitchen)
Location 4: Restaurant/canteen/café (i.e., a (casual) place for eating/drinks)
Location 5: Other locations (i.e., lounge space, reception, space for copying/printing, project space, event space, informal meeting space, and hallway)
Of all interactions, 56% took place at the workspace, 14% at a formal meeting space, 11% at a restaurant/canteen/café, 5% at the coffee corner/pantry, and 14% at other locations.
MMNL Model Results
Table 6 and Figure 2 show the estimation results of the final MMNL model to test the hypotheses. Arbitrarily, Location 5 (Other location) is taken as the base alternative. As can be seen in Table 6, a value of .38 for the adjusted ρ2 indicates that the model fit is satisfactory. The standard deviations of the error terms of the constants are significant for Locations 1, 2 and 3, which means that there exists heterogeneity across business center users for base preferences of these location choices. The average value estimates of the parameters suggest that on average the base preference is highest for the workspace and lowest for the coffee corner/pantry.
Results Mixed Multinomial Logit Model.
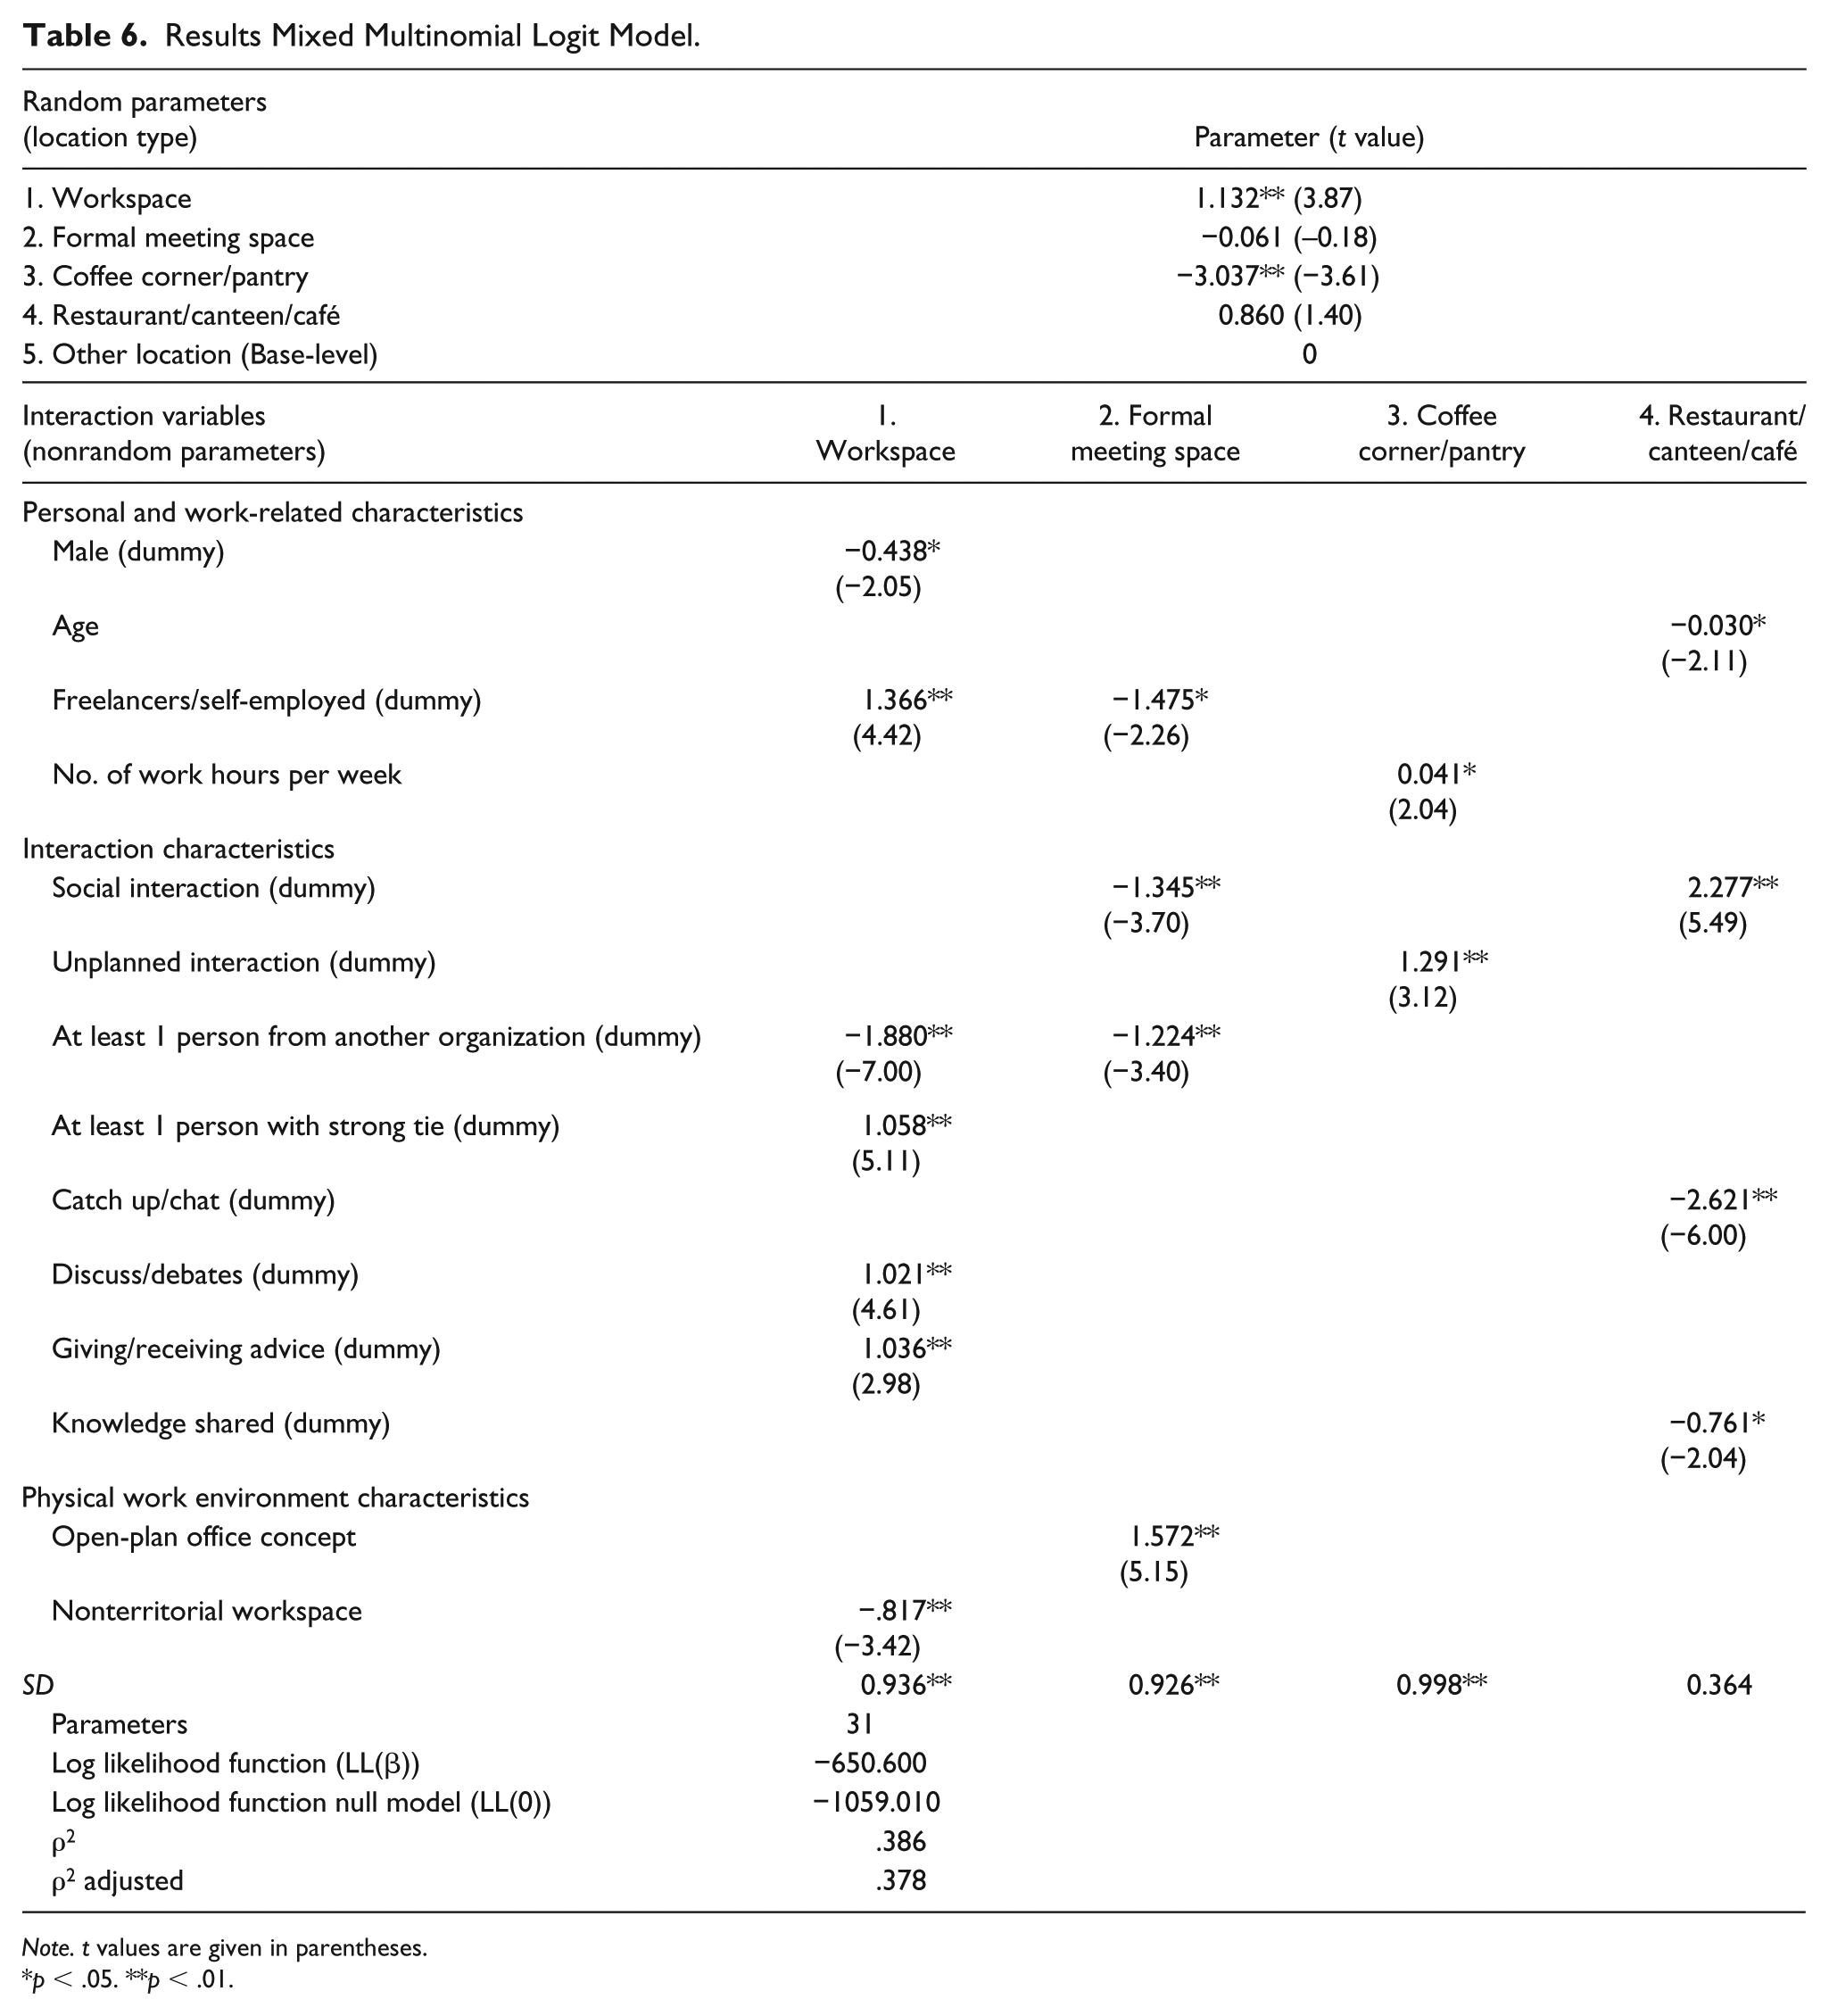
Note. t values are given in parentheses.
p < .05. **p < .01.
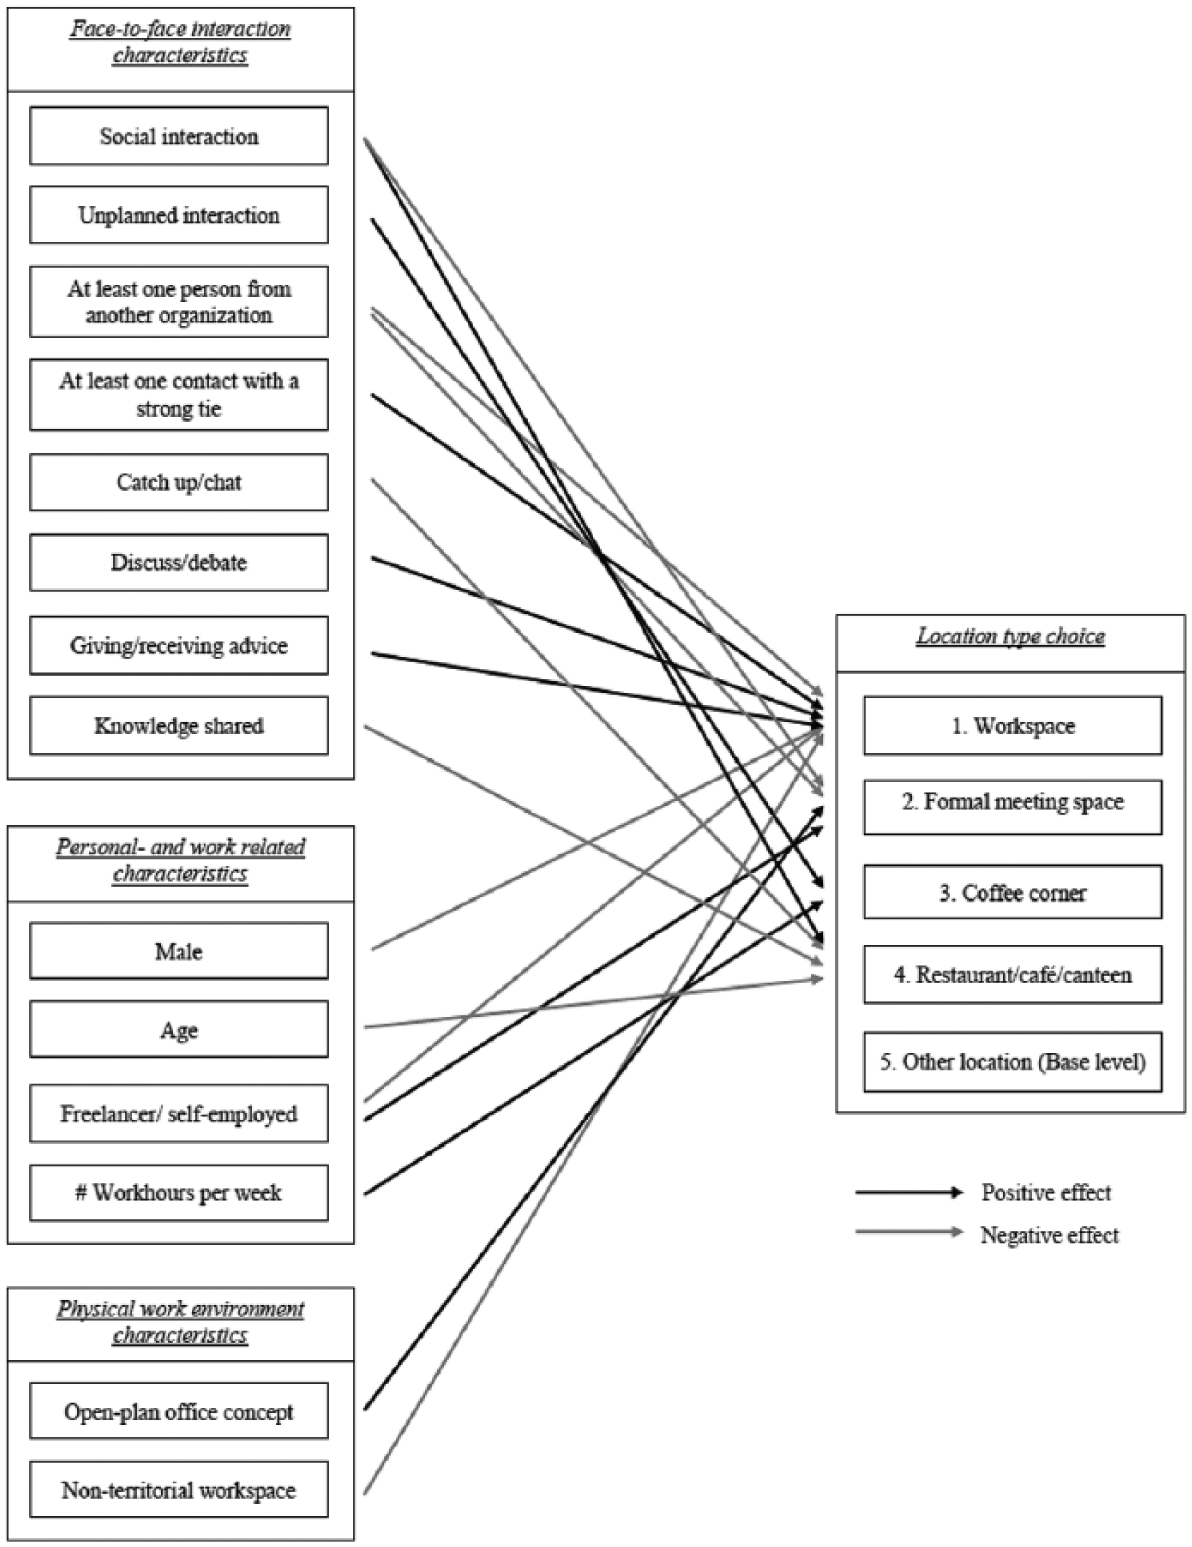
Visualization of the significant effects of the MMNL model.
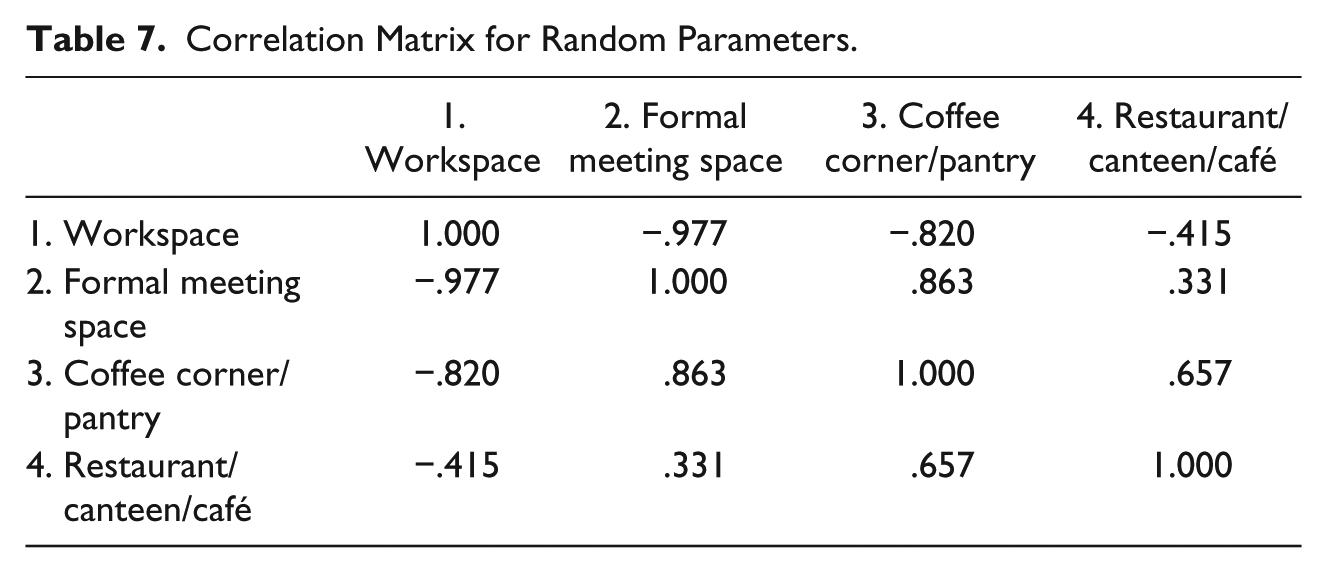
Table 7 shows the correlation matrix for the random parameters. As can be seen, high correlations exist between the utilities of the location alternatives. These correlations suggest that a strong competition exists between workspace and formal meeting space as well as between workspace and coffee corner/pantry for face-to-face interactions.
Correlation Matrix for Random Parameters.
As expected, face-to-face interaction characteristics are important for the preferred location type where the interaction takes place. The results show that a social face-to-face interaction increases the probability that the interaction takes place at a restaurant/canteen/café and decreases the probability that it occurs at a formal meeting space compared with business interactions. This result supports H1, as it indicates that social interactions take place at other locations (i.e., restaurant/canteen/café) than do business interactions (i.e., formal meeting spaces). Furthermore, the activity of the face-to-face interactions also shows significant results. First, the probability that people catch up or chat at a restaurant/canteen/café is lower than for other activities. Next, having a discussion or receiving/giving advice increases the probability that the interaction takes place at a user’s workspace. Based on the results on face-to-face interaction activities, H2 is accepted. If the interaction is with one or more people from another organization (i.e., interorganizational interaction), the propensity that this interaction takes place at the workspace or at a formal meeting space is lower compared with interactions with only colleagues (i.e., intraorganizational interaction) or with a group (i.e., more than three people). So, H3 is supported. With regard to tie strength, results show that interactions with minimally one strong tie have higher probability to take place at the workspace compared with interactions with only weak ties and group interactions. This result supports H4. The results also support H5, as the probability that the interaction takes place at the coffee corner/pantry increases when the interaction is unplanned, compared with consciously unplanned interactions or planned interactions. If knowledge sharing occurs during the interaction, the probability decreases that the interaction takes place at restaurant/canteen/café. Thus, H6 is supported.
With regard to the physical work environment of individuals, the results show that business center users who work in an open-plan office are more likely to have a face-to-face interaction at a formal meeting space, compared with people who work at other office concepts (i.e., cellular office, combi office, or group office). So, H7 is accepted. Table 6 shows that people who work at a nonterritorial workspace (i.e., flexibly used workspace) less frequently have a face-to-face interaction at their workspace, compared with people who have a personal or shared (on rotating basis) workspace (i.e., fixed used workspace). Based on the results, H8 is accepted.
With regard to the control variables (i.e., personal and work-related characteristics), results show that men have fewer face-to-face interactions at their workspace than do women, compared with the other location types. In addition, the results show that older business center users have fewer interactions at a restaurant/canteen/café than do younger users. Self-employed workers have more interactions at their own workspace and fewer interactions at formal meeting spaces, compared with employees of SMEs or larger organizations. These workers have no colleagues and customers, or other parties might visit them at their own office/workspace. Furthermore, people who work more hours at the business center have interactions at the coffee corner/pantry more frequently than do people who work fewer hours. Possibly, people who work more hours may have more opportunities to meet others at informal locations than do people who work fewer hours.
Discussion, Conclusion, and Recommendations
Although there is a growing interest in people’s interaction behavior in the workspace, research on actual face-to-face interactions and their location is still limited. Specifically in business centers, where organizations share workspaces and facilities, more empirical research is needed on inter- and intraorganizational interaction behavior as previous workplace research mainly focused only on intraorganizational interaction behavior in single-tenant offices. Furthermore, previous studies did not look into the location choice for different types of interaction. However, understanding differences between intra- and interorganizational interactions in business centers with regard to the location type choice is important for designing optimal interactive work environments. This study also provides organizations with new insights on which locations in business centers are important for employees to interact and share knowledge with others. Where previous studies mainly focused on the frequency of interacting or measured the overall perceived interacting behavior using questionnaires, this study contributes to existing theory by analyzing the location of face-to-face interactions using real-time behavioral data (i.e., ESM).
With regard to the descriptive statistics of the face-to-face interactions, findings suggest that most interactions take place at people’s workspace. This is in line with the findings from previous studies in single-tenant offices that most interactions take place near or at people’s workspaces (e.g., Rashid, Wineman, & Zimring, 2009). This study shows that, conflicting with results from studies on single-tenant offices, for a significant share of face-to-face interactions, business center users reported other locations (14%). This was not expected because previous studies in single-tenant offices mentioned meeting spaces, workspaces, coffee areas, or a café/canteen as the most important locations for face-to-face interactions (e.g., Boutellier et al., 2008, Hua et al., 2011; Kastelein, 2014). Thus, it seems that business centers offer additional spaces that also facilitate interactions, such as lounge spaces, project space, event spaces, and informal meeting spaces. Next, working with other organizations in the same building (i.e., physical proximity) could lead to interorganizational interactions (i.e., 26% of the interactions are with minimally one person of another organization). In addition, these interactions are also found to be more frequently coincidental compared with intraorganizational interactions and thus are more likely to be a result of the physical work environment (Peponis et al., 2007; Toker & Gray, 2008). This is specifically important for smaller organizations, which is the main target group of business centers, as they rely more on their business and social network outside of their own organization (e.g., Lechner, Dowling, & Welpe, 2006; Thorpe, Holt, Macpherson, & Pittaway, 2005). Furthermore, compared with studies in single-tenant offices (e.g., Appel-Meulenbroek et al., 2017; Becker & Sims, 2001; Boutellier et al., 2008), the duration of the interactions in the business centers is much longer (on average 30 min).
Next, the results showed that specifically characteristics of the face-to-face interactions themselves are important for explaining the location where an interaction takes place. Social interactions take place more frequently at a café/restaurant/canteen and less often at formal meeting spaces, compared with other types of interactions, as recognized in single-tenant offices (Davenport & Bruce, 2002). Social interactions are important to build trust, soften cultural differences between organizations, and eventually increase knowledge sharing (e.g., Bøllingtoft & Ulhøi, 2005; Easterby-Smith, Lyles, & Tsang, 2008). On the contrary, the results show that the probability that a chat/catch up takes place at a café/restaurant/canteen is lower compared with other locations. This is remarkable because 72% of the chats/catch ups are social interactions. On the contrary, chats/catch ups have a shorter duration (a mean of 15 min) compared with other activities (a mean of 35 min). Interactions at a restaurant/café/canteen are more likely to be preplanned and of a longer duration (a mean of 36 min). Possibly for that reason, chats/catch ups are more likely to take place at another location than a restaurant/café/canteen.
Furthermore, unplanned interactions take place more frequently at a coffee area than planned interactions. This underlines the importance of a coffee area to meet new people beyond the current social circle, which could lead eventually to new insights and knowledge (Granovetter, 1973; Xerri & Brunetto, 2010). Property managers of business centers could, therefore, create even more attractive restaurant/café/canteen and coffee areas to facilitate and stimulate social and unplanned face-to-face interactions within and between organizations. On the contrary, this study shows that these locations are not places where knowledge is frequently shared. This might be caused by the fact that most interactions at a restaurant/canteen/café are social interactions (68%), whereby no knowledge is shared. Knowledge sharing takes more often place at other locations such as the workspace and formal meeting spaces, similar to single-tenant offices (Staplehurst & Ragsdell, 2010). Therefore, property managers who focus on creating an innovative work environment should create attractive meeting spaces and work environments that fit all needs/activities of their occupants (Gerdenitsch, Korunka, & Hertel, 2017).
Users of business centers, who work at a nonterritorial office, less often use their workspace to interact with others. This might be caused by the fact that business center users who do not have a fixed workspace might not be able to find or do not want to disturb other workers when they want to have an (unplanned) interaction with them. Probably, this finding is also related to the high negative correlation between people’s workspace and the other location types (see Table 7). On the contrary, findings of this study also suggest that the workspace is an important location for discussions and giving or receiving advice, which are also important business interactions among occupants of incubators (Cooper et al., 2012). In addition, the workspace was found to be an important location for face-to-face interactions with strong ties. Attractive workspaces could be designed with a higher visibility and accessibility to facilitate these activities more (Rashid et al., 2009). Business centers that offer flexible office space (i.e., nonterritorial office space) could focus more on designing other attractive and interactive spaces (e.g., informal meeting, lounge, or coffee areas) to stimulate unplanned social interactions among occupants (e.g., Hua et al., 2011; Kastelein, 2014).
As expected, people who work in an open work environment more frequently use a meeting space for interacting. These people probably do not want to disturb other workers or want more privacy when they have an interaction (Brennan et al., 2002). For business centers that offer open-plan office space, it is important that meeting spaces are also offered that are accessible and in close proximity of people’s workspace. It is recognized that people who work in close proximity of meeting spaces use these spaces more often (Brager et al., 2000). It thus remains a challenge for office designers to create a balanced physical work environment that facilitates the advantages of both open and traditional closed workplaces (Horr et al., 2016), also in business centers.
This study also offers new insights with regard to the differences between inter- and intraorganizational face-to-face interactions at the scale of a business center. It is less likely that interorganizational interactions take place at the workspace or at a formal meeting space, compared with intraorganizational interactions. These interactions take place more frequently at shared spaces such as the coffee corner, café/restaurant/canteen, or at other locations (mainly social or informal spaces). Organizations that want to network with other organizations should stimulate their employees to use these shared spaces more frequently. It is also recognized by previous studies that people from different groups have different interaction patterns (Agneessens & Wittek, 2012; Kabo et al., 2013).
Limitations and Future Research
The difficulty of causal interpretation of the relationships is a general limitation of cross-sectional studies such as the present study. Statements about the direction of the causality for the relationships that are found cannot be derived. For example, individuals may first decide the location and then the activity of the interaction, or this may happen the other way around. Although these causal interpretations cannot be made, the analysis nevertheless reveals the relationships between location and characteristics of the face-to-face interaction characteristics. Another limitation of this study is the small size of the sample. Using a larger data set with more buildings, it would be easier to generalize the results across the buildings and its spatial characteristics. In addition, using data on business centers from different countries could give more insight into cultural differences with regard to interaction behavior in the work environment.
This study focuses specifically on face-to-face interactions that are more than just a greeting. Especially with the increased importance of technology for communication, it is interesting to analyze the impact of the digital technology (e.g., Social media, Skype, FaceTime) on workplace use and communication within and between organizations in business centers. Future research could also look more into the duration of interactions and content of interactions in different office settings and on why some people interact more at the workplace and others at other places. Furthermore, the data set that is used for the analyses did not include any specific measures of or distances between spaces/facilities. It would be interesting for further research, by using a space syntax approach, to also include these measures in the analyses to get more in-depth insight into location choice behavior.
This study focuses on both intra- and interorganizational interactions within a business center. As interorganizational interactions are used as a unique selling point by business centers managers, more in-depth research is needed that focuses specifically on interorganizational interactions and how these are best facilitated by the physical work environment of business centers. Finally, it is recognized that open and shared work environments stimulate interactions among colleagues and between organizations. However, these work environments also have several disadvantages. Therefore, for future studies it is recommended to analyze how the work environment could be designed with a good balance between social and private spaces and collaboration and concentration spaces.
Although this study has some limitations, it provides new insights into users’ face-to-face interaction behavior and contributes to existing theory in single-tenant offices by analyzing the locations of face-to-face interactions in a different context (i.e., business center) and with an innovative real-time methodology.
Footnotes
Declaration of Conflicting Interests
The author(s) declared no potential conflicts of interest with respect to the research, authorship, and/or publication of this article.
Funding
The author(s) received no financial support for the research, authorship, and/or publication of this article.