
Abstract
We examined explanatory pathways for the association between spatial access to fast food outlets and body weight in 5,076 European adults (18+). The total effect of spatial access to fast food outlets on self-reported weight status was examined using regression analyses accounting for clustering at the neighborhood level. Perceived availability and usage of fast food outlets, and fast food consumption, were considered as potential mediators and age, gender, socioeconomic status, and urban region as potential moderators. Spatial access to fast food outlets was not significantly related to weight status. Spatial access to fast food outlets was associated with perceptions about and usage of fast food outlets, and this was in turn associated with greater reported fast food consumption and unhealthier weight status. We found limited evidence for mediation effects and no evidence for effect modification.
Introduction
There is growing recognition that the neighborhood food environment is an important upstream determinant of the obesity epidemic among adults. This is in line with socioecological models of obesity that suggest that environmental factors are important drivers of obesity-related behaviors and obesity (Egger & Swinburn, 1997; Swinburn, Egger, & Raza, 1999). However, current understanding regarding the extent to which neighborhood food environments influence individuals’ weight status and the pathways through which this might take place remains limited (Charreire et al., 2010; Fraser, Edwards, Cade, & Clarke, 2010). A prominent—but perhaps oversimplified—hypothesis posits that exposure to fast food outlets may encourage and facilitate overconsumption of unhealthy foods, leading to elevated body mass index and increased risk of obesity (Mejia, Lightstone, Basurto-Davila, Morales, & Sturm, 2015).
However, evidence for an association between exposure to fast food outlets and weight status remains mixed (Fraser et al., 2010). For example, a U.K. study showed that increased proximity to fast food outlets was associated with increased odds of obesity (Burgoine, Forouhi, Griffin, Wareham, & Monsivais, 2014), and a study from North America showed that availability of fast food outlets was associated with increased body mass index (Hollands, Campbell, Gilliland, & Sarma, 2014). Other studies conducted in the United States, Australia, and New Zealand found no associations between the availability or proximity of fast food outlets and weight status (Lopez, 2007; Mejia et al., 2015; Pearce, Hiscock, Blakely, & Witten, 2009; Simmons et al., 2005).
A number of factors may contribute to the inconsistency of this evidence. First, it is important to distinguish between the different measures of “exposure” to define availability or accessibility to fast food outlets. Availability refers to the count or density of fast food outlets within predefined administrative boundaries (e.g., neighborhoods) or buffers around the residential address (Oexle, Barnes, Blake, Bell, & Liese, 2015). Accessibility is often used to indicate geographic accessibility, measured as distance from or proximity to home. However, the two terms are often used interchangeably in the literature. Both availability and accessibility provide one-dimensional views on “exposure” to the food environment. Even if fast food outlets are available, they may not be accessible: for example, because they are not within easy reach or because they are unaffordable (Ghosh-Dastidar et al., 2014; Gustafson, Christian, Lewis, Moore, & Jilcott, 2012; Mackenbach et al., 2017). Similarly, even with the nearest fast food outlet being within close proximity of an individual’s home, individuals may use food outlets farther away, for example, because they like to vary in their fast food consumption. The use of one-dimensional definitions of “exposure” to the food environment prevails, but the concept of “spatial access” has been proposed to overcome their limitations. Spatial access takes into account both the density of (availability) and distance to (proximity) facilities (Hansen, 1959; Salze et al., 2011; Stewart, 1941) but has yet to be applied in studies on fast food outlets.
Second, little is known about factors that influence the association between exposure to fast food outlets and weight status. Four studies have investigated the moderating role of gender (Block, Christakis, O’Malley, & Subramanian, 2011; Boone-Heinonen et al., 2011; Burgoine et al., 2014; Jeffery, Baxter, McGuire, & Linde, 2006). The three studies conducted in the United States reported evidence for such effect modification, with one study reporting that the association between fast food outlets and body mass index was only significant for women (Block et al., 2011), and the other two reporting that the associations between fast food outlets and diet (Boone-Heinonen et al., 2011) and body mass index (Jeffery et al., 2006) were stronger for men. The only non-U.S. study (conducted in the United Kingdom) concluded that there was no evidence for effect modification by gender (Burgoine et al., 2014). Although younger adults are more likely to consume fast food (Drewnowski & Shultz, 2001; Moore, Roux, Nettleton, Jacobs, & Franco, 2009; Rangan, Schindeler, Hector, Gill, & Webb, 2009), no evidence for effect modification by age has been found in previous studies (Boone-Heinonen et al., 2011; Hollands, 2012; Nago, Lachat, Dossa, & Kolsteren, 2014), although these studies were mainly conducted in the United States. It has also been hypothesized that the association between neighborhood food environments and weight status differs by levels of socioeconomic status (SES). Less educated individuals tend to consume more takeaway foods than do more highly educated individuals (Miura, Giskes, & Turrell, 2012), and there is some evidence that the consumption of takeaway foods high in sugar and salt can explain differences in body mass index between the least and most educated (Miura & Turrell, 2014). As such, the effects of the local food environment on weight status may be strongest in people of low SES because their activity spaces—that is, the areas they use for their daily routines—are generally smaller than those of individuals of high SES (Jones & Pebley, 2014), leading to a higher dependence on the direct neighborhood environment.
Third, thus far, no study has investigated the linking pathways of observed associations between exposure to fast food outlets and obesity, although Burgoine et al. (2014) and Hollands et al. (2014) found that proximity to and availability of fast food outlets were associated with both fast food consumption and weight status. Yet not only fast food consumption but also perceptions about the availability of fast food outlets, and their use, may be linking variables. Most studies use objective measures of availability of, and proximity to, fast food outlets, such as those provided by Geographic Information System (GIS) tools (Fraser et al., 2010). However, a study from the United States showed that use of specific food venues, and not objectively measured availability, was associated with consumption of fruits and vegetables (Gustafson et al., 2012). As such, perceived availability and venue use may also play a mediating role in the association between exposure to fast food outlets and weight status.
Thus, to assess these possible mediators, we conducted a cross-sectional study in adults from five large urban regions in Europe in which we examined the association between spatial access to fast food outlets and body weight. Furthermore, we assessed the potential mediating role of perceived availability and usage of fast food outlets, and frequency of fast food consumption, and the potential moderating role of age, gender, SES, and urban region.
Method
Study Design and Sampling
This study was part of the European Spotlight project, conducted in five urban European regions: Ghent and suburbs (Belgium), Paris and inner suburbs (France), Budapest and suburbs (Hungary), the Randstad (a conurbation including the cities Amsterdam, Rotterdam, the Hague, and Utrecht in the Netherlands), and Greater London (United Kingdom; Lakerveld et al., 2012).
Sampling of neighborhoods and recruitment of participants have been described in detail elsewhere (Lakerveld et al., 2015). Neighborhoods were defined according to small-scale local administrative boundaries as used in each country, except for Hungary, where we defined 1 km2 areas to represent neighborhoods to ensure comparability between study areas. Neighborhoods were smallest in Paris and inner suburbs (0.3 km2 on average) and largest in Greater London (3.6 km2 on average), with an average across all five locations of 1.5 km2. Mean neighborhood population was lowest in Ghent and suburbs (946 adults per neighborhood) and highest in Greater London (5,607 adults per neighborhood), with an average across all five locations of 2,700 adults per neighborhoods. Neighborhood sampling was based on a combination of residential density and SES data at neighborhood level. This resulted in four types of neighborhoods: low SES/low residential density, low SES/high residential density, high SES/low residential density, and high SES/high residential density. In each country, three neighborhoods of each neighborhood type were randomly sampled (i.e., 12 neighborhoods per country, 60 neighborhoods in total).
An online survey among residents of the selected neighborhoods contained questions on demographics, neighborhood perceptions, social environmental factors, health, motivations and barriers for healthy behavior, obesity-related behaviors, and weight and height. A total of 6,037 individuals (10.8% response rate) participated in the survey between February and September 2014. The study was approved by the corresponding local ethics committees of participating countries, and all participants provided informed consent.
Measures
Outcome: Weight status
Body mass index was calculated as self-reported body weight (kg) divided by height (m) squared as obtained from the survey. Overweight was defined as a body mass index ≥25 kg/m2 and obesity as body mass index ≥30 kg/m2 in accordance with World Health Organization (WHO) guidelines (WHO, 2000). All three body weight variables were considered as outcome variables.
Potential mediator: Perceived availability and usage of fast food outlets
Participants were asked about the availability and usage of fast food outlets in their neighborhood. Answering options to this single question were “available and used,” “available, not used,” and “not available,” Please note, participants could report that they consumed fast food without actually using the fast food outlets they perceived to be available in their residential neighborhood; that is, because they consumed fast food from an outlet located outside their residential neighborhood.
Potential mediator: Fast food consumption
Data collection on consumption of specific foods was restricted to a number of straightforward questions on the frequency of consumption. One of them was “How many times a week do you eat fast food?” with answering options ranging from “once a week or less” to “more than two times a day.” Since 94% of participants reported consuming fast food once a week or less, the variable was dichotomized into “once a week or less” (94%) and “more than once a week” (6%).
Predictor variables: Measures of spatial access to fast food outlets
Neighborhood characteristics related to the food environment were objectively assessed using a valid and reliable virtual audit tool that was used in the Street View feature of Google Earth (the Spotlight Virtual Audit Tool (Bethlehem et al., 2014). The audit followed standard operating procedures to assess the presence of 42 street-level neighborhood characteristics representing eight dimensions (e.g., walkability, aesthetics, etc.) of the food and physical activity environment (Bethlehem et al., 2014; Feuillet et al., 2016). Data collection on location and type of food outlet took place in the selected residential neighborhoods and a 300 m Euclidean buffer around these neighborhoods. Types of food outlets were classified according to the food outlet classification of Lake and colleagues (Lake, Burgoine, Stamp, & Grieve, 2012), which defined fast food and takeaway outlets (which were combined in this study) as venues with the following characteristics: Hot food ordered and paid for at the till; available instantly as commonly cooked in bulk and kept hot; wait while food is prepared and cooked; with no sit-down option to eat-in—although may have a seated waiting area; food that can be eaten without cutlery; sit down; takeaway and drive-thru facilities; may be part of a chain or franchise.
We calculated individual “spatial accessibility” scores (Hansen, 1959) by summing the inversely weighted Euclidean distances from each individual’s home address to each of the fast food outlets in that person’s residential neighborhood (defined by residential neighborhoods and a 300 m buffer around them) using ArcGIS 10.0. These scores are based on the distance decay principle that states that the interaction between geographical objects (e.g., food outlets) and individuals declines as the distance between them increases and reflect both distance to the nearest fast food outlet(s) and the number of fast food outlets in a given area (Hansen, 1959; Salze et al., 2011; Stewart, 1941). Higher spatial access scores indicate a higher potential exposure to fast food outlets.
For sensitivity analyses, we also used measures of availability (density of fast food outlets per square kilometer) and proximity (Euclidean distance to the nearest fast food outlet) as predictor variables.
Due to the right-skewed distribution of the predictor variables, all three measures (Spatial access, Availability, and Proximity) were categorized into “no,” “low,” “medium,” and “high” with the first group consisting of individuals living in a neighborhood without fast food outlets and the remaining three groups being tertiles of spatial access, availability, or proximity of fast food outlets in those that did have fast food outlets in the neighborhood.
Covariates
Information on age, gender, number of children in the household and educational status was obtained from the survey. Since education systems differ across countries, we divided self-reported education levels into “higher education” (college or university level) and “lower education” (from less than primary to higher secondary education).
Food environment–obesity associations may be distorted due to residential “self-selection”. This refers to the tendency of people to live in places with characteristics that suit their preferred behaviors and becomes a problem in cross-sectional studies when selection factors are not appropriately controlled for (Ramanathan, 2002). As such, the SPOTLIGHT questionnaire also contained a number of questions related to residential self-selection. We asked all respondents about the factors that influenced their decision to live in their neighborhood. Of the possible reasons that respondents could give for living where they do we used the answer “There are restaurants or bars nearby” (could be answered by yes/no) as an indicator of neighborhood choice related to the food environment. Furthermore, we asked individuals whether they wished to continue to live in their current neighborhood or whether they would like to move (neighborhood preference). Last, we asked individuals how long they had lived in their current neighborhood.
Statistical Analysis
Data from the five urban regions were pooled. After exclusion of individuals whose residential addresses were located outside the selected neighborhoods (n = 840), and individuals who lived in one Hungarian and one Dutch neighborhood with missing data on geolocalized food outlets (n = 121), a sample of 5,076 participants was available for analysis. Item nonresponse ranged from <1% (age, gender) to 30% (residential self-selection). Assuming that data were missing at random (i.e., the probability that a variable value is missing depends on other data that are observed in the data set but not on any of the missing values), multiple imputations were performed. Given the percentage of missing values, 30 imputed data sets were generated, as recommended by Rubin and Bodner (Bodner, 2008; Rubin, 1987). Missing values were imputed using Predictive Mean Matching in SPSS version 22.0. All variables described in the methods section were entered in the imputation models, and all regression analyses were performed on the imputed data sets.
We described the characteristics of the total study population, as well as by age, gender, and education using nonimputed data. Furthermore, we tested the univariate association between variables of interest and spatial access to fast food outlets using chi-square tests for categorical variables and analysis of variance (ANOVA) tests for continuous variables.
Logistic regression analyses with clustered errors at the neighborhood level were conducted to examine the total effect of spatial access to fast food outlets on overweight and obesity (c-path; for body mass index as outcome, we conducted linear regression analyses.) We examined the potential moderating role of age (below 65 years of age or older than 65 years), educational level (high vs. low), gender, neighborhood type, and urban region by adding interaction terms to the regressions. None of the interaction terms was statistically significant, and we decided to use the above-mentioned variables as covariates. Also, no significant exposure–mediator interactions were found (Valeri & VanderWeele, 2013). We present unadjusted models; models adjusted for age, gender, number of children in the household, educational level, and urban region; and models additionally adjusted for residential self-selection (neighborhood preference, neighborhood choice, and duration of residency) and high/low level of neighborhood residential density. The latter was done to adjust for potential colocation of fast food outlets and other types of food outlets in areas with higher residential density.
We hypothesized that “perceived availability and usage of fast food outlets” and “fast food consumption” mediated the associations between spatial access to fast food outlets and weight status; this serial mediation model is depicted in Figure 1. We first explored two single mediation models. The first single mediation model tested the association between spatial access to fast food outlets and “perceived availability and use of fast food outlets” (a1-path, using multinomial logistic regression) and between “perceived availability and use of fast food outlets” and weight status (b1-path). The second single mediation model tested the association between spatial access to fast food outlets and frequency of fast food consumption (a2-path) and between frequency of fast food consumption and weight status (b2-path). Furthermore, we examined the association between “perceived availability and use of fast food outlets” and frequency of fast food consumption (d-path) and the direct association between spatial access to fast food outlets and weight status adjusted for the mediators (c’-path). In case of evidence for both single mediation models, a serial multiple mediator model would be conducted. Statistical significance was set at p < .05.
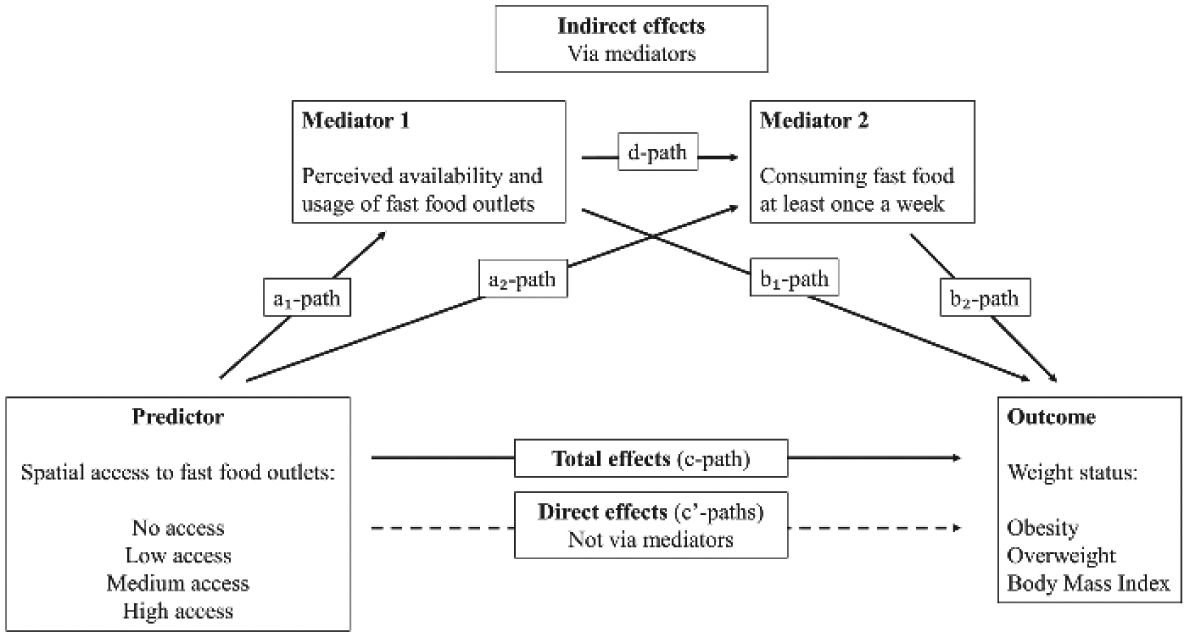
Conceptual pathways from spatial access to fast food outlets to adult weight status.
Mediating effects were examined using MacKinnon’s product-of-coefficient’s method (Hayes, 2013; MacKinnon, Fairchild, & Fritz, 2007). Coefficients for the a- and b-paths were multiplied to assess the mediating effects (ab). The statistical significance of the mediating effects was examined by dividing the product-of-coefficients by its standard error (SE). This SE was calculated using the Sobel test. The proportion mediated can be computed by dividing the indirect effects (product-of-coefficients) by the total effect (ab / ab + c’) using standardized coefficients.
We conducted sensitivity analyses using “proximity to” and “availability of” fast food outlets as predictors and performed complete case analysis. For all analyses using categorical predictor variables, we examined the Wald p value for these variables to assess overall association between the predictor and the outcome.
Results
Study Sample Characteristics
Table 1 describes the characteristics of the study sample. Only 6% of the participants reported to consume fast food more than once a week, 46% were overweight, and 13% were obese. Approximately 34% of the individuals reported that fast food outlets were available and indicated to be using them. Individuals with high spatial access to fast food outlets were on average younger and more highly educated, had a lower mean body mass index and lower likelihood of being overweight. However, individuals with high access to fast food outlets were more likely (9%) to consume fast food more than once a week as compared with individuals with less access to fast food outlets. The percentage of individuals who perceived fast food outlets to be available and who used them was highest among individuals with the highest spatial access to fast food outlets (47%).
Characteristics of the Total Study Population and By Level of Spatial Access to Fast Food Outlets.
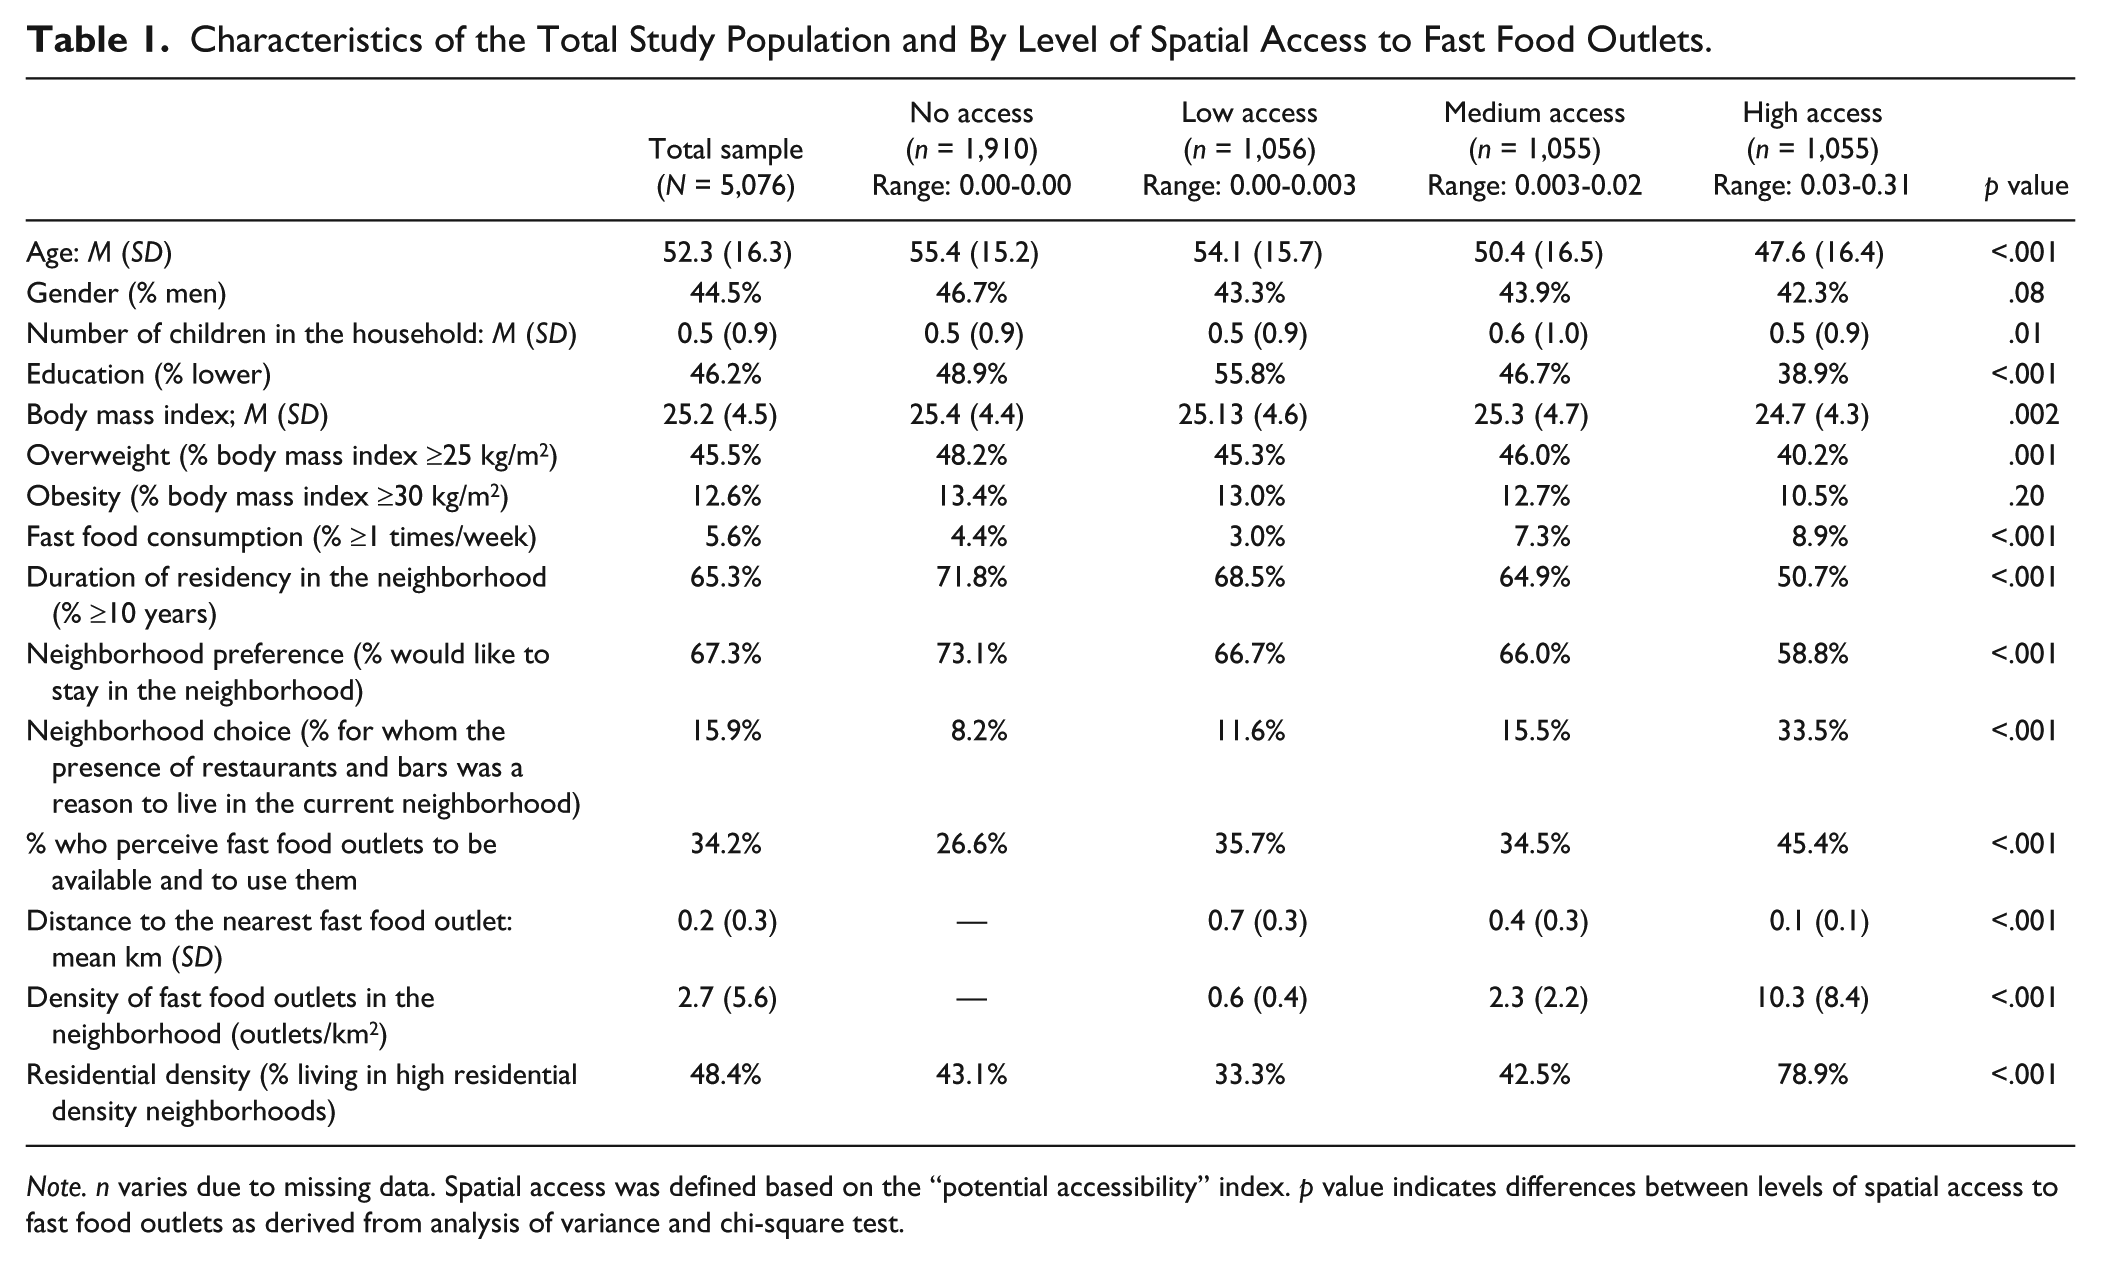
Note. n varies due to missing data. Spatial access was defined based on the “potential accessibility” index. p value indicates differences between levels of spatial access to fast food outlets as derived from analysis of variance and chi-square test.
Online Tables S1, S2, and S3 describe the characteristics of the study sample according to sociodemographics, urban region, and neighborhood type. Men (8%), adults aged <65 years (7%), and individuals with a lower level of education (7%) were more likely to consume fast food more than once a week than women (4%), adults aged ≥65 years (3%), and more highly educated individuals (5%). The proportion of respondents who reported consuming fast food more than once a week was highest in Greater London (13.0%) and lowest in the Randstad (3.0%), and highest in low SES/high residential density neighborhoods (8.1%) and lowest in high SES/low residential density neighborhoods (3.7%).
C-Path: Total Effects for the Association Between Spatial Access to Fast Food Outlets and Weight Status
Table 2 describes the association of spatial access to fast food outlets with obesity, overweight, and body mass index. After full covariate adjustment (Model 3), there was no evidence for an association between spatial access to fast food outlets and obesity, overweight or body mass index. Online Tables S4a and S4b describe the association of proximity to and availability of fast food outlets with weight status, which echo the inconsistent results presented in Table 2: participants living in a neighborhood with higher density of fast food outlets, or living in closer proximity to fast food outlets, did not have higher odds of obesity and overweight nor higher body mass index as compared with living in a neighborhood with no fast food outlets at all.
C-Path: Total Effects for the Association of Spatial Access to Fast Food Outlets With Obesity, Overweight, and Body Mass Index (N = 5,076).
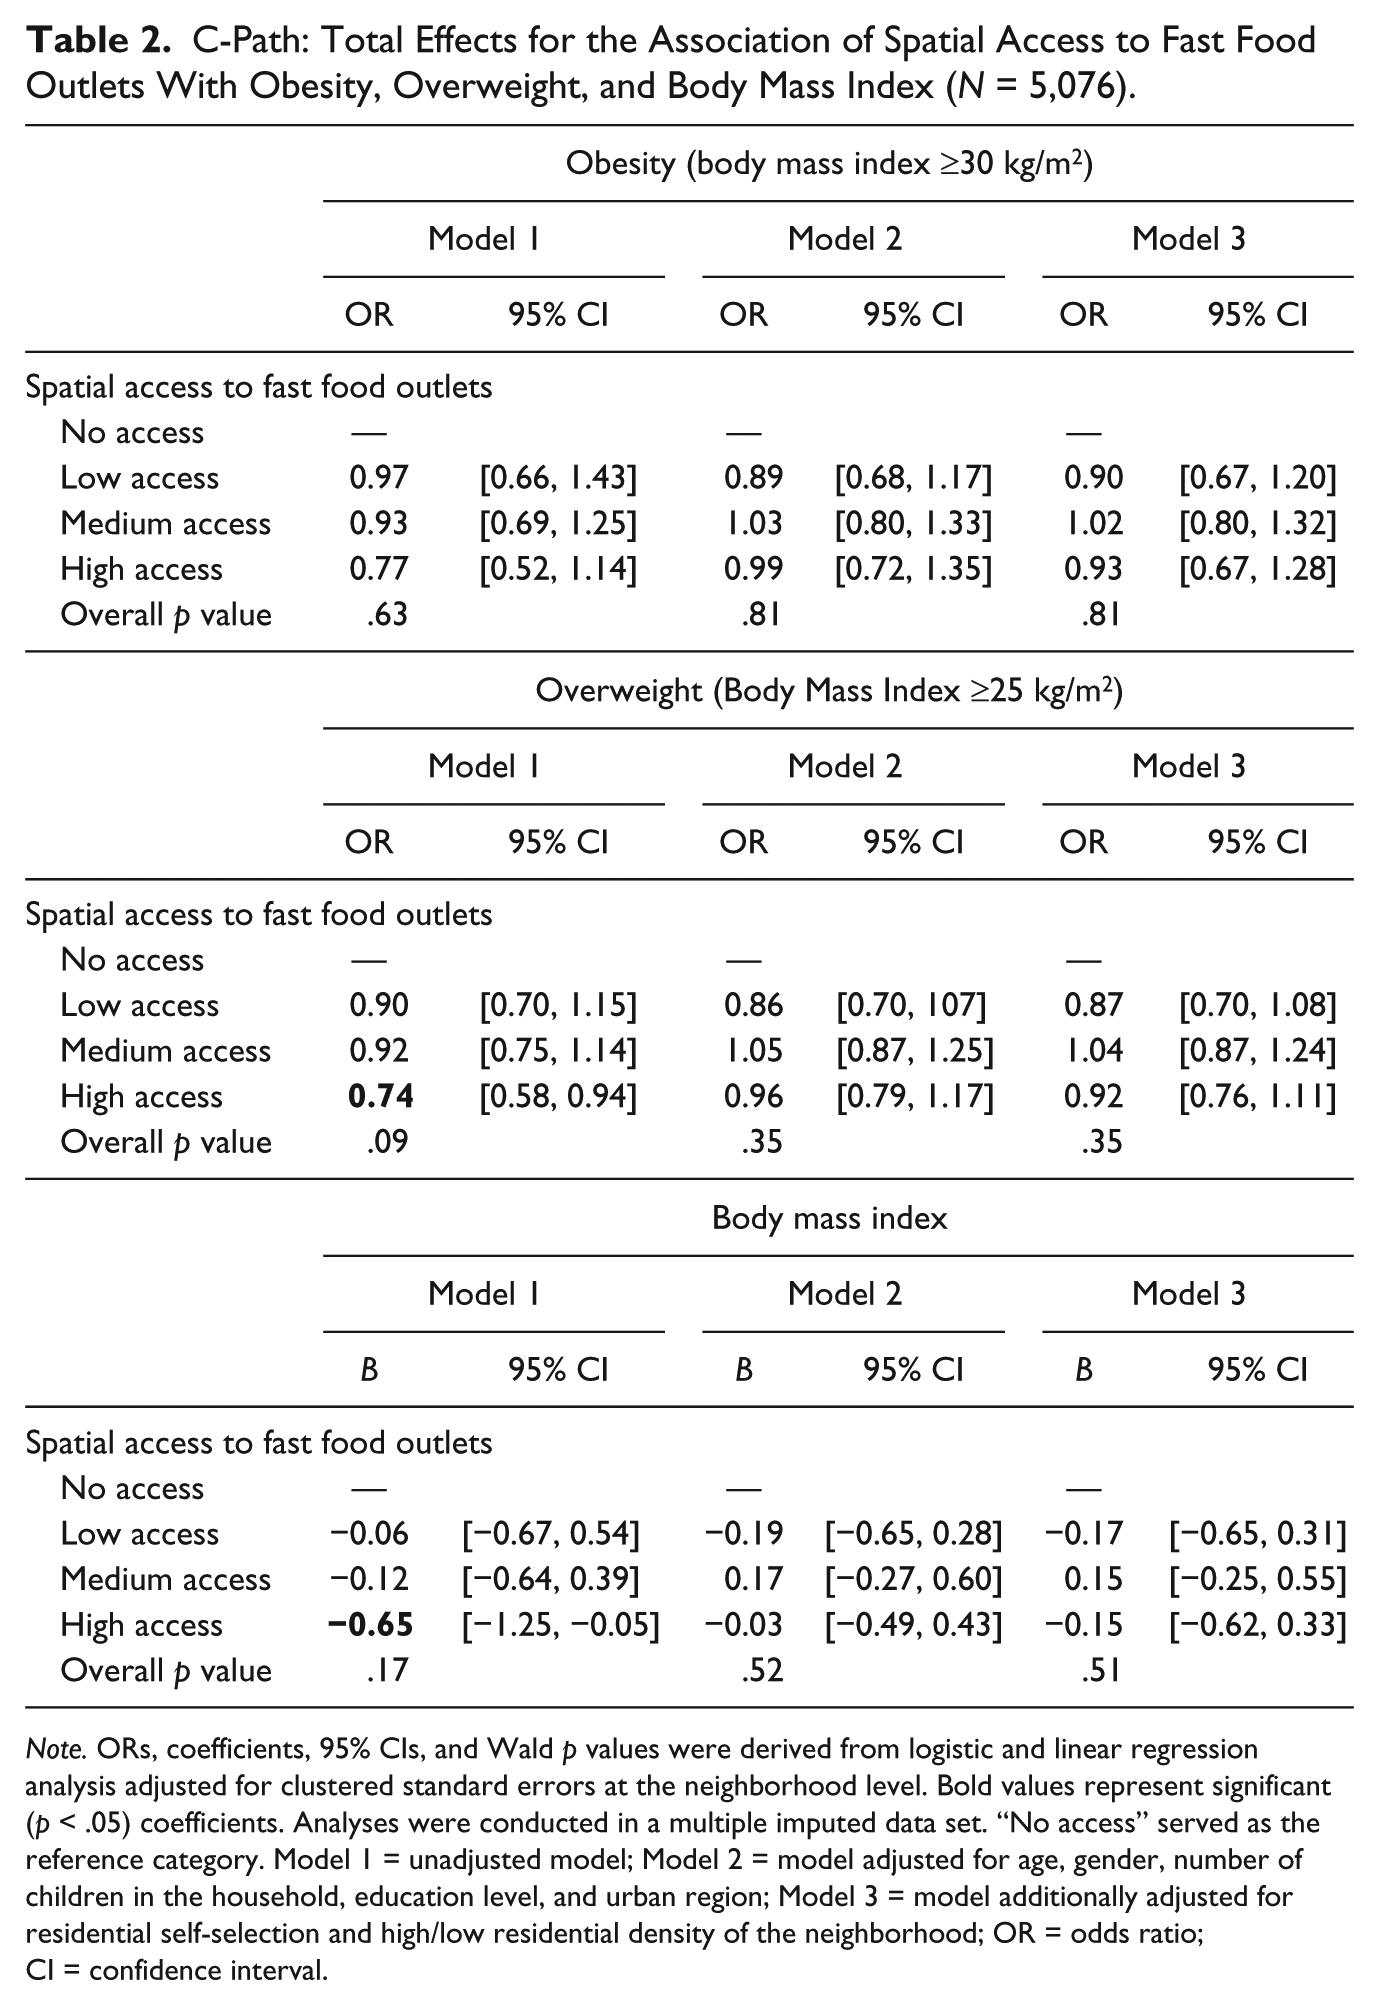
Note. ORs, coefficients, 95% CIs, and Wald p values were derived from logistic and linear regression analysis adjusted for clustered standard errors at the neighborhood level. Bold values represent significant (p < .05) coefficients. Analyses were conducted in a multiple imputed data set. “No access” served as the reference category. Model 1 = unadjusted model; Model 2 = model adjusted for age, gender, number of children in the household, education level, and urban region; Model 3 = model additionally adjusted for residential self-selection and high/low residential density of the neighborhood; OR = odds ratio; CI = confidence interval.
Complete case analysis (presented in Online Table S7) showed similar results as the results presented in Table 2.
A1-Path: Association Between Spatial Access to Fast Food Outlets and Perceived Availability and Usage of Fast Food Outlets
Table 3 shows that, after full covariate adjustment (Model 3), individuals with high spatial access had 2.1 times the odds of reporting that fast food outlets were available without using them (relative risk ratio [RRR] = 2.06, 95% confidence interval [CI] = [1.00; 4.29]) and 2.3 the odds of reporting that fast food outlets were available and using them (RRR = 2.30, 95% CI = [1.00; 5.31]) compared with individuals with no spatial access to fast food outlets. Online Table S5 shows the associations between proximity to and density of fast food outlets with perceived availability and usage of fast food outlets, showing similar but somewhat stronger results.
A1-Path: Association of Spatial Access to Fast Food Outlets With Perceived Availability and Usage of Fast Food Outlets (N = 5,076).
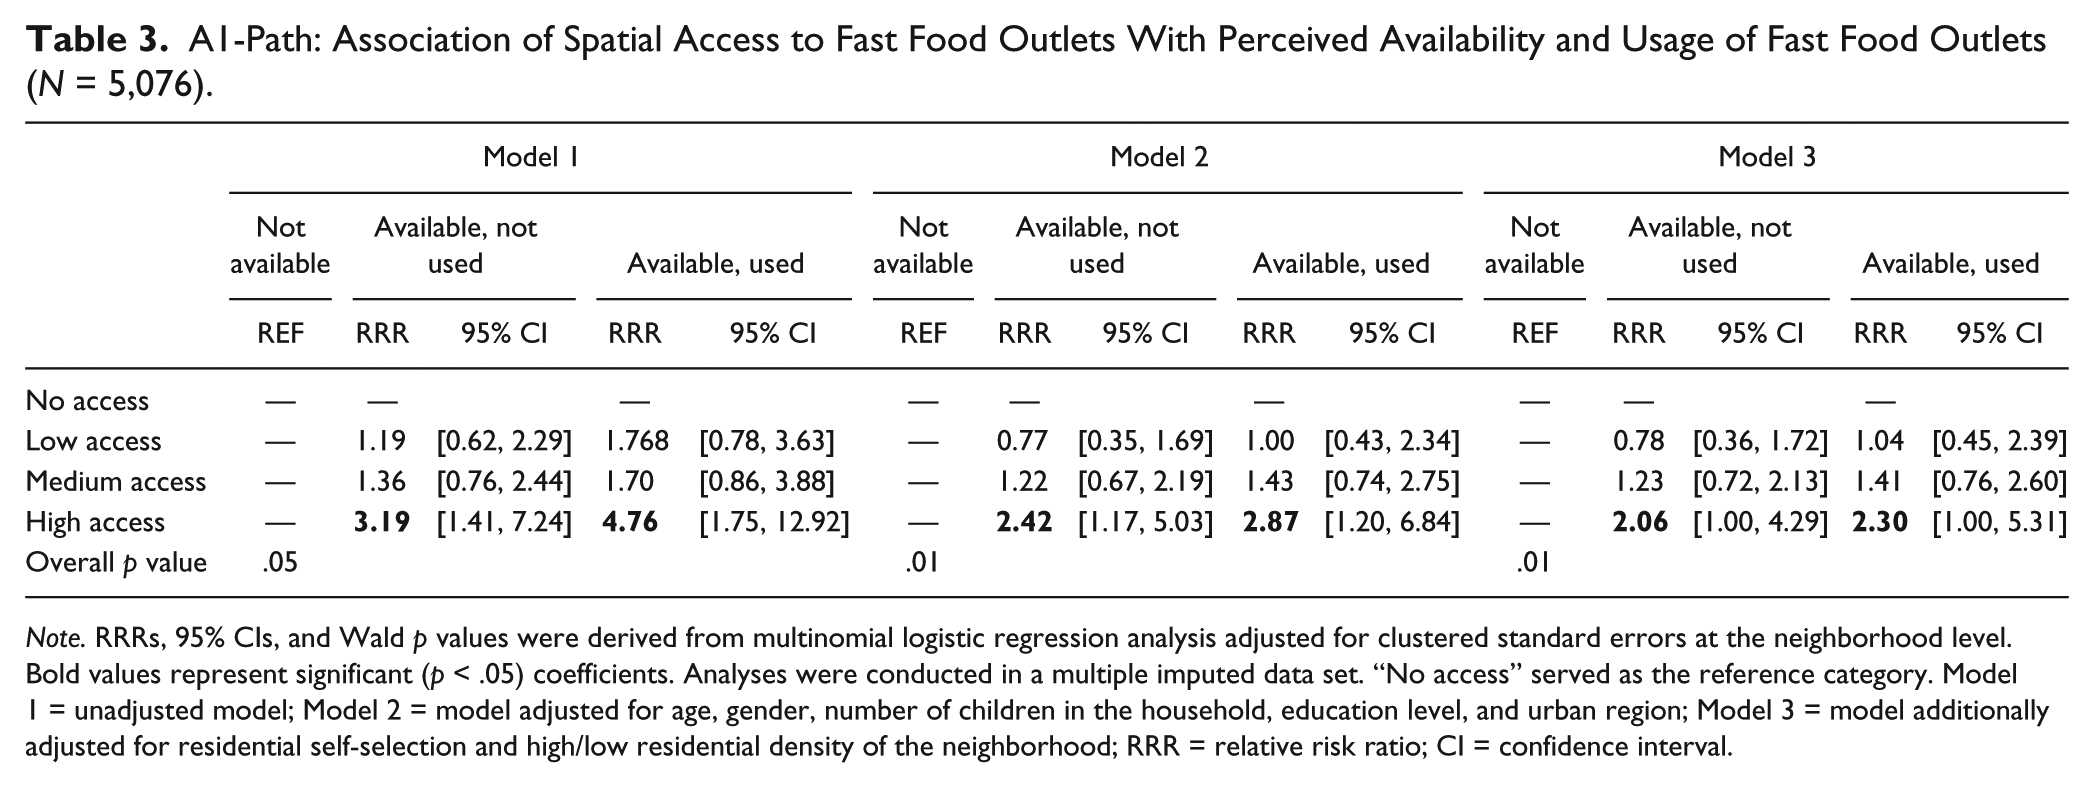
Note. RRRs, 95% CIs, and Wald p values were derived from multinomial logistic regression analysis adjusted for clustered standard errors at the neighborhood level. Bold values represent significant (p < .05) coefficients. Analyses were conducted in a multiple imputed data set. “No access” served as the reference category. Model 1 = unadjusted model; Model 2 = model adjusted for age, gender, number of children in the household, education level, and urban region; Model 3 = model additionally adjusted for residential self-selection and high/low residential density of the neighborhood; RRR = relative risk ratio; CI = confidence interval.
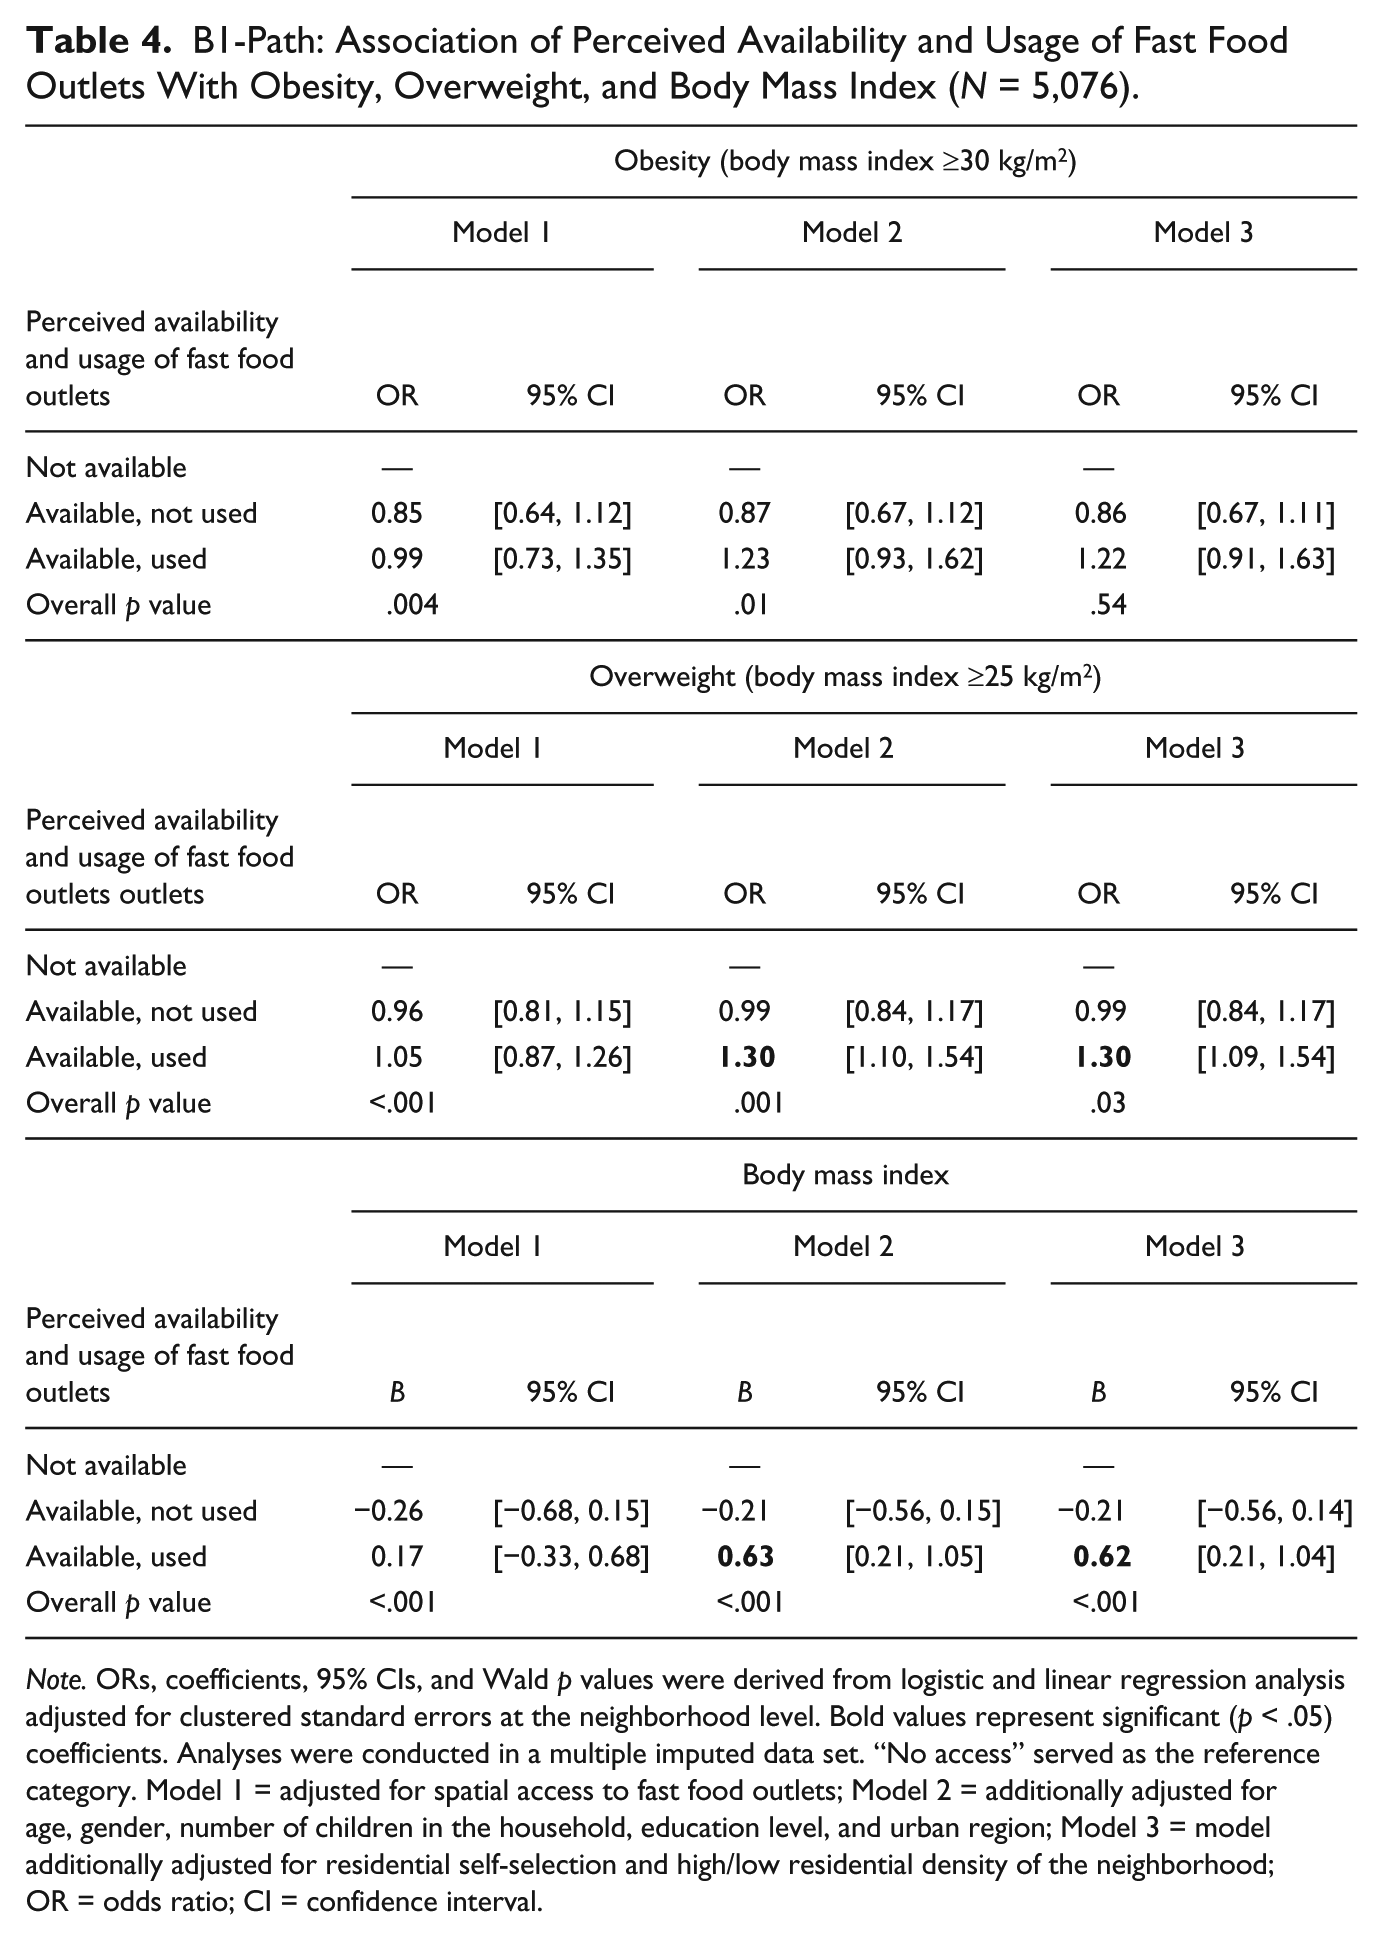
B1-Path: Association of Perceived Availability and Usage of Fast Food Outlets With Weight Status
Table 4 shows that perceived availability and usage of fast food outlets was not associated with obesity. Yet individuals who reported fast food outlets to be present and to use them had 1.3 times the odds of being overweight and had a 0.62 kg/m2 higher body mass index.
B1-Path: Association of Perceived Availability and Usage of Fast Food Outlets With Obesity, Overweight, and Body Mass Index (N = 5,076).
Note. ORs, coefficients, 95% CIs, and Wald p values were derived from logistic and linear regression analysis adjusted for clustered standard errors at the neighborhood level. Bold values represent significant (p < .05) coefficients. Analyses were conducted in a multiple imputed data set. “No access” served as the reference category. Model 1 = adjusted for spatial access to fast food outlets; Model 2 = additionally adjusted for age, gender, number of children in the household, education level, and urban region; Model 3 = model additionally adjusted for residential self-selection and high/low residential density of the neighborhood; OR = odds ratio; CI = confidence interval.
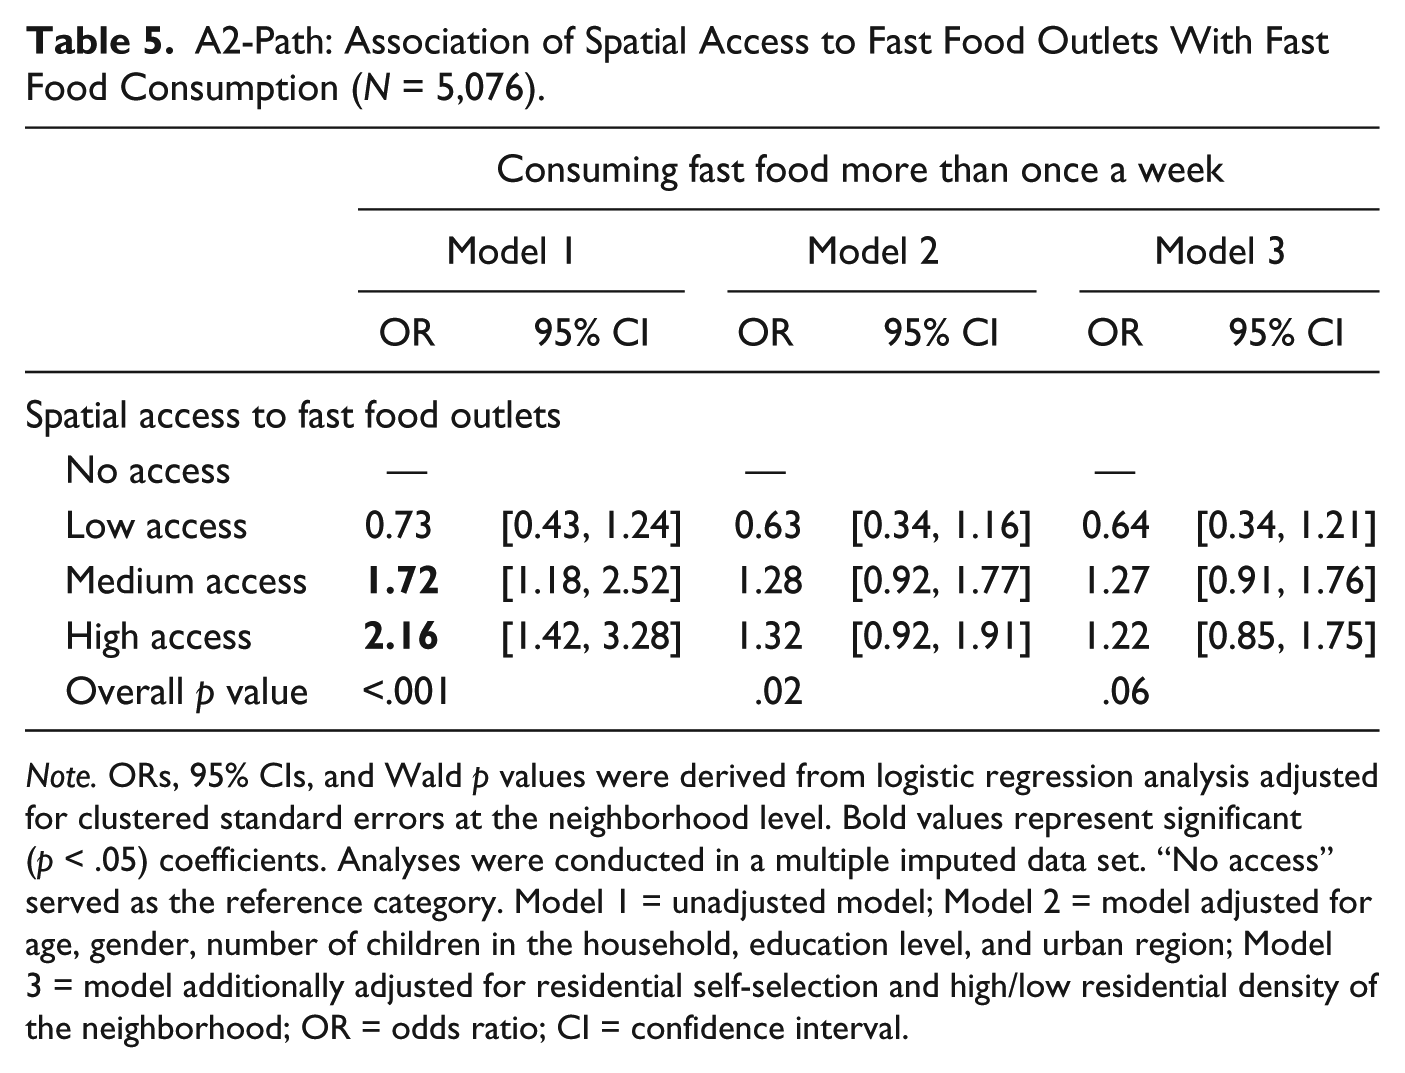
A2-Path: Association Between Spatial Access to Fast Food Outlets and Fast Food Consumption
Table 5 shows that, in an unadjusted model, individuals with high spatial access to fast food outlets in their neighborhood had 2.2 times the odds of consuming fast food more than once a week compared with individuals with no spatial access to fast food outlets at all. However, after adjustment for covariates, this association was no longer statistically significant. Similar results were found when linking proximity to and density of fast food outlets to the frequency of fast food consumption (shown in Online Table S6).
A2-Path: Association of Spatial Access to Fast Food Outlets With Fast Food Consumption (N = 5,076).
Note. ORs, 95% CIs, and Wald p values were derived from logistic regression analysis adjusted for clustered standard errors at the neighborhood level. Bold values represent significant (p < .05) coefficients. Analyses were conducted in a multiple imputed data set. “No access” served as the reference category. Model 1 = unadjusted model; Model 2 = model adjusted for age, gender, number of children in the household, education level, and urban region; Model 3 = model additionally adjusted for residential self-selection and high/low residential density of the neighborhood; OR = odds ratio; CI = confidence interval.
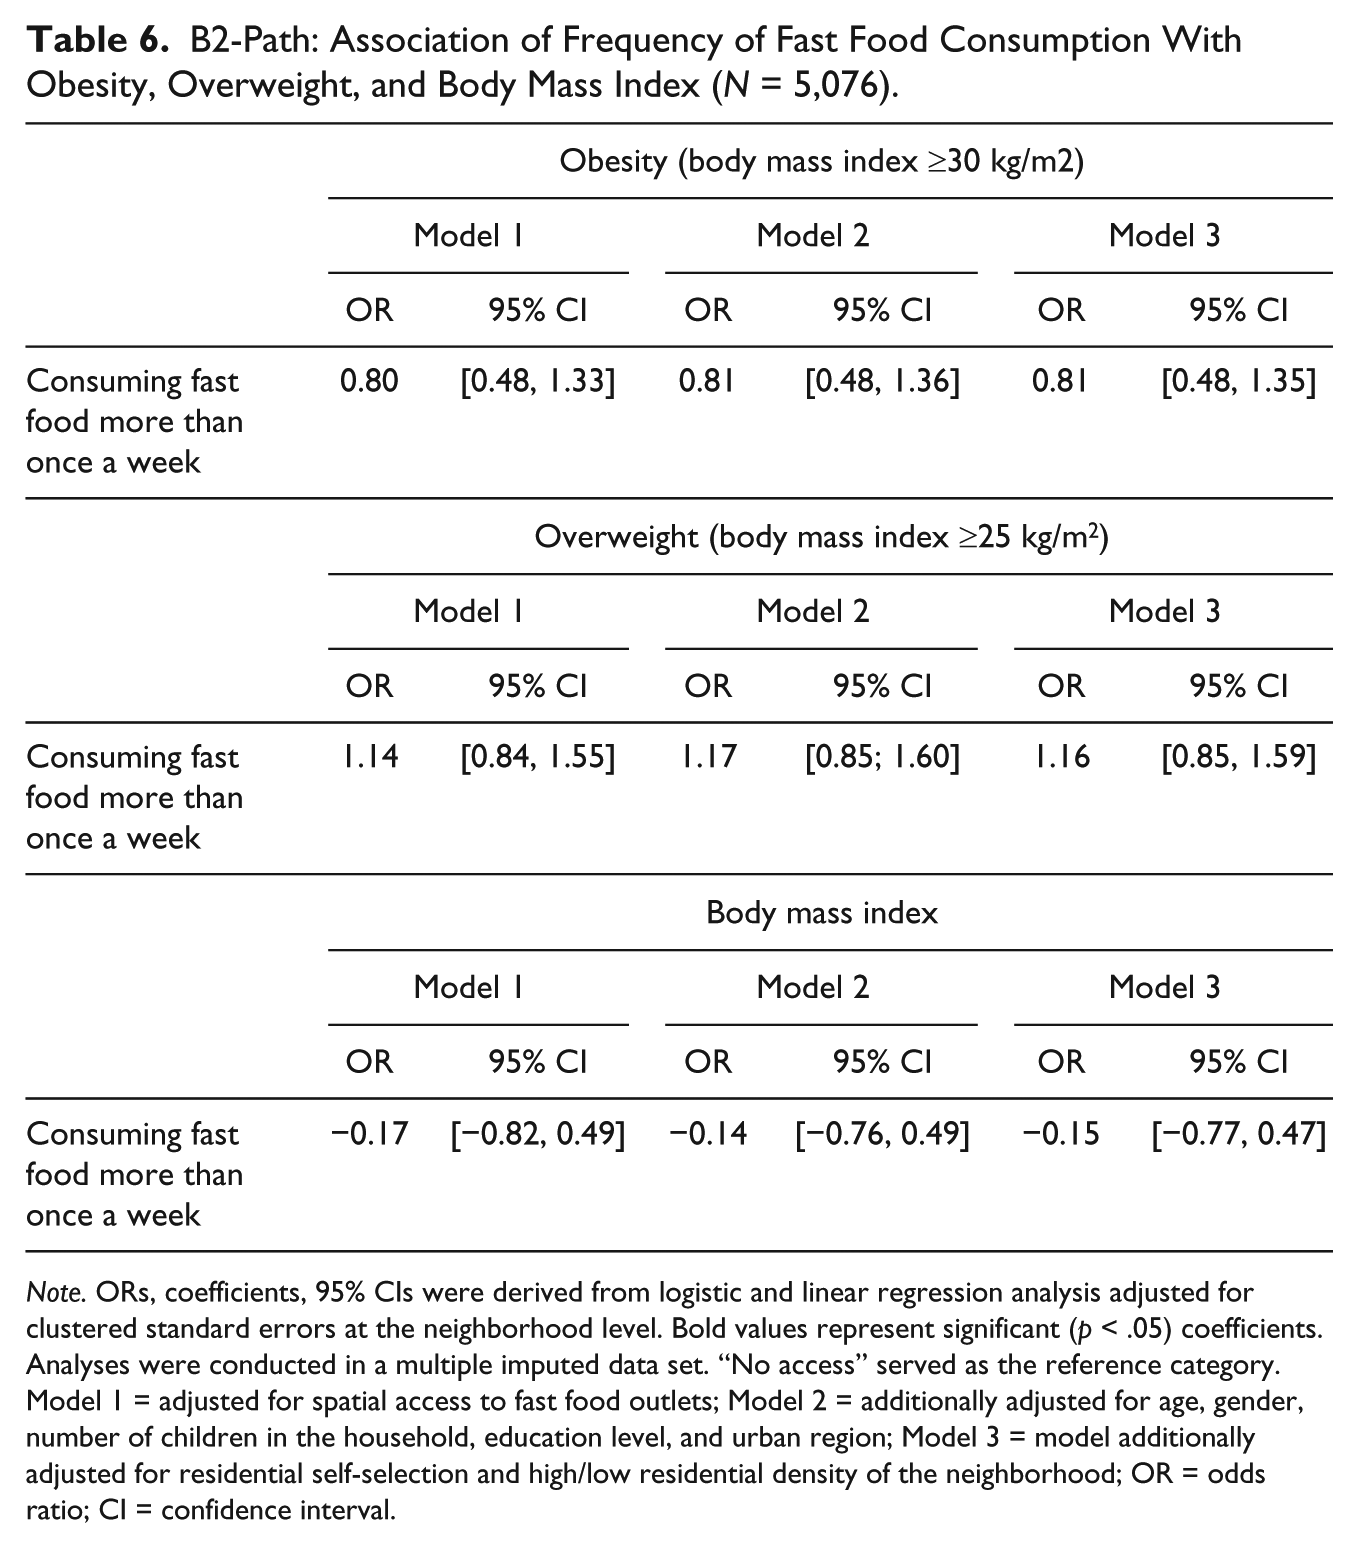
B2-Path: Association Between Fast Food Consumption and Weight Status
Table 6 shows that the frequency of fast food consumption was not significantly related to obesity, overweight, or continuous body mass index.
B2-Path: Association of Frequency of Fast Food Consumption With Obesity, Overweight, and Body Mass Index (N = 5,076).
Note. ORs, coefficients, 95% CIs were derived from logistic and linear regression analysis adjusted for clustered standard errors at the neighborhood level. Bold values represent significant (p < .05) coefficients. Analyses were conducted in a multiple imputed data set. “No access” served as the reference category. Model 1 = adjusted for spatial access to fast food outlets; Model 2 = additionally adjusted for age, gender, number of children in the household, education level, and urban region; Model 3 = model additionally adjusted for residential self-selection and high/low residential density of the neighborhood; OR = odds ratio; CI = confidence interval.
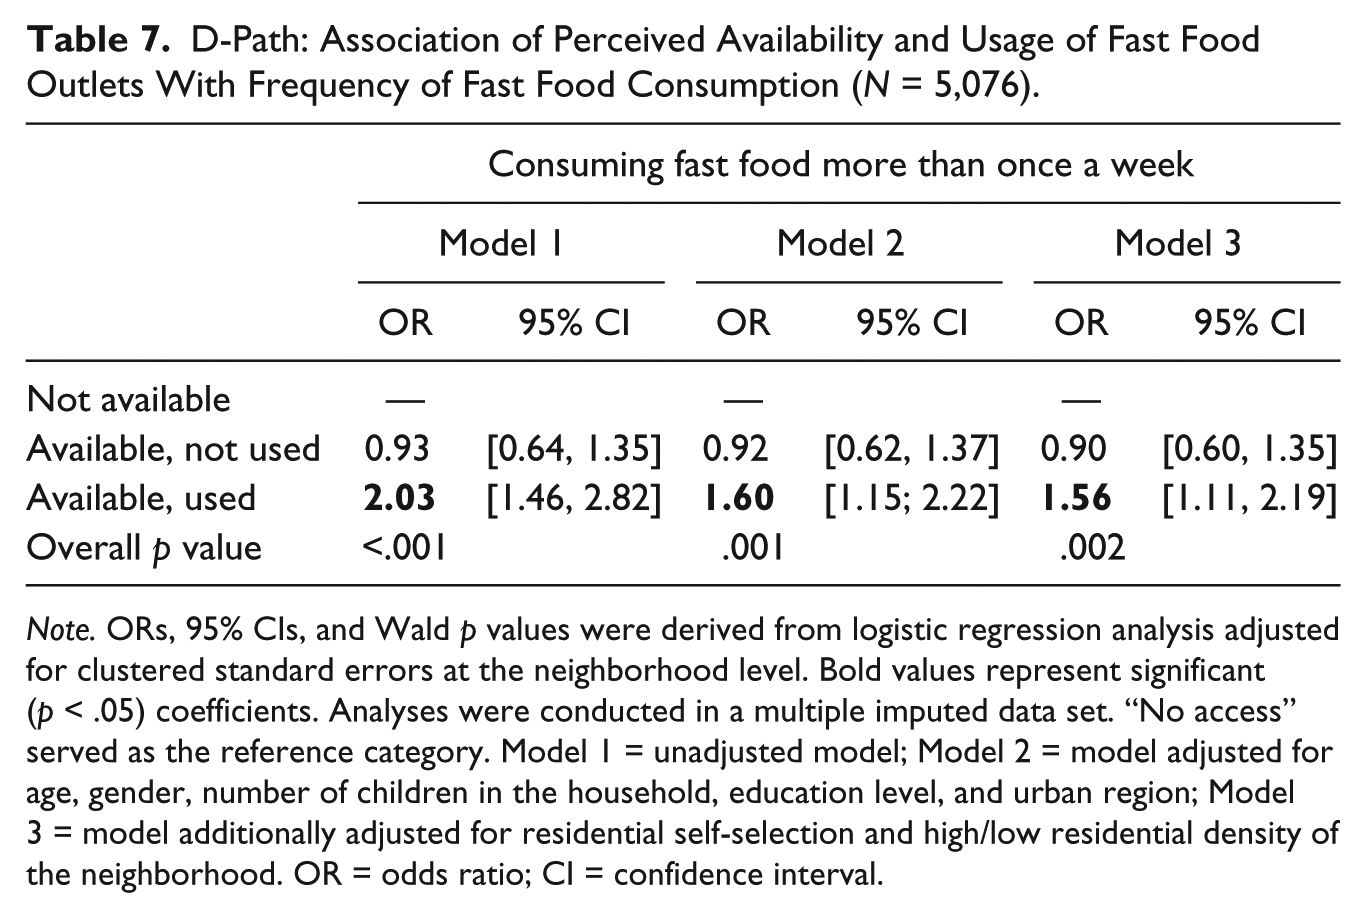
D-Path: Association Between Perceived Availability and Usage of Fast Food Outlets and Fast Food Consumption
Individuals who reported fast food outlets to be available and to use them had 1.6 times the odds of consuming fast food more than once a week than individuals who reported fast food outlets not to be available in their neighborhood (Table 7; odds ratio [OR] = 1.56; 95% CI = 1.11, 2.19).
D-Path: Association of Perceived Availability and Usage of Fast Food Outlets With Frequency of Fast Food Consumption (N = 5,076).
Note. ORs, 95% CIs, and Wald p values were derived from logistic regression analysis adjusted for clustered standard errors at the neighborhood level. Bold values represent significant (p < .05) coefficients. Analyses were conducted in a multiple imputed data set. “No access” served as the reference category. Model 1 = unadjusted model; Model 2 = model adjusted for age, gender, number of children in the household, education level, and urban region; Model 3 = model additionally adjusted for residential self-selection and high/low residential density of the neighborhood. OR = odds ratio; CI = confidence interval.
C’-Paths: Direct Effects for the Association Between Spatial Access to Fast Food Outlets and Weight Status
In supplemental tables, we present the direct effects for the association between spatial access to fast food outlets and obesity, overweight, and continuous body mass index after adjustment for perceived availability and usage of fast food outlets (Online Table S8) and fast food consumption (Online Table S9): no significant associations were observed.
Mediating Pathways
Table 8 presents the mediation effects. For obesity as an outcome, no mediating pathways were tested as none of the a- or b-paths was statistically significant. For overweight as outcome, we tested the mediating role of “perceived availability and usage of fast food outlets” and found that perceiving fast food outlets to be present and to use them showed a trend toward significant mediation (p = .06) of the association between having the most spatial access to fast food outlets compared with having no access and overweight status (ab = 0.22, Sobel test statistic [p value] = 1.90 [.06]). For continuous body mass index as outcome, we found a similar result, with ab = 0.51 and Sobel test statistic = 1.91 (p = .06). We did not calculate the proportion mediated because its interpretation is not relevant if no total effect is present. As we only found evidence for borderline significant mediation of one of the mediator variables, we did not conduct a serial mediation analysis.
Mediating Role of Perceived Availability and Usage of Fast Food Outlets and Frequency of Fast Food Consumption in the Association of Spatial Access to Fast Food Outlets With Obesity, Overweight, and Body Mass Index (N = 5,076).
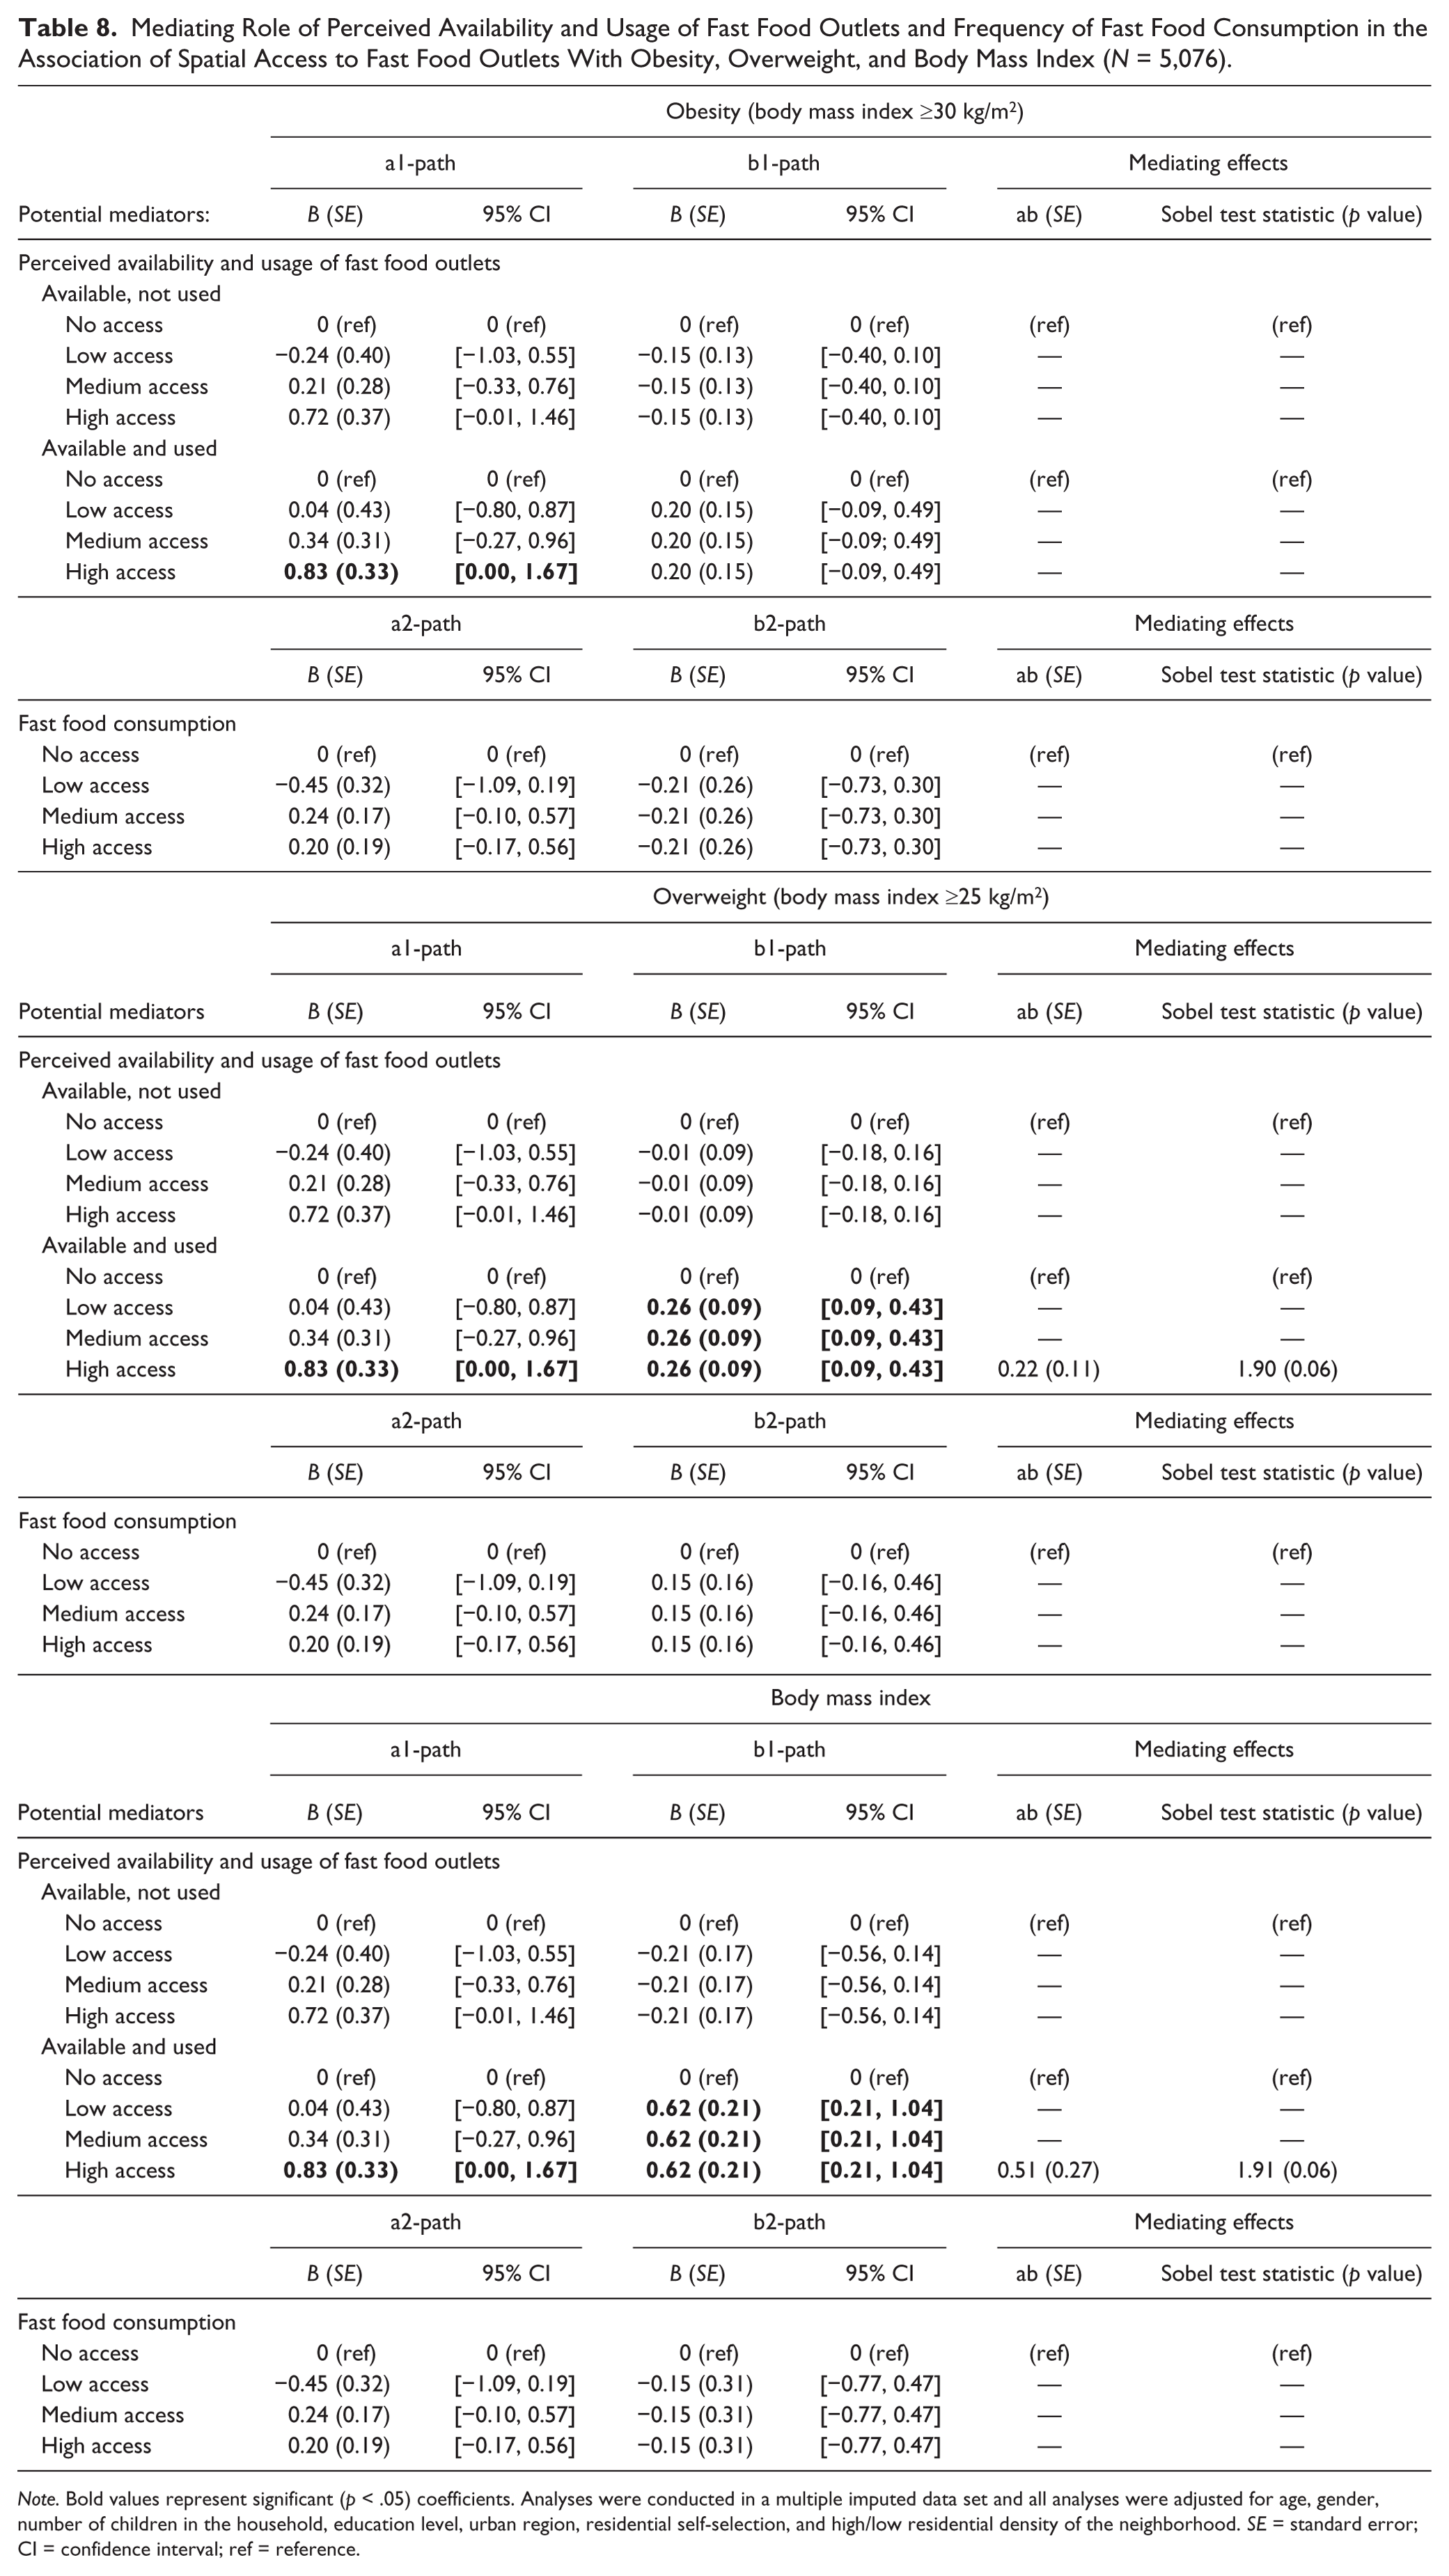
Note. Bold values represent significant (p < .05) coefficients. Analyses were conducted in a multiple imputed data set and all analyses were adjusted for age, gender, number of children in the household, education level, urban region, residential self-selection, and high/low residential density of the neighborhood. SE = standard error; CI = confidence interval; ref = reference.
Discussion
We found that perceived availability combined with usage of fast food outlets in residential neighborhoods was associated with consuming fast food more than once a week. Perceiving fast food outlets to be available, but not using them, was not associated with self-reported frequency of fast food consumption. There were no total effects of objective measures of access to and availability of fast food outlets on weight status. Yet we found a borderline significant indirect effect through perceived availability and usage of fast food outlets in the association between high spatial access compared with no spatial access with overweight and body mass index. In our examinations of the role of potential moderating variables, we found that neither age, gender, SES nor neighborhood type and urban region moderated the associations under study.
We found no evidence for the total effect of spatial access to fast food outlets on weight status, and we found limited evidence for indirect effects. This may have a number of explanations, such as a lack of power to detect such distal effects (it might, for example, take years before specific aspects of the food environment affect weight status), unobserved effects of a suppressor variable, or inconsistent mediation. However, the lack of total effects does not mean that no indirect effects could exist. The fact that we found indirect effects of high spatial access to fast food outlets on body mass index and overweight through perceived availability and usage of fast food outlets suggests that perceptions and usage of facilities in the residential neighborhoods may be a “linking” or “explanatory” variable (Hayes, 2009; Mathieu & Taylor, 2006) providing insights in the mechanisms through which neighborhoods affect weight status. This corresponds with our hypothesis that previous associations between access to fast food outlets and weight status are inconsistent because mediating variables were not taken into account.
Our results are similar to an Australian study, showing that objective availability of foods was not directly associated with consumption, but perceived availability was (Giskes, van Lenthe, Brug, Mackenbach, & Turrell, 2007). This may be due to abundant availability of fast food outlets, because perceptions of the food environment are more closely related to actual behaviors than are objective measurements of the food environment (McCormack et al., 2004) or because the objective neighborhood environment affects weight status only indirectly via other variables.
We found roughly similar results when using different definitions of “exposure” to characterize the local food environment. The implications of using different concepts (availability, proximity, spatial access) have previously been outlined (Burgoine, Alvanides, & Lake, 2013; Caspi, Sorensen, Subramanian, & Kawachi, 2012; Charreire et al., 2010; Roda et al., 2016; Thornton, Pearce, Macdonald, Lamb, & Ellaway, 2012). The usefulness of each of these concepts may depend on the characteristics of the areas under study. In the neighborhoods selected for this study, average distance to the nearest fast food outlet was less than 400 m (even in the neighborhoods with low residential density). One explanation for the lack of total effects may be that in areas where fast food outlets are effectively ubiquitous, “spatial access” based on availability and distance—or measures of proximity and availability alone—may just not be a strong correlate of weight status.
To our knowledge, our study is the first to distinguish between individuals who perceive food outlets to be available in their residential neighborhood without using them and individuals who perceive food outlets to be available who also use them. The use of these categories resulted in distinct results. For example, perceived availability and usage of fast food outlets in the residential neighborhood was associated with higher odds of fast food consumption, higher odds of overweight, and higher body mass index, whereas perceived availability of fast food outlets in the residential neighborhood—but without usage—was not. The individuals in this latter category may have specific characteristics that could “protect” them from environmental influences, such as just not liking fast food or high self-efficacy or self-determination to eat healthily (Teixeira, Silva, Mata, Palmeira, & Markland, 2012). These results are concordant with studies that show that increased proximity or availability of facilities for healthy choices is not always associated with use, but use is most often associated with health behaviors (Gustafson et al., 2012; Kaczynski et al., 2014; Kesten, Guell, Cohn, & Ogilvie, 2015).
Future studies could combine information on availability, accessibility, and affordability. Although access based on distance only may seem equal for high and low SES groups, previous studies have shown that taking into account affordability changes the meaning of accessibility (Breyer & Voss-Andreae, 2013; Drewnowski, Aggarwal, Hurvitz, Monsivais, & Moudon, 2012; Ghosh-Dastidar et al., 2014; Jiao, Moudon, Ulmer, Hurvitz, & Drewnowski, 2012). In addition, studies could focus on the mix of healthy and unhealthy food options in a neighborhood in relation to dietary patterns consisting of healthy and unhealthy foods, to examine whether the food environment as a whole is associated with overall dietary patterns (Mercille et al., 2012). Last, it seems important to assess and address information on multiple “activity spaces” (home environment, work environment, commuting environment, residential neighborhood environment) to better define exposure to unhealthy food outlets (Burgoine & Monsivais, 2013; Kestens, Lebel, Daniel, Theriault, & Pampalon, 2010; Kwan, 2009).
Strengths and Limitations
The cross-sectional study design prevented us from identifying causal or predictive pathways. We were aware of the risk of reverse causation, whereby individuals with a preference for fast foods self-select into neighborhoods with higher presence of fast food outlets. We tried to overcome this potential bias by adjusting for residential self-selection. A degree of temporal mismatch was also inevitable (Black, Macinko, Dixon, & Fryer, 2010), as data on outcomes were measured in 2014, and information on food outlets were collected through Google Street View, from a range of years. As such, for some individuals, fast food consumption levels and weight status may have preceded their estimated access to fast food outlets. Although the presence of fast food outlets is likely to have increased over time, a recent study showed that neighborhoods with high numbers of fast food outlets in 1990 tended to be ranked as having high numbers in 2008 as well (Maguire, Burgoine, & Monsivais, 2015). Longitudinal studies would allow for the identification of temporal effects and thus changes within as well as between individuals over time, but they are complex and costly and rarely conducted.
Second, we were unable to study food environments other than in the home neighborhood. Such limited appreciation of exposure to fast food outlets (Burgoine et al., 2014) could contribute to the mixed evidence base around the association between food environments and weight status. It has been shown that individuals’ exposure to work, commuting, and leisure-time environments confound and suppress the association of residential neighborhoods with health (Inagami, Cohen, & Finch, 2007), as such providing an explanation for the lack of robust associations between home neighborhood food environments and obesity. In addition, given the range in neighborhood sizes, the area in which spatial access to fast food outlets was assessed also differed between individuals.
Third, our measure of fast food consumption is likely to lack variety and precision (given the low prevalence of consumption) and may have been prone to social desirability bias, as such potentially masking associations between access to fast food outlets and obesity. Moreover, it needs to be noted that fast food is merely one of a number of unhealthy food options, of which only the cumulative effects may lead to weight gain.
Finally, our participants were sampled from five large urban regions that may not be representative of other regions in these countries, and only a small proportion of invited individuals participated in our study. In combination with the use of spatial access categories, rather than a continuous score, generalizability of our results may be limited.
Our study also benefits from a number of strengths. To our knowledge, this is the first study to apply a “spatial access” measure (based on both proximity and availability) to assess exposure to fast food outlets in different geographical areas across Europe. We used a large sample of adults living in urban neighborhoods who were heterogeneous in terms of residential density and neighborhood SES. The aim of this sampling approach was to generate larger variety in neighborhood environmental characteristics. We were able to combine information on objectively measured fast food outlets and perceptions of the presence of fast food outlets as both measures were collected using harmonized, standardized procedures. The use of both objective and subjective measures of the food environment appeared to be crucial for our understanding of the influences of spatial access to fast food outlets on fast food consumption and obesity. Finally, we collected data on a large number of covariates, which included variables on residential self-selection.
Conclusion
In conclusion, we found limited evidence that spatial access to fast food outlets was directly or indirectly related to weight status. The perceived availability of fast food outlets was found to be significantly associated with higher consumption of fast food and higher body weight but only when respondents also reported to use these outlets. In addition to a better understanding of the interplay between availability and accessibility, the notion of usage appears central in the understanding of the links between neighborhood food environments and obesity. Our results emphasize the importance of taking into account subjective measures—as well as objective measures—of the food environment, particularly information on perceived availability and usage of food outlets. These data also highlight the need to appreciate that obesity is the outcome of a complex system that is not readily amenable to simple cause and effect explanations.
Footnotes
Acknowledgements
The authors thank the editor-in-chief and the reviewers for their significant contributions during the peer-review process.
Authors’ Note
The content of this article reflects only the authors’ views, and the European Commission is not liable for any use that may be made of the information contained therein.
Declaration of Conflicting Interests
The author(s) declared no potential conflicts of interest with respect to the research, authorship, and/or publication of this article.
Funding
The author(s) disclosed receipt of the following financial support for the research, authorship, and/or publication of this article: This work was supported by the Seventh Framework Programme (CORDIS FP7) of the European Commission, HEALTH (FP7-HEALTH-2011-two-stage) [278186].
Supplemental Material
Supplemental material for this article is available online.
Author Biographies
References
Supplementary Material
Please find the following supplemental material available below.
For Open Access articles published under a Creative Commons License, all supplemental material carries the same license as the article it is associated with.
For non-Open Access articles published, all supplemental material carries a non-exclusive license, and permission requests for re-use of supplemental material or any part of supplemental material shall be sent directly to the copyright owner as specified in the copyright notice associated with the article.