
Abstract
In low-stakes assessments, some students may not reach the end of the test and leave some items unanswered due to various reasons (e.g., lack of test-taking motivation, poor time management, and test speededness). Not-reached items are often treated as incorrect or not-administered in the scoring process. However, when the proportion of not-reached items is high, these traditional approaches may yield biased scores and thereby threatening the validity of test results. In this study, we propose a polytomous scoring approach for handling not-reached items and compare its performance with those of the traditional scoring approaches. Real data from a low-stakes math assessment administered to second and third graders were used. The assessment consisted of 40 short-answer items focusing on addition and subtraction. The students were instructed to answer as many items as possible within 5 minutes. Using the traditional scoring approaches, students’ responses for not-reached items were treated as either not-administered or incorrect in the scoring process. With the proposed scoring approach, students’ nonmissing responses were scored polytomously based on how accurately and rapidly they responded to the items to reduce the impact of not-reached items on ability estimation. The traditional and polytomous scoring approaches were compared based on several evaluation criteria, such as model fit indices, test information function, and bias. The results indicated that the polytomous scoring approaches outperformed the traditional approaches. The complete case simulation corroborated our empirical findings that the scoring approach in which nonmissing items were scored polytomously and not-reached items were considered not-administered performed the best. Implications of the polytomous scoring approach for low-stakes assessments were discussed.
In educational testing, low-stakes assessments such as formative assessments and international large-scale assessments often have no consequences or implications for students. Because a low-stakes assessment has no direct consequence for the students, some students may not put enough effort into responding to the items (Wise & Kong, 2005). When a low-stakes assessment is administered with a strict time limit, or when there are no direct consequences for the students, some students may not reach the end of the test and thereby leaving some items unanswered. These items are often referred to as not-reached items. In practice, not-reached items are either ignored (i.e., treated as not-administered) or scored as incorrect (Ludlow & O’Leary, 1999; Pohl et al., 2014). Previous research indicated that scoring not-reached items as incorrect could produce biased estimates of item and person parameters (e.g., Custer et al., 2012, Xiao & Bulut, 2020). As Pohl et al. (2014) pointed out, scoring not-reached items as not-administered is also an improper method because it may encourage students to skip difficult items as a test-taking strategy.
To date, many researchers proposed a model-based approach to deal with not-reached items, such as a tree-based item response theory (IRT) framework for modeling valid responses and not-reached items jointly (Debeer et al., 2017; Okumura, 2014), a multigroup IRT model based on the number of omitted items (Rose et al., 2010), and a two-dimensional IRT model based on a joint distribution of proficiency and tendency to omit items as distinct latent traits (Glas & Pimentel, 2008; Pohl et al., 2014). Furthermore, there have been several studies conducted in an attempt to demonstrate the utility of response times when dealing with not-reached items (e.g., Pohl et al., 2019; Tijmstra & Bolsinova, 2018; Ulitzsch et al., 2020). As Tijmstra and Bolsinova (2018) pointed out, instead of using a complex, model-based approach, a more practical way to deal with not-reached items could be developing a new scoring rule that adjusts test scores for not-reached items. With this scoring rule, students would have to determine how to optimize their test performance based on a trade-off between the speed to complete all the items and the accuracy in answering the items correctly.
In this study, we propose a polytomous scoring approach that utilizes response times when scoring the items. With the proposed approach, students can receive a partial credit on their responses depending on how accurately and rapidly they can answer the items. This approach combines the speed and accuracy in the scoring process to reduce the impact of not-reached items on ability estimation, especially for students with effortful response behavior who could not answer all of the items. To demonstrate the utility of the proposed approach, we use real data from a computer-based formative assessment, score the items on the assessment using traditional (i.e., ignoring not-reached items and scoring them as incorrect) and polytomous scoring approaches, and finally compare the results based on several evaluation criteria. Additionally, we further examine the empirical results with a complete case simulation.
Literature Review
In educational assessments, some students may not be able to attempt all the items within the allotted time. For example, students with poor test-taking skills may spend too much time as they try to answer the items and thus run out of time before attempting all the items on the test. Also, students with low test-taking motivation may stop taking the test after answering several items and wait for the allotted test time to expire (Yi et al., 2001). Research suggests that students’ insufficient effort (i.e., non–effortful response behavior) could be reflected as rapid guessing, lack of motivation, or lack of test-taking engagement during test administration (List et al., 2019). Goldhammer and Kroehne (2014) found that the time limit could significantly influence the probability of correct response, suggesting that not-reached items are not necessarily independent from the ability (Pohl et al., 2014, 2019; Tijmstra & Bolsinova, 2018). For example, students may respond to some items in a very short amount of time for the sake of finishing the test (Lindner et al., 2019; Wise & Ma, 2012). In some cases, students may poorly manage their time by spending too much time on some items, and consequently, they may fail to reach the end of the test (Weeks et al., 2016).
It is important to make a distinction between not-reached and not-answered (i.e., omitted) items because these items are often treated differently in operational settings (Rose et al., 2017). Also, reasons causing the items to be either not-reached or not-answered could be very different (Rose, 2013; Ulitzsch et al., 2020). For example, a student may attempt to answer an item but then decide to skip it due to the perceived difficulty of the item. Also, the student may fail to adjust their speed based on the allotted test duration and thus miss the items located at the end of the test. In this study, we specifically focus on not-reached items that students do not get the opportunity to view and answer within the allotted time.
Approaches for Handling Not-Reached Items
The traditional scoring approaches for handling not-reached items are either scoring them as not-administered (i.e., missing) or scoring them as incorrect. When not-reached items are considered not-administered, these items are assumed to be missing at random and thus could be ignored in the scoring process (Pohl et al., 2019). Scoring not-reached items as incorrect is another widely used method in practice. This method assumes that students who are not able to complete the entire test are typically low-achieving students and thus they would not be expected to answer not-reached items correctly. Scoring not-reached items as incorrect would be a deterministic approach because it assumes that even if students reached these items, they would answer them incorrectly (Pohl et al., 2019). Scoring not-reached items as incorrect might be acceptable for situations where total raw scores are used for evaluating student performance. However, within the IRT framework, scoring not-reached items as incorrect is very likely to yield biased item and person parameters. Specifically, this approach may lead to an overestimation of item difficulty depending on the proportion of not-reached items. As the number of students with not-reached items increased in the response data, the proportion of students with incorrect responses would also increase. Therefore, the items would seem more difficult, resulting in the overestimation of the difficulty parameters. Furthermore, such items are very likely to indicate low discrimination (i.e., underestimation) because most students will fail to answer them correctly.
There is also a two-stage approach that combines the previous two approaches in handling not-reached items. In the first stage, missing responses for not-reach items are ignored when estimating item parameters. In the second stage, the item parameters from the first stage are used to estimate ability levels, while recoding missing responses for not-reached items as incorrect. This approach aims to alleviate the negative effects of not-reached items by treating them differently in the estimation of item parameters and ability levels. For example, in international large-scale assessments such as Program for International Student Assessment (PISA), Trends in International Mathematics and Science Study (TIMSS), and Progress in International Reading Literacy Study (PIRLS) used this method when handling not-reached items (Pohl et al., 2019). Previous research showed that scoring not-reached items as not-administered yields relatively less bias than scoring not-reached items as incorrect (Custer et al., 2012; Ludlow & O’Leary, 1999; Xiao & Bulut, 2020).
Pohl et al. (2019) created a model-based approach based on joint modeling of ability and response times (van der Linden, 2007) to score not-reached items. With this approach, the student’s ability and speed to answer items are used together when scoring not-reached items. As an extension of Pohl et al.’s approach, we argue that a polytomous scoring approach could be established to give a higher score to students when they seem to put enough effort into answering the items. With the polytomous scoring, students who answer the item correctly within a reasonable amount of time, henceforth optimal time, could be rewarded for their effortful test taking. We operationalize the optimal time as an indication of effortful response behavior. Accordingly, students without either very short or very long response times can be conceptualized as demonstrating effortful response behavior and the time they spent is conceptualized as the optimal time needed to respond to the item.
The operationalization of speed and ability together (e.g., Tijmstra & Bolsinova, 2018) could also help explain the missingness caused by not-reached items. Specifically, the need to adjust one’s speed based on the allotted test time cannot be conceived as independent of the student’s ability level (Rios et al., 2017). This approach can be expanded further by assigning a partial credit to students who seem to put in enough effort but still answered the item incorrectly. With the polytomous scoring approach, students with enough test-taking effort as illustrated with optimal time use are given more weight (i.e., higher item scores) and thereby reducing the impact of not-reached items when estimating item and person parameters. The proposed polytomous scoring approach assumes non-effortful response behavior, but not necessarily test speededness and/or fatigue.
Response Time and Effortful Test-Taking Behavior
Response time is often considered an indicator of student engagement or motivation during testing (Wise & Kong, 2005; Wise & Ma, 2012). Therefore, it can be utilized to disentangle the relationship between not-reached items and other factors such as time, student ability, and effortful response behavior (Pohl et al., 2019). With the advent of computer-based testing, students’ response time for each item can be easily recorded during test administration. Response time for a given item is typically defined as the total time spent on an item starting from the time point that the item is displayed to the student until the time point where the student moves to the next item, regardless of whether the student responds to the item. Displaying either very short or very long response time may indicate that the student did not exhibit effortful response behavior (Wise, 2017).
To date, most research utilizing response times has focused on rapid guessing because it is often associated with non-effortful response behavior (Wise, 2019; Wise & Kong, 2005). Rapid guessing is conceptualized as generating a response with an unrealistically short response time. That is, the students who respond to the items below a certain time threshold are considered demonstrating rapid guessing behavior and eliminated from the parameter estimation. Several methods have been developed to detect rapid guessing. The most common approach is to evaluate the response time distribution for each item separately since the response time to answer each item is likely to vary based on the difficulty level of the items. In this study, we propose to expand the framework regarding the detection of non-effortful responses by not only identifying rapid guessers but also the ones that used an unrealistically long amount of time to attempt the items. As researchers often argued (e.g., Tijmstra & Bolsinova, 2018), student performance on time-limited assessments is a result of both ability and speed, and by combining these two, the speed is no longer a nuisance variable when estimating the ability of students.
Once students’ non-effortful responses are identified based on their response times, these responses are flagged for further processing. Two common practices to deal with non–effortful responses are to remove students with non-effortful responses from the response data or to treat non-effortful responses as missing before item parameter estimation. Although some researchers argued that effort and ability are unrelated to each other and thus the row-wise deletion of students from the response data might be acceptable (e.g., Wise, 2015). However, other researchers have demonstrated that there is often an association between ability and effortful response behavior, and thus the row-wise deletion of students may yield biased item parameters (Kuhfeld & Soland, 2020; Rios et al., 2017).
Current Study
Numerous studies demonstrated that the traditional methods to handle not-reached items are not adequate (e.g., Custer et al., 2012; Ludlow & O’Leary, 1999; Xiao & Bulut, 2020). While handling not-reached items as incorrect is likely to yield biased parameters, scoring not-reached items as not-administered might encourage students to skip difficult items as a test-taking strategy. Also, the row-wise deletion of students with not-reached items could remove a sizeable portion of the response data available about the students (Tijmstra & Bolsinova, 2018). To eliminate the limitations of the traditional scoring approaches, we propose a polytomous scoring approach that puts more weight on effortful responses by utilizing response times when scoring students’ responses. To mitigate the effect of not-reached items on the estimates of both item and person parameters, we utilize the response times to detect the effortful response behavior and then determine the optimal time spent on each item for both correct and incorrect response time distributions separately. We propose giving more weight to students who used the optimal time when answering each item, rather than filtering out students or student responses with a non–effortful response behavior. Therefore, the proposed scoring approach not only incorporates effortful response behavior and response times into the scoring process but also maintains the size of the response data.
We evaluate three forms of the polytomous scoring approach in comparison to the traditional approaches for handling not-reached items. Unlike the traditional approaches, the polytomous scoring approach analyzes the response time distribution for correct and incorrect responses separately so that different weights can be given to students who used the optimal time while attempting to answer the items. Separating response time distributions for correct and incorrect responses allows us to compare the students who answered the item incorrectly with effortful response behavior with the students who answered the items incorrectly but spent too little or too much time. The following research questions are investigated:
Method
Sample
The sample of this study (N = 40,620) included second graders (84%) and third graders (16%) who participated in a computer-based math assessment in the United States. The students took the assessment three times (i.e., fall, winter, and spring semesters) during the 2018-2019 school year. The students could take the assessment more than once each semester (up to five times within a school year). The majority of the students took the test three times (i.e., one per semester). In each test administration, the students responded to the same set of questions while item positions were randomized. There was no booklet design in the test administration. There was at least a 3-month gap between each test administration and thus there was minimal practice effect across the test administrations.
Instrument
The low-stakes assessment used in this study is a timed, computer-based assessment that evaluates the degree to which students’ basic math facts and operations (e.g., addition and subtraction) are accurate and fluent in Grades 2 and 3. The primary goal of the assessment is to measure how efficiently and correctly students can solve math problems. Results of the assessment are used for measuring and monitoring students’ academic growth in math throughout the school year. The assessment consists of 40 short-answer items for which students complete a mathematical operation and enter their numerical answers for each item. The test was designed to cover a wide range of difficulties and included easy, moderate, and hard items in a balanced way. Before starting the assessment, students are instructed to answer as many items as possible within 5 minutes with a maximum execution time of 30 seconds per item. Therefore, the number of answered items varies across students depending on their level of fluency with basic math facts and operations. Students’ responses (correct, incorrect, not-answered, and not-reached) and their response times are automatically recorded for each item. The percentage of not-reached ranged from 11% to 68% across the items (M = 51%, SD = 7%), whereas the proportion of not-answered was very small (up to 0.11%). Because the assessment was designed to measure students’ knowledge of basic math facts and operations within a short period and there is no direct consequence (e.g., reward or grade) for the students, high rates of not-reached items were expected for most students, especially at the beginning of a school year.
Empirical Study
We used five different scoring methods for handling not-reached items in the response data. Table 1 provides a summary of the traditional and polytomous scoring approaches utilized in this study. The first two methods were the traditional methods of treating not-reached items as not-administered (i.e., missing) or scoring them as incorrect. These methods are widely used approaches to deal with not-reached items (e.g., Macaskill et al., 1998; Martin et al., 2007) and thus they were used as the baseline methods when comparing with the polytomous scoring methods. For both methods, valid responses were scored dichotomously (i.e., correct or incorrect) and not-answered items were scored as incorrect. After recoding not-reached items as either missing (NA), 2PL-NA, or incorrect (IN), 2PL-IN, we used the two-parameter logistic (2PL) model (Birnbaum, 1968) to estimate item parameters (difficulty and discrimination), ability parameters, TIF, and cSEM for ability parameters. The 2PL model can be formulated as follows:
A Summary of Scoring Approaches.
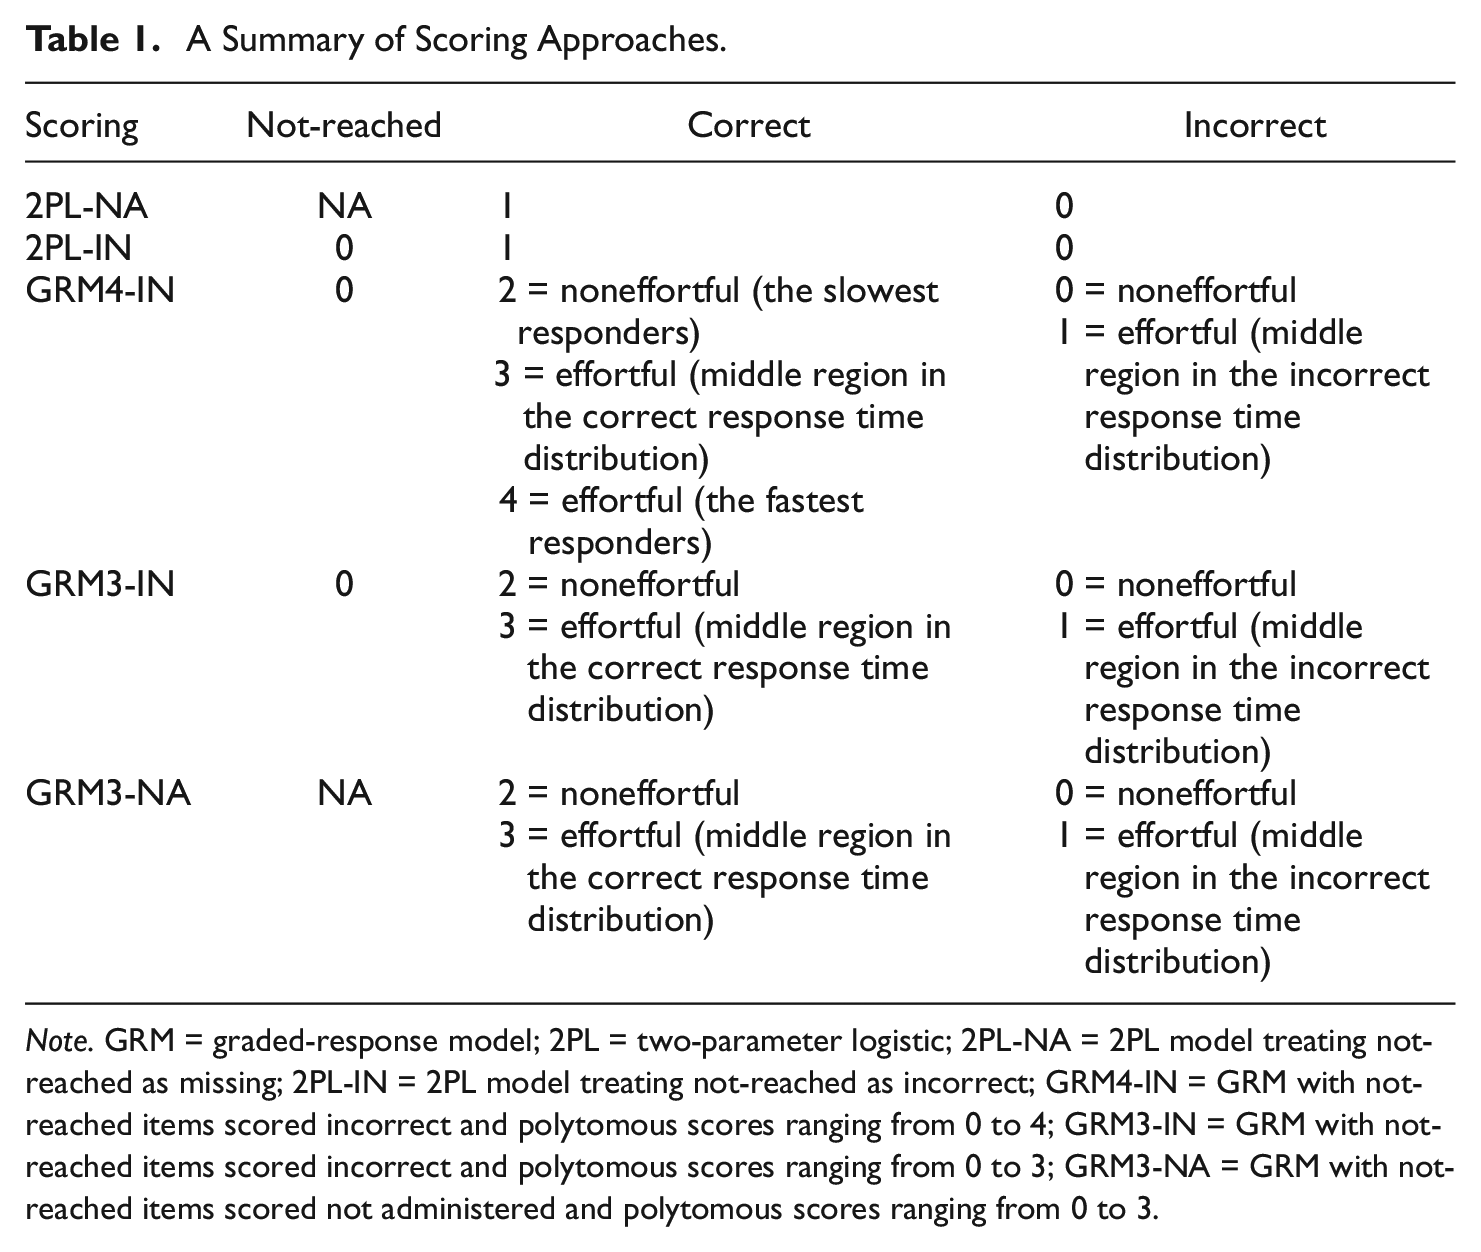
Note. GRM = graded-response model; 2PL = two-parameter logistic; 2PL-NA = 2PL model treating not-reached as missing; 2PL-IN = 2PL model treating not-reached as incorrect; GRM4-IN = GRM with not-reached items scored incorrect and polytomous scores ranging from 0 to 4; GRM3-IN = GRM with not-reached items scored incorrect and polytomous scores ranging from 0 to 3; GRM3-NA = GRM with not-reached items scored not administered and polytomous scores ranging from 0 to 3.

where
Polytomous Scoring
For the remaining scoring methods, we followed a polytomous scoring approach based on students’ response times. Wise and Ma (2012) recommended using a normative threshold (NT) approach for identifying as many students with rapid guessing response behavior as possible while avoiding classifying those with effortful response behavior as rapid guessing. This approach is computationally less demanding and is shown to be an effective approach for identifying rapid guessing behavior (Wise & Ma, 2012). Figure 1 illustrates the three proposed scoring approaches using an example item, based on the response time distributions of the item for correct and incorrect responses. First, we found two median response times for each item: one for correct responses and another for incorrect responses. The median of the response time is used to avoid the outliers in the response time distribution. Then, we used the normative threshold 25 approach (NT25; Wise & Ma, 2015) to identify students who demonstrated effortful test-taking behavior in responding to the items. With the NT25 approach, we found 25% and 175% of the median values of (log) response time distributions of correct and incorrect responses and divided the response time distribution into three regions. Since the response time distribution of each item changed depending on item difficulty, the median values of response times also changed for each item. This scoring approach prioritizes the optimal time use and thus gives more weight to students with optimal time use. After scoring nonmissing responses polytomously, we replaced not-reached items with either zero or NA (i.e., not-administered) depending on the scoring rule employed by each polytomous scoring method.
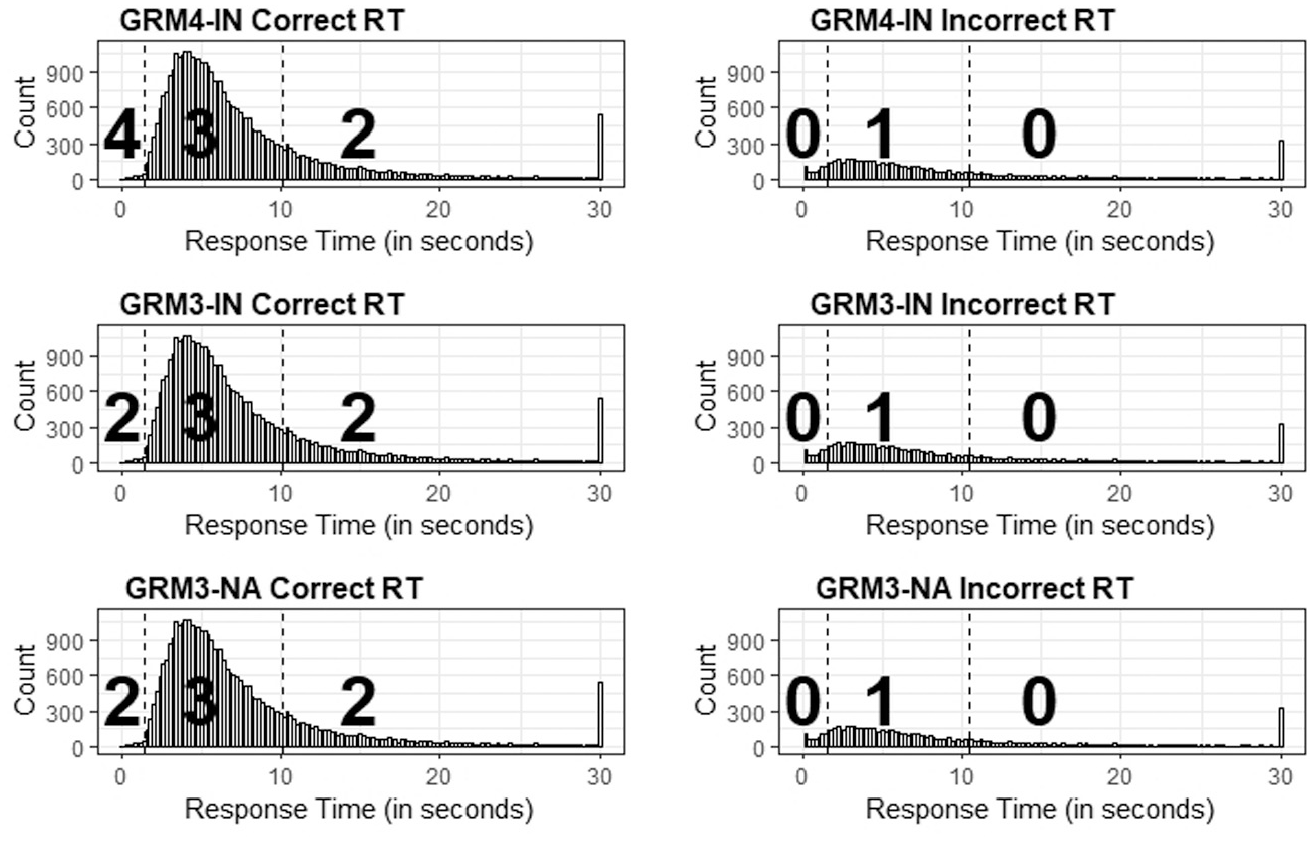
The illustration of polytomous scoring approaches for an item based on correct and incorrect response time distribution. The first column of the figure shows response time (RT) thresholds used for students with a correct response and the second column is the RT thresholds for students with an incorrect response.
In the first polytomous scoring method, GRM3-IN, we scored not-reached items as incorrect (i.e., 0) and the scoring range was from 0 to 3. We analyzed the response time distribution for correct and incorrect responses of each item separately. For the incorrect responses, we scored the students in the middle of the distribution with one and the rest of the students with zero because we wanted to assign partial credit to the students with optimal time use in order to compare them with the students who spent either too much or too little time and answered the item incorrectly. We scored the students who were in the middle category of the correct response time distribution with three and the rest of the students with two. In the second method, GRM3-NA, we kept the same scoring procedures for the students with correct and incorrect responses whereas not-reached items were scored as NA. The scoring range for the second method remained identical to that of the first method (i.e., 0 to 3). By these first two scoring approaches, we were able to compare the impact of scoring not-reached items as 0 or NA on the polytomous scoring method.
For the last scoring approach (GRM4-IN), we followed a different scoring scenario. Unlike the scoring range for the previous scoring approaches, the scoring range for GRM4-IN was from 0 to 4. For the incorrect responses, we followed the same procedure—students in the middle of the distribution were scored with 1 and the rest of the students were scored with 0. For the students who answered the items correctly, we scored the fastest ones with 4, those within the middle category of the distribution with 3, and the slowest ones with 2. In this scoring approach, we tried a new approach for smoothing the impact of assigning 0 to not-reached items. Specifically, we scored not-reached items as 0 while scoring the fast responses as 4 to evaluate whether these two scoring approaches would balance each other out and yield acceptable results in terms of model-data fit and parameter estimates.
The graded-response model (GRM; Samejima, 1969) was used to analyze polytomously scored items. The mathematical formulation of the GRM is shown below:

where
Evaluation Criteria
In the first step, we compared the performance of the traditional and polytomous scoring approaches. We used the following model-data fit indices and IRT-based indices: the root-mean-square error of approximation (RMSEA), the comparative fit index (CFI), the Tucker–Lewis index (TLI), Bayesian information criterion (BIC), Akaike information criterion (AIC), the TIF, and cSEM. CFI and TLI values greater than .95, and RMSEA values smaller than .08 indicated good model-data fit (Hu & Bentler, 1999). TIF was evaluated to assess for which levels of ability the test information was maximized. cSEM could be considered as the precision or reliability of the test given the ability level. As TIF is maximized, cSEM is minimized for a given ability. We also computed the correlations between the person parameters obtained from the traditional and polytomous scoring approaches. Furthermore, using the traditional scoring methods as the baseline methods, we compared the bias and RMSD of ability estimates for the polytomous scoring methods. Smaller values of RMSD and bias indicate lesser levels of a discrepancy between the ability estimates obtained through these methods.
Simulation Study
Although the empirical study can indicate the suitability of each scoring approach for real data, it remains limited in terms of the evaluation of estimated ability parameters because the true parameters are unknown. Therefore, we conducted a complete-case simulation study using the sample of students (N = 5,088) who did not have any not-reached items in the same assessment used in the empirical study. Because there was no missingness in the response data, we estimated both item and person parameters using the 2PL model and treated them as the true parameters in the simulation study. Next, we systematically introduced missingness into the data by reducing the total time limit (i.e., 5 minutes) and recoding responses that occurred beyond the new total time limit as not-reached (i.e., missing). We modified the total time limit to obtain a particular proportion of missingness (i.e., 10%, 20%, and 30%) in the response data while keeping the number of items fixed (i.e., 40 items). Also, to use the number of items as a simulation condition, we randomly selected a subset of items from the entire test (i.e., 20, 30, and 35 items) and introduced missingness by reducing the total time limit using the same proportions of missingness. The combination of test length and the proportion of missingness resulted in a simulation design with 12 crossed conditions. Except for the 40-item condition where random item selection was not necessary, all other conditions were replicated 50 times.
Finally, the performance of the polytomous scoring approaches (i.e., GRM3-IN, GRM3-NA, and GRM4-IN) was evaluated by comparing the estimated item and person parameters from these analyses with the true parameters. We used correlations between true and estimated ability parameters, bias, and RMSD for the polytomous scoring approaches to determine, which method is the most appropriate for handling not-reached items. Data analyses for both the empirical and simulation studies were performed using R (Version 4.0; R Core Team, 2019). The mirt package (Chalmers, 2012) in R was used for estimating item and person parameters based on the 2PL and GRM models. The R code for the proposed scoring approaches can be found in the Supplemental Material (available online). For all scoring approaches, maximum likelihood with the expectation–maximization algorithm was used for item parameter estimation and the expected a posteriori method was used for person parameter estimation.
Results
Results of the Empirical Study
Descriptive Results
The average time spent to complete the assessment was around 4.4 minutes. The majority of the students completed the assessment within the allotted time (5 minutes), while a small group of students submitted their answers and terminated the assessment earlier. Although most of the students finished the assessment with several not-reached items, they did not use the entire test duration, highlighting that test speededness was not very likely for this assessment. Similar response time distributions for the items presented earlier and later positions on the test also indicated that the high rates of not-reached items were not due to student fatigue. On average, the students answered 12 items out of 40 items on the assessment. The correlation between the number of correct responses and the total test time was r = .41, p < .001. These descriptive findings indicate that many students either demonstrated non–effortful response behavior or failed to benefit from optimal time use when answering the items.
Figure 2 demonstrates the relationship between the number of attempted items (including incorrect, correct, not-answered items) and the average cumulative response time in seconds. The correlation between the number of attempted items and the cumulative response time was r = .37, p < .001, suggesting that most students did not demonstrate optimal time use. Figure 3 demonstrates the relationship between the proportion of correct responses (after excluding not-reached items) and the average cumulative response time. The correlation between the proportion of correct responses and the cumulative response time was r = .30, p < .001. These descriptive findings underscored the need to consider the effortful response behavior when scoring student performance.
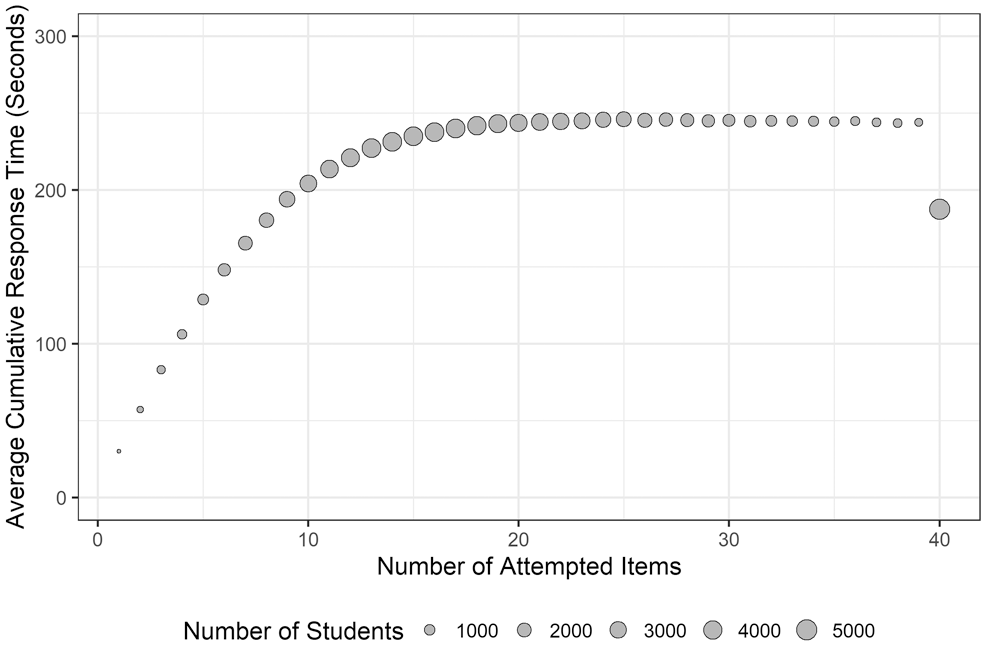
The relationship between the number of attempted items and the average cumulative response time.
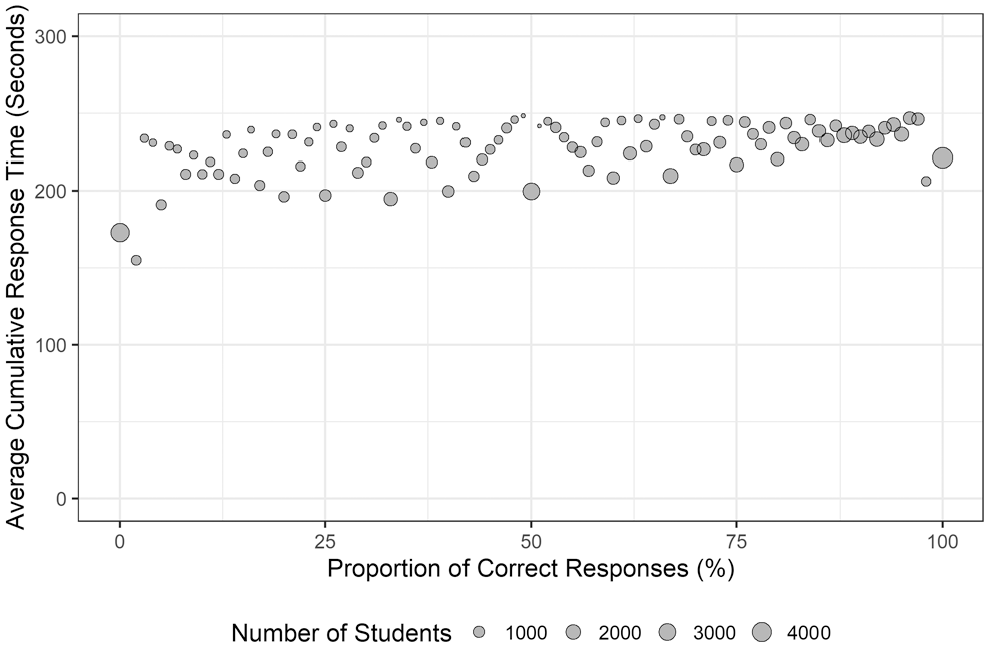
The relationship between the proportion of correct responses (after excluding not-reached items) and the average cumulative response time.
Figures 4 and 5 show the estimated difficulty and discrimination parameters for the traditional and polytomous scoring approaches, respectively. When not-reached items are scored as incorrect, the items appear to be more difficult in the 2PL-IN approach. Similarly, in the GRM3-IN and GRM4-IN approaches where not-reached items are scored incorrect, the threshold parameters seem to be higher, compared to the threshold parameters from GRM3-NA where not-reached items are treated missing (i.e., not-administered). In GRM4-IN, the threshold between the score categories of 3 and 4 points was very high for all the items, suggesting that it was very difficult to obtain 4 points (i.e., full credit) on the items.
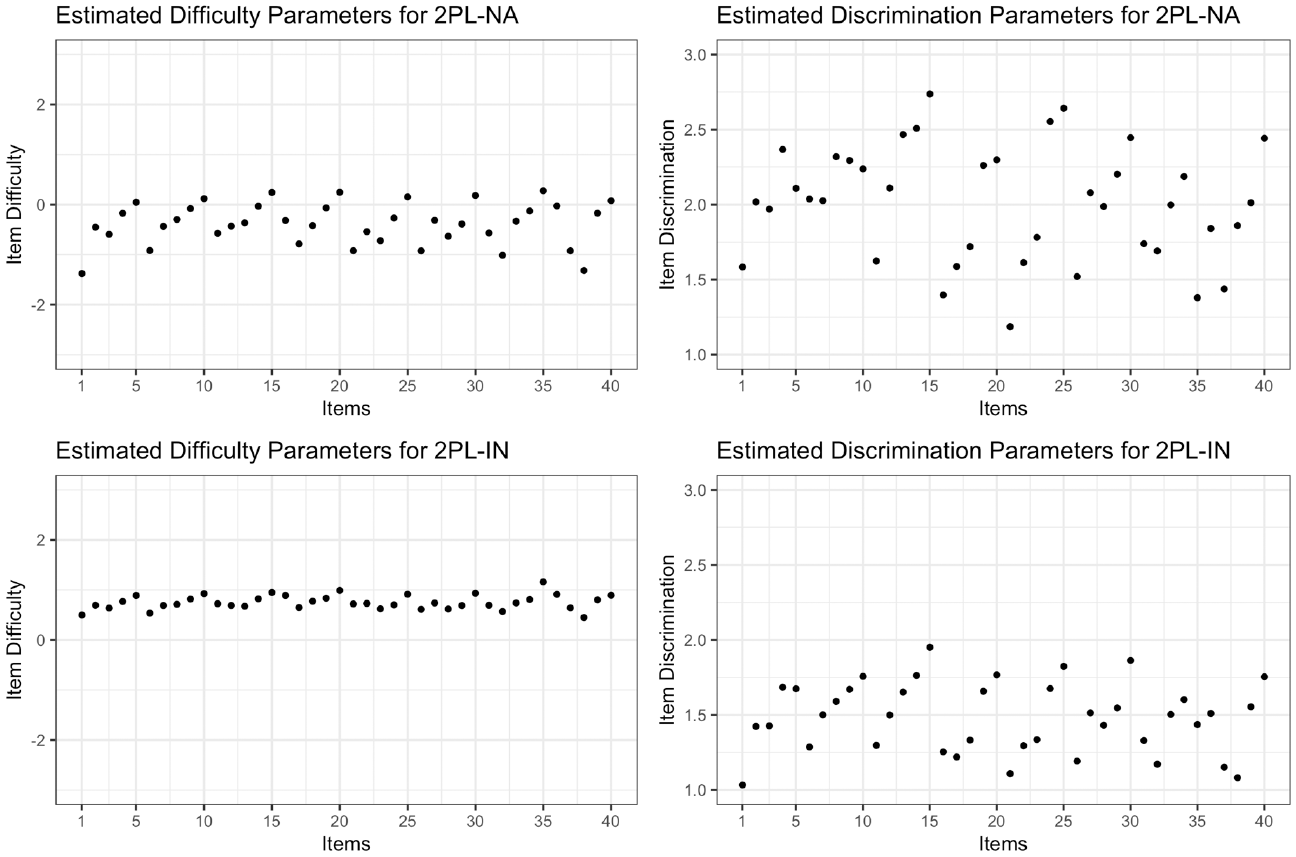
Item difficulty and discrimination parameters for traditional (2PL-NA and 2PL-IN) scoring approaches.
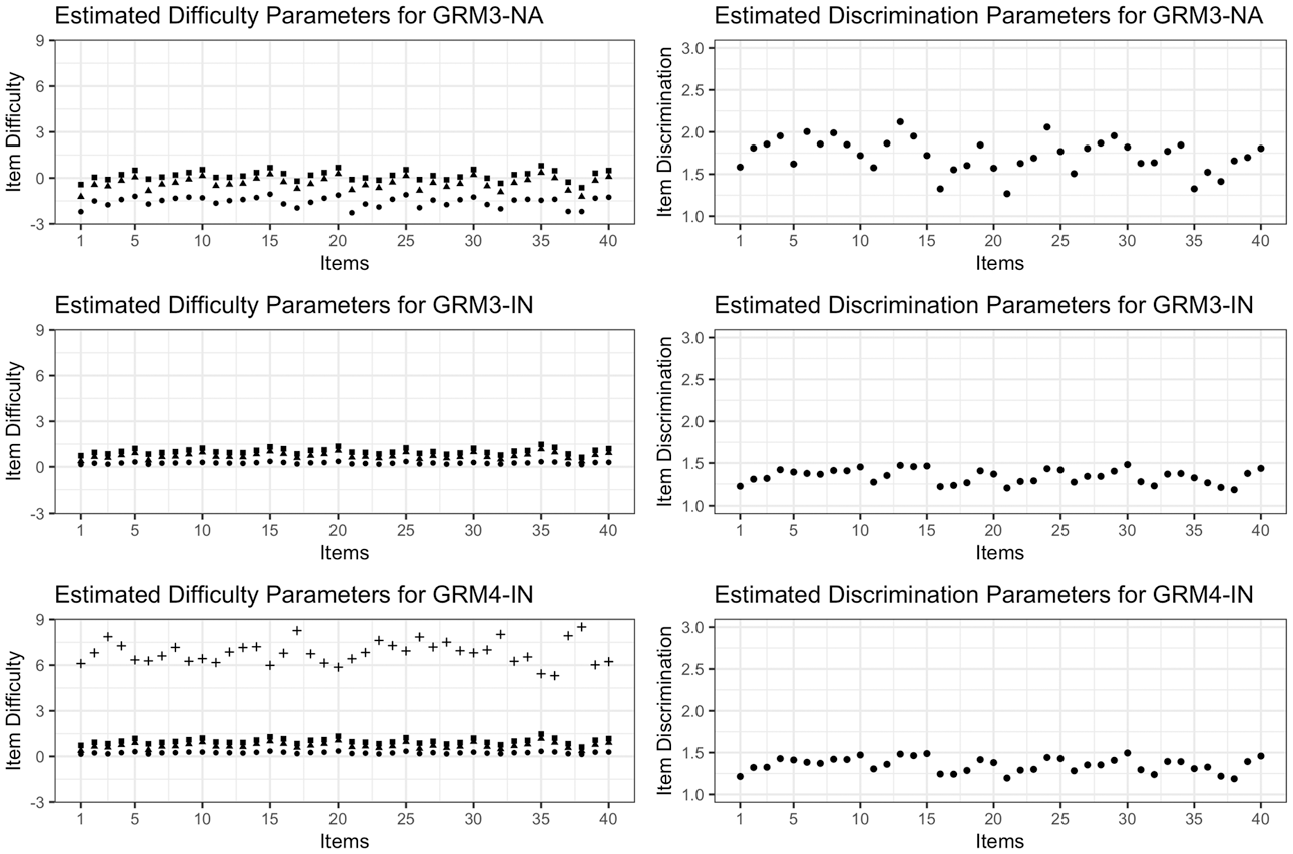
Item difficulty and dicrimination parameters for polytomous (GRM3-NA, GRM3-IN, and GRM4-IN) scoring approaches.
Model-Data Fit
The first traditional scoring method, 2PL-NA, seemed to fit the data very well, with RMSEA = .027, 90% CI for RMSEA [.0262, .0280], CFI = .999, TLI =.999, BIC = 1,565,772, and AIC = 1,565,021. For 2PL-NA, TIF was maximized and cSEM was minimized between the ability levels
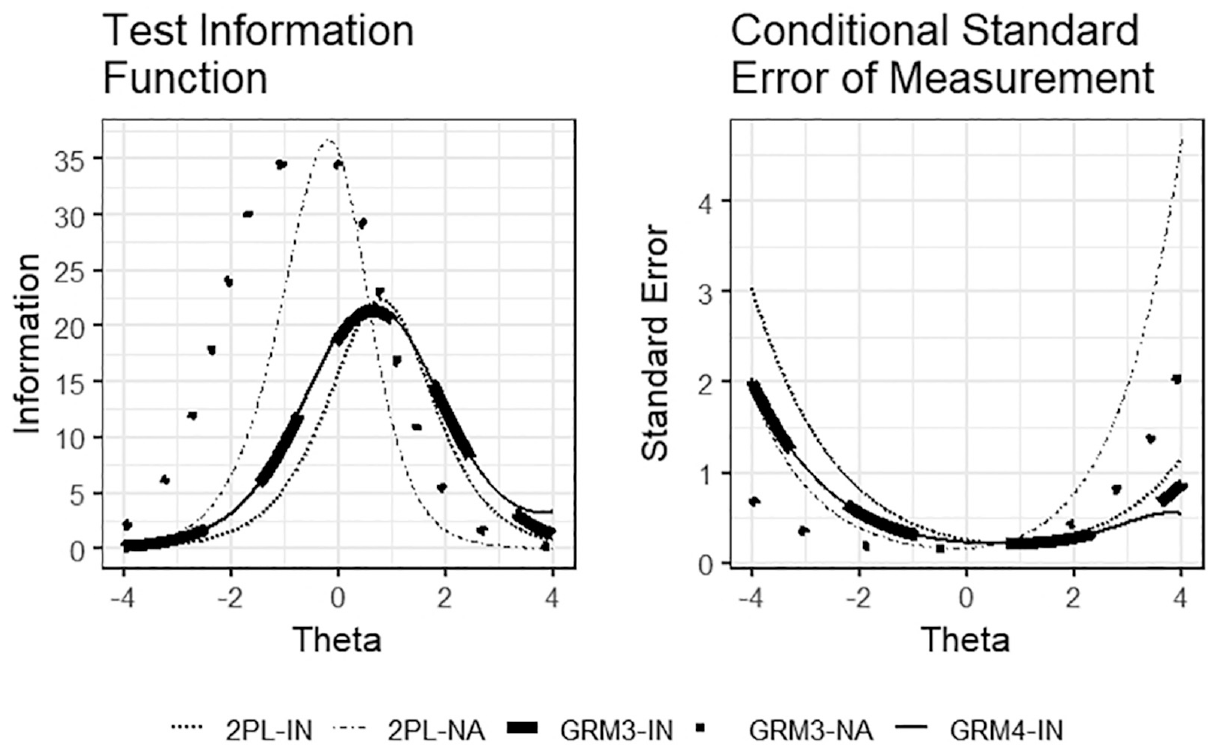
Test information function and conditional standard error of measurement for traditional and polytomous scoring methods.
For the first polytomous scoring method, GRM4-IN seemed to fit the data very well, with RMSEA = .015, 90% CI for RMSEA [.0144, .0418], CFI = .997, TLI = .997, BIC = 6,762,671, and AIC = 6,760,792. TIF was maximized and cSEM was minimized between the ability levels
The last polytomous scoring method (GRM3-NA) also yielded acceptable model-data fit indices, with RMSEA = .015, 90% CI for RMSEA [.0145, .0165], CFI = 1, TLI = 1, BIC = 3,331,875, and AIC = 3,330,372. TIF was maximized, and cSEM was minimized between the ability levels
Comparison of Ability Estimates
The results of correlations among the estimated abilities obtained from the traditional and polytomous scoring approaches are presented in Table 2. The estimated ability levels from 2PL-NA had moderate correlations with the estimated ability levels from GRM4-IN and GRM3-IN, whereas they indicated a high correlation with the estimated ability levels from GRM3-NA (r = .903). This is not surprising given the similar treatment of not-reached items (i.e., scoring them as not-administered) by these two methods. The estimated ability levels from 2PL-IN indicated very high levels of correlations with the ability estimates from the three polytomous scoring methods (r > .88).
Correlations Between the Estimated Ability Parameters From the Five Scoring Methods.
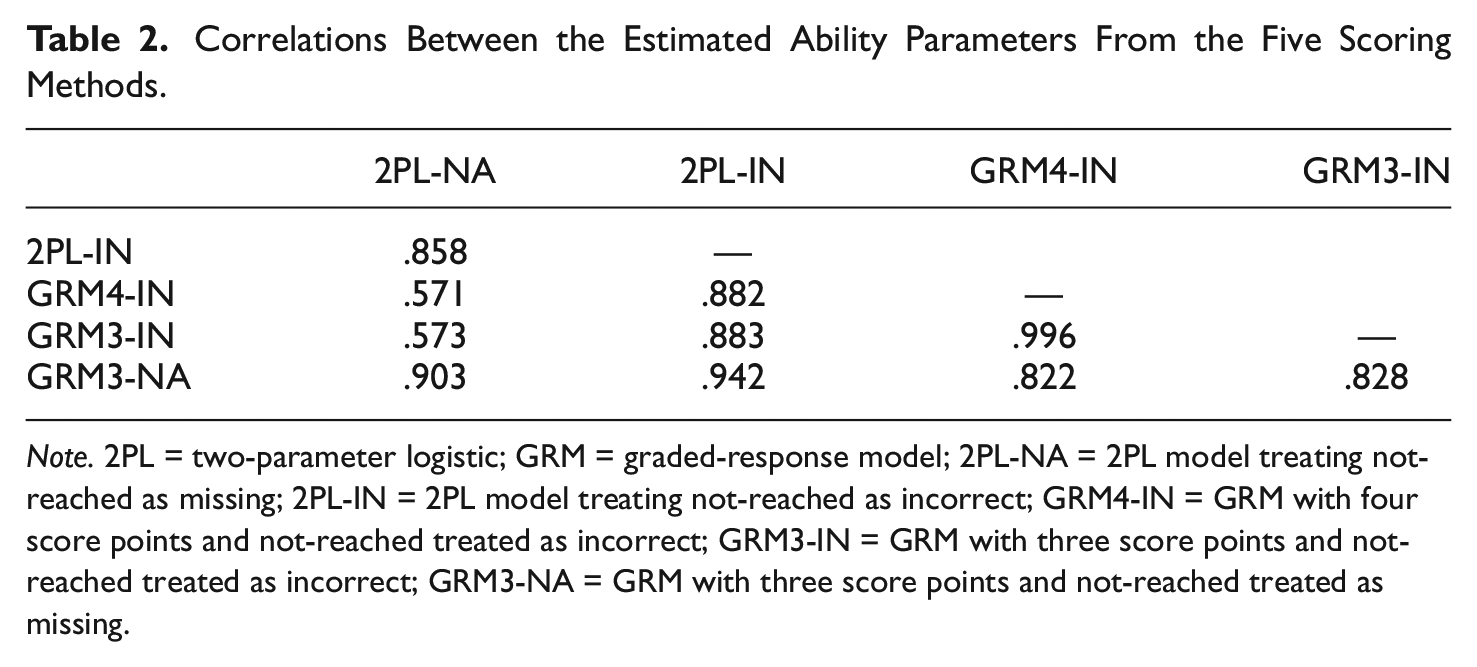
Note. 2PL = two-parameter logistic; GRM = graded-response model; 2PL-NA = 2PL model treating not-reached as missing; 2PL-IN = 2PL model treating not-reached as incorrect; GRM4-IN = GRM with four score points and not-reached treated as incorrect; GRM3-IN = GRM with three score points and not-reached treated as incorrect; GRM3-NA = GRM with three score points and not-reached treated as missing.
An intriguing result emerged from the correlation between the ability estimates from 2PL-IN and GRM3-NA. Despite the different treatment of not-reached items (incorrect with 2PL-IN and not-administered with GRM3-NA), the ability estimates from these two methods were highly correlated (r = .942). Furthermore, the intercorrelations among the estimated abilities from the polytomous scoring methods were quite high. This finding indicates that when the polytomous scoring is used, how not-reached items are scored (i.e., incorrect or not-administered) does not appear to influence the students’ relative positions in the sample. Furthermore, the relationships between ability estimates obtained from the traditional and polytomous scoring methods are demonstrated in Figure 7. The findings suggest that there was a linear relationship between GRM3-NA and other polytomous scoring methods as well as the traditional scoring methods. The ability estimates from the 2PL-NA method did not seem to have a linear relationship with the ability estimates from the GRM3-IN and GRM4-IN methods, especially for low ability estimates (i.e.,
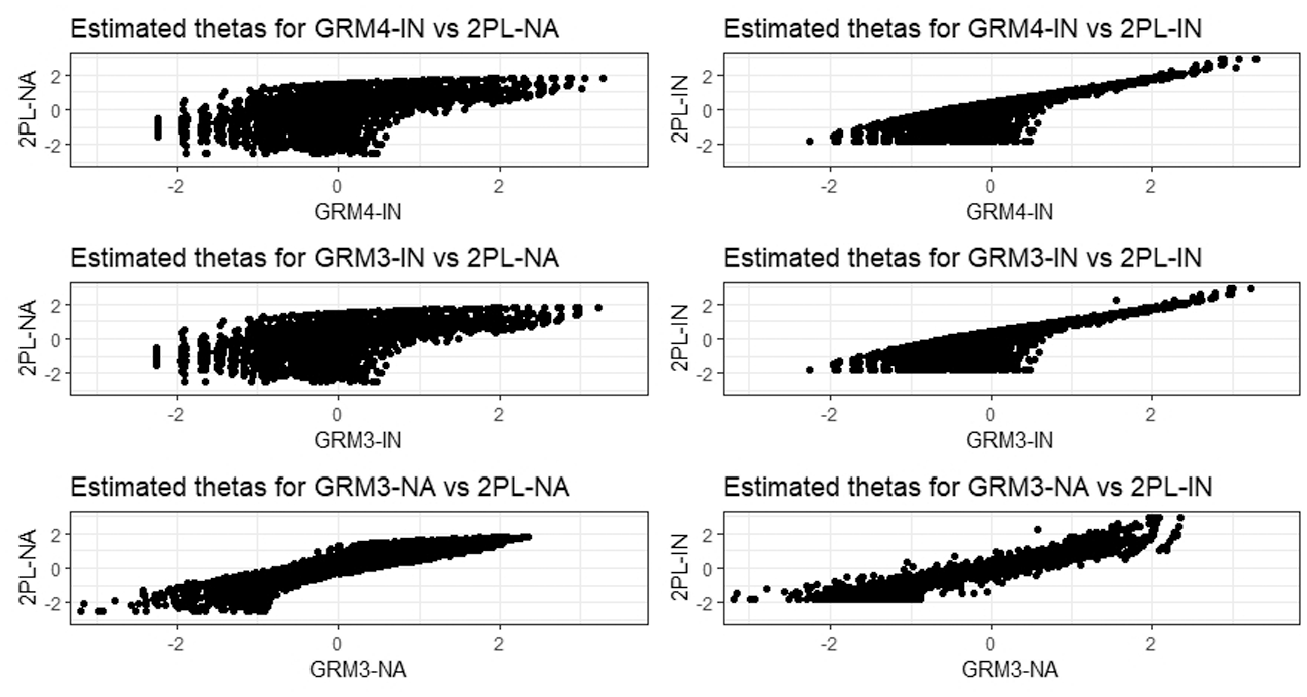
The relationship between the estimated thetas when traditional (2PL-NA and 2PL-IN) vs polytomous (GRM4-IN, GRM3-IN, and GRM3-NA) scoring approaches used.
Bias and RMSD values between the baseline (i.e., traditional) and polytomous scoring approaches are presented in Table 3. Bias between 2PL-IN and all three polytomous scoring approaches was very small, with the smallest bias observed between 2PL-IN and GRM3-NA. Similarly, RMSD between 2PL-IN and the polytomous scoring approaches was low, with the smallest RMSD observed between 2PL-IN and GRM3-NA. However, RMSD between 2PL-NA and the three polytomous scoring approaches was relatively higher. This finding is similar to the previous findings with the correlations where 2PL-NA only indicated moderate correlations with the polytomous scoring approaches. The large deviations between 2PL-NA and the polytomous scoring approaches reveal the differential performance of 2PL-NA due to the presence of many not-reached items on the test. Scoring all not-reached items as not-administered resulted in a reduction in the amount of the available response data and thereby yielding high measurement precision for a narrow range of abilities.
Bias and RMSD Between the Ability Estimates From the Baseline and Polytomous Scoring Methods.
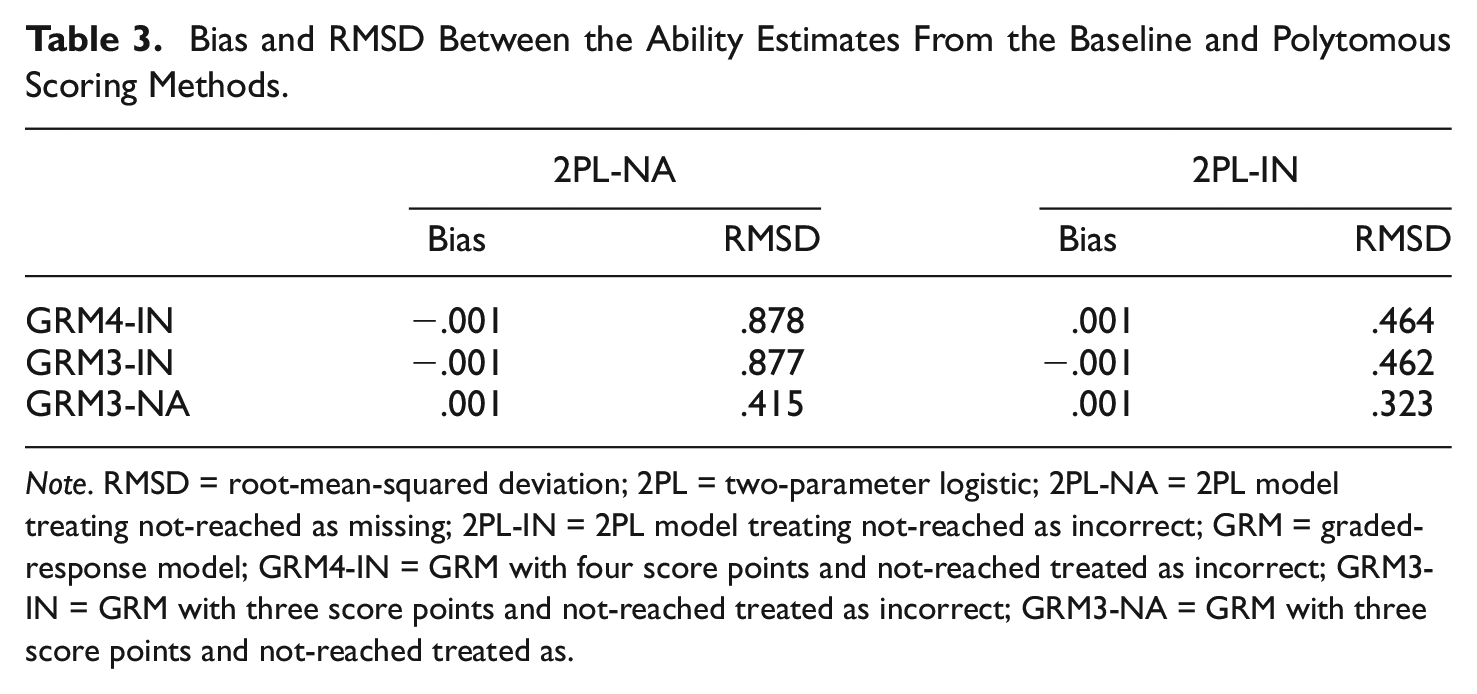
Note. RMSD = root-mean-squared deviation; 2PL = two-parameter logistic; 2PL-NA = 2PL model treating not-reached as missing; 2PL-IN = 2PL model treating not-reached as incorrect; GRM = graded-response model; GRM4-IN = GRM with four score points and not-reached treated as incorrect; GRM3-IN = GRM with three score points and not-reached treated as incorrect; GRM3-NA = GRM with three score points and not-reached treated as.
In conclusion, a comparison of these findings with those of previous studies confirms that scoring not-reached items as either incorrect or not-administered results in different item and person parameter estimates (Pohl et al., 2014; Tijmstra & Bolsinova, 2018). For the low-stakes assessment used in this study, treating not-reached items as incorrect increased the estimates of item difficulty for the items and decreased the estimated ability for students with not-reached items. Consequently, the assessment became informative mostly for high-ability students (i.e., θ > 0). The other traditional approach (i.e., treating not-reached as not-administered) failed to provide acceptable results. Due to a large number of not-reached items in the response data, recoding not-reached items as not-administered (i.e., missing) in the scoring process resulted in substantial information loss and a TIF covering a very narrow range of abilities.
The two polytomous scoring methods treating not-reached items as incorrect (GRM3-IN and GRM4-IN) also yielded TIF and cSEM results similar to those from the 2PL-IN method, despite taking the response times into account in the scoring process. Because the number of not-reached items was very high, treating these items as incorrect had a severe impact on the polytomous scoring, penalizing all students regardless of their effortful test-taking behavior. Unlike the other polytomous scoring methods, the polytomous scoring method treating not-reached items as not-administered (GRM3-NA) did not penalize students for not reaching the end of the test. Instead, this approach rewarded students with partial credit for their optimal timing in the attempted items. Therefore, GRM3-NA could alleviate the negative effects of not-reached items more effectively than GRM3-IN and GRM4-IN.
Results of the Simulation Study
The results of the complete case simulation are demonstrated in Table 4. The simulation results supported our findings from the empirical study that GRM3-NA outperformed the other scoring approaches. The highest correlations between true and estimated ability estimates across all conditions (i.e., different sets of items and different proportions of missingness) were observed when GRM3-NA was used for handling not-reached items. Similarly, RMSD values were the lowest across all conditions when GRM3-NA was used. Regarding the bias, there were mixed results, yet overall, GRM3-NA appeared to perform better than the other scoring approaches. As the number of items decreased and the proportion of missingness (i.e., not-reached items) increased, the results of GRM3-NA improved substantially (i.e., higher correlation, lower bias, and lower RMSD). Overall, these findings corroborated our findings from the empirical study regarding the superiority of the GRM3-NA approach.
Simulation Results of Correlations, Bias, and RMSD Between Estimated and True Ability Parameters.
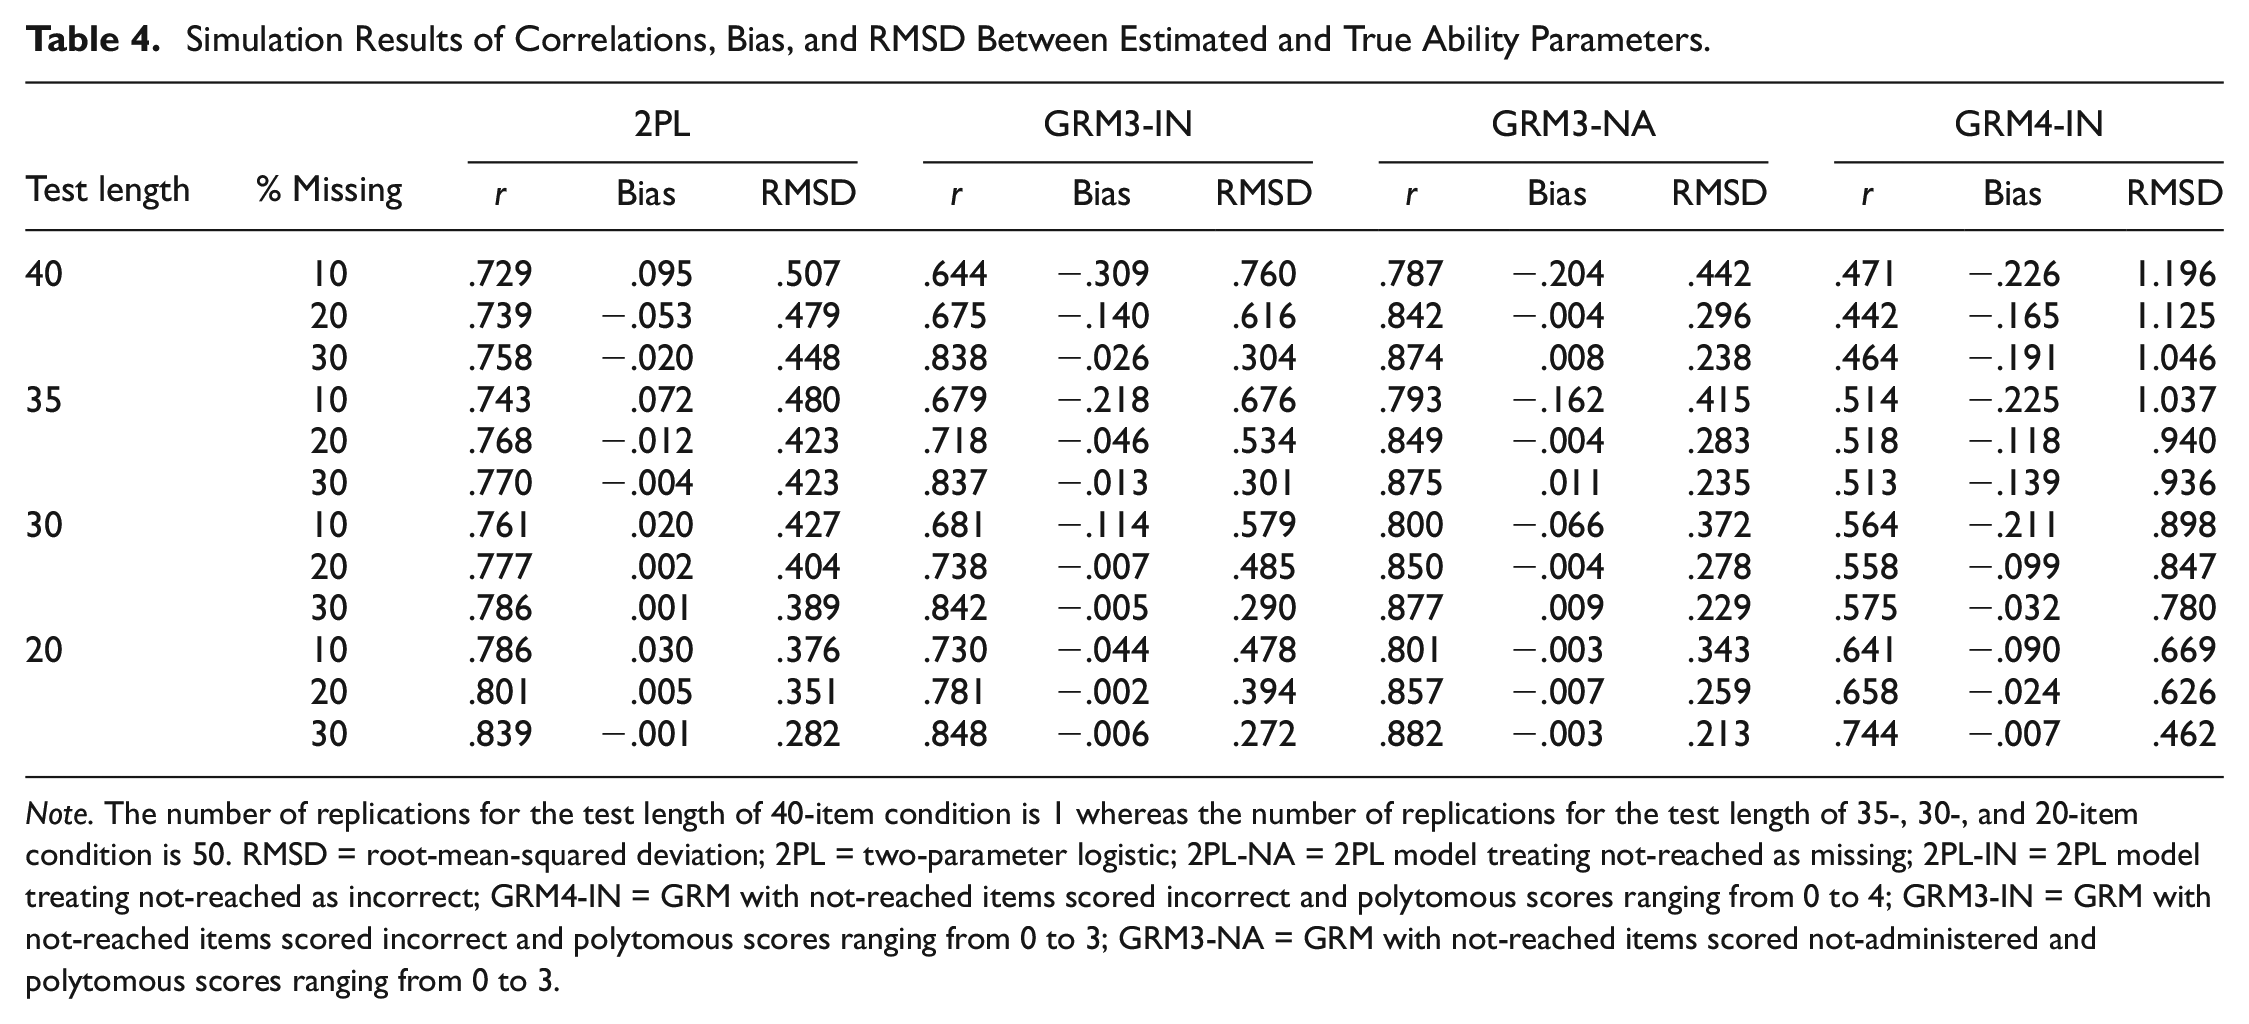
Note. The number of replications for the test length of 40-item condition is 1 whereas the number of replications for the test length of 35-, 30-, and 20-item condition is 50. RMSD = root-mean-squared deviation; 2PL = two-parameter logistic; 2PL-NA = 2PL model treating not-reached as missing; 2PL-IN = 2PL model treating not-reached as incorrect; GRM4-IN = GRM with not-reached items scored incorrect and polytomous scores ranging from 0 to 4; GRM3-IN = GRM with not-reached items scored incorrect and polytomous scores ranging from 0 to 3; GRM3-NA = GRM with not-reached items scored not-administered and polytomous scores ranging from 0 to 3.
Discussion
Low-stakes assessments (e.g., PISA, TIMSS, PIRLS, and computerized formative assessments in K-12 classrooms) are commonly used to measure student achievement in core subject areas, such as mathematics, reading, and science. However, when students fail to put enough effort into answering the items, the validity of inferences to be made from low-stakes assessments is significantly jeopardized. Especially in low-stakes assessments with a strict time limit, students are expected to answer as many items as possible; however, some students may fail to reach the end of the test, leaving some items unanswered (i.e., not-reached items). In this study, we proposed a polytomous scoring approach to adjust the influence of not-reached items in the estimation of item and person parameters. The traditional scoring approaches (treating not-reached items as either not-administered or incorrect) were compared to three variants of the polytomous scoring approach.
A polytomous scoring procedure that encourages students to display more engaged test taking could help alleviate the negative effects of not-reached items in the parameter estimation. This approach could also motivate students to attempt to answer more items with optimal time use. With the 2PL-NA method, some students may try to game the system if they know the scoring rule, that is, their skipped responses are treated as missing (Debeer et al., 2017; Pohl et al., 2014). Specifically, knowing that not-reached items have no impact on their test scores is more likely to encourage students to skip the items and less likely to motivate them to complete the assessment. On the contrary, the polytomous scoring approach might motivate the students to display effortful response behavior to get higher scores. Specifically, if they are notified about the scoring process that their response effort affects the scoring process, students might be motivated to display more effort to obtain higher scores. Through the polytomous scoring approach, we propose giving more weight to students with optimal time use, rather than removing disengaged items or students when estimating the item and person parameters. Removal of items or students leads to a reduction in the response data as well as the information available about the students (Tijmstra & Bolsinova, 2018). Therefore, a polytomous scoring approach could be a more practical approach for handling not-reached items with the use of response time.
Since one of the primary goals of the low-stakes assessments is to evaluate and monitor student achievement in the classroom, teachers expect to obtain precise information for a wide range of ability levels. The polytomous scoring methods, in that regard, outperformed the traditional approaches and demonstrated practical utility for providing more reliable information about a wide range of ability levels. The empirical findings were also supported by the findings of the simulation study in which GRM3-NA outperformed the other scoring approaches across different test lengths and proportions of missingness. Specifically, in the empirical study, we found that GRM3-NA indicated good model-data fit indices as well as the lowest bias and RMSD with the traditional methods, 2PL-NA and 2PL-IN. Also, the TIF was maximized for a wider range of ability levels, emphasizing the utility of the approach. Unlike the TIF for GRM3-NA, the TIFs for the other scoring methods were maximized for a narrow range of ability levels and hence high measurement accuracy was only available for a limited number of students. In the simulation study, we found that estimated person parameters for GRM3-NA had the lowest RMSD and the highest correlation with the true person parameters.
The polytomous approach could be implemented within both classical test theory and IRT frameworks. Especially when the sample size is small, the classical test theory framework could be more feasible than the IRT framework for scoring the items. For such tests, the polytomous scoring approach could be used to compute a raw score. A high raw score would suggest that a student has a high ability level and demonstrates optimal time use when responding to the items on the test. The utility of the polytomous scoring approach becomes more evident for the IRT framework because the treatment of not-reached items is very likely to change the item and person parameters obtained from the test. Our results from the empirical study indicated that scoring not-reached items as incorrect or treating them as not-administered (i.e., missing) in the scoring process produced substantially different results regarding the measurement accuracy of the test. Especially, scoring not-reached items as incorrect appeared to have a negative impact on the estimation of item and person parameters, due to the high proportion of not-reached items in the response data.
The polytomous scoring approach, unlike other methods for dealing with the non-effortful response, makes no explicit assumption regarding the students’ performance. Previous studies indicated that there might be an association between non-effortful response behavior and being a low-achieving student (Rios et al., 2017; Soland & Kuhfeld, 2019) and thus choosing an appropriate method to handle non-effortful responses is crucial for preventing the biased estimation of person and item parameters. However, the polytomous scoring approach does not make any assumption about student ability and non-effortful response behavior. With the polytomous scoring approach, the response time of each item is used to determine the eligibility of partial credit to be given to students. The effortful response behavior is rewarded with more credit while very slow or fast responses are not removed from the response data and thereby maximizing the information available about the student performance.
It could be argued that students are likely to differ in their speed and thus some students could be very slow while the others could be faster in answering the items. Although this is a reasonable expectation, students are also expected to make adequate effort to answer as many items as possible within the allotted time. In this study, the response time distributions fluctuated substantially based on the difficulty levels of the items. Furthermore, since we analyzed the response time distribution for correct and incorrect responses separately, we were able to identify and reward the students who did not answer the item correctly but showed the optimal time use. Using this approach, we were able to differentiate the students who did not answer the item correctly but at least showed more effortful response behavior than those who failed to answer the item correctly and used either too little or too much time in answering the item.
Limitations and Future Direction
In this study, the empirical example with a computer based, formative assessment was used to illustrate the utility of the polytomous scoring approach for low-stakes assessments with a time limit. Future research could further investigate the polytomous scoring approach in international large-scale assessments and formative assessments (e.g., curriculum-based measurement tools) that require students to answer items as accurately and rapidly as possible. For example, the cognitive test in the 2015 and 2018 administrations of PISA involves both the time spent on the items and the number of actions students took before answering the items. Using both response times and the number of actions could facilitate the detection of non–effortful response behavior among the students, before applying the polytomous scoring approach.
Although we used the GRM for demonstrating the three variants of the polytomous scoring approach, the polytomous scoring framework is not limited to the GRM as an IRT model. Future research should investigate the performance of the polytomous scoring approach with other polytomous IRT models, such as the partial credit model (Masters, 1982) and the generalized partial credit model (Muraki, 1992). Given the elimination of the discrimination parameter in the partial credit model, results could be different from what was found in this study based on GRM. Last, the students who participated in the low-stakes assessment used in this study knew about the time limit before starting the test; however, they could not be informed about the polytomous scoring based on their response times because this study was based on a post hoc analysis of the response data. Informing the students about the polytomous scoring rules before taking the test could have motivated the students to adjust their test-taking strategies (e.g., speeding up to gain more scores) and thereby demonstrating more effortful response behavior during the test. Finally, future research can compare the performance of the polytomous scoring approach with that of regression-based approaches (e.g., pattern mixture modeling) that would use either the number of not-reached items or the total response time as a covariate in order to adjust the influence of not-reached items in the scoring process.
Supplemental Material
sj-pdf-1-epm-10.1177_0013164421991211 – Supplemental material for A Polytomous Scoring Approach to Handle Not-Reached Items in Low-Stakes Assessments
Supplemental material, sj-pdf-1-epm-10.1177_0013164421991211 for A Polytomous Scoring Approach to Handle Not-Reached Items in Low-Stakes Assessments by Guher Gorgun and Okan Bulut in Educational and Psychological Measurement
Footnotes
Declaration of Conflicting Interests
The author(s) declared no potential conflicts of interest with respect to the research, authorship, and/or publication of this article.
Funding
The author(s) received no financial support for the research, authorship, and/or publication of this article.
Supplemental Material
Supplemental material for this article is available online.
References
Supplementary Material
Please find the following supplemental material available below.
For Open Access articles published under a Creative Commons License, all supplemental material carries the same license as the article it is associated with.
For non-Open Access articles published, all supplemental material carries a non-exclusive license, and permission requests for re-use of supplemental material or any part of supplemental material shall be sent directly to the copyright owner as specified in the copyright notice associated with the article.