
Abstract
Zhang and Savalei proposed an alternative scale format to the Likert format, called the Expanded format. In this format, response options are presented in complete sentences, which can reduce acquiescence bias and method effects. The goal of the current study was to compare the psychometric properties of the Rosenberg Self-Esteem Scale (RSES) in the Expanded format and in two other alternative formats, relative to several versions of the traditional Likert format. We conducted two studies to compare the psychometric properties of the RSES across the different formats. We found that compared with the Likert format, the alternative formats tend to have a unidimensional factor structure, less response inconsistency, and comparable validity. In addition, we found that the Expanded format resulted in the best factor structure among the three alternative formats. Researchers should consider the Expanded format, especially when creating short psychological scales such as the RSES.
Keywords
The Likert format with disagree–agree response options is the most popular scale format used in psychological scales. A Likert scale item typically involves asking participants how much they agree with a statement regarding their attitude or behavior. The response options usually range from “strongly disagree” to “strongly agree.” Our study focuses on one of the most widely used Likert scales in psychology, the Rosenberg Self-Esteem Scale (RSES; Rosenberg, 1989), which was designed to be a unidimensional scale measuring global self-esteem.
Despite their popularity, Likert scales with disagree–agree options, such as the RSES, have faced many criticisms (e.g., Cabooter et al., 2016; Lindwall et al., 2012; Saris et al., 2010). There are generally two types of issues that have been associated with the Likert format. The first centers around the use of disagree–agree response options, pointing out that such response options are often ambiguous and open to many interpretations (e.g., Fowler & Fowler, 1995; Javeline, 1999; Saris et al., 2010). According to Saris et al. (2010), to respond to a Likert item with disagree–agree options, participants first need to identity the “variable” in the item’s statement, which is a key word or phrase in the item that participants can imagine varies across the disagree–agree options and use to guide themselves to pick one of the options. For example, for the RSES item “I certainly feel useless at times,” the variable in the item may be the frequency of “feeling useless.” Having identified this variable, participants can then access how much they endorse the variable (e.g., how frequently they think they feel useless), and finally translate their assessment onto the disagree–agree options. However, different participants may identify different variables in the same item, and thus translate the variable into the disagree–agree options differently. For the above RSES item, the variable can also be the degree, rather than the frequency, of “feeling useless.” Given the different choices of the variable, when participants pick the “slightly disagree” option, they may mean that they feel useful at times (as opposed to “useless”) or they may mean they feel useless most of the time (as opposed to “at times”). These differences in the interpretation of the response options may increase measurement error, lowering the scale’s reliability, or introduce systematic bias, lowering validity.
The second type of issues with the Likert format has to do with the negatively worded (NW; a.k.a., reverse-worded) items used in the Likert format. NW items are Likert items where agreement with the items indicates low endorsement of the construct being measured, and they are commonly included in scales. The aforementioned RSES item, “I certainly feel useless at times,” is a NW item. In contrast, positively worded (PW) items are those where agreement indicates high endorsement of the construct. The main rationale of including both PW and NW items is to control for acquiescence bias, which is the tendency of participants to agree with a statement regardless of its content (Ray, 1983). For a balanced scale (i.e., a scale with an equal number of PW and NW items), acquiescence bias present in each item will tend to be canceled out when the item scores are added together, so that the participant’s total score will be unaffected by the acquiescence bias. 1 However, many researchers have raised doubts about the wisdom of including NW items (e.g., Lindwall et al., 2012; Savalei & Falk, 2014; Van Sonderen et al., 2013). Although NW items may control for the acquiescence bias in the total score, this bias, which is assumed to vary across people, can still affect the covariance structure of the items, which in turn affects statistical analyses that are based on the covariances, such as factor analyses (Savalei & Falk, 2014). In addition, the constant switching between PW and NW items may cause confusion and elicit erroneous responses from some participants (Swain et al., 2008; Zhang et al., 2019). Particularly, many NW items (e.g., “I feel I do not have much to be proud of” from the RSES) are created by adding negative participles such as “not” or “no” and participants may accidentally skip these negative participles when reading the items. All these issues associated with NW items, especially careless responding and confusion, are thought to be the reasons behind the emergence of method factors when data from a Likert scale are subjected to factor analyses. Indeed, Schmitt and Stuits (1985) and C. M. Woods (2006), using simulation studies, showed that for a scale that has an underlying unidimensional structure, if at least 10% of participants respond carelessly to NW items, a clearly identifiable method factor may emerge and the one-factor model is likely to be rejected. This kind of method factors is common in Likert scales with NW items, and they artificially increase the dimensionality of the scale from what was theoretically intended.
The RSES is one popular psychological scale whose factor structure is known to be affected by the inclusion of NW items. In fact, over the past four decades, the factor structure of the RSES has been heavily debated. This debate originates from the finding that under exploratory factor analyses (EFAs), two factors often emerge, with all PW RSES items loading on one factor and all NW RSES items loading on the other factor (e.g., Hensley & Roberts, 1976). This finding has led early researchers (e.g., Carmines & Zeller, 1979; Hensley & Roberts, 1976) to posit that the RSES actually measures two related but separate constructs, positive self-esteem and negative self-esteem, even though the RSES was originally designed to be unidimensional. However, in recent decades, an increasing number of researchers have argued that the two-factor structure emerging from the EFAs is an artifact that has arisen due to the inclusion of NW items (e.g., Greenberger et al., 2003; Lindwall et al., 2012; Marsh, 1996). These researchers found that a confirmatory factor analysis (CFA) model with one substantive factor (self-esteem) and a method factor corresponding to the NW items yields a very good statistical fit to data from the RSES (e.g., Lindwall et al., 2012; Marsh, 1996; McKay et al., 2014). Similar debates regarding whether NW items affect the factor structure have also occurred around other Likert scales, such as Need for Cognition (e.g., Zhang et al., 2016), Loneliness Questionnaire (e.g., Ebesutani et al., 2012), Perceived Stress Scale (e.g., Cole et al., 2019), and Material Values Scale (e.g, Wong et al., 2003). As we have explained in the previous paragraph, such method factors in Likert scales are usually thought to be caused by confusion and careless responding toward NW items (e.g., Schmitt & Stuits, 1985; C. M. Woods, 2006).
To account for the method effect of NW items, researchers proposed a number of CFA models including the aforementioned model with a method factor, which is a type of bifactor model, as well as a model with a series of correlated residuals for NW items (e.g., Lindwall et al., 2012; Marsh, 1996). However, this is not the ideal approach to deal with the issues associated with NW items for several reasons. First, it is unclear which of these proposed models is the best model; often, several models can yield similar fit and other psychometric properties (e.g., Lindwall et al., 2012; Marsh, 1996). Second, these models are more complex than the theoretical structure of the scale, so that it is more difficult to work with them; for example, reliability computations become harder, and the resulting observed composite, if used, will not be free of method effect contamination. Third, although these models can account for the method effect of NW items, they do not simultaneously account for the acquiescence bias present in the covariance structure (Savalei & Falk, 2014). Finally, resorting to one of these models leaves open the question as to whether the multidimensionality is due to the method effect of NW items or due to the construct itself, that is, it does not help resolve the debate about the theoretical structure of a construct such as self-esteem.
As a result, some researchers advocated simply removing NW items and creating Likert scales with only positive items (e.g., Cole et al., 2019; Ebesutani et al., 2012; Greenberger et al., 2003; Van Sonderen et al., 2013; Zhang et al., 2016). Several studies (e.g., Dueber et al., 2021; Greenberger et al., 2003; Zhang et al., 2016) have shown that when a balanced scale is changed to a scale with all PW items, the scale’s factor structure becomes more consistent with the theoretical factor structure; in most cases, the scale becomes unidimensional. However, eliminating NW items cannot solve the other problems associated with the Likert format. First, eliminating NW items does not remove acquiescence bias, and when all items are PW, this bias will now affect sum scores as well. Second, the problems resulting from the ambiguity of Likert items (i.e., what is “variable” in the text of each item) still remain as long as disagree–agree response options are used.
To alleviate both the problem associated with NW items and the problem related to the ambiguity of Likert items, several researchers (e.g., Höhne et al., 2018; Saris et al., 2010; Schuman & Presser, 1981; Wong et al., 2003; Zhang et al., 2019; Zhang & Savalei, 2016b) have advocated for alternative scale formats. In this article, we examine three alternative formats that have been proposed to reduce problems associated with the Likert format. The first alternative format is the Expanded format, which involves expanding out the disagree–agree options in the Likert format to options written in full sentences (hence the name, coined by Zhang & Savalei, 2016b). An example of an item in the Expanded format is shown in Table 1 under “Alternative Format Versions.” The Expanded format is similar to the forced-choice format (e.g., Javeline, 1999; Schuman & Presser, 1981), which asks the respondents to choose between two substantive response options written in full sentences, and it has been used in clinical scales such as Beck Depression Inventory for measuring depression symptoms (BDI; Beck et al., 1996) and Bipolar Inventory of Symptoms Scale for measuring bipolar disorder symptoms (Bowden et al., 2007).
Example Items for All Six Versions of the RSES.
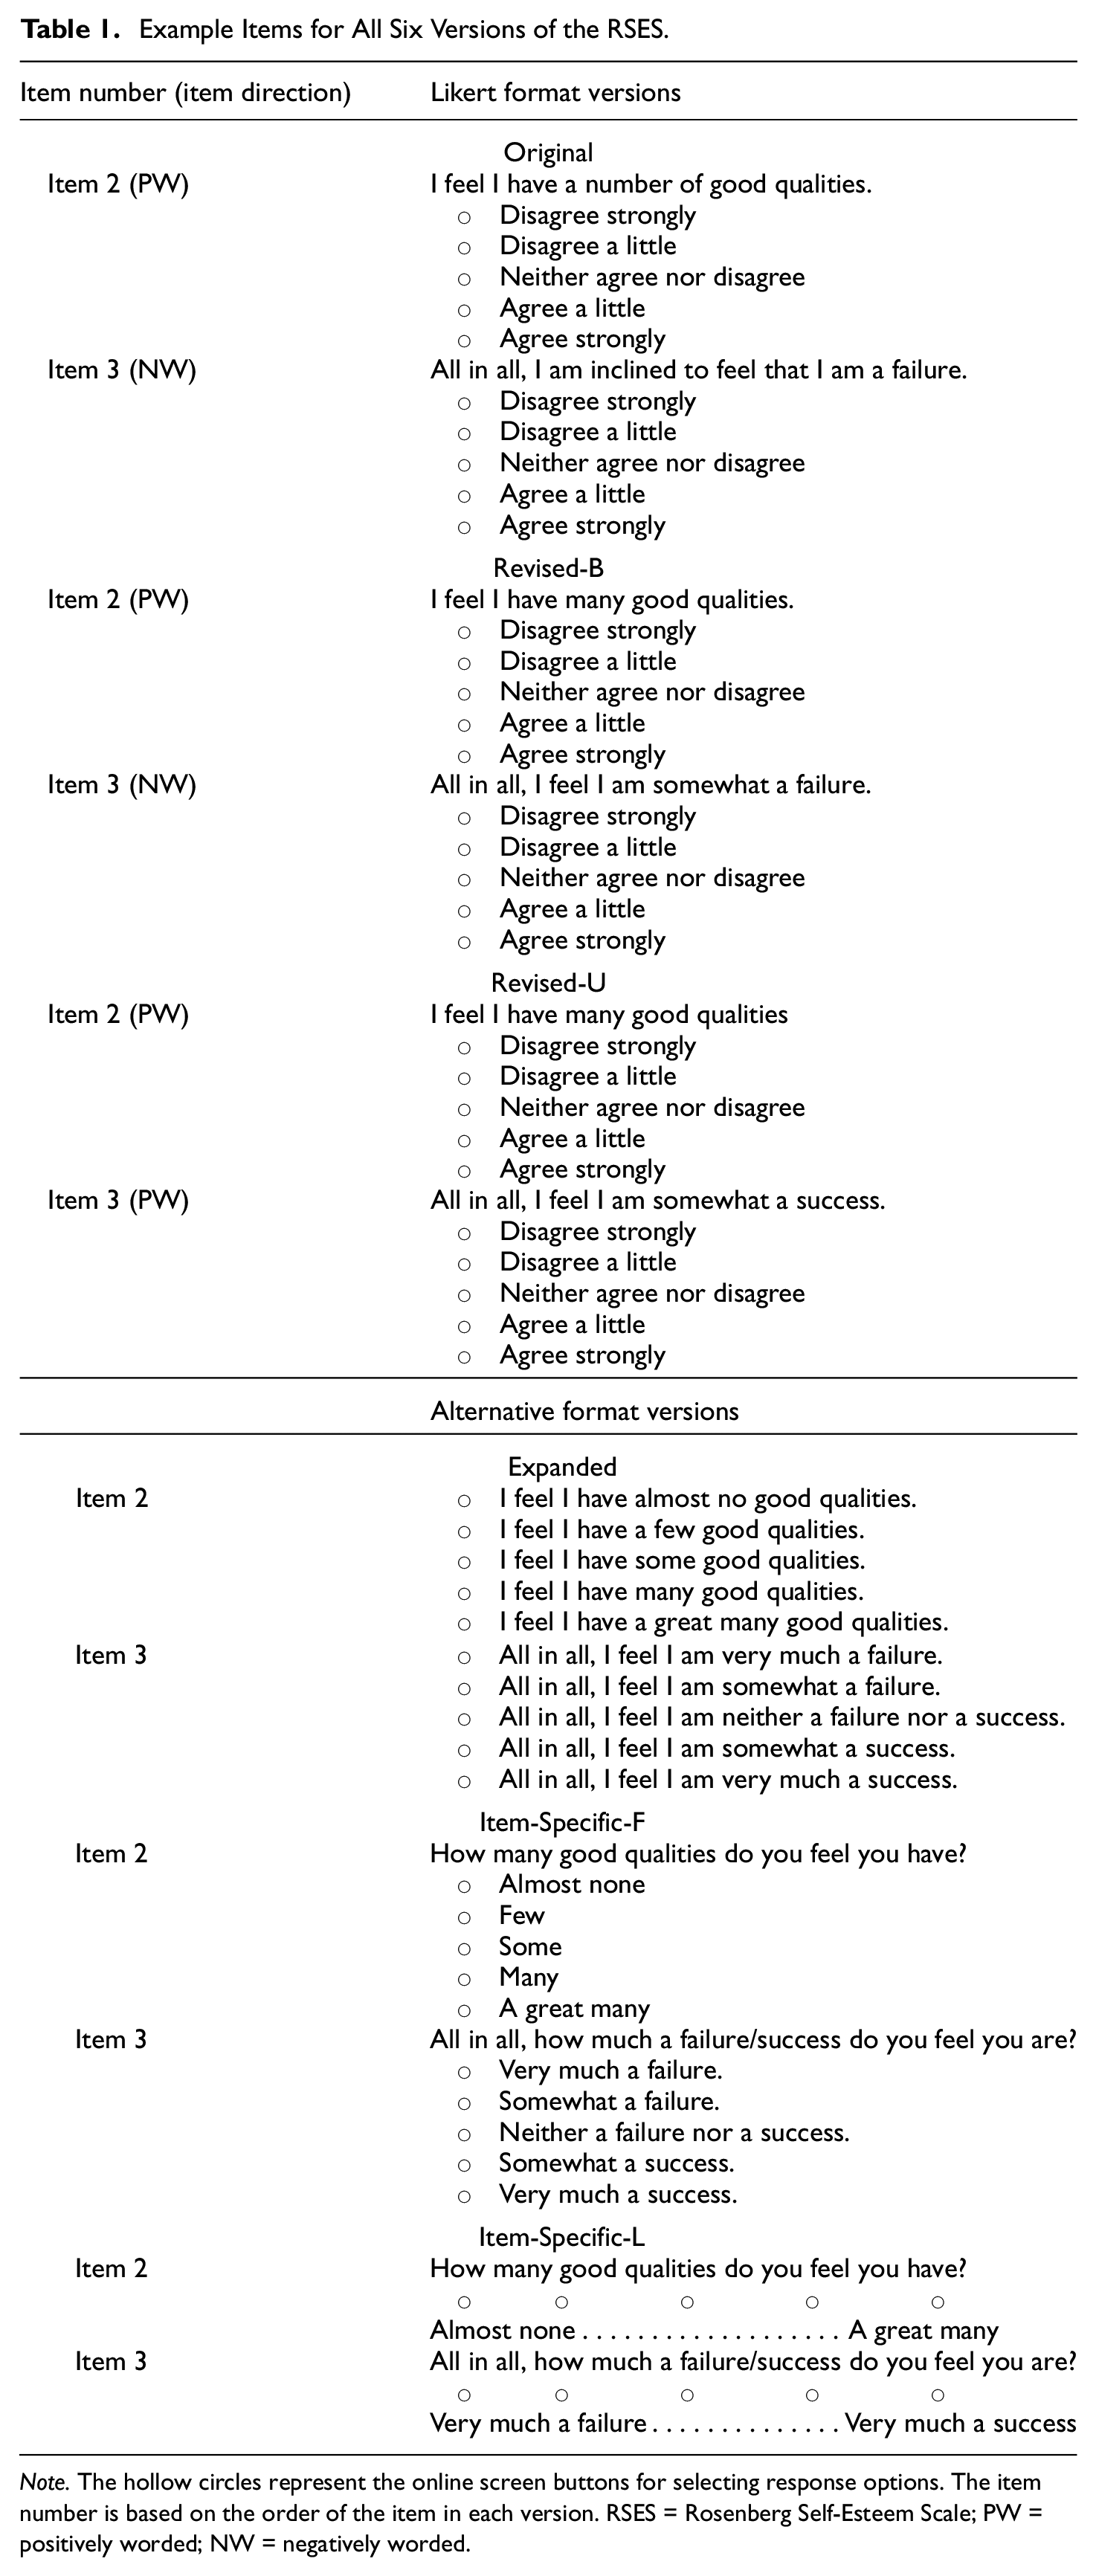
Note. The hollow circles represent the online screen buttons for selecting response options. The item number is based on the order of the item in each version. RSES = Rosenberg Self-Esteem Scale; PW = positively worded; NW = negatively worded.
The Expanded format has several advantages over the Likert format (Zhang & Savalei, 2016b). First, the Expanded format replaces the ambiguous disagree–agree options with more specific response options tailored to each item. The more concrete nature of the response options reduces the ambiguity in the interpretation of the item. Second, by getting rid of the disagree–agree options, the acquiescence bias is theoretically removed because the items do not involve participants agreeing with any statement, thus eliminating the concerns of acquiescence bias affecting the total score and the covariance structure of the scale. Finally, the items in the Expanded format do not have direction, each item having both PW and NW versions presented as response options. For example, for the Expanded version of Item 2 in Table 1, the first two options can be considered as the NW versions of the item, whereas the latter three options can be considered as the PW versions. This means that across the items, there is no switching between PW and NW, thus reducing the effects of confusion and careless responding, which, as previously mentioned, are the possible causes of method effects. Indeed, Zhang and Savalei’s (2016b) original research on the Expanded format showed that relative to the Likert format, the RSES and BDI in the Expanded format yielded factor structures that were more consistent with the theoretically expected structure, and their follow-up research (Zhang et al., 2019) showed that the same was true for the Big Five Inventory (BFI; John et al., 2008). Kam (2020) investigated the Life Orientation Test–Revised (LOT-R; Scheier et al., 1994) in the Expanded format and found that relative to the Likert format, the Expanded format resulted in a more consistent response pattern (e.g., participants who indicate higher optimism in one LOT-R item also tend to indicate high optimism in another item).
We note that although the Expanded format eliminates the method effect of NW items (because Expanded items do not have directions), it may still be affected by order effect, which is the tendency of participants to pick either the first or the last option when presented with more than two options. However, it is important to realize that the Likert format may also be affected by order effects because the disagree–agree options in the Likert format can also be ordered in different ways. Fortunately, previous research showed that the order effect is not very pronounced in either the Likert or the Expanded format. Specifically, for the Likert format, previous studies found that changing the order of the response options across all items did not affect the scale mean difference, item-level distribution (i.e., distribution of the number of the participants picking each response option), and factor structure of the scale (e.g., Robie et al., 2022; Weng & Cheng, 2000), but randomizing the response options for each item affected the careless responding (Robie et al., 2022). For the Expanded format, Zhang and Savalei (2016b) found that changing the order of the response options did not affect the item-level distribution and the factor structure of the scale.
In addition to the Expanded format, there are two other alternative formats, we will examine in our research. We will refer to these two alternative formats as Item-Specific formats. The Item-Specific formats combine features from the Expanded format and from the Likert format (see Table 1 for example items). Like the Expanded format, the response options in these formats are specific and tailored to each item (hence the name, coined by Saris et al., 2010). Like the Likert format, these response options are words or short phrases that can be viewed as anchor labels, but they are no longer on the disagree–agree continuum. Unlike the Likert format, the item stem in the Item-Specific formats is framed as a question. The item stem is written in such a way as to remove the distinction between PW and NW items (e.g., see the examples in Table 1). The only difference between the two Item-Specific formats is that in one version, all options have anchor labels, and in the other, only the first and last response options have anchor labels (see Table 1 for examples). Therefore, in this article, we will call these formats Item-Specific-Full (Item-Specific-F) and Item-Specific-Light (Item-Specific-L), respectively. We note that in some articles (e.g., Cabooter et al., 2016; Tzeng et al., 1991; S. A. Woods & Hampson, 2005), researchers refer to the Item-Specific-L format as the bipolar format, contrasting it with the Likert format, which is considered unipolar because each item contains only one statement that is either PW or NW. In other articles (e.g., Moschis et al., 2011; Wong et al., 2003), this format is referred to as the interrogative format, emphasizing the fact that each item is framed as a question as opposed to a declarative sentence.
As the Item-Specific and the Expanded formats share many features, such as more specific response options and the removal of the distinction between PW and NW items, they share the same theoretical advantages (e.g., reducing item ambiguity, method effects, and acquiescence bias) over the Likert format. Previous research found that relative to the Likert format, the Item-Specific-F format yielded better response quality (as measured by more cognitive effort and less order effect; Höhne et al., 2018; Höhne & Krebs, 2018), and had higher or similar validity and reliability (Höhne et al., 2018; Lelkes & Weiss, 2015; Saris et al., 2010). Similarly, previous research on the Item-Specific-L format found that it tends to yield better factor structure and similar or higher reliability when compared with the Likert format (e.g., Tzeng et al., 1991; Wong et al., 2003).
In summary, the alternative formats (Expanded, Item-Specific-F, and Item-Specific-L) share characteristics that should theoretically minimize the problems associated with the Likert format. Specifically, they do not involve NW items and have response options that are more specific than the disagree–agree options in the Likert format. The alternative formats differ in the degree of specificity of the response options. The Expanded format has the most specific response options, which are written in full sentences, followed by the Item-Specific-F format, the response options of which are words or short phrases. The Item-Specific-L format has the least specific response options because the labels for the middle response options are omitted. The main advantage of having specific response options is that the item content becomes more concrete, making it easier for participants to comprehend the item and pick the option suitable for them. However, the price of specificity is that the Expanded format is the most laborious and time-consuming, in terms of both creating the items (for the researcher) and responding to the items (for the participants). Past research exists that has compared each alternative format with the Likert format; however, no research exists that has compared all three alternative formats with each other and with the Likert format for any scale.
The current research addresses this gap in the literature by comparing the psychometric properties of the RSES scale across the Likert and the three alternative formats. We mainly aim to replicate the results that show the benefits of the three alternative formats over the Likert format and to investigate whether the benefits of the alternative formats are affected by the specificity of the response options.
We have included six versions of the RSES. The six versions consist of three Likert format versions and three alternative format versions. The three Likert format versions are Original, Revised-Balanced (Revised-B), and Revised-Unbalanced (Revised-U); the three alternative versions are Expanded, Item-Specific-F, and Item-Specific-L. The Original and Revised-B versions contain half PW and half NW items, whereas the Revised-U version contains all PW items. The Revised-B and Revised-U versions are Likert format versions based on the item content of the Original version but with different wording for some items, designed to better match the item stems for the alternative formats (see the next section for details). Our research focuses on comparing across the Revised-B, Revised-U, Expanded, Item-Specific-F, and Item-Specific-L versions, where item wordings are controlled for (i.e., excluding the Original Likert format, which is included for reference).
We conducted two studies to compare the different versions of RSES. Study 2 is a replication of Study 1’s major findings with a large sample (see Study 2 for details). In both studies, we compared the factor structure and response inconsistency across the scale versions. In Study 1, we also compared validity correlations by examining the correlation between self-report and peer-report of the RSES total scores (i.e., assessing self-other agreement) and the correlation between the RSES total score and the total score on the Narcissistic Personality Inventory (NPI; Raskin & Terry, 1988) (i.e., assessing convergent validity). The NPI is a 40-item scale designed to measure narcissism as a normal personality trait. Previous studies showed that NPI is moderately correlated with the RSES, the correlation coefficient typically ranging from .25 to .40 (e.g., Brown & Zeigler-Hill, 2004; Campbell et al., 2002; Falk et al., 2015; Ng et al., 2014).
We have three hypotheses for our studies. The first hypothesis is that the Revised-U Likert version and the three alternative format versions are more likely to have a unidimensional factor structure than the Revised-B version, due to the removal of the NW items. Second, because the alternative formats reduce item ambiguity, careless responding, method effects, and acquiescence bias, we expect the alternative format versions to have higher validity correlations than the Revised-B and Revised-U versions. Finally, we aim to replicate Kam’s (2020) finding that the Expanded format has less response inconsistency than the Likert format, using two indices of inconsistency that they created, and we also expect that the other two alternative formats will have less response inconsistency than the Likert formats.
We have pre-registered the study designs as well as the hypotheses and analyses for the factor structure and validity of the RSES in both studies (see Methods for details). We did not pre-register the hypotheses regarding the response inconsistency analyses based on Kam (2020), because this article was published after our data collection.
Scale Construction
Table 1 shows one PW and one NW item from the Original Likert version of the RSES in all six studied formats: (a) Original Likert, (b) Revised-B Likert, (c) Revised-U Likert, (d) Expanded, (e) Item-Specific-F, and (f) Item-Specific-L. The complete versions are provided in Supplementary Materials. 2
The Likert versions used a 5-point response scale, ranging from “strongly disagree” to “strongly agree.” The Original and Revised-B versions contain five PW items (i.e., Items 1, 2, 4, 6, and 7) and five NW items (i.e., Items 3, 5, 8, 9, and 10), whereas the Revised-U version contains 10 PW items. The Original Likert version is Rosenberg’s (1989) RSES. Because some of the original RSES items are difficult to convert to the alternative formats without major changes to the wording or sentence structure of the items, we created the Revised-B and Revised-U Likert versions where the items can be more easily converted to the alternative formats (see Table 1 for examples). Consequently, the three alternative format versions have items that are worded similarly to those in the Revised Likert versions. For the Expanded version, the second (or fourth) response option was created to always correspond to the NW (or PW) item stem in the Revised Likert versions, respectively; the other response options were created by varying one word or one short phrase of the item. For the Item-Specific-F and Item-Specific-L versions, each item stem was phrased as a question, but was still worded similarly to the Revised Likert and Expanded versions; the response options were obtained by shortening the response options in the Expanded version (see Table 1 for examples).
Study 1
Design and Procedure
We recruited participants from the Human Subject Pool (HSP) at the Department of Psychology of the University of British Columbia (UBC). We obtained ethical approval for the study from UBC’s Behavioural Research Ethics Board. The study was conducted online. There were two versions of the online survey. Participants selected the version they wanted to participate in when they signed up. In both versions, participants were first randomly assigned to complete the RSES in one of the six formats. Then, all participants completed the NPI (Raskin & Terry, 1988), followed by a demographics questionnaire. For Version 2 of the survey, the demographics questionnaire was the end of the survey. For Version 1, each participant was further asked to send emails to two of their friends, inviting them to participate in a peer-rating survey. 3
The peer-rating survey included the Peer-Rating version of the RSES, which asked the respondents to access the self-esteem of their friends. For example, for the Original Likert item that says “I feel I have a number of good qualities,” the corresponding peer-rating item is “Your friend feels he or she has a number of good qualities.” The version of the RSES that the peers completed corresponded to one of the six versions their friend (i.e., the original participant) was randomly assigned to. All study materials are provided in Supplementary Materials (see footnote 2 for the webpage link). We have also pre-registered the study design on the Open Science Framework (OSF) prior to data collection. 4
Participants
A total of 1,909 undergraduate students participated in Study 1; 80.2% were female and 19.7% were male. The median age was 20 years old. There were 49.9% participants from East Asian background, 22.8% from European, and 27.3% other. Figure 1 shows a detailed breakdown of the sample size across different survey and scale versions. Across the two survey versions, 316, 316, 323, 314, 318, and 322 participants completed the Original, Revised-B, Revised-U, Expanded, Item-Specific-F, and Item-Specific-L versions of the RSES, respectively.
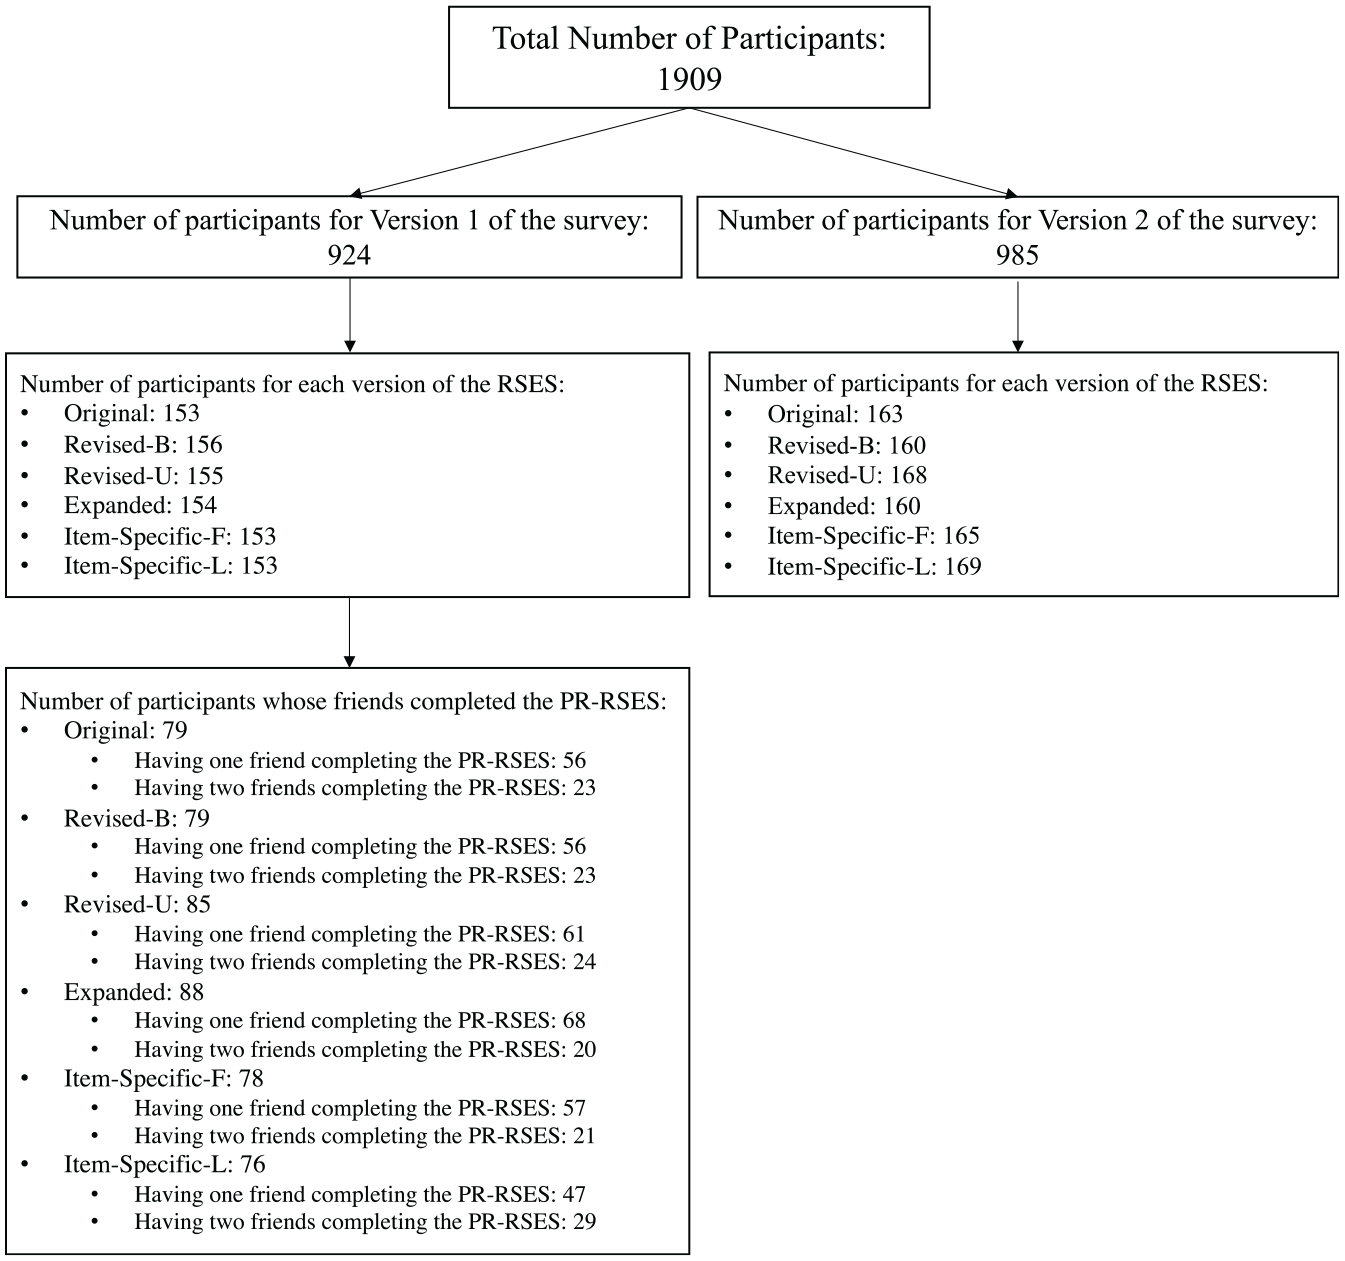
Sample Size Across Different Survey and Scale Versions.
Analytic Method
Our analyses focused on comparing the factor structure, validity, and response inconsistency of the RSES across the different versions.
Factor Analyses
We conducted both EFAs and CFAs. Parallel analysis was used to determine the number of factors for EFAs, which was performed using the
CFAs were conducted using the lavaan package (version 0.6-3) (Rosseel, 2012) in
In addition, because Model 1 is nested within Model 2, we compared the fit of Model 1 with the fit of Model 2 using the chi-square difference test based on the ML estimation and the RMSEA value associated with the difference test, which we refer to as
Validity Analyses
To assess validity, we computed the correlations between the RSES and NPI and the correlation between self- and peer-ratings of self-esteem. When computing the correlation between self- and peer-ratings, if both friends completed the peer-rating, we averaged the scores. To compare the validity correlations across the scale versions, we computed the difference between pairs of correlations and conducted significance tests through computing their confidence intervals using Zou’s (2007) method.
Response Inconsistency Analyses
For the response inconsistency analyses, we used the two indices suggested by Kam (2020) expanded. The first index, the difference index, is computed by calculating the difference between each participant’s maximum and minimum item scores across the ten RSES items and then averaging the difference scores across the participants. For the Original and Revised-B versions, the difference index was computed after the NW items were reverse-coded. A large difference index means participants tend to indicate high self-esteem in some items but low self-esteem in other items, thus higher response inconsistency. The second index, the inconsistency percentage, is the percentage of participants whose difference index was 3 or 4 (i.e., those participants who indicated a high level of self-esteem in some items but indicated a low level of self-esteem in other items). To test whether the response inconsistency is different between pairwise conditions, we conducted Wilcoxon rank-sum test for the difference index and the Pearson’s
Results
Descriptive Statistics
Descriptive statistics including item’s means and variances, distribution of response options, and covariance matrices across the scale versions are provided in Supplementary Materials. The six versions had similar item means; the average item means ranged from 3.43 to 3.64 across the six versions. For item variances, the three alternative format versions had consistently smaller variances than the Likert format versions. For example, the item variances across the Likert versions ranged from 1.01 to 1.82, whereas the item variances across the alternative formats ranged from 0.61 to 1.13 (see Supplementary Materials).
We also computed model-based reliability under the one-factor model, which makes less restrictive assumptions than Cronbach’s alpha (see Raykov, 1997, for details). Across the scale versions, the model-based reliability coefficients were very similar. Specifically, they were 0.907, 0.895, 0.918, 0.920, 0.907, and 0.923 for the Original, Revised-B, Revised-U, Expanded, Item-Specific-L, and Item-Specific-F versions, respectively.
Factor Analyses
Parallel Analyses and EFA
Figure 2 shows the results of parallel analyses. For the Likert versions (i.e., Original, Revised-B, and Revised-U), the parallel analyses suggested two factors, but, for the alternative format versions (i.e., Expanded, Item-Specific-F, and Item-Specific-L), the parallel analyses suggested one factor (see Figure 2). This pattern of results is generally consistent with our hypotheses that scales in the alternative formats tend to yield a lower dimensionality than scales in the Likert format. However, the fact that the results of parallel analysis for the Revised-U version are suggestive of a two-factor solution is less consistent with prior research (e.g., Greenberger et al., 2003; Salazar, 2015; Zhang et al., 2016), which found that a scale tends to be unidimensional when all items are PW. Our results showed that simply getting rid of NW items in the RSES does not always lead to a better and more unidimensional factor structure and the method effect associated with NW items is not the only reason for the lack of unidimensionality in the RSES (see “Discussion” section for further explanation).
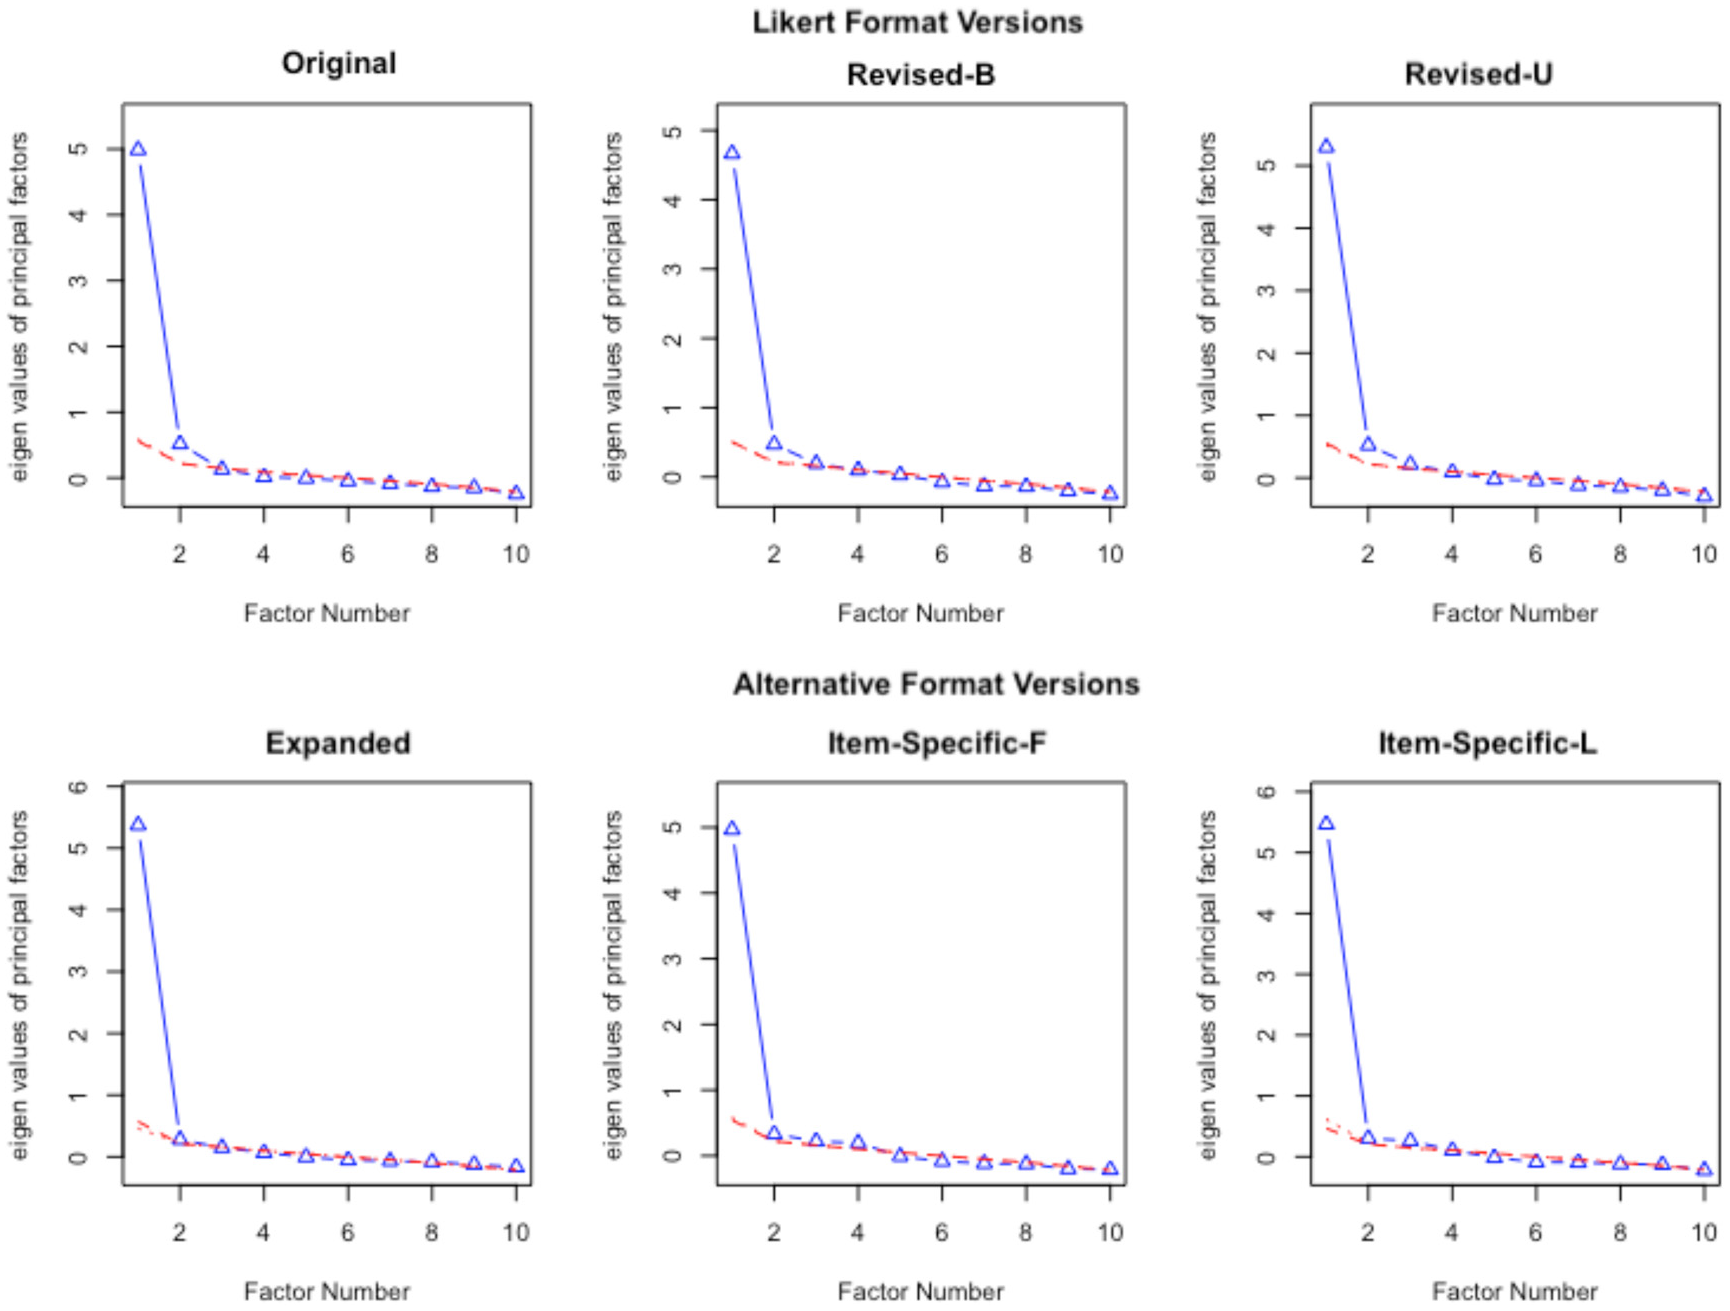
Parallel Analyses for Study 1.
Next, we conducted EFAs extracting two factors. 5 Although the two-factor solution is not meaningful for the Revised-U and alternative format versions (i.e., formats with no differentiation between PW and NW items), we extracted two factors across all scale versions for comparison. Table 2 shows the standardized loadings and factor correlations for the EFAs. For the Original and Revised-B versions, most PW items loaded on Factor 1 and most NW items loaded on Factor 2. The Revised-B version had a cleaner solution based on the item direction. For the Original version, two NW items (Items 3 and 5) did not load highly on Factor 2.
Standardized Loadings and Factor Correlations for EFAs in Study 1.
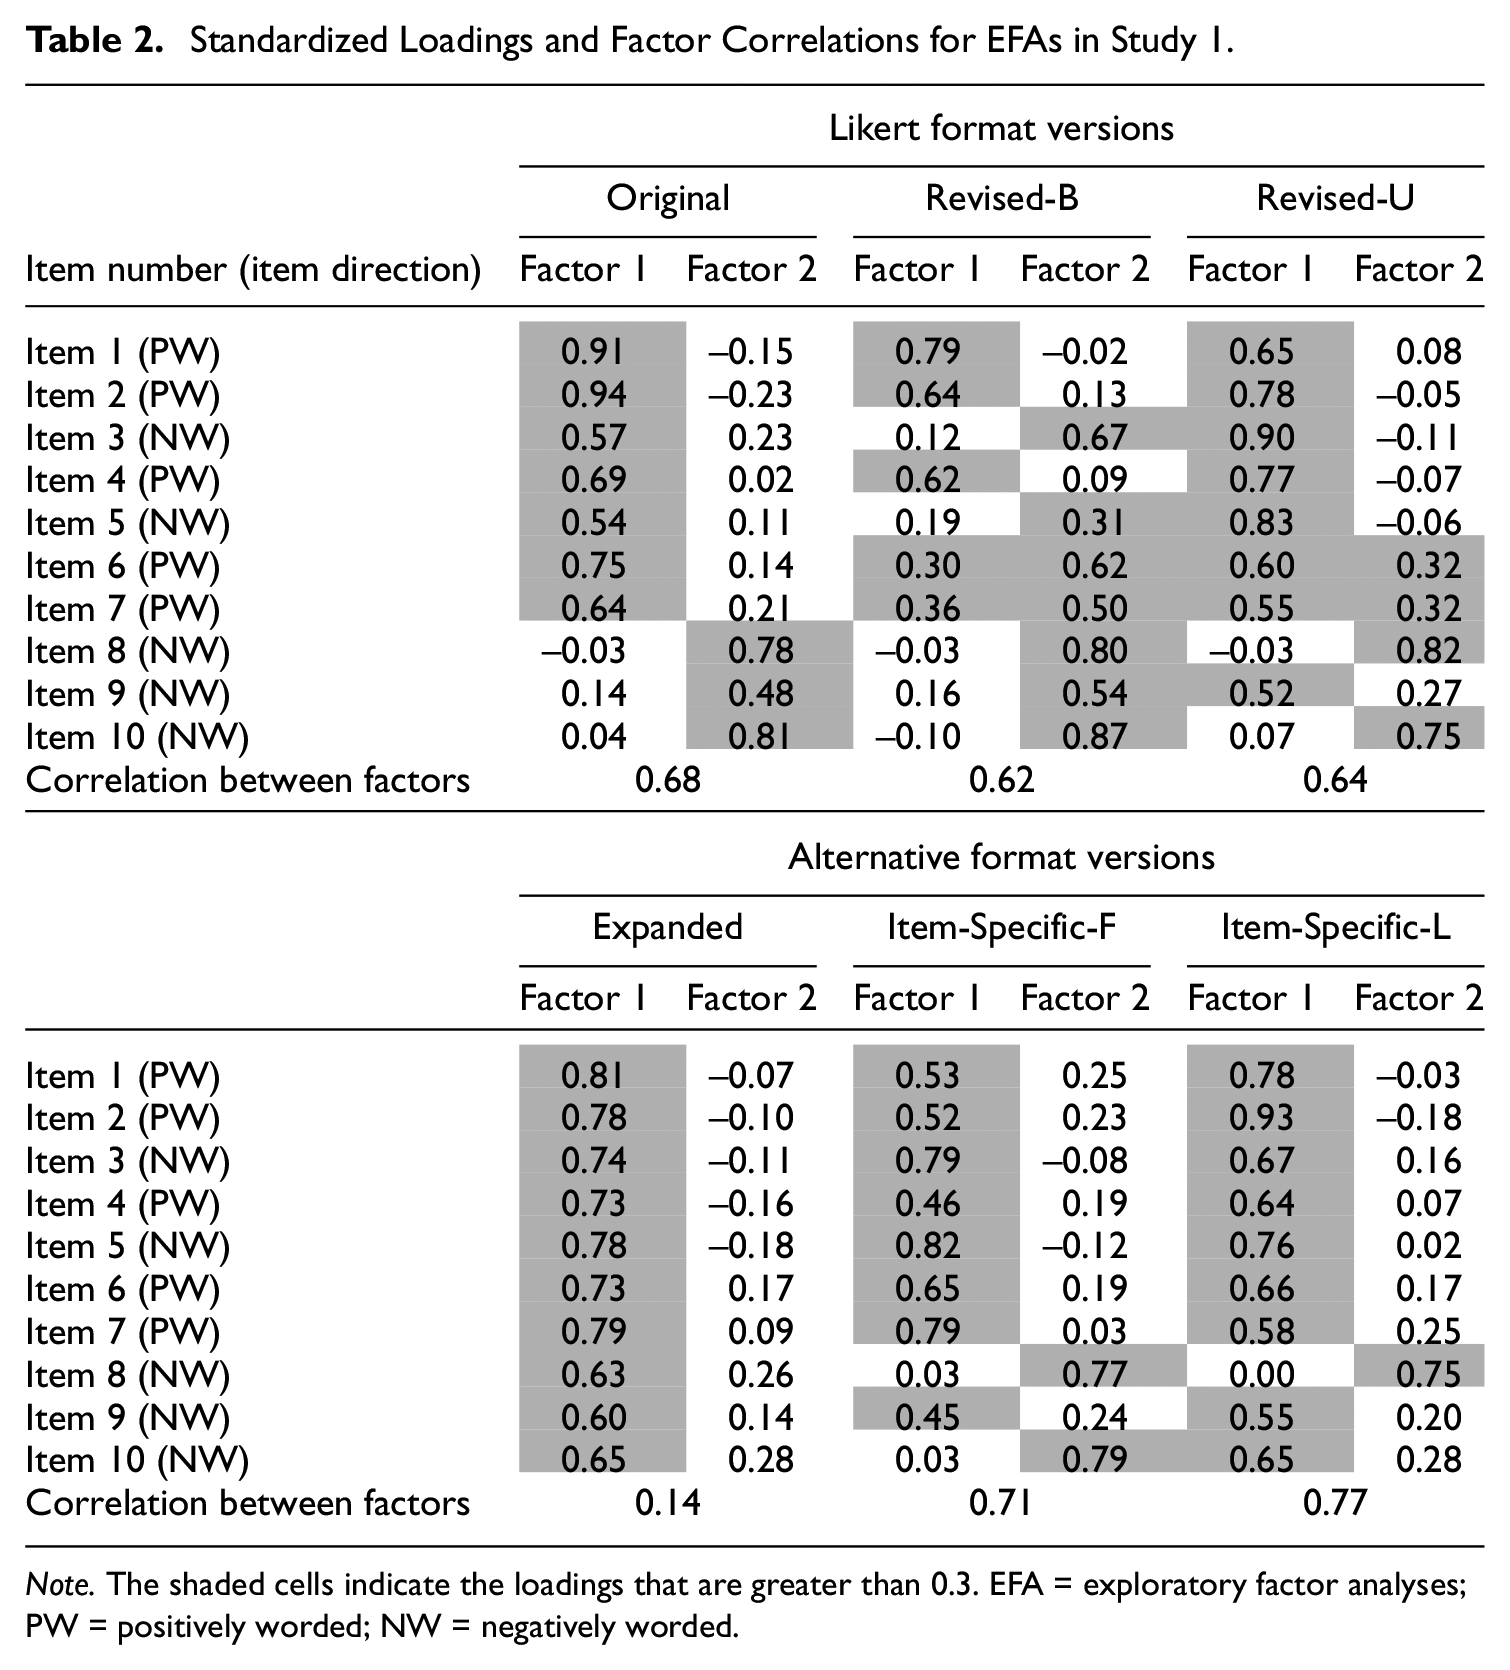
Note. The shaded cells indicate the loadings that are greater than 0.3. EFA = exploratory factor analyses; PW = positively worded; NW = negatively worded.
For the Revised-U version and the alternative format versions, the grouping of items into factors was based more on the item content. For all alternative format versions, most items loaded on Factor 1; for the Expanded version, all items loaded very highly on Factor 1. For the Revised-U Likert version, four items (two PW and two NW) loaded highly on Factor 2. The content of these four items had similar themes. In particular, the two PW items (Items 6 and 7) loading on Factor 2 are about having a positive attitude toward oneself and being satisfied with oneself, respectively. The two NW items (Items 8 and 10) are about how often one feels useless and how often one feels “no good at all.” Together, these four items, as pointed out in Tafarodi and Milne’s (2002) article, are more about how much one is happy with and accepting of oneself, whereas the other items on the RSES are more about assessing one’s abilities. The Item-Specific-F version also had Items 8 and 10 loaded highly on Factor 2, suggesting that these items may have correlated uniqueness due to item content.
Regarding the correlation between Factors 1 and 2, two alternative format versions, Item-Specific-F and Item-Specific-L, had the highest factor correlations (0.71 and 0.77, respectively), followed by the Likert versions (ranging from 0.62 to 0.68). This pattern of results indicated that the Item-Specific formats yielded a more unidimensional structure than any of the Likert format versions. However, the Expanded version had a very low factor correlation of 0.14. However, given that no items loaded highly on Factor 2, this result indicates that the data were overfactored, and only one factor was needed for describing the structure of the RSES in the Expanded format. All in all, the results of the parallel analyses and EFAs were generally consistent with our hypothesis that alternative formats are more likely to yield a unidimensional factor structure than the Likert formats.
CFAs
Table 3 shows the standardized loadings for Model 1 (i.e., one-factor model). Overall, for Model 1, the average loading sizes were quite consistent across the six scale versions. The Revised-B version had a slightly lower average loading size (0.67) than other versions (ranging from 0.70 to 0.74). One other notable pattern of results was that when the NW items in the Revised-B version (i.e., Items 3, 5, 8, 9, and 10) were changed to the PW items in the Revised-U version, the loading size can change substantially. For example, Item 5’s loading size changed from 0.44 to 0.75 when the item changed from a NW item in the Revised-B version to a PW item in the Revised-U version; on the other hand, for the items that remained PW across the Revised-B and Revised-U versions (i.e., Items 1, 2, 4, 6, and 7), the loading sizes stayed relatively the same (see Table 3). This pattern of results provides evidence that the direction of the item (i.e., whether the Likert item is NW or PW) affects its psychometric properties.
Standardized CFA Loadings for Model 1 in Study 1.
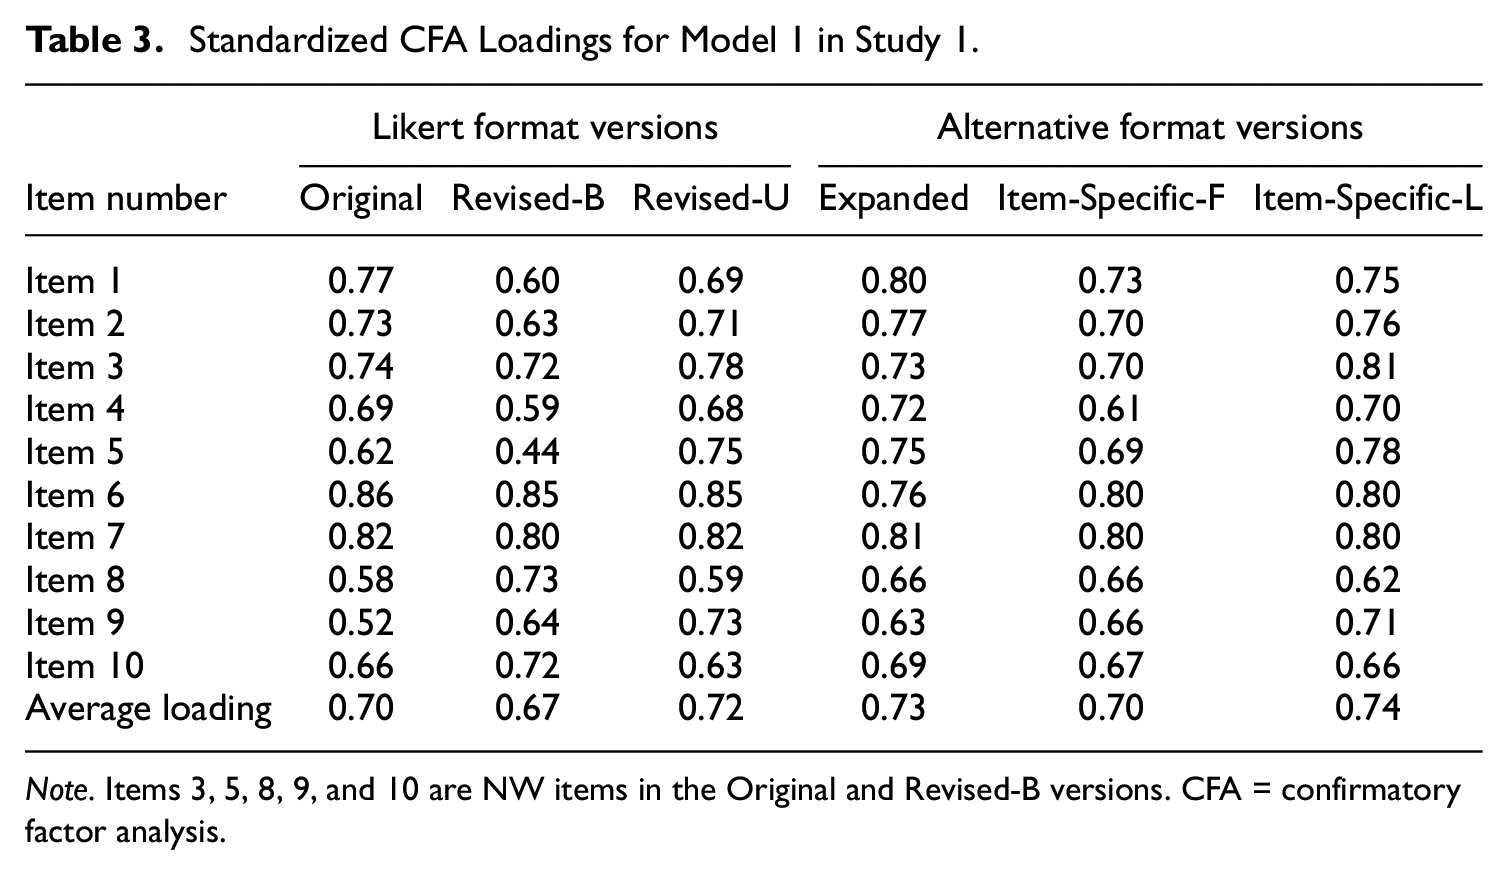
Note. Items 3, 5, 8, 9, and 10 are NW items in the Original and Revised-B versions. CFA = confirmatory factor analysis.
Table 4 shows the standardized loadings for Model 2, a two-factor model with factors formed on the item direction in the Original Likert version. Across all scale versions, Factor 1 (for PW items) had a slightly higher average loading size than Factor 2. The Expanded version had, on average, somewhat lower loadings than the other versions. In terms of the correlation between Factors 1 and 2, the Revised-U Likert and the three alternative format versions had higher factor correlations than the Original and Revised-B Likert versions; in fact, these correlations were greater than 1 (i.e., the estimates were Heywood cases), which is an indication that Model 2 is inappropriate for these versions (in this case, two factors should be collapsed into one).
Standardized CFA Loadings for Model 2 in Study 1.
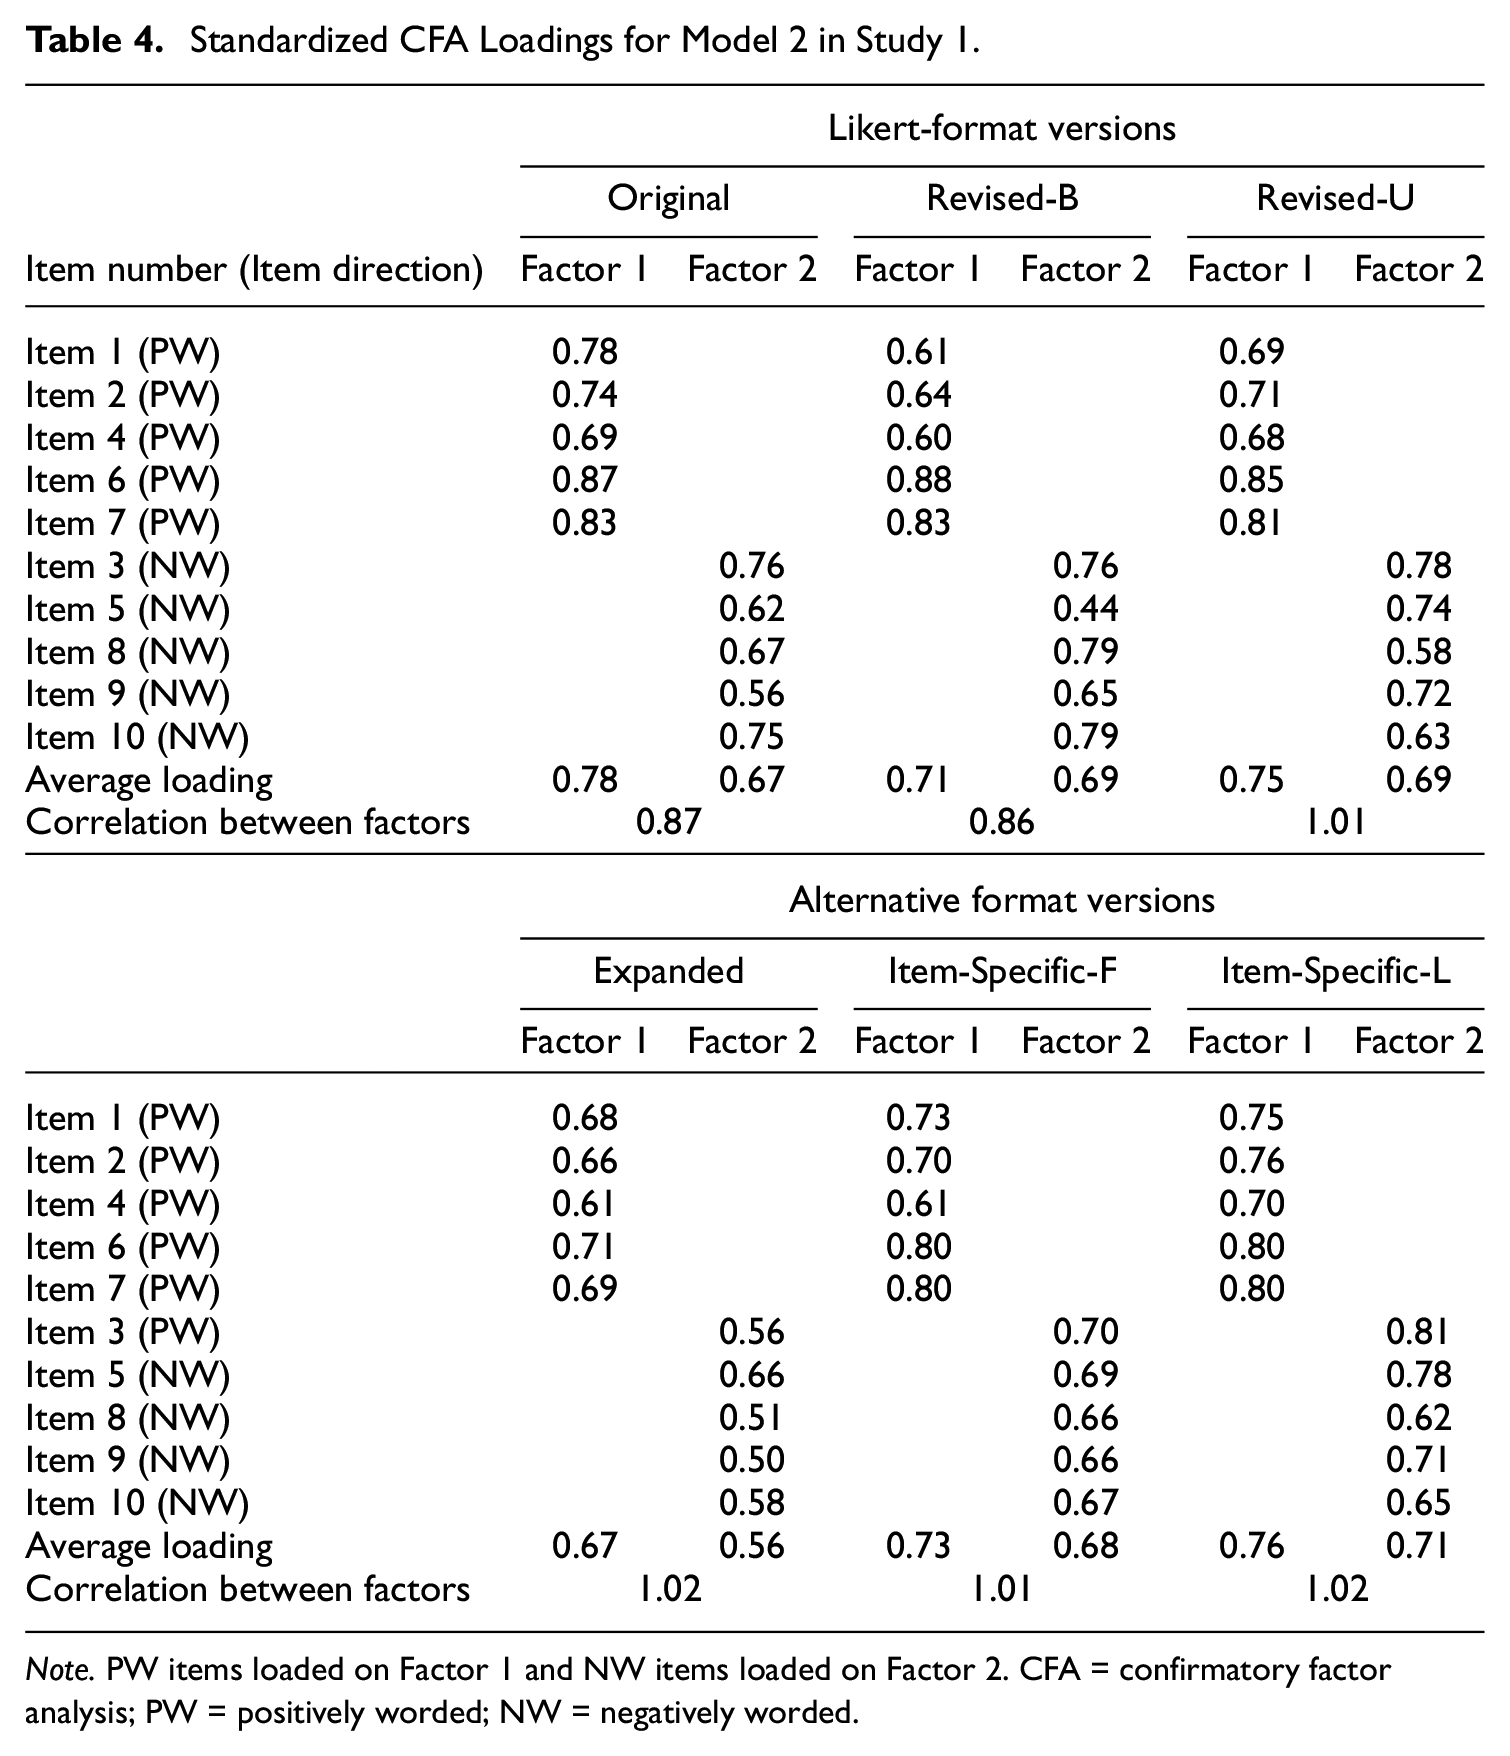
Note. PW items loaded on Factor 1 and NW items loaded on Factor 2. CFA = confirmatory factor analysis; PW = positively worded; NW = negatively worded.
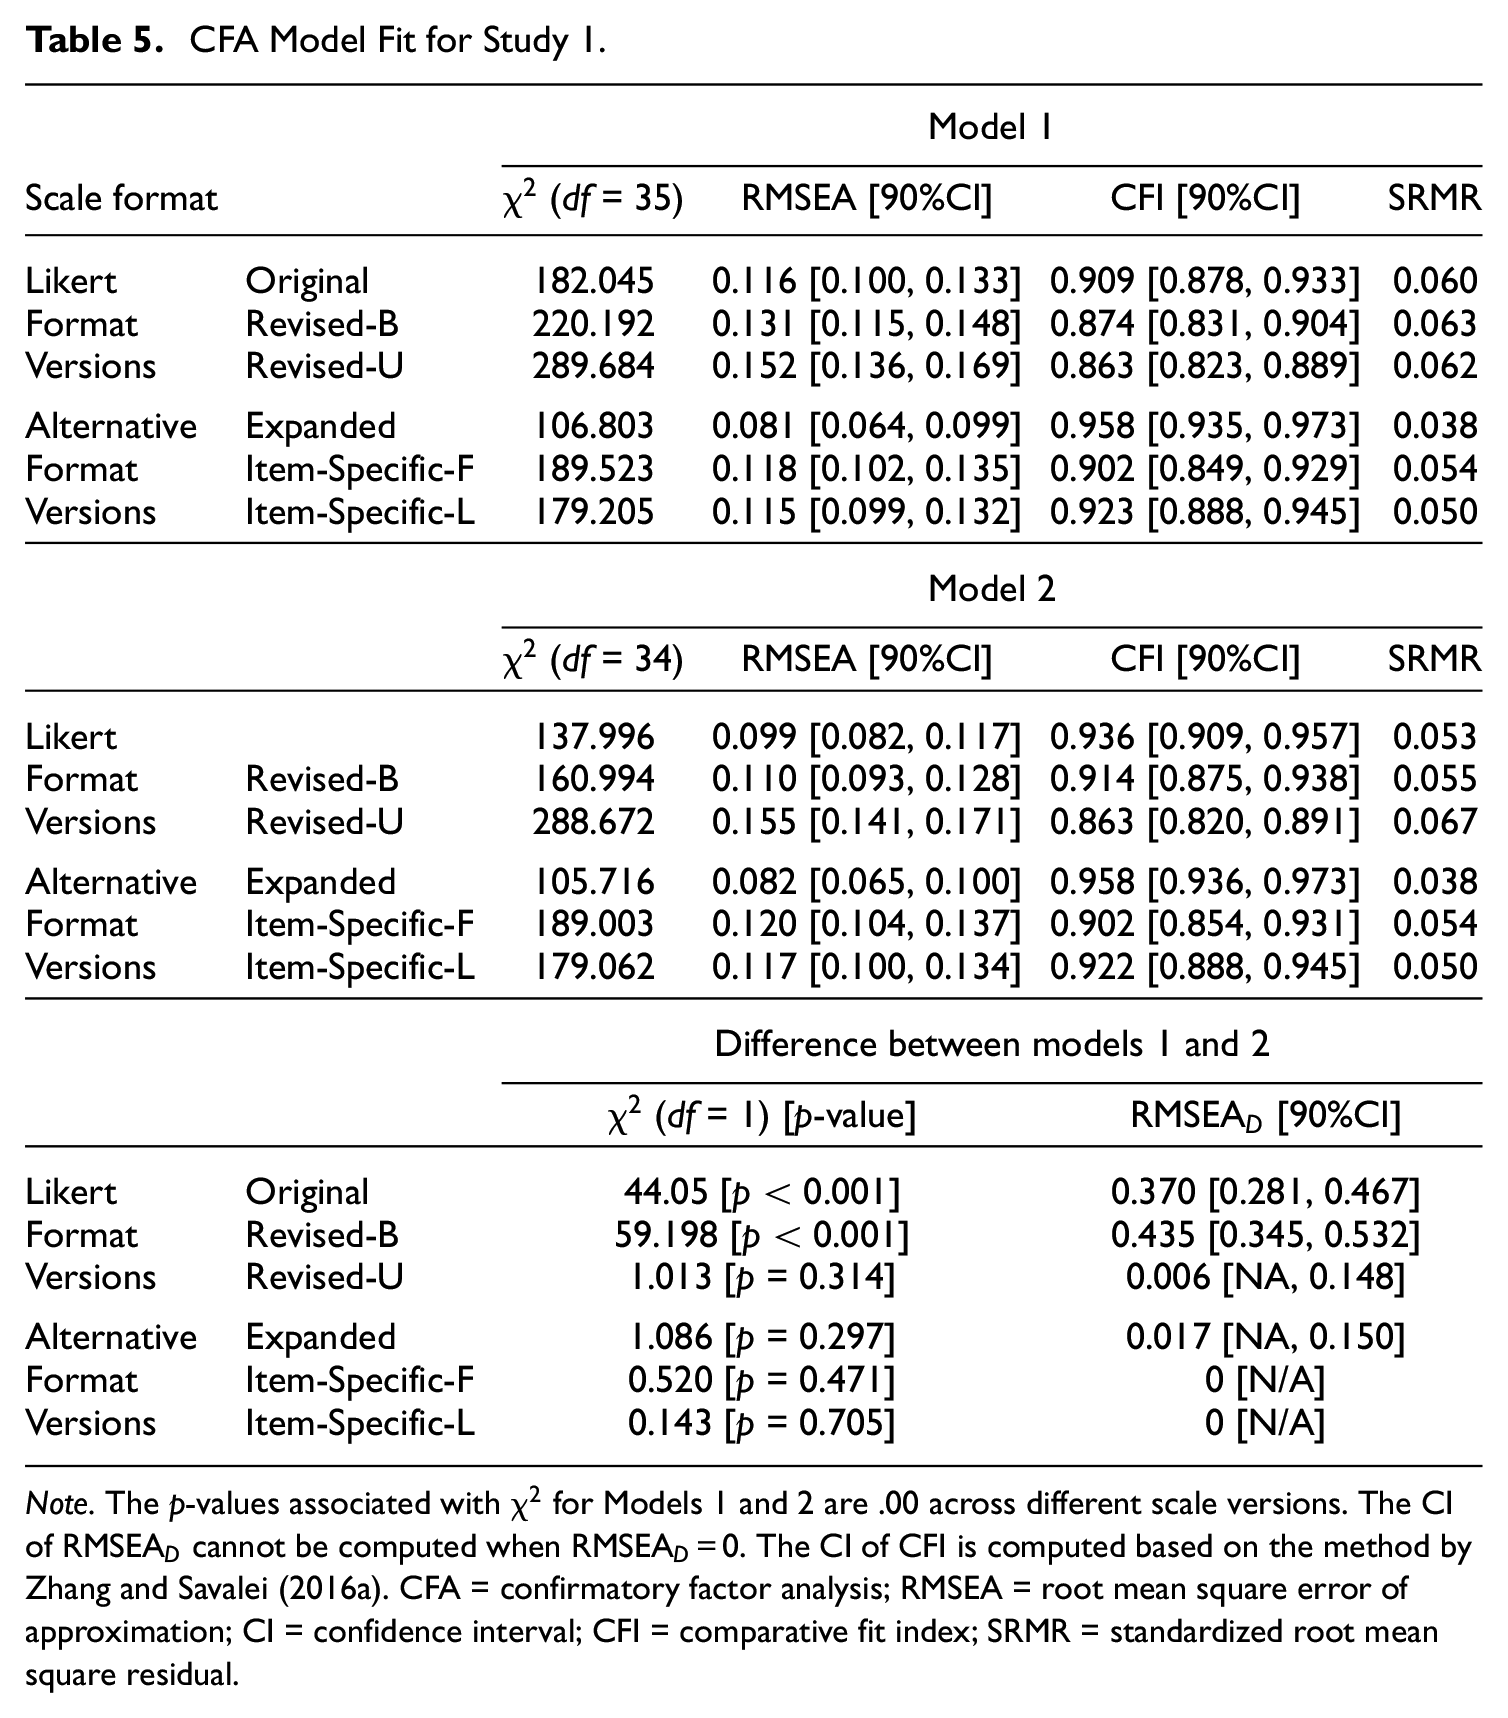
Table 5 shows the fit indices for Models 1 and 2 across all scale versions. Consistent with our hypotheses, Model 1 had a better fit to the three alternative format versions than to the Likert versions. The Expanded version resulted in the best fit according the fit indices (see Table 5). The Item-Specific-F and Item-Specific-L versions also resulted in a good fit according to CFI and SRMR. In contrast, the Revised-B and Revised-U Likert versions showed a poor fit according to all fit indices. Interestingly, relative to these Revised-B and Revised-U Likert versions, the Original Likert version showed a slightly better model fit (e.g., CFI is equal to 0.874 and 0.863 for Revised-B and Revised-U, respectively, but equal to 0.909 for Original). These results indicate that some items in the Revised-B and Revised-U versions are not perfectly equivalent to those in the Original version, which is expected as some items in the Revised-B and Revised-U versions were worded quite differently relative to the Original version (see Table 1 in Supplementary Materials). Another interesting finding was that the Revised-U Likert version had a slightly worse one-factor model fit than the Revised-B Likert version. This pattern of results is consistent with our EFA results which showed the Revised-U version tended to be bi-dimensional; however, as mentioned previously, these results are inconsistent with the previous research findings (e.g., Greenberger et al., 2003; Zhang et al., 2016) that the unbalanced Likert scale generally tends to follow the one-factor model more than the balanced Likert scale.
CFA Model Fit for Study 1.
Note. The p-values associated with
Table 4 also shows the comparison of fit between Model 1 and Model 2. For the Original and Revised-B Likert versions, Model 2 was preferred to Model 1. Specifically, the
Modification Indices and Alternative Model
Although the patterns of the CFA results were generally consistent with our hypothesis, one problem was that the one-factor model (i.e., Model 1) did not fit the data from any of the scale versions by the RMSEA. Therefore, we examined the top five modification indices of Model 1 to explore a potential alternative model. Table 6 shows the top five recommended modifications across the scale versions. Although some recommended modification varied across the scale conditions, possibly due to random sampling fluctuations, other modifications appeared across all scale versions. One recommended modification that appeared across the scale versions was the correlated residual between Items 8 and 10, which is the top recommended modification in five of the six versions. This is consistent with the EFAs results, which revealed that Items 8 and 10 often loaded on a separate factor due to the similarity in the item content.
Top Five Modification Indices in Ascending Order for Model 1 in Study 1.
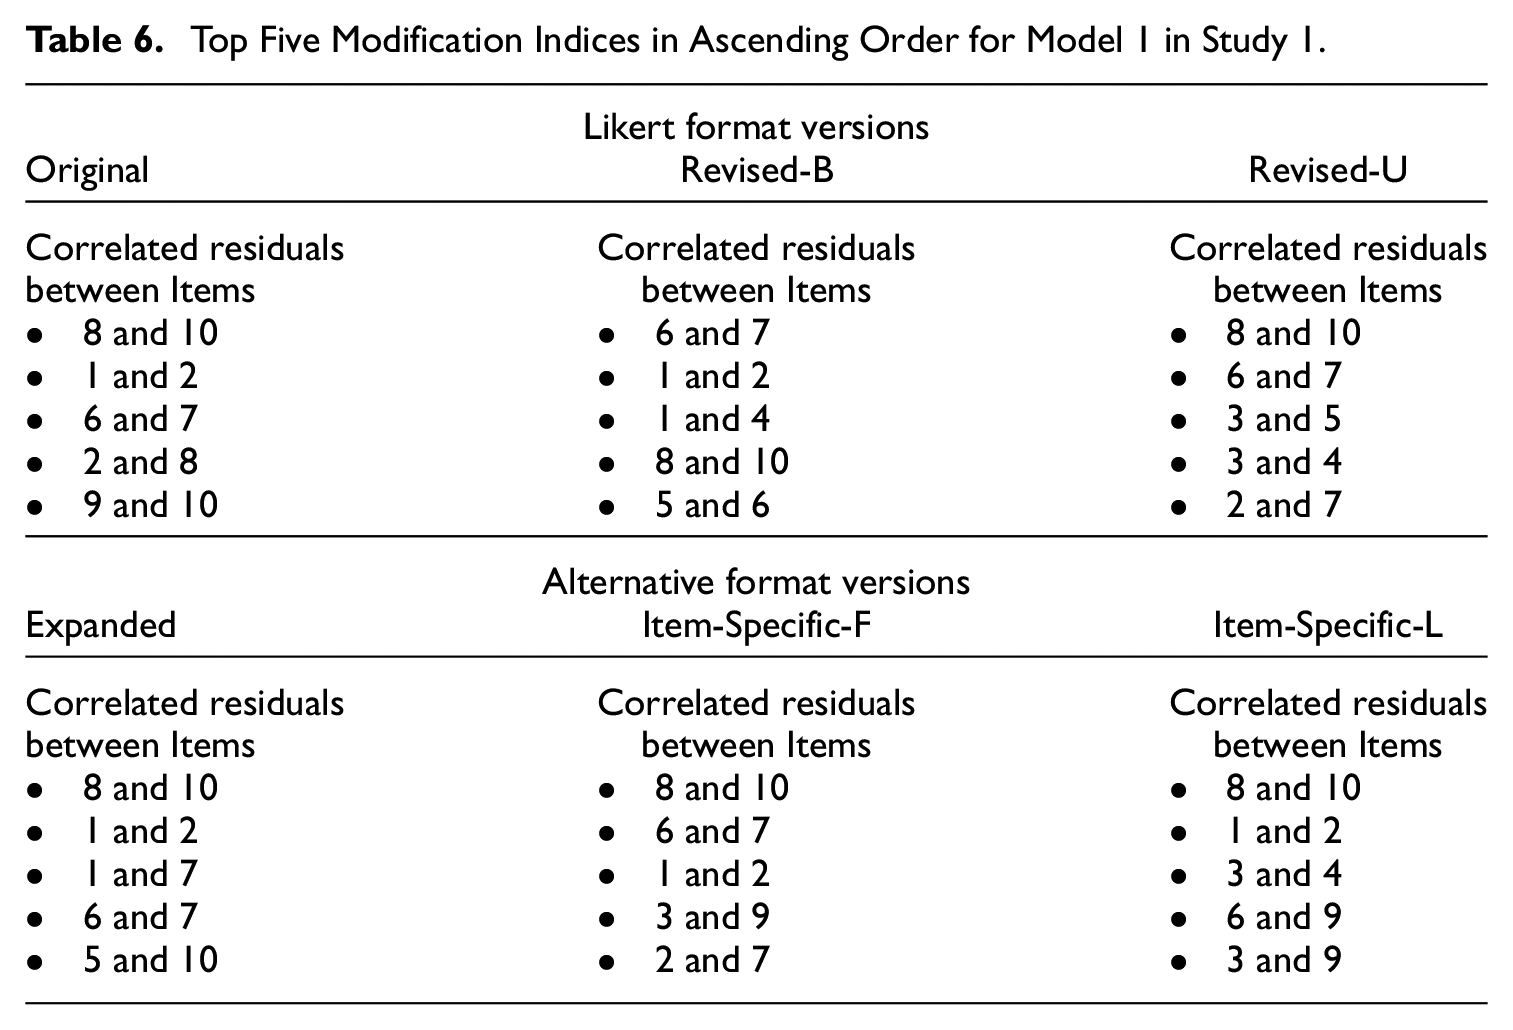
Based on the results of the modification indices, we proposed Model 1A, where we added a correlated residual between Items 8 and 10 to Model 1 (see Supplementary Materials Figure 1 for the model diagram). The fit of Model 1A is provided in Table 7; the standardized loadings and correlated residuals are provided in Supplementary Materials. Across all scale versions, the standardized loadings for Model 1A were high and very similar to those for Model 1, and the size of the correlated residual between Items 8 and 10 was moderate, ranging from .30 to .45 (see Table 17 in Supplementary Materials). Across all scale versions, the fit of Model 1A was much better than the fit of Model 1. For the Expanded version, Model 1A achieved a good fit according to all fit indices (see Table 7). Interestingly, for the Original and Revised-B Likert versions, the fit of Model 1A was comparable to that of Model 2 (see Tables 5 and 7), indicating that the improvement in the fit of Model 2 may be mainly driven by the correlation between Items 8 and 10. Model 1A will be tested on a new dataset in Study 2.
Fit of Model 1A in Study 1.
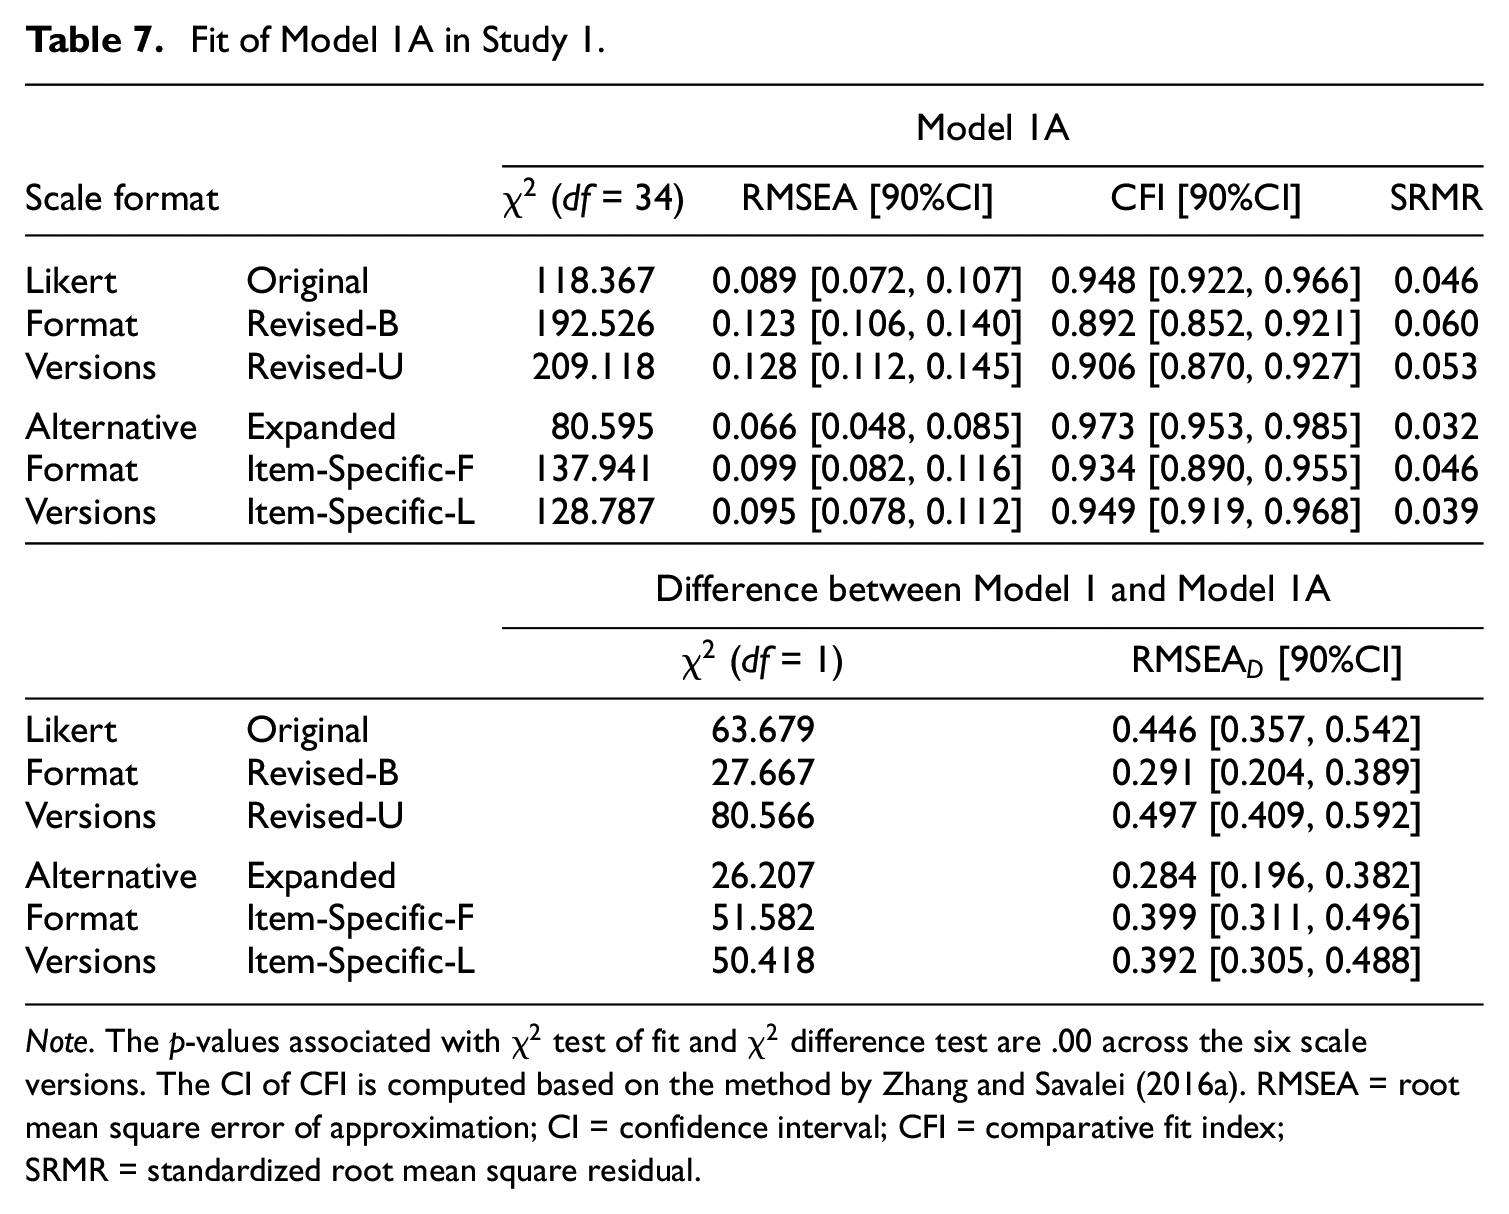
Note. The p-values associated with
Validity Analyses
Table 8 shows the results of the validity analyses. The top panel of Table 7 shows the values for the correlation between the NPI and RSES as well as the correlation between self- and peer-ratings on the RSES. The bottom panel of Table 8 shows the results for comparing the correlations between Revised-B Likert and each of the alternative format versions.
Validity Analyses for Study 1.
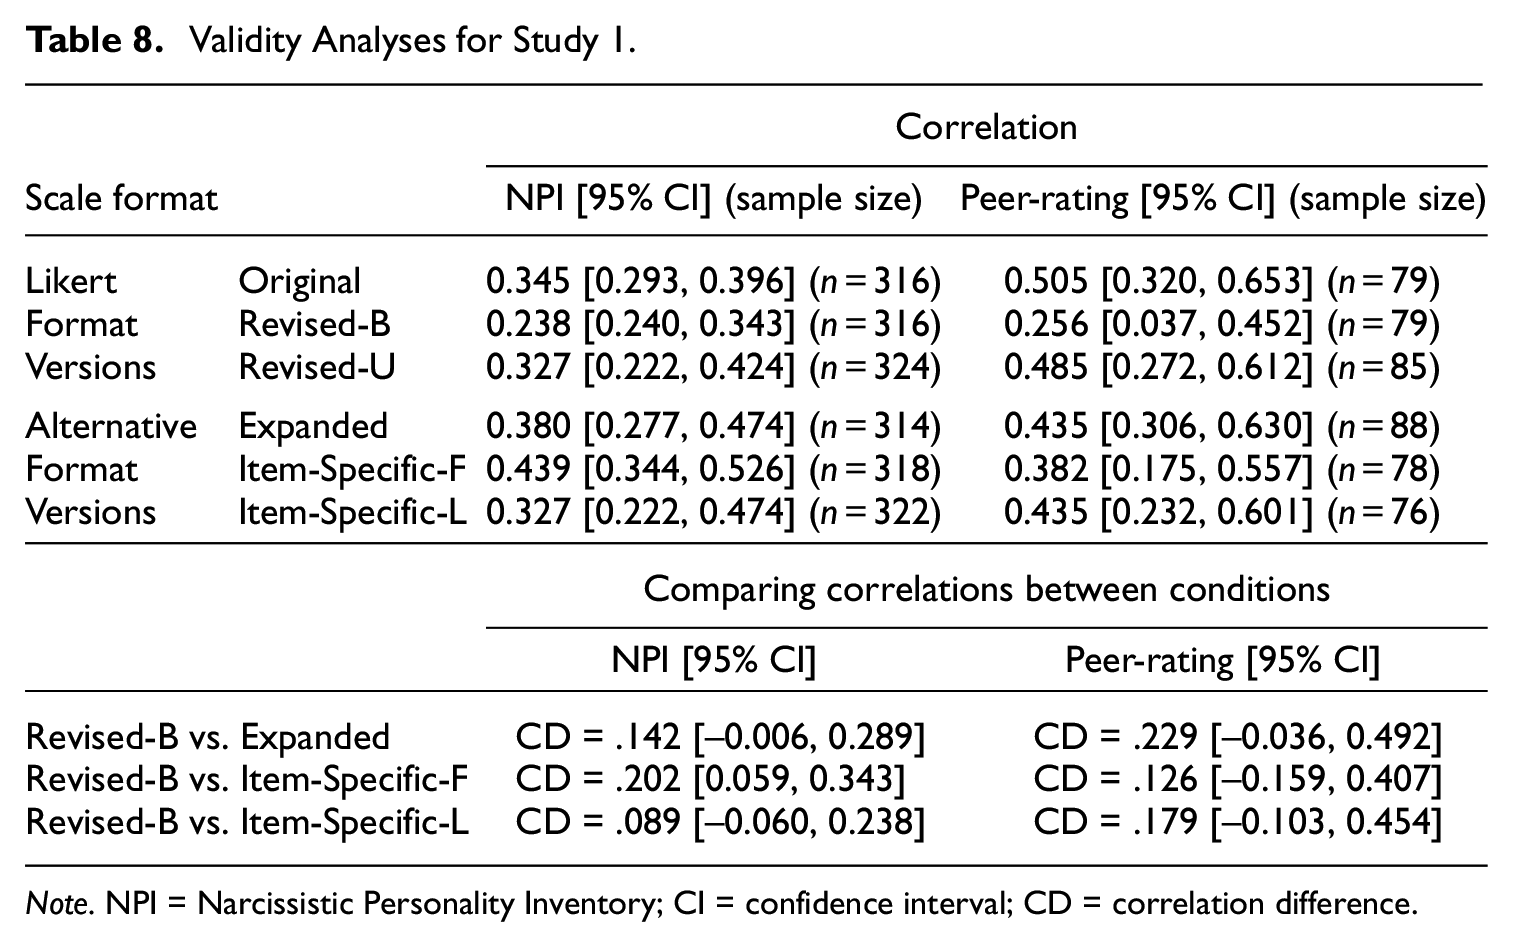
Note. NPI = Narcissistic Personality Inventory; CI = confidence interval; CD = correlation difference.
Across the scale versions, NPI and peer-rating’s correlations with the self-rating of RSES were generally moderate, with values ranging from .24 to .45. Relative to the Revised-B Likert version, the Revised-U Likert and the three alternative format versions had slightly higher validity correlations; however, the differences between conditions were generally not significant except for the difference between the Revised-B and Item-Specific-F versions. Therefore, overall, the different versions showed similar validity correlations. This result did not completely match our expectation that the alternative formats may result in higher correlations than the Likert format due to a possible reduction in measurement error.
Response Inconsistency
Table 9 shows the results from the response inconsistency analyses based on Kam (2020). The upper panel of Table 9 shows the values for two response inconsistency indices; the bottom panel shows the selected results for comparing the indices between conditions (see Table 20 in the Supplementary Materials for complete results).
Response Inconsistency for Study 1.
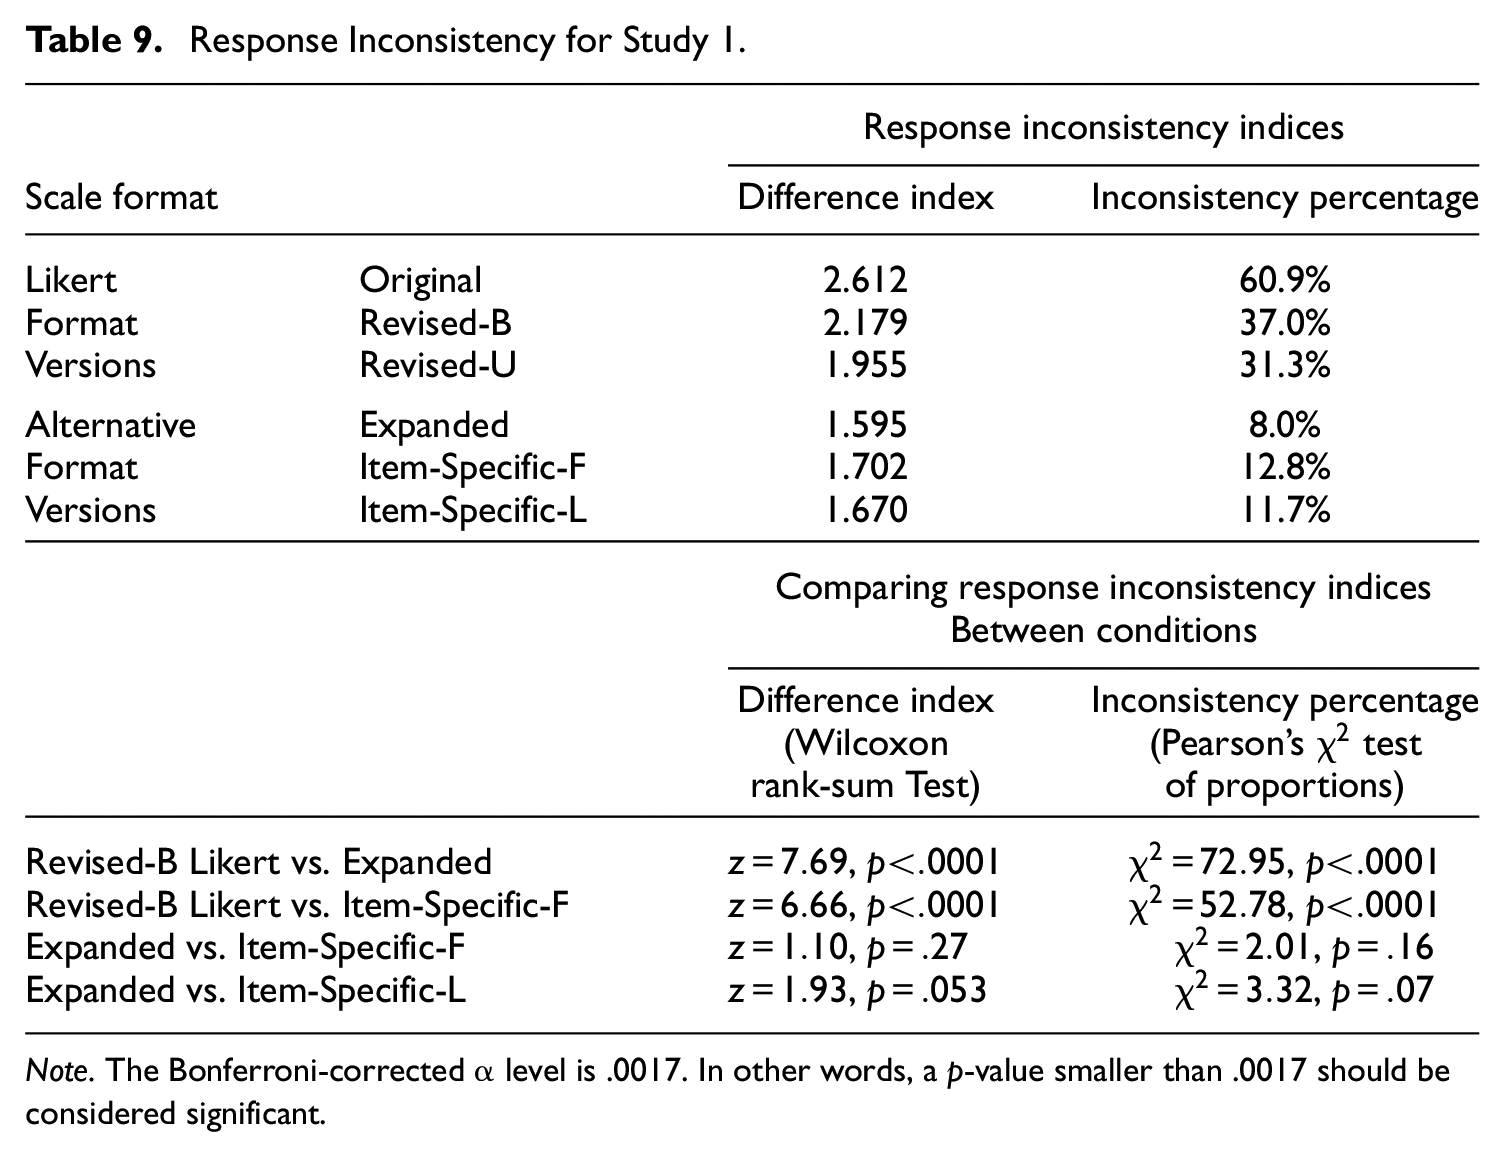
Note. The Bonferroni-corrected α level is .0017. In other words, a p-value smaller than .0017 should be considered significant.
Overall, consistent with our hypothesis, the three alternative format versions had less response inconsistency than the Likert format versions. Particularly, the inconsistency percentages for the Likert format versions ranged from 31% to 61%; that is, 31% to 61% of the participants indicated high self-esteem in some items but indicated low self-esteem in other items. However, for the alternative format versions, the inconsistency percentages ranged from 8% to 12%. The Expanded version had the lowest response inconsistency with an inconsistency percentage of 8%. The differences in response inconsistency between the Revised-B Likert and each of the alternative format versions were highly significant, whereas the differences among the alternative format versions were not significant (see Table 9 and Supplementary Materials).
In summary, the results of Study 1 were generally consistent with our hypotheses. The RSES in the alternative formats had better factor structures and less response inconsistency when compared with the RSES in the Likert formats. The results of validity analyses did not fully support our hypotheses; that is, the RSES in the alternative formats did not have higher convergent validity correlations than the RSES in the Likert formats although they were comparable in size.
Study 2
Design, Participants, and Analytic Method
Data for Study 2 were collected as part of the online pre-screening questionnaire offered through UBC Psychology’s HSP. 6 Participating in the pre-screening questionnaire in the HSP system allowed us to collect data from all students in the HSP and thus replicate the main findings of Study 1 with a very large sample. However, the HSP system did not allow us to randomize the conditions nor to include more than 20 items during each school term. As a result of these limitations, we collected data over three consecutive school terms. For each school term, participants completed one alternative format version at the beginning of the pre-screening study and one Likert format version at the end of the study. 7 We pre-registered this study design prior to data collection. 8 In the first term, the Item-Specific-F version was at the beginning of the study and the Original Likert version at the end. In the second term, the Expanded version was at the beginning and the Revised-B Likert version at the end. In the final term, the Item-Specific-L version was at the beginning and the Revised-U Likert version at the end. A total of 6,332 undergraduate students participated in Study 2 over the three terms (1,018, 3,996, and 1,318 for each term, respectively). Of all participants, 73.7% were female and 26.3% male. The median age was 20 years old. There were 38.7% from East Asian background, 22.1% from European background, and 39.2% others.
The analysis in Study 2 was largely the same as in Study 1, with three main differences. First, in Study 2, we tested Model 1A, which was developed using Model 1’s modification indices in Study 1. Second, because the pre-screening study did not allow us to include any criterion measures or peer-rating component, the validity analyses were not included in Study 2. Finally, because Study 2 had both within- and between-groups design, the significance tests for comparing response inconsistency across conditions were conducted using either the paired or unpaired version of the tests. Specifically, for between-group comparisons, we used the Pearson’s
Results
Descriptive Statistics
The descriptive statistics of Study 2 were very similar to those of Study 1 (see Supplementary Materials). Similar to Study 1, the average item means in Study 2 were similar across the scale versions, ranging from 3.32 to 3.62; on the other hand, the average item variances of the alternative format versions (ranging from 0.76 to 1.02) were slightly smaller than those of the Likert versions (ranging from 1.12 to 1.25). The one-factor model-based reliability were again similar across the scale versions. Specifically, the reliability coefficients were 0.907, 0.910, 0.911, 0.927, 0.921, and 0.943 for the Original, Revised-B, Revised-U, Expanded, Item-Specific-L, and Item-Specific-F versions, respectively.
Factor Analyses and Response Inconsistency Analyses
Parallel analyses and EFAs results for Study 2 are provided in Supplementary Materials. The results were highly similar to those for Study 1. Parallel analyses again suggested that the alternative format versions had one factor, but the Likert format versions had two factors (see Figure 2 in the Supplementary Materials). When two factors were extracted, the EFA loadings of the Original and Revised-B Likert versions were more based on the item direction than the Revised-U Likert and all three alternative format versions. Specifically, for the Revised-B Likert version, PW items only loaded highly on Factor 1 (i.e., no large cross-loadings), whereas NW items only loaded highly on Factor 2. In addition, same as in Study 1, for the Expanded version, all items loaded on Factor 1, indicating a clear one-factor structure. However, for the Revised-U Likert, Item-Specific-F, and Item-Specific-L versions, Items 8 and 10 consistently loaded very highly on Factor 2, indicating that the content of these two items was more similar to each other than to other items.
Table 10 shows the CFA results for Study 2. The results were again similar to those of Study 1. For Model 1, the alternative format versions generally resulted in a better fit than the Likert format versions. Comparing Model 2 with Model 1, for the Original and Revised-B Likert versions, Model 2 fit was considerably better than Model 1 fit, however, for the Revised-U Likert and all three alternative format versions, Model 1 fit was very similar to Model 2 fit. One difference between Studies 1 and 2 was that the Revised-B Likert version resulted in a considerably better fit for Model 1 in Study 2 than in Study 1.
CFA Models for Study 2.
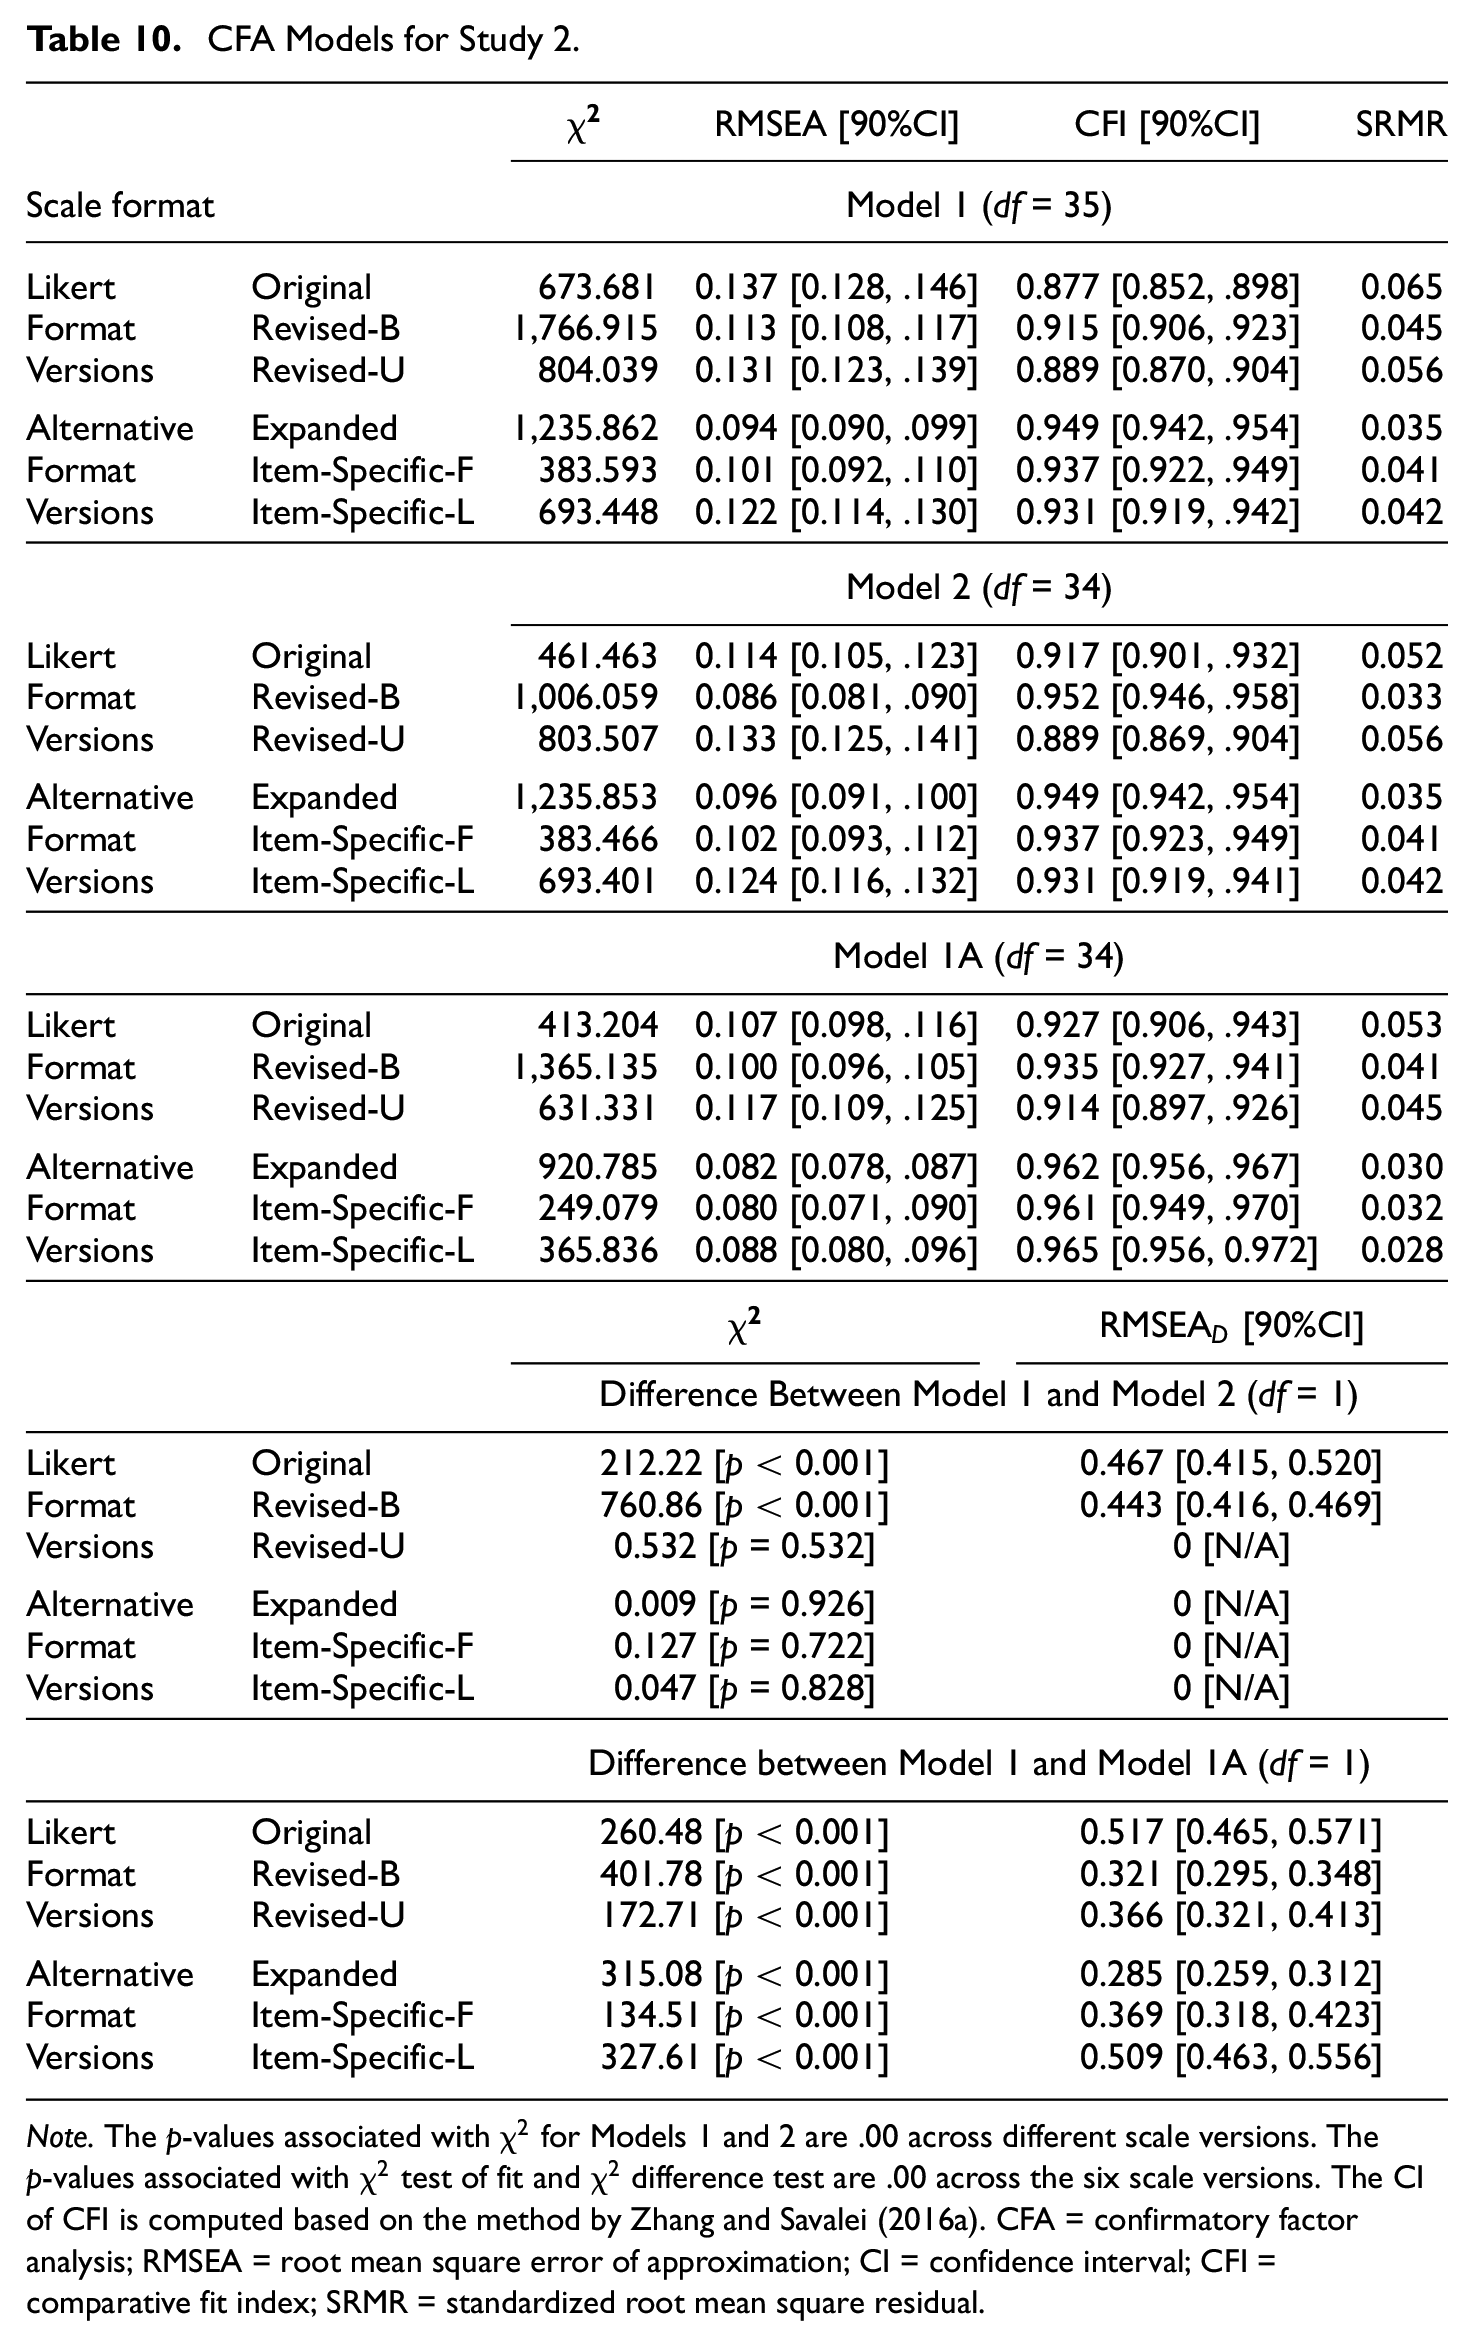
Note. The p-values associated with
In terms of standardized factor loadings and factor correlations, the patterns in Study 2 were very similar to those in Study 1 (see Tables 29 and 30 in Supplementary Materials). Similar to Study 1, the factor loadings for Model 1 were generally high, with averages ranging from 0.70 to 0.79 across the scale versions. For Model 2, similar to Study 1, the factor loadings for Factor 1 (associated with PW items) were generally higher than for Factor 2. The factor correlation was higher for the Revised-U Likert and the three alternative format versions than for the Original and Revised-B Likert versions.
For Model 1A (i.e., a one-factor model with a correlated residual between Items 8 and 10), the patterns of results found in Study 1 were replicated in Study 2. Model 1A had a much better fit relative to Model 1 across all six versions, especially the three alternative format versions. For the Original and Revised-B Likert versions, the fit of Model 1A was also very good and was similar to the fit of Model 2.
Finally, the results of the response inconsistency analyses were also very similar across the two studies. Table 11 shows the response inconsistency indices for Study 2. Similar to Study 1, the response inconsistency for the alternative format versions was significantly lower than that for the Likert versions. Interestingly, both the estimates of the two response inconsistency indices and the results of the significance tests were very similar across Studies 1 and 2 (see Tables 9 and 11).
Response Inconsistency for Study 2.
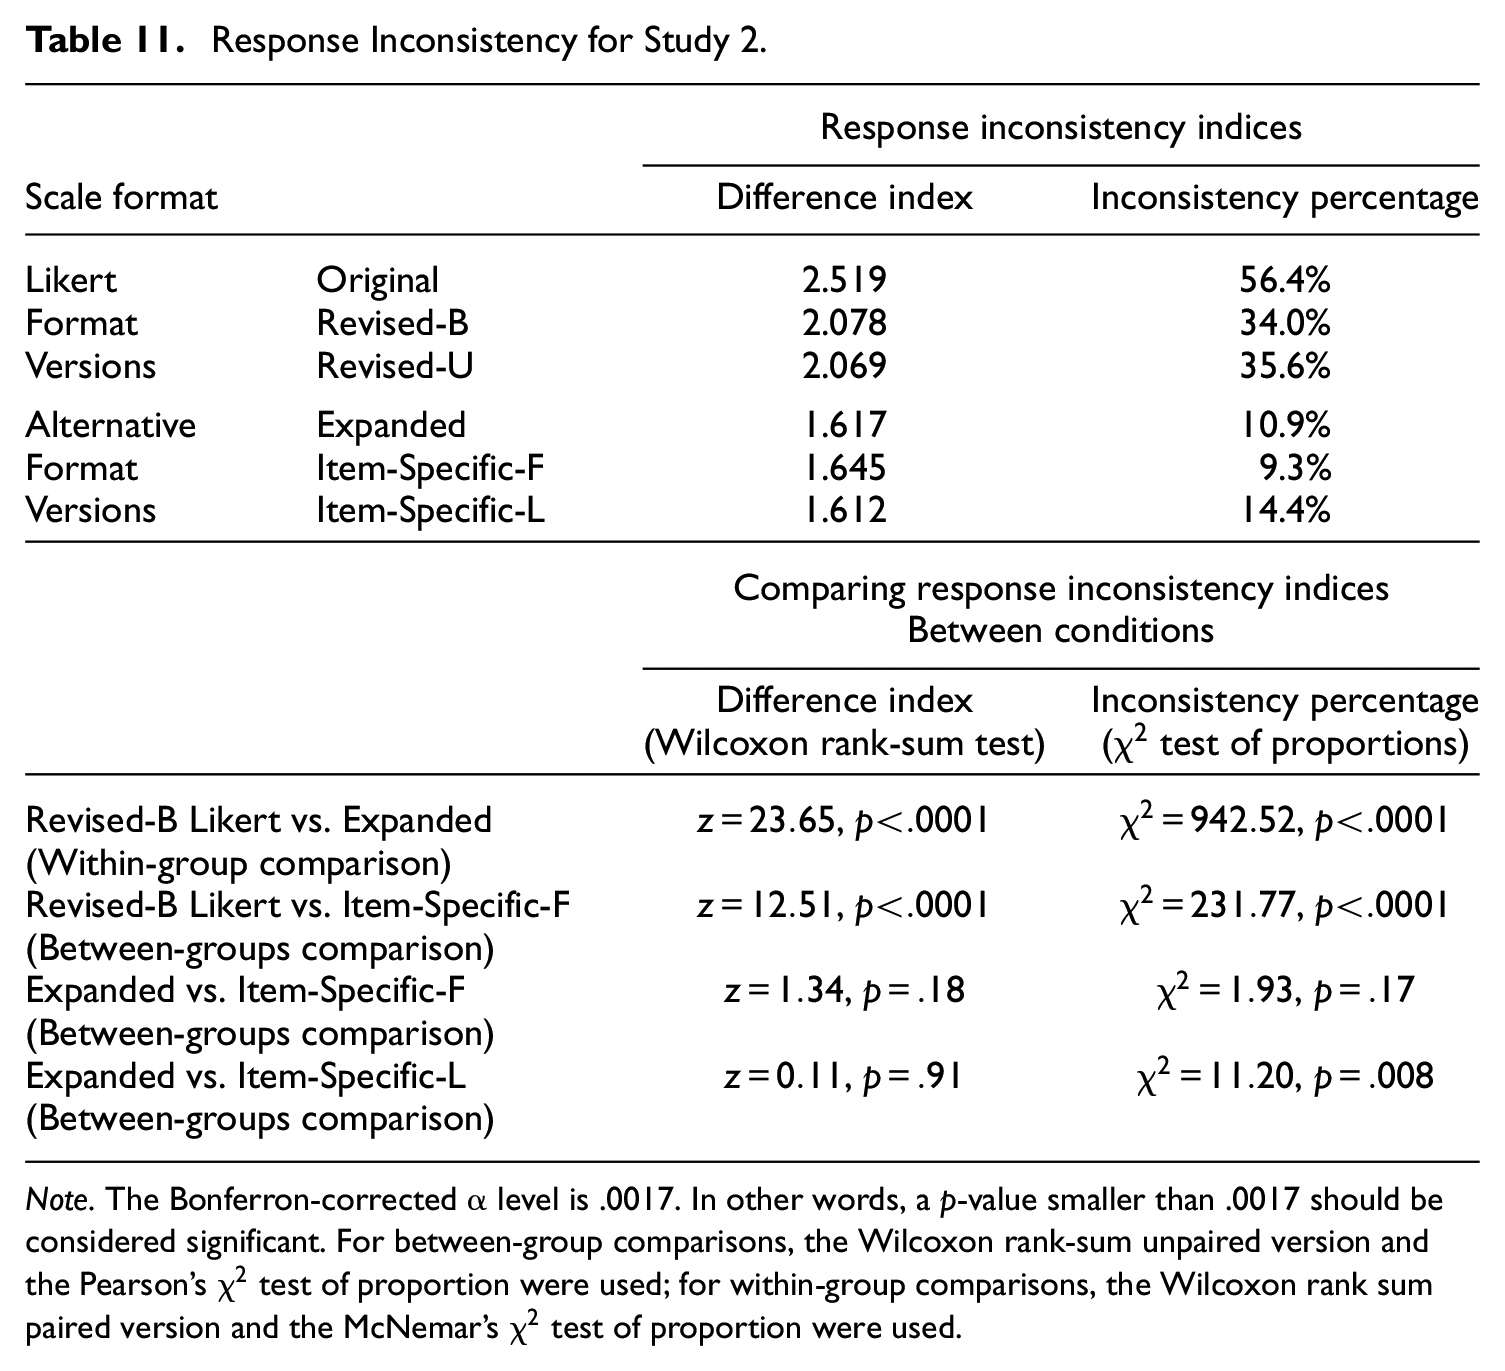
Note. The Bonferron-corrected α level is .0017. In other words, a p-value smaller than .0017 should be considered significant. For between-group comparisons, the Wilcoxon rank-sum unpaired version and the Pearson’s
In conclusion, Study 2 replicated the results of Study 1. Both EFAs and CFAs showed that the alternative formats generally yielded lower dimensionality than the Likert format. Model 1A which was developed in Study 1 also achieved a good fit in Study 2 across all scale versions, further demonstrating the factor validity of this model. In terms of response inconsistency, the alternative formats had much lower response inconsistency than the Likert format.
Discussion
In this research, we aimed to investigate whether any of the alternative scale formats proposed in the literature can improve the psychometric properties of a scale by alleviating the problems related to the balanced Likert format with disagree–agree options. In addition, we wanted to compare alternative formats with the unbalanced Likert format, which has also been proposed as a solution to some of the problems related to the balanced Likert format. We focused on the RSES, which was originally written in the balanced Likert format. We converted the RSES to three alternative format versions (Expanded, Item-Specific-F, and Item-Specific-L) and to two Revised Likert versions (Revised-B and Revised-U versions). The alternative formats and the Revised Likert formats shared consistent item wording, thus removing any confounding due to item wording. Across these different format versions of the RSES, we compared their factor structure, validity correlations, and response inconsistency.
Factor Structure Across Formats
We conducted parallel analyses, EFAs, and CFAs to compare the factor structure of the RSES across the scale versions. The results from these analyses (in Studies 1 and 2) showed that the alternative formats had a factor structure more consistent with the theoretical one-factor model of the RSES, whereas the balanced Likert versions, especially the Revised-B version, had factor structures more consistent with a two-factor model that separates the PW items from the NW items. These results are consistent with our hypothesis that the alternative formats are not affected by the method effect associated with the NW items and thus follow a more theoretically defensible factor model. Out of the three alternative formats, the Expanded format resulted in the best one-factor model fit. As the Expanded format is the alternative format with the most specific and concrete response options, this result is consistent with our hypothesis that the more specific and concrete the response options are, the less confusion and misunderstanding the participants’ experience, leading to a better factor structure.
Although most of our factor analysis results were consistent with our hypotheses, one unexpected finding was that the Revised-U Likert version had a slightly worse one-factor model fit than the Revised-B Likert version. This finding is the opposite of the results of previous studies (e.g., Dueber et al., 2021; Greenberger et al., 2003; Salazar, 2015; Zhang et al., 2016). Particularly, Greenberger et al.’s (2003) study used the RSES in their study and demonstrated that when the original RSES is converted to an unbalanced Likert scale (e.g., all PW items or all NW items), the factor structure becomes unidimensional and consistent with the theoretical factor model. However, our results demonstrated that simply getting rid of NW items in a Likert scale will not always lead to a better factor structure, and using one of the alternative formats is a better and more reliable way of alleviating the problems associated with the factor structure of the Likert format. Last but not least, our results demonstrated that for the RSES in the Likert format, the method effect associated with the NW items is not the only cause for the lack of unidimensionality in the scale. As we will discuss in more detail next, it is possible that the correlated residual between Items 8 and 10 is one of the main causes for the lack of unidimensionality in the RSES.
Finally, we examined a modified model based on the one-factor model, which we developed in Study 1 and verified in Study 2. This modified model, which we call Model 1A, is a one-factor model with a correlated residual between Items 8 and 10. Our results showed that across all Likert and alternative formats, Model 1A had a much better model fit than the one-factor model (Model 1) and a similar fit to the two-factor model separating NW and PW items (Model 2); this may indicate that the improvement in fit of the two-factor structure separating NW items from PW items of the balanced Likert RSES was mainly driven by the correlated residual between the two NW items (Items 8 and 10).
To explain these patterns of results for Model 1A, we note that Items 8 and 10 are both NW items in the original RSES, and the fact that these items have correlated residuals in the alternative formats, which do not involve different item directions, means that Item 8 and 10 also share similar item content irrespective of the item direction. A closer look at the item content reveals that both Items 8 and 10 are about the frequency of feeling useless or no good about oneself. The observation that Items 8 and 10 have similar item content beyond the wording direction is consistent with Tafarodi and Milne’s (2002) past research on the RSES. According to Tafarodi and Milne (2002), the global self-esteem can be further broken down into two aspects: self-liking and self-competency. Self-liking is associated with feeling happy about and accepting oneself, whereas self-competency is associated with evaluating one’s own abilities. Tafarodi and Milne (2002) pointed out that some items (two NW and three PW items) in the RSES are more related to self-liking, whereas other items (three NW and two PW items) are related to the self-competence. Notably, Items 8 and 10 are both related to the self-liking aspect of self-esteem, therefore making them more correlated with each other beyond item wording.
As noted in the introduction, there has been a long debate regarding whether the two factors of the RSES emerging from the EFAs are substantive factors or are due to method effects of the NW items (e.g., Carmines & Zeller, 1979; Lindwall et al., 2012). Our findings suggest that both sides of the debate may be true to some extent. However, the substantive factors are probably not based on the item direction (i.e., positive and negative self-esteem), but based on the self-liking and self-competence aspects of self-esteem. For items such as Items 8 and 10 that share both item direction and item content in the Likert format, it is hard to tease apart the part of the correlation due item content from the part due to item direction. However, any of the alternative formats does not involve item direction, making it easier to identify correlated residuals based on item content.
Validity and Response Inconsistency Across Formats
Our results showed that the Likert format and the three alternative formats have similar convergent validity as accessed through how much the participants’ self-reported self-esteem was correlated with the peer-ratings of their self-esteem and with NPI, which is theoretically related to self-esteem (e.g., Brown & Zeigler-Hill, 2004; Brummelman et al., 2016; Campbell et al., 2002). The three alternative format versions had slightly higher correlations than the Revised-B Likert version but the differences between the correlations were not significant. Therefore, this result did not completely match with our expectation that the alternative formats would result in stronger self-other agreement correlations and convergent validity with the NPI.
There are several explanations for these findings. First, for the peer-rating data, the sample size for each scale version was quite small (around 80 participants for each condition). Based on our post hoc power analyses, when there is a difference of 0.2 between two population correlations, we need at least a sample size of
For response inconsistency analyses, our results showed that all three alternative formats have significantly less response inconsistency as measured by the two indices proposed by Kam (2020), replicating the results found in Kam (2020). These results are consistent with our hypothesis that the alternative format reduces the ambiguity of the Likert items, making participants pay more attention to the differences between the response options.
Limitations and Future Studies
There are several limitations and future directions to our study. First, as mentioned previously, the self-peer correlations were based on a relatively small sample size, providing only limited ability to access the validity of these reports. Future research should conduct the peer-rating part of the study with a larger sample size. Second, our study only involves one psychological scale, the RSES. Because the RSES is a relatively short scale with only 10 items, we assume that the RSES in the Expanded format should not have taken participants too much time and effort to complete, although this format has the most detailed response options. Unfortunately, we cannot test this assumption because we did not track the amount of time each participant took to complete the RSES. It is possible that for longer psychological scales in the Expanded format, participants would take significantly longer time to complete them and experience more fatigue as a result. Therefore, future studies will investigate longer psychological scales and set up specific timers in the survey in order to compare the amount of time participants take to complete each scale across different alternative formats. Perhaps, there is a point at which the cost of the Expanded format having very detailed response options (e.g., taking too much time to complete) will outweigh its benefits; in such cases, perhaps, the Item-Specific formats may be more suitable. Third, our quantitative analyses of the different scale formats with alternative formats do not offer us any insight regarding why participants respond to items differently across formats and whether it is the specificity of the options in the alternative formats that help participants understand the items better. To gain such insight, a mixed-methods approach involving both qualitative and quantitative analyses needs to be employed. Several previous studies have already used qualitative and quantitative analyses to gain more insight as to why participants respond to scale items in a certain way. For example, Cabooter et al. (2016) used the think-aloud approach to examine how participants interpret different wordings of response options; Robie et al. (2022) used a number of indices and questionnaire items to measure participants’ careless responding and their reactions to Likert items with different response option orders. Using these existing methods, we plan to conduct a follow-up study that examines participants’ interpretations of the items across different scale formats. Last but not least, our studies have revealed a possible confound of item direction and item content among items in the original Likert RSES. Although researchers such as Tafarodi and Milne (2002) have suggested that the RSES can be theoretically broken down into self-liking and self-competence factors, this issue has largely been ignored in the literature on the factor structure of the RSES, which has largely been focused on the two-factor structure based on the item direction and the method effects created by the NW items. Future studies should re-visit Tafarodi and Milne’s (2002) research and investigate the factor structure of the RSES in light of Tafarodi and Milne’s (2002) conceptualization of the self-esteem.
In summary, our study is one of the first to provide horizontal comparisons of several Likert and alternative formats. We found that for the RSES, the three alternative formats generally yielded better psychometric properties (e.g., better factor structure and less response inconsistency) than the Likert format. Out of the three alternative formats, the Expanded format achieved the best results. Therefore, based on our promising findings, we recommend researchers consider using the Expanded format especially when creating short psychological scales like the RSES.
Supplemental Material
sj-pdf-1-epm-10.1177_00131644221111402 – Supplemental material for Comparing the Psychometric Properties of a Scale Across Three Likert and Three Alternative Formats: An Application to the Rosenberg Self-Esteem Scale
Supplemental material, sj-pdf-1-epm-10.1177_00131644221111402 for Comparing the Psychometric Properties of a Scale Across Three Likert and Three Alternative Formats: An Application to the Rosenberg Self-Esteem Scale by Xijuan Zhang, Linnan Zhou and Victoria Savalei in Educational and Psychological Measurement
Footnotes
Declaration of Conflicting Interests
The authors declared no potential conflicts of interest with respect to the research, authorship, and/or publication of this article.
Funding
The author(s) disclosed receipt of the following financial support for the research, authorship, and/or publication of this article: The authors have received financial support from Social Sciences and Humanities Research Council of Canada (SSHRC) Insight Grant: 435-2019-0098.
Supplemental Material
Supplemental material for this article is available online.
Notes
References
Supplementary Material
Please find the following supplemental material available below.
For Open Access articles published under a Creative Commons License, all supplemental material carries the same license as the article it is associated with.
For non-Open Access articles published, all supplemental material carries a non-exclusive license, and permission requests for re-use of supplemental material or any part of supplemental material shall be sent directly to the copyright owner as specified in the copyright notice associated with the article.