
Abstract
Social-emotional competencies (SECs) stand to benefit children in a myriad of ways. However, school-based social-emotional learning (SEL) programs are often ineffective in low-income, urban school districts, calling into question whether they adequately address student needs. The present study investigated whether and how one source of stress more common in these communities—school mobility—impacted SEL for predominantly African American students living in a low-income, urban district. Using a series of multi-level growth models, we found that school mobility was only detrimental (on average) under certain circumstances—for example, when students moved to schools with worse relative levels of school safety. These findings suggest that SEL programs should address school climate and safety in addition to individual-level competencies.
In recent years, the United States has seen a proliferation of social-emotional learning (SEL) programs in urban, low-income communities. Research touting both individual and collective benefits has driven this increasing emphasis on SEL, defined as “the processes through which children and adults acquire and effectively apply the knowledge, attitudes, and skills necessary to manage their emotions, set and achieve positive goals, feel and show empathy for others, establish and maintain positive relationships, and make responsible decisions” (Weissberg & Cascarino, 2013). Known as social-emotional competencies (Berg et al., 2017); the skills, knowledge, and dispositions learned through the process of SEL are malleable (Corcoran et al., 2018; Durlak et al., 2011; Taylor et al., 2017), and benefit socio-economically disadvantaged students in terms of academic, psychological, and longer-term life outcomes (e.g., Elias & Haynes, 2008; Mahoney et al., 2019; Taylor et al., 2017; Valiente et al., 2011). Through SEL, children become more engaged and connected to their learning environment (Yang et al., 2018), which is associated with increased rates of high school graduation and decreased rates of school dropout (Archambault et al., 2009; Wang & Fredricks, 2014). SEL also teaches children how to be happy, healthy, and productive members of society, as social-emotional competencies (SECs) are increasingly viewed as essential in this 21st-century workforce (Heckman & Kautz, 2012).
A multitude of “out of the box” school-based SEL programs are circulating among K-12 districts across the nation (see Collaborative for Academic, Social and Emotional Learning, 2013, 2015). Many of these programs attempt to teach SECs through classroom-based, teacher-facilitated lesson plans that involve a combination of lectures, videos, and group activities (Domitrovich et al., 2017). Although SEL programs have been found to be similarly effective for children across ethnicity and poverty levels (Durlak et al., 2011), a meta-analysis found that over half of school-based SEL programs were ineffective in urban and low-income contexts compared with those implemented in suburban, wealthier communities (Farahmand et al., 2011), suggesting that in many instances, children’s needs are not being adequately addressed. It is our imperative as a field to better understand how SEL occurs within low-income, urban contexts to prevent future programs from wasting limited financial resources.
The impetus for the present study is an evaluation we conducted on a SEL program implemented in a predominantly African American, socioeconomically disadvantaged urban community in the southern United States (Gonzalez et al., 2020). Our quantitative analysis indicated that the program had little impact on reducing violence or increasing student social-emotional competencies, school safety, or climate. Results of our qualitative analyses suggested student stress and trauma served as barriers to program success (Gonzalez et al., 2020). Our hope for the present study was to understand how one source of stress more prevalent among low SES students of color—school mobility (Lleras & McKillip, 2017; U.S. Government Accountability Office, 1994)—might have impacted SEL developmental trajectories. Defining school mobility as non-promotional school changes (Rumberger, 2015); and SEL trajectories as the competency levels students start out with as well as how quickly and in what direction the competencies change over time; we examine whether, how, for whom, and under what circumstances school mobility affects SEL trajectories for low-income, primarily African American students living in a southern city in the United States. If SEL programs are going to be effective, research contributing to an understanding of how SECs develop in relation to contextual factors in low-income, urban school contexts is badly needed (Farahmand et al., 2011; Osher, 2017). The research questions are as follows:
Theoretical Framework
Social emotional learning occurs within and through a multiplicity of nested ecological contexts (Bronfenbrenner, 1979), all with the potential to exacerbate or buffer against stress. In low-income, urban communities, supportive social networks found in extended families, religious, and other community organizations (DiMaggio & Garip, 2012) can help protect children from stress and promote positive development. However, children growing up in these communities also must contend with daily stressors linked to intergenerational poverty and institutional, structural, and interpersonal forms of racism (Katznelson, 2006; Massey, 2007; Oliver & Shapiro, 1995; Pager & Shepherd, 2008; Reardon & Bischoff, 2011; Rothstein, 2014). Examples of common daily stressors include exposure to crime and violence, hypervigilant monitoring by police, parent or sibling incarceration, interpersonal conflict, unemployment, and/or food insecurity (Bell & Jenkins, 1994; Conger et al., 1994; Osher, 2017). Unfortunately, students can experience stress and trauma at school as well. Students frequently face anti-Black teacher bias in schools resulting in higher rates of exclusionary discipline for Black students (Amodio & Devine, 2008; Hannon et al., 2013), often for subjective, low-level offenses (Theriot, 2009). Additionally, Black and Latinx students are three times as likely to attend schools with “inadequate physical facilities, and less highly qualified and trained teachers” (Children’s Defense Fund, 2012). Unbuffered, prolonged stress has been shown to interfere with the development of self-regulation skills (Center on the Developing Child at Harvard University, 2016; Jones et al., 2016), which are precursors to other SECs (Jones et al., 2016).
Moving as a Stressor
One major source of stress is the instability of students’ learning environments due to school mobility. According to ecological systems theory, school mobility (non-promotional school change) is an ecological transition (Bronfenbrenner, 1979) that includes not only a shift in the physical environment but a shift in a student’s proximal social environment, bringing changes in behavioral expectations, curricula, and classroom instruction (Kerbow, 1996; Mehana & Reynolds, 2004; National Research Council and Institute of Medicine, 2010; Reynolds et al., 2009). Schlossberg’s (1981) transition theory states that all transitions are stressful, but not all necessarily have a negative impact. Whether transitions lead to personal growth or deterioration depends on whether individuals successfully adapt to their new circumstances (Schlossberg, 1981). According to Schlossberg (1981), adaptation is affected by “the characteristics of the particular transition” including whether the transition was expected or not, gradual or sudden, and permanent or temporary (p. 5). Thus, the characteristics of non-promotional school changes have the potential to bring about more stress than promotional ones. Promotional changes (e.g., being promoted to high school) are expected, routine advancements that connote typical development. Students also usually transition with a convoy of same-grade peers (see Benner, 2011), meaning students often bring supportive peer networks with them to their new school. In contrast, non-promotional changes are often brought about by unexpected circumstances (U.S. Government Accountability Office, 2010) and are therefore jarring and occur in relative isolation.
A second contextual factor thought to influence ease of transition adaptation is the difference in characteristics between pre- and post-transition environments (Schlossberg, 1981). Regardless of the types of schools students move to, or why they are moving, students will generally have fewer and weaker relationships with peers and teachers in their new school, resulting in students having fewer interpersonal resources and less social capital (Benner, 2011, Ream, 2005; Ream & Rumberger, 2008) whereas if students had remained in their same school, they could have benefitted from having stable relationships, which are important for development early in life (Shonkoff & Garner, 2012; Sroufe, 2000). Other characteristics of schools students move to relative to those they leave (e.g., differences in terms of the frequency of bullying or the level of teacher support) could potentially further impact stress, but no research so far has examined the impact of these sorts of school differences on SEL for mobile students.
The United States has one of the highest rates of school mobility in the world (Mehana & Reynolds, 2004; U.S. Government Accountability Office, 2010). According to Princiotta et al. (2006) who followed a nationally representative cohort of kindergarteners until fifth grade, about 42% changed schools once and 24% changed schools twice or more during the study. These rates are even higher for low-income, Black, and Latinx students (Evans et al., 2010; Hanushek et al., 2004; Lleras & McKillip, 2017; U.S. Census Bureau, 2015), likely because students experiencing poverty are more likely to change residences each year (U.S. Census Bureau, 2015), and Black and Latinx students are more likely to live in poverty compared to their White peers (U.S. Census Bureau, 2020). About 20% of people below the poverty line changed residences during 2015 compared with only 12% of the general U.S. population (U.S. Census Bureau, 2015).
School mobility may be particularly stressful for low-income, Black and/or Latinx students because of negative circumstances often surrounding school changes. When low-income, Black and/or Latinx students change schools, it is more likely due to a change in residence compared to White and middle/upper SES students (Lleras & McKillip, 2017; U.S. Government Accountability Office, 1994). Often, these residence changes are prompted by stressful and/or negative events themselves, including job loss, foreclosure, eviction, or changes in family structure (U.S. Government Accountability Office, 2010). Thus, school changes for low-income, Black and/or Latinx students are more likely to be prompted by unwanted external forces than the desire to seek educational opportunities (Sharkey & Sampson, 2010; Swanson & Schneider, 1999), resulting in additional stress and uncertainty. School choice policies do allow students to make “strategic” moves to schools deemed more suitable, however many of these voluntary school changes are still reactive in that students are moving to escape bad environments as opposed to seeking out better ones (Rumberger et al., 1999). When students do make strategic school changes, the most frequent school-related reasons are school safety or discipline and school quality (Kerbow, 1996; U.S. Government Accountability Office, 2010). As more options become available for students in low-income, urban communities, school choice policies have the potential to increase the frequency of these strategic moves. Indeed, districts with school choice policies tend to have higher rates of “voluntary” school changes (i.e., those not prompted by residential moves; de la Torre & Gwynne, 2009; Kerbow, 1996; Kerbow et al., 2003; Pribesh & Downey, 1999; Rumberger et al., 1999).
Contrary to expectations, however, school choice policies can sometimes exacerbate inequities. Parents from traditionally minoritized groups and those with lower levels of education have reported challenges navigating school choice platforms and enrolling their children (Jochim et al., 2014). School choice is also more likely to benefit higher-achieving White students from middle- and upper-class backgrounds than working-class students or students of color (Hanushek et al., 2004; Rumberger et al., 1999; Schwartz et al., 2009). Indeed, Xu et al. (2009) found that overall, mobile Black students were more likely to move to a lower-quality school whereas White and more affluent students were more likely to move to higher-quality schools.
In addition, “voluntary” school changes are not always as they appear. There are reports of charter school administrators coercing students and their families to leave their schools (Waitoller et al., 2019). These reports are especially common in “no-excuses” charter schools and for students with disabilities (Estes, 2004) or repeated behaviors (e.g., wearing revealing clothing) that don’t fit “White” cultural norms (White, 2015). Administrators encourage these families to leave by stating that they would be better served elsewhere, or by telling them that they will be expelled if they don’t voluntarily leave, making enrollment elsewhere fraught (Waitoller et al., 2019; Welner & Howe, 2005).
Even when families make fully voluntary choices to enroll their students in charter schools, student outcomes are not always positive. High expectations for academic performance and behavior can increase stress in “no excuses” school environments (Waitoller et al., 2019), and can lead to further inequities. Indeed, charter schools expel students with disabilities at a higher rate than in public schools, disproportionately affecting Black students (Losen et al., 2016; Rhim et al., 2015; Seider et al., 2013).
Disciplinary policies are not just concerning in charter schools. Across all public schools, African American, Latinx, and Native American students are disproportionately forced to change schools due to exclusionary disciplinary policies (Losen, 2011; Losen & Skiba, 2010). School or district policies often dictate that a student must face expulsion or be transferred to an “alternative school” for committing certain offenses or after being suspended a certain number of times (Kerbow et al., 2003; Rumberger, 2003). Such exclusionary discipline is more commonly forced upon African American, Latinx, and Native American students (Losen, 2011; Losen & Skiba, 2010), and in general, punishments for these subgroups are more severe than those given to White students who commit similar infractions (Losen, 2011).
School closure is also common in urban, low-income school districts, and can occur due to factors such as changes in school zoning, district accountability policies, or aging facilities. Between 2001 and 2010, 197 public schools were closed across six major U.S. cities, including Chicago, Detroit, and Washington, DC (Pew Charitable Trust, 2011). With any move, students must adjust to a new social and academic environment (Coley & Kull, 2016); however, when school moves are precipitated by negative circumstances like school closure, the transition may be more disruptive.
Compounded stress may also arise from the timing of school changes. Although most school changes occur between academic years (e.g., Schwartz et al., 2009), many occur during the year, causing more disruption (Alexander et al., 1996; Grigg, 2012; Hanushek et al., 2004; Schwartz et al., 2009) and therefore stress for students. Welsh et al presume that within-year school changes are more disruptive due to (among other things) “higher adjustment costs” as well as the fact that sudden moves are likely to be driven by unwanted negative forces (2017). Black students and students from low-income families are more likely to change schools during the school year compared with their peers (Hanushek et al., 2004; Schwartz et al., 2009). Therefore, Black students from low-income families are more likely to change schools, are more likely to change schools due to adverse circumstances, and are more likely to change schools during the year relative to their White and middle-class peers.
Consequences of School Mobility
A broad literature base documents a host of negative consequences that appear to stem from school mobility. Mobility has been linked to higher dropout rates, lower academic achievement (Grigg, 2012; National Research Council and Institute of Medicine, 2010; Rumberger, 2003; Stiefel et al., 2010), and an increased incidence of behavioral problems (Lleras & McKillip, 2017; Schmidt et al., 2018). For example, Lleras and McKillip (2017) used the Early Childhood Longitudinal Study-Kindergarten to examine how teacher-rated internalizing (e.g., student appearing lonely or sad) and externalizing behaviors (e.g., disrupts class and gets into fights) changed after students moved to new schools. They found that, after controlling for demographics, achievement, and prior behavior; relative to students who stayed put, students who moved were more likely to disengage from classroom activities, develop internalizing and externalizing behavior issues, and develop literacy skills at a slower pace. These effects were even more pronounced when school changes were coupled with residential changes. The authors theorized that students who moved exhibited slower literacy achievement growth because changing schools negatively influenced their ability to engage positively with their peers and classroom material.
Certain groups of students may be especially susceptible to the negative effects of mobility. Relative to their White peers, school mobility may be even more disadvantageous for Black and Latinx students in terms of emotional and behavioral wellbeing (Perkins, 2017). Detrimental effects of school mobility may be more pronounced for students who move in elementary school compared with middle or high school. For example, Reynolds et al. (2009) found that moves during elementary school were associated with stronger negative effect sizes for reading achievement compared with middle or high school. This pattern was also found when looking at the effect of school mobility on math achievement (Mehana & Reynolds, 2004), and the probability of dropping out of high school, after controlling for prior achievement (Rumberger & Larson, 1998; Swanson & Schneider, 1999; Teachman et al., 1996).
Research on school mobility does not consistently paint a dreary picture, however. Some studies have found school mobility to have null or even positive effects on achievement after controlling for prior achievement and demographics (Alexander et al., 1996; Heinlein & Shinn, 2000), suggesting that negative effects found in prior studies resulted from pre-existing differences between the types of students who change schools frequently and those who do not. According to Gasper et al. (2010), “the families that are most likely to move are also the most disadvantaged and may be characterized by dynamics and processes that are conducive to the development of delinquency and problem behavior in their children.” To address this issue, Gasper et al used the National Longitudinal Survey of Youth to compare levels of delinquency between mobile and non-mobile students and found no effects after controlling for individual and community-level factors that predict delinquency. However, like others (Coley & Kull, 2016; Jelleyman & Spencer, 2008) this study was focused primarily on residential and not school mobility.
Studying SEL within the context of school mobility is important because school environments are known to affect SEL (Loeb et al., 2018). Peer relationships are increasingly important for healthy SEL as students move from late childhood to adolescence, and they are formed primarily within school environments (Goldstein et al., 2002; Rubin et al., 2006). There is tremendous opportunity, therefore, for school leaders and staff to implement policies and programs that help foster SEL for mobile students. Indeed, some research suggests that whether mobility is beneficial or detrimental depends on which schools students move to and from, which is in line with Schlossberg’s theory that differences in pre- and post-transition environments affect the likelihood of successful adaptation. Students have been found to benefit from “strategic” moves like those to a higher-performing school (de la Torre & Gwynne, 2009), and strategic moves may be more common among White students compared with Black and Latinx students (Sharkey & Sampson, 2010; Swanson & Schneider, 1999). Welsh (2017) theorizes that when students move to a higher quality school or to a school with better social resources it can offset the negative effects of mobility in general. No research, to our knowledge, has yet addressed how mobility affects SEL differentially depending on which schools students move to relative to the ones they left, despite calls to address how SEL is influenced by changes in context (e.g., Lleras & McKillip, 2017; Osher, 2017). There is also a lack of consensus regarding which types of school changes are most harmful. Studies investigating whether between or during-year moves are more detrimental for student achievement have been mixed, with some finding within-year moves to be worse (Engec, 2006; Grigg, 2012; Hanushek et al., 2004; Schwartz et al., 2009), and others finding no difference (Grigg, 2012; Hanushek et al., 2004).
The Present Study
Through the present study, we examine whether, how, for whom, and under what circumstances school mobility (non-promotional school changes) affects SEL trajectories for low-income African American students living in a southern city in the United States. Because the nature of school change and the reasons for it are not the same for every student (e.g., de la Torre & Gwynne, 2009; Schmidt et al., 2018), we investigate the effects on SEL of two factors associated with school change: the timing of school moves and the characteristics of the schools students move to and from. Unlike most mobility studies based on large national surveys (e.g., Dupere et al., 2015, Rumberger et al., 1999), we measured SEL two times per year, allowing us to estimate how students’ SEL trajectories changed after moving in terms of both average SEC levels as well as how quickly and in what direction the competencies changed over time.
It is important to address both aspects of SEL trajectories because they have different effects on student learning. If a student maintains a positive, steep SEL learning trajectory after changing schools, then an initial dip in mean competency level is less concerning compared with a student who has no dip but whose trajectory changes from positive to negative. Over the longer term, the latter student will be much worse off. A dip may also be reflective of “reference bias,” as students in a new school are judging themselves based on a new cohort of students and thus set of standards (West et al., 2016). In this case, the dip would not imply that learning is being disrupted; just that students are judging themselves more or less harshly. The different effects also have implications for policy. If there is only evidence of a dip in mean SEL competencies following a move, then temporary programming for newly mobile students may be sufficient for minimizing this disruption. If the slope of SEL trajectories becomes negative, then remediation may require long-term, sustained effort to get mobile students back on their pre-move trajectories. Because we compared pre-move to post-move SEL trajectories using a repeated measures design (thus, comparing students to themselves, as suggested by Hanushek et al., 2004), we are able to circumvent the main issue with cross-sectional research on school mobility—that it’s not possible to control for all time-invariant variables that differ between mobile and non-mobile students.
Hypothesis
In line with prior research, we hypothesized that students who moved to a school during the school year (RQ2a), to a school with relatively worse A to F ratings, or to a school with relatively worse levels of school safety (RQ2b) would have worse SEL trajectories than students who did not (i.e., non-movers, students moving between years, or students moving to a similar or better school in terms of A to F ratings and school safety). We had no hypothesis regarding whether school changes would be associated with a dip in SEC levels, a change in rate or direction of SEL, or both because to our knowledge no prior studies have examined how non-promotional school changes affect SEL trajectory intercepts and slopes explicitly.
Method
Participants
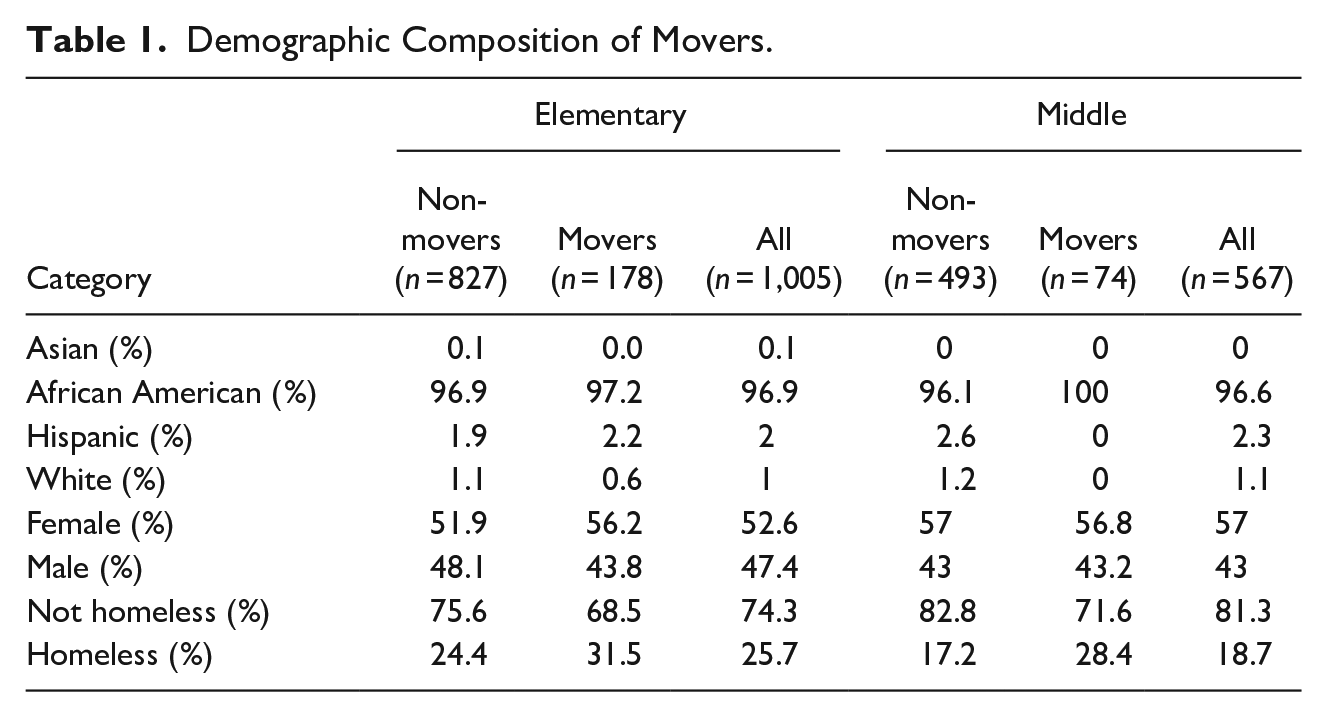
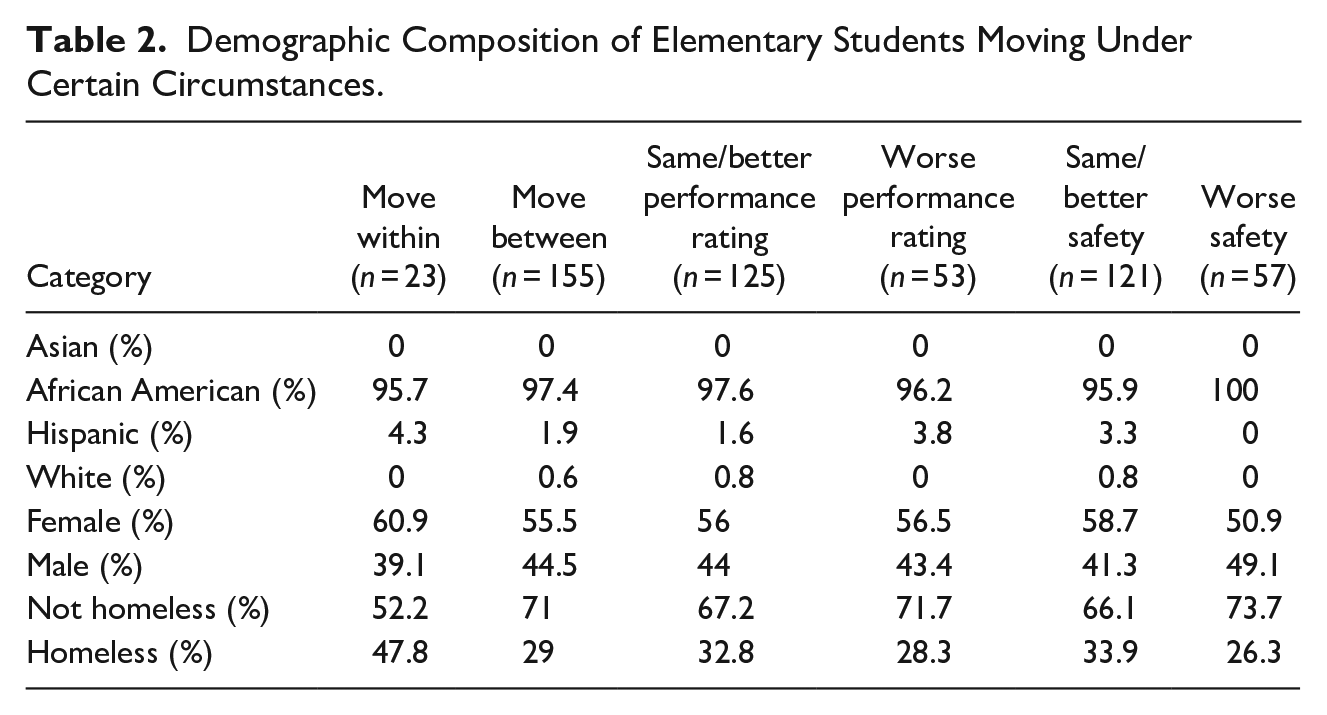
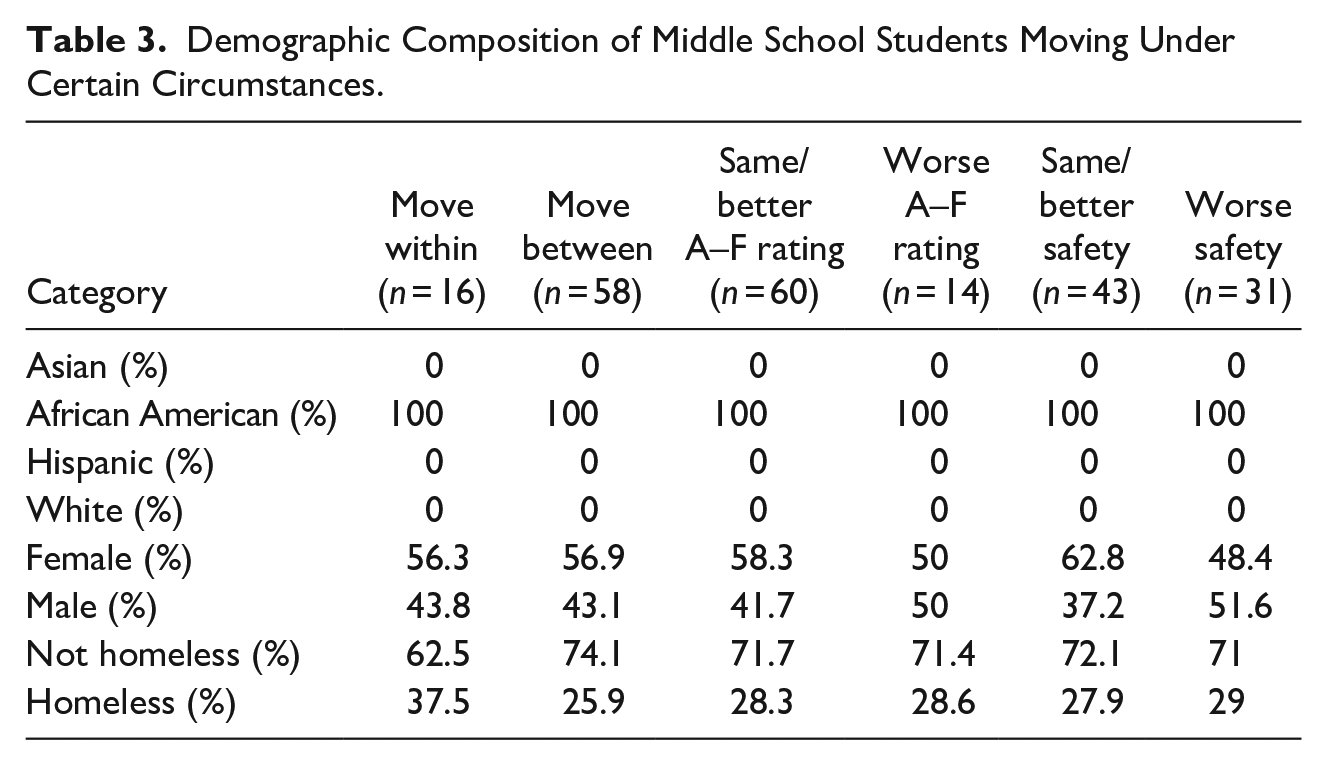
This study took place in an urban school district in the southern United States serving mostly African American (97.3%) and economically disadvantaged students (i.e., eligible for free or reduced-price lunch; 92.1%). To be eligible for the study, students had to be in third to seventh grade in the Fall of 2016 and receive active parental consent. The analytic sample consisted of 1,567 students (1,005 elementary and 562 middle school students) who completed at least two surveys out of four total possible survey administrations. Because we were interested in non-promotional school mobility, this sample did not include students who matriculated to middle school during the study (students in fifth grade during the 2016–2017 school year). Students in the sample were all economically disadvantaged (100%) and predominantly African American (97%). About a quarter of the students were designated as “homeless” (23.2%), which includes both students with “substandard” housing and those lacking fixed housing. Table 1 displays race/ethnicity, gender, and homelessness percentages by school level (elementary or middle) and whether students moved at least once during the study (i.e., “movers”). In both samples, movers were more likely to be characterized as homeless at some point during the study (Table 1). Tables 2 and 3 display demographics of elementary and middle school movers based on move timing (whether they moved within/during or between school years) and differences in school academic performance and safety ratings between schools students left and those they moved to.
Demographic Composition of Movers.
Demographic Composition of Elementary Students Moving Under Certain Circumstances.
Demographic Composition of Middle School Students Moving Under Certain Circumstances.
Data Collection
This study was based on three sources of data: district administrative records, student SEL and school climate surveys, and state school accountability metrics, collected between the spring of 2016 and 2018. Administrative records were collected by district staff for the 2016 to 2017 and 2017 to 2018 school years and included student demographics (race/ethnicity, gender, homeless status, age), school enrollment, number of days enrolled, and dates of enrollment changes. Social-emotional learning and school climate surveys were administered to participants two times per year each fall (late November) and spring (early May), for a total of four survey administrations. School level information was collected from the state department of education’s website. Measures are described in more detail below.
Social-Emotional Learning
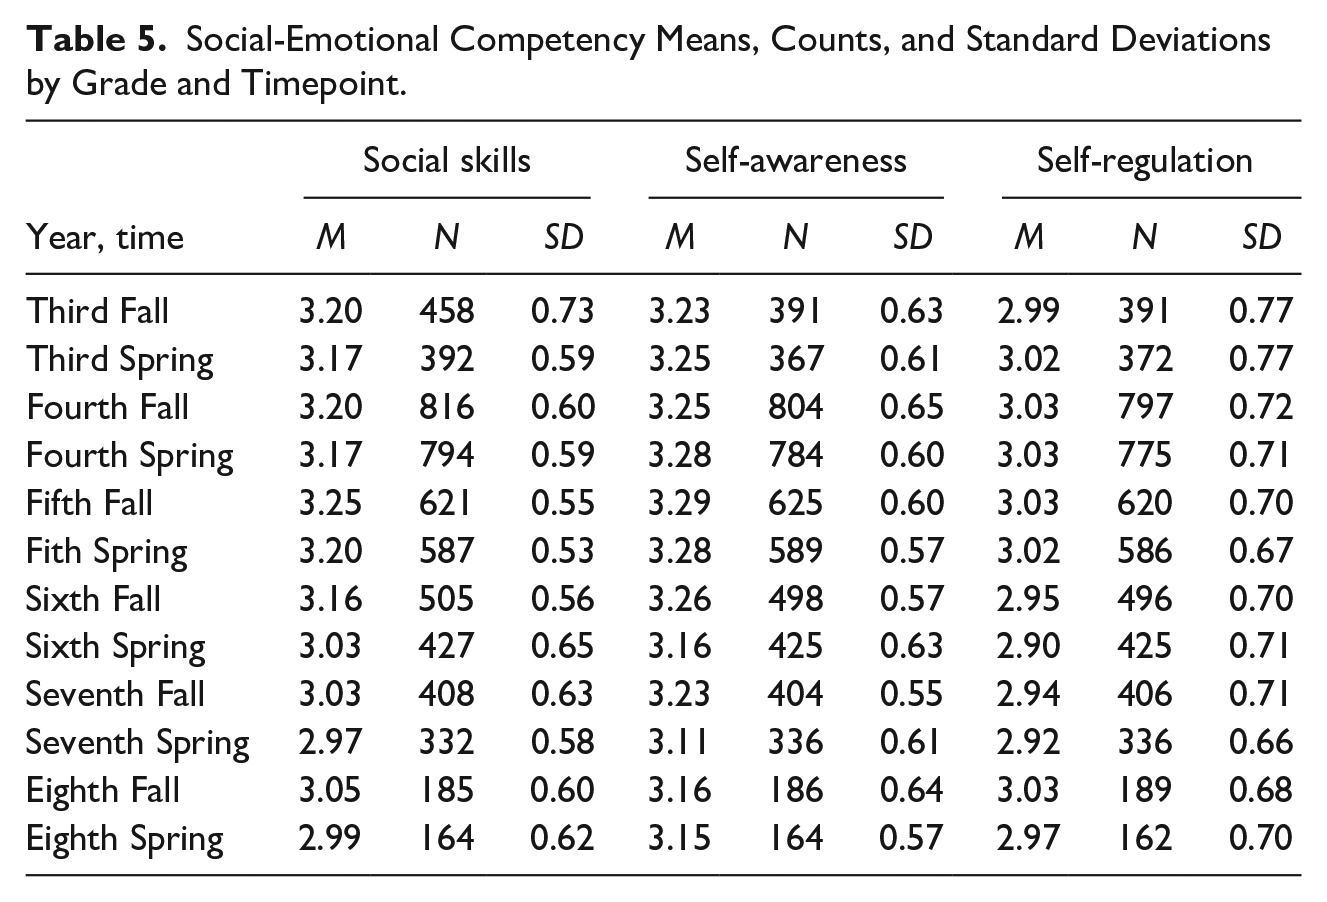
Items measuring self-perceived levels of SECs were adapted from two existing surveys: the Alaska School Climate and Connectedness Survey (American Institutes for Research, 2016), and the 5Essentials My Voice, My School Survey (Bryk et al., 2010). Three SECs were measured: (a) social skills, the extent to which students have the skills to nurture positive and respectful relationships with others, (b) self-awareness, the extent to which students can identify their own emotions, strengths, and weaknesses, and seek help from teachers when needed, and (c) self-regulation, the extent to which students can regulate negative emotions and make sound decisions. Each dimension consisted of three to four items (see Table 4) with affirmative statements followed by four response options: Strongly Disagree (1), Disagree (2), Agree (3), and Strongly Agree (4). Any negatively worded items were reverse coded. Interitem correlations (see the column “Alpha” in Table 4) were acceptable for the social skills construct, but lower for self-regulation and self-awareness, which we suspect were attenuated due to low construct item counts. Table 5 displays cross-sectional descriptive statistics for the three social-emotional learning constructs by the grade (i.e., third grade) and semester (i.e., fall vs. spring) students took the survey.
Social-Emotional Competency Scales.
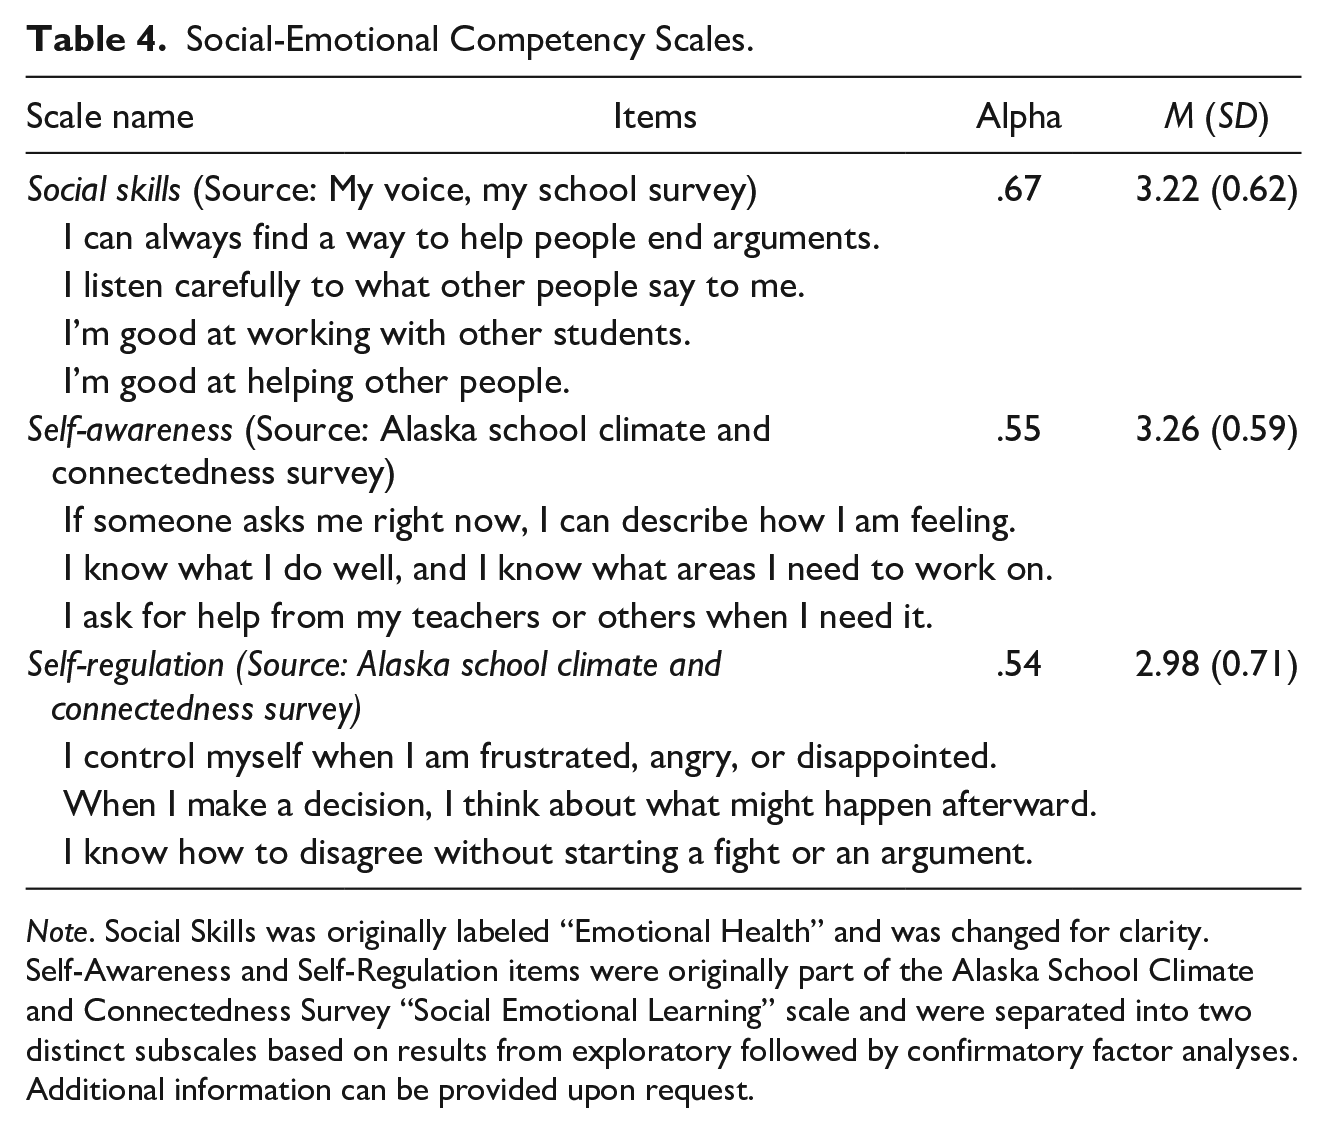
Note. Social Skills was originally labeled “Emotional Health” and was changed for clarity. Self-Awareness and Self-Regulation items were originally part of the Alaska School Climate and Connectedness Survey “Social Emotional Learning” scale and were separated into two distinct subscales based on results from exploratory followed by confirmatory factor analyses. Additional information can be provided upon request.
Social-Emotional Competency Means, Counts, and Standard Deviations by Grade and Timepoint.
School Measures
School performance
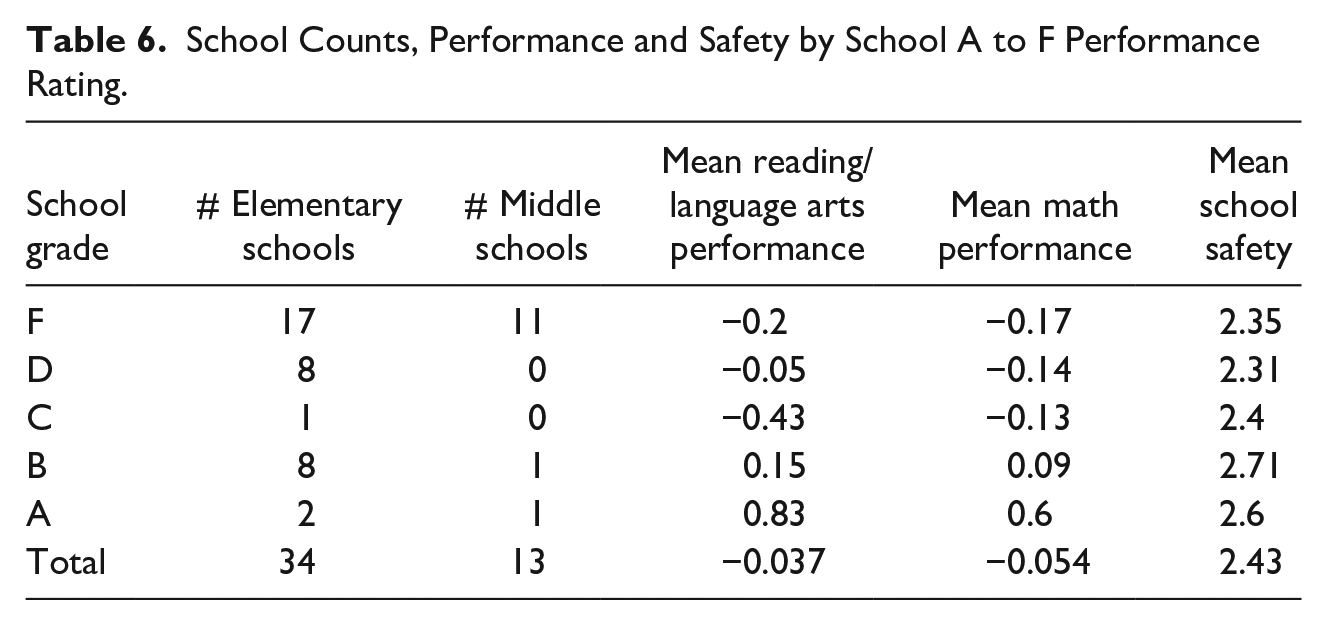
School performance was collected for the first study year (2016–2017) from the state department of education which measured school performance on a scale from A to F as part of their statewide accountability system. These ratings were based primarily on how students performed on state standardized math and reading/language arts tests (including proficiency and growth). Each school received a rating of A, B, C, D, or F with “A” signifying high performance and “F” signifying low performance. As reported in Table 6, schools with higher performance ratings had higher levels of mean standardized math and reading/language arts performance scores. Schools with A or B ratings generally had higher levels of mean school safety relative to schools with C to F ratings, however B-rated schools had higher levels than A-rated schools. The distribution of schools at each performance rating was positively skewed, with most schools receiving an F rating. This phenomenon was most pronounced for middle schools. Only 2 of the 13 district middle schools were designated as passing (i.e., not failing) in terms of school performance.
School Counts, Performance and Safety by School A to F Performance Rating.
School safety
School safety was calculated by taking the mean school safety scale scores from an adapted version of the “My Voice, My School” student survey, which was developed by researchers at the University of Chicago as part of the Illinois 5Essentials Survey (Bryk et al., 2010). School Safety was defined as the “degree to which students feel safe both in and around campus” (Gonzalez et al., 2020). Students responded to survey prompts about their school with one of four Likert response options: Strongly Disagree (1), Disagree (2), Agree (3), or Strongly Agree (4). The intraclass correlation coefficient for school safety was .11 meaning that 11% of the overall variance in school safety was between schools. School safety was moderately correlated with A to F performance rating (ρ = .41), mean standardized math performance (ρ = .31), and mean standardized reading/language arts performance (ρ = .36).
Move types
We calculated the difference in school level performance (A–F rating) and safety between schools students left and schools students moved to, resulting in binary variables associated with each move type (e.g., “same/better school performance” vs. “worse school performance”). For scale variables, schools within 1/4th of a standard deviation were deemed “same or better,” following criteria from What Works Clearinghouse (2019).
School Mobility
In this study, we defined school mobility as any time students changed schools for reasons other than promotion from elementary to middle school. Because “choice” enrollment was not allowed in the district at the time of the study, student mobility typically involved both school and residential changes, except in cases of school closure, student expulsion, or movement to a magnet school. No school expulsions were reported among students in our sample; however, 14 students did move because of school closure (7 in elementary schools and 7 in middle schools). We left these students in the sample because they experienced a school transition, regardless of the reason. Eighty-two percent of non-promotional school moves were to schools that—according to the state website—fed into different high schools than the ones students were originally set to attend, representing considerable shifts in student social in addition to home environments.
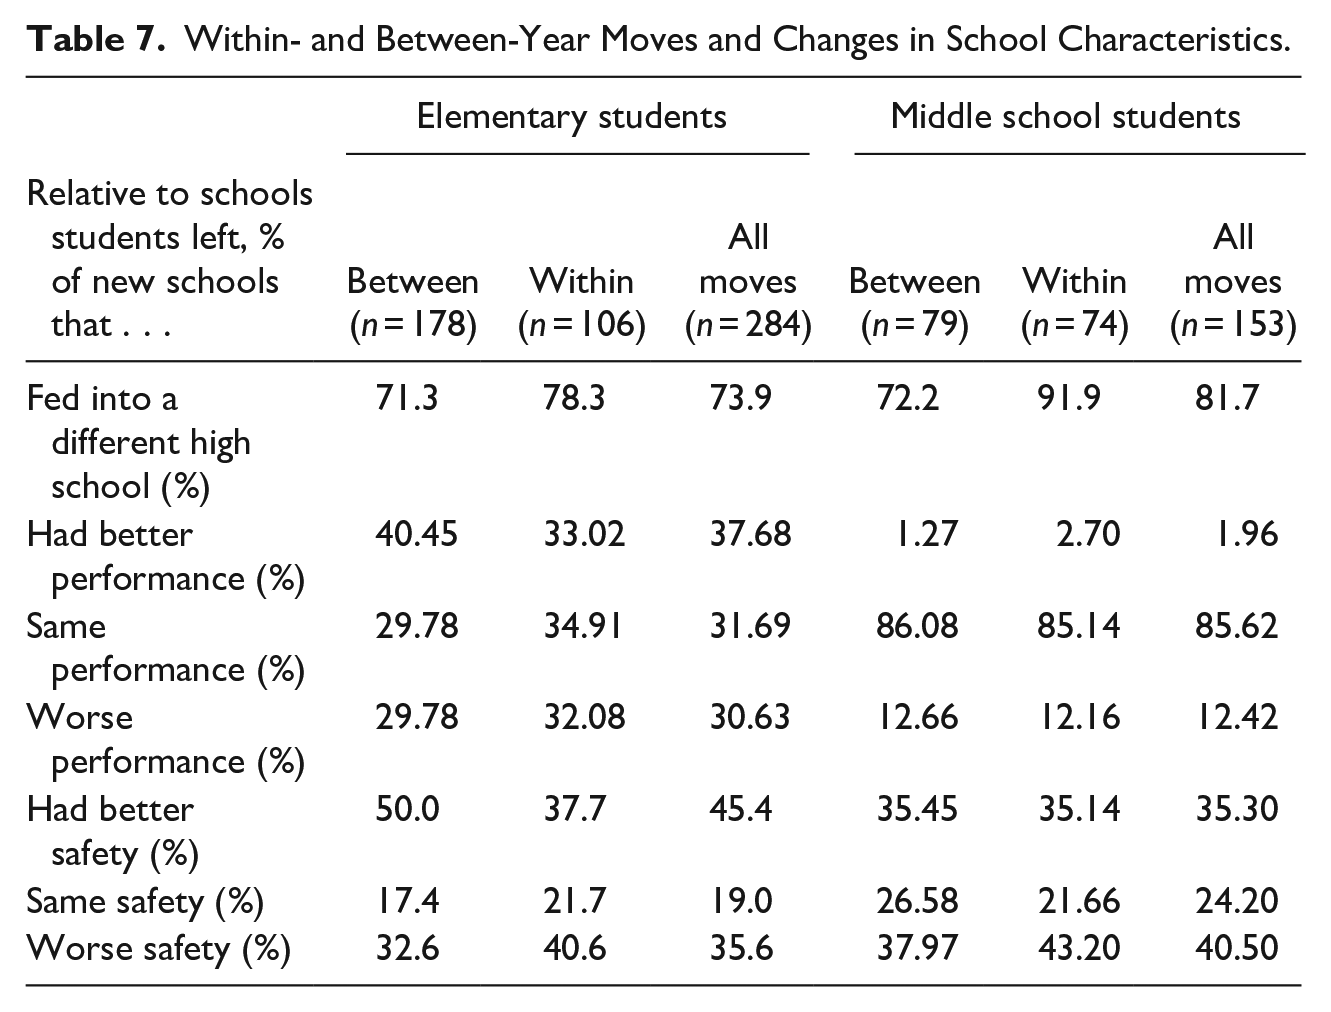
We characterized school mobility according to whether school changes occurred within (i.e., during) the school year or between school years (i.e., a student completes the school year in one school and shows up at a different school the next fall) using school enrollment data. For both elementary and middle school students, within-year moves were slightly less common than between-year moves (37% of elementary and 48% of middle school student moves were within-year). Regardless of whether students moved within- or between-years, students tended to move to schools with similar school safety and performance ratings relative to the schools they left. However, compared to those that occurred between years, within-year moves were more likely to be to schools that fed into different high schools than the ones students were originally set to attend. See Table 7 for the percent of within- and between-year moves that were to schools that, relative to schools students left (a) fed into different high schools, (b) had better, same, or worse performance ratings, and (c) had better, same, or worse safety ratings.
Within- and Between-Year Moves and Changes in School Characteristics.
Analytic Strategy by Research Question
RQ1: How do SEL trajectories differ after students change schools compared to before students change schools, if at all? Using the lme4 and lmerTest packages in R (Bates et al., 2015; Kuznetsova et al., 2017), we were able to estimate how SEL trajectories differed after school changes with a series of within-subjects multilevel linear growth models (Raudenbush & Bryk, 2002) with survey administrations (or timepoints) nested within students (see Shadish et al., 2013). We ran analyses separately for elementary and middle school students.
At level 1, the fully specified model would be expressed as:

where,
Level 1 parameters were modeled as functions of (a) intercepts representing between-student grand means, (b) a vector of dummy coded covariates (gender and homeless status), and (c) random effects, which allowed individuals to vary around the grand (student) means. We used an iterative model-building approach, starting with an intercept-only model, and building up to a fully specified model including all interactions and random effects. Due to sample size restrictions, all random effects could not be estimated in the same model. Therefore, as part of the model-building approach, we tested models with each possible combination of random effects in level 2. Akaike’s (1973) information criteria (AIC) and chi-squared (χ2) tests comparing differences in deviance statistics (−2x Log Likelihood) between pairs of models were used to select models with the best goodness of fit. We used this method to explore whether there was (a) no difference in SEL trajectories post-move, (b) a post-move intercept shift (meaning SECs differed on average post-move), but no change in slope (indicating SECs did not develop at a different rate), (c) a change in slope, but no change in intercept, or (d) a change in both intercept and slope post-move.
RQ2: Are circumstances surrounding school changes associated with differences in SEL trajectories? To test our hypotheses regarding timing of moves (
Results
RQ1: How Do SEL Trajectories Differ After Students Change Schools Compared to Before Students Change Schools, If At All?
Elementary students
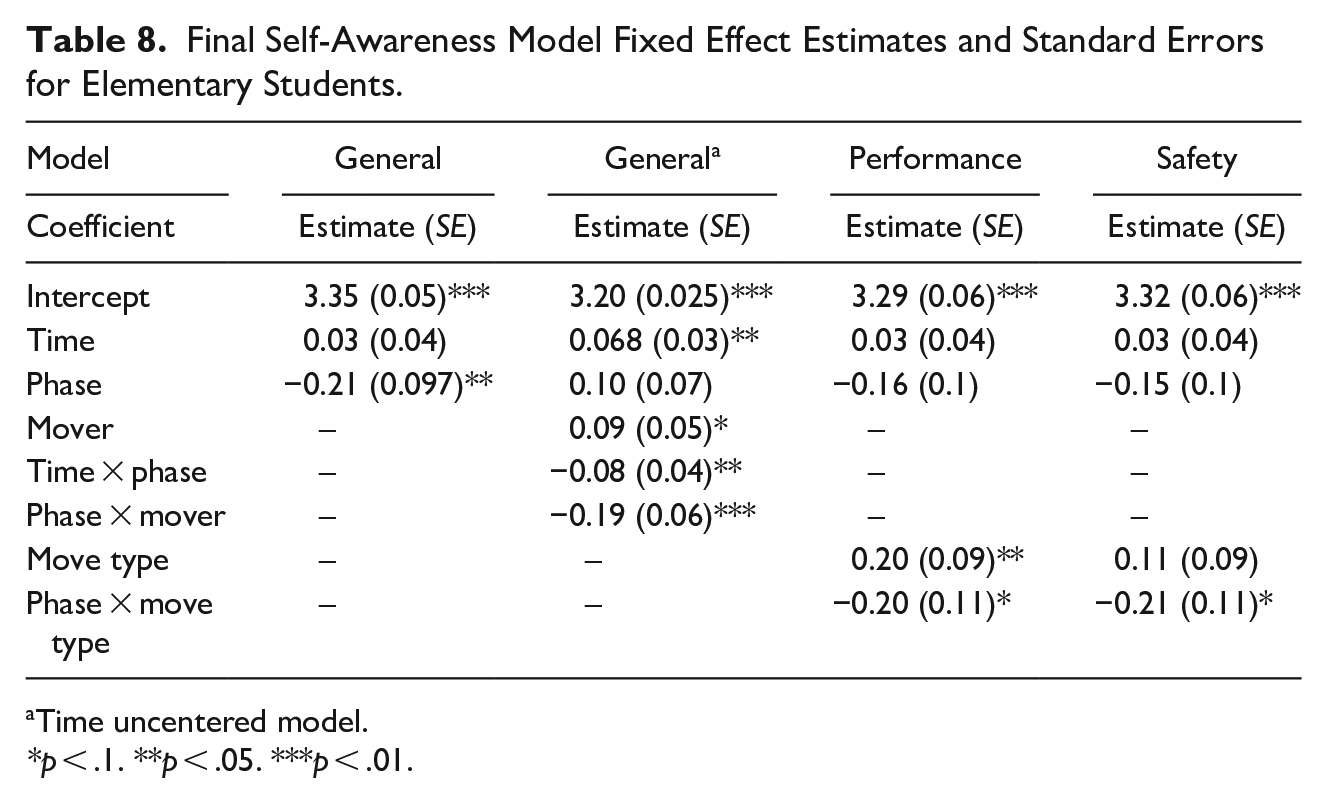
After moving, elementary students’ social skills and self-regulation levels did not appear to change, on average. The models with the best fit for these constructs did not include a post-move shift in intercept (indicating a change in mean competency levels) or slope shift parameter estimate (see Table 8, Column 1). For self-awareness, there was evidence of an intercept shift, as levels decreased by 21% of a point (on a 4-point scale) post-move (p < .01). There was no evidence of a slope change post-move. The statistically significant estimated shift in self-awareness is plotted in Figure 1.
Final Self-Awareness Model Fixed Effect Estimates and Standard Errors for Elementary Students.
Time uncentered model.
p < .1. **p < .05. ***p < .01.
Plot of self-awareness model estimates for elementary students.
To further contextualize the results for self-awareness, we conducted follow up analyses with a sample of students who either didn’t move or moved between years 1 and 2 of the study (92% of students who moved). This allowed us to rerun the analyses without a centered time variable (where Time is 0,1,2,3 for all students), investigate differences between year 1 and 2 intercepts and slopes for movers and non-movers, and examine whether mean differences between initial and final survey means were statistically significant. Because we included non-movers in this sample, we added a dummy variable indexing whether students moved during the study (Mover) as well as interaction terms allowing for differences in time trend and intercept fixed effect estimates across movers and non-movers. As with the initial analyses, we compared models with different random effects using log-likelihood and AIC. We also eliminated any insignificant interaction terms. The final model is displayed in Table 8, column 2. Based on these results, mean self-awareness levels at the initial survey timepoint did not differ between movers and non-movers at the p < .05 level, however at the final timepoint, there was a statistically significant difference of .19 between the two groups (or 19% of a point), with movers scoring lower than non-movers. The estimated Cohen’s d effect size corresponding with this difference was 0.32, a small to moderate effect.
Middle school students
For middle school students, moving was not associated with statistically significant intercept or slope changes in levels of social skills, self-awareness, or self-regulation. The models with the best fit for these constructs did not include an intercept shift or slope change parameter estimate. Therefore, for middle school students we did not find evidence that changing schools in general was associated with changes in SEL trajectories.
RQ2: Are Circumstances Surrounding School Changes Associated With Differences in Trajectories?
Within-year moves
Across both elementary and middle school samples, we found no evidence that within-year moves were associated with worse SEL trajectories relative to between-year moves. None of the slope or intercept differences between these two groups of students were statistically significant to the p < .1 level.
School performance
For elementary students, there was some evidence to support our second hypothesis that moving to a worse school in terms of A to F performance rating would be associated with worse SEL trajectories relative to moving to a school with the same or better A to F performance rating. Students moving to schools with worse A to F performance ratings started out with higher average self-awareness levels by about 1/5th of a point (p < .05; see Table 8, column 3). Both groups of students experienced a dip in self-awareness post-move; however, the dip for students moving to worse schools in terms of A to F performance ratings was larger by about 1/5th of a point (p = .068). Estimates are plotted in Figure 2. No statistically significant slope or intercept differences were found for the other SEL constructs for elementary students. In addition, none of the slope or intercept difference estimates reached conventional levels of statistical significance for middle school students.
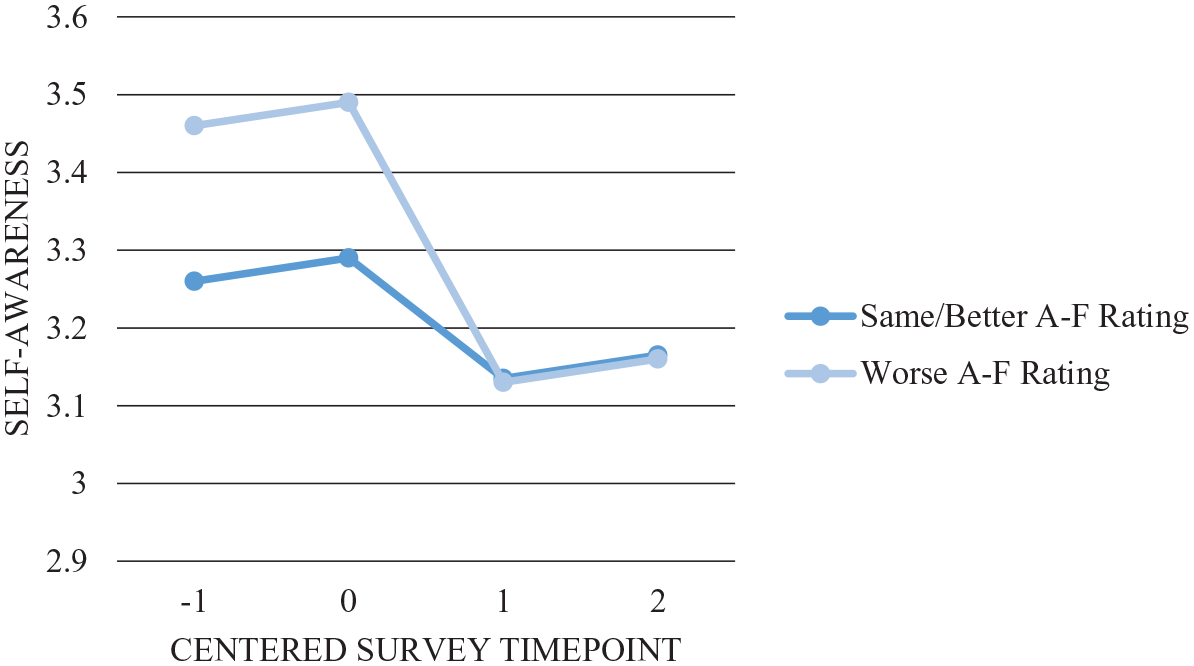
Plot of final fixed effect estimates for elementary school self-awareness school A to F rating model.
School safety
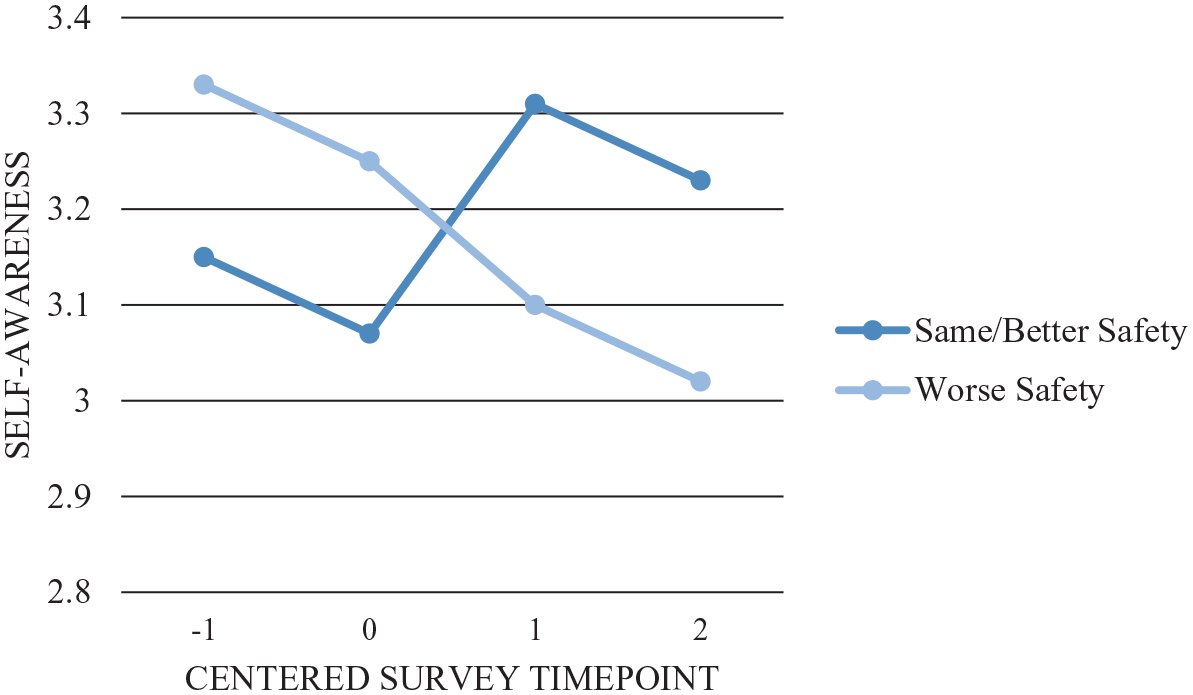
Across elementary and middle school samples we found evidence that moving to a school with worse levels of relative school safety was associated with worse self-awareness post-move intercept shifts. For elementary students, those moving to less safe schools started out with higher mean self-awareness levels, but ended up with lower levels post-move relative to students moving to similarly or more safe schools (see Figure 3). This is because the post-move intercept shift estimate for students moving to less safe schools was −.36 (see Table 8, column 4) compared with −.15, and this difference was statistically significant to the p < .1 level (p = .06). Slope and intercept difference estimates for the other two SEL constructs were not statistically significant to the p < .1 level.
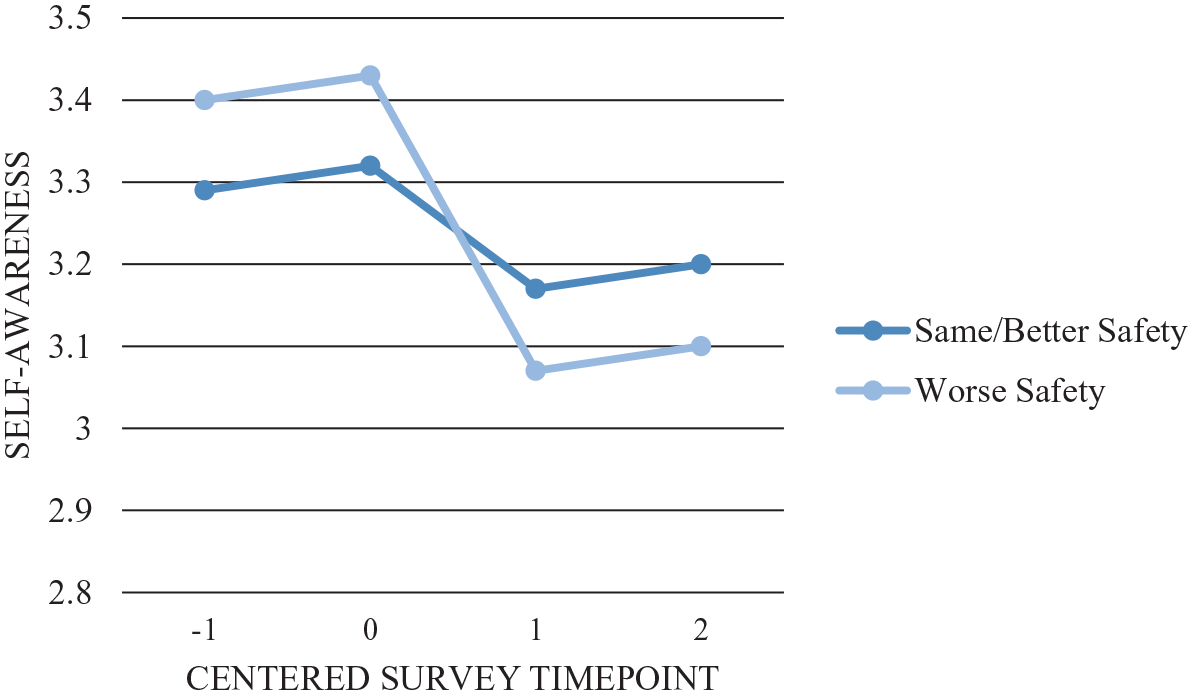
Plot of fixed effect estimates for final elementary school self-awareness school safety model.
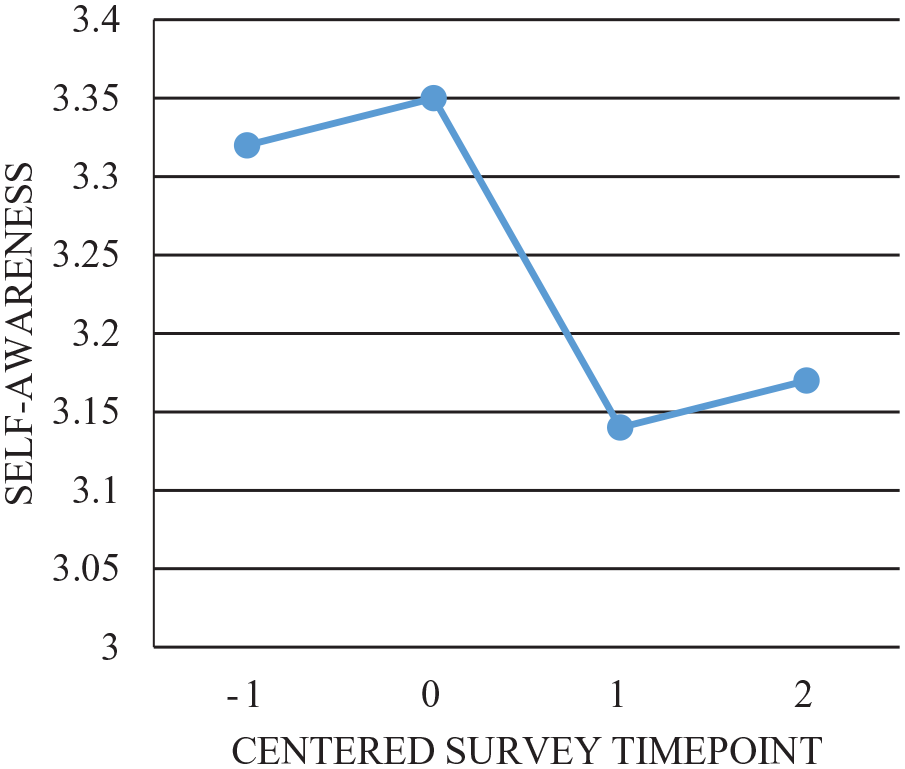
For middle school students, a similar self-awareness pattern was observed. Students moving to safer/similarly safe schools started out with lower average self-awareness levels compared with other mobile students but reported higher average levels post-move (though pre-move differences in mean were not statistically significant; see Table 9, column 1). This is because the post-move intercept shift estimate was almost half of a point lower (.39, p < .01) for students moving to less safe schools relative to their mobile peers. This reflects a moderate-large effect (Cohen’s d = .66; Figure 4).
Final Self-Awareness Model Fixed Effect Estimates and Standard Errors for Middle School Students.
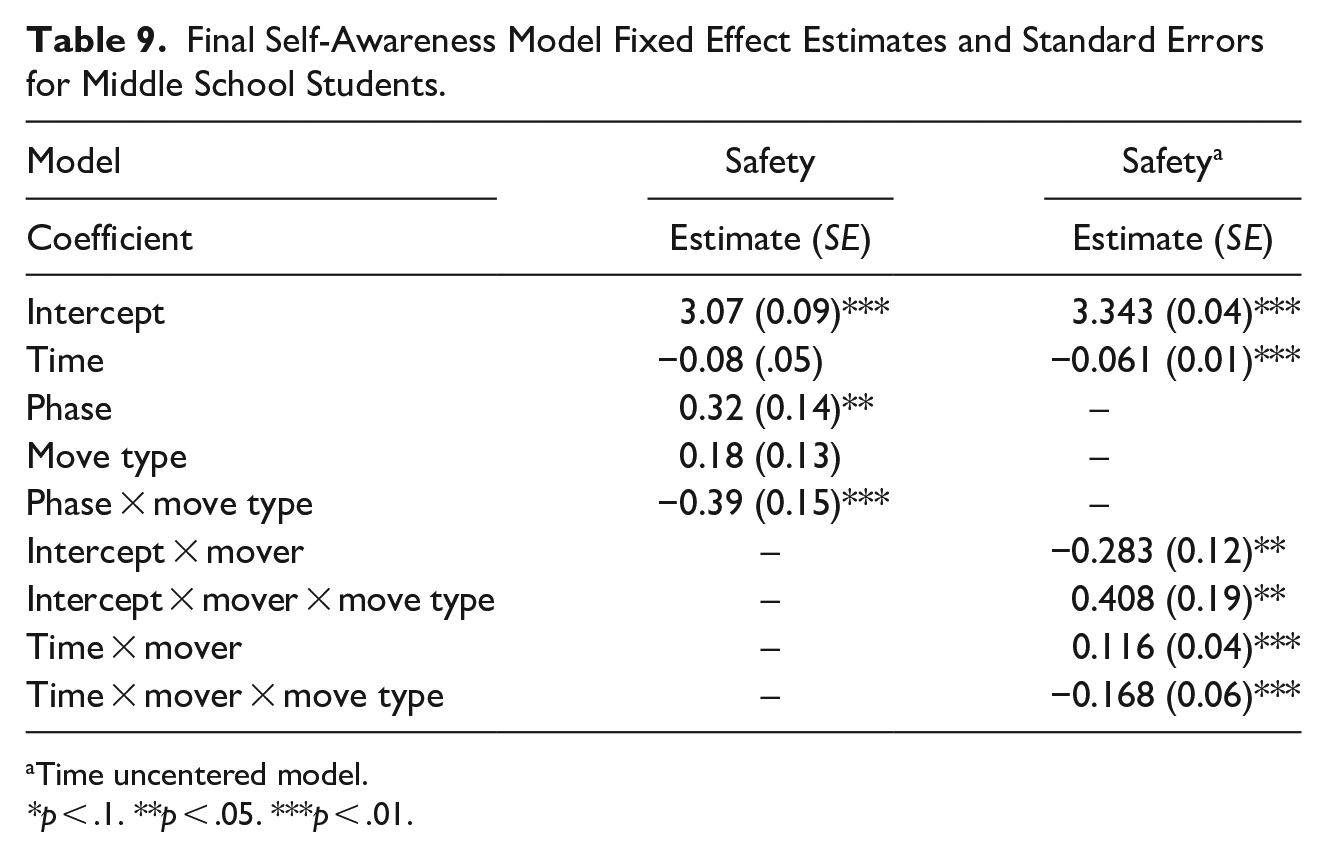
Time uncentered model.
*p < .1. **p < .05. ***p < .01.
Plot of fixed effect estimates for final middle school self-awareness school safety model.
To place these results into greater context, we conducted a follow-up analysis comparing self-awareness mean trajectories using an uncentered time variable (Time = 1,2,3,4) between (a) non-movers, (b) students moving to schools with similar or better levels of school safety, and (c) students moving to schools with worse levels of relative school safety. Models included a dummy variable indexing whether students moved during the study (Mover), as well as interaction terms allowing for differences in time trend and intercept fixed effect estimates across non-movers and movers to schools with worse levels of relative school safety. We did not include post-move intercept or slope shift parameters to model overall time trends across the four time points. Table 9, column 2, and Figure 5 display the final intercept and slope estimates for these three groups of students and show that students moving to schools with worse school safety ratings had worse average self-awareness slopes relative to both groups of peers (non-movers and students moving to schools with similar or better levels of school safety) and those differences in slopes were statistically significant to the p < .01 level. Mean self-awareness levels were predicted to increase over time for students moving to safer schools and decrease for all other students.
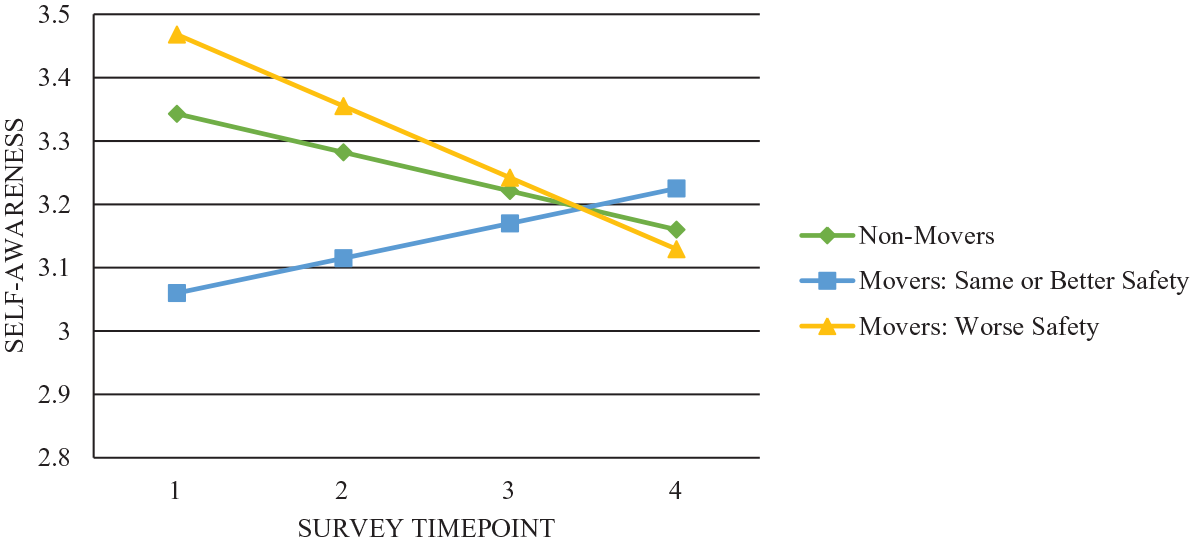
Plot of uncentered self-awareness fixed effect estimates for middle school students based on school safety.
Discussion
The purpose of this paper was to explore one potential explanation (a higher incidence of school mobility) for poor SEL program outcomes in school districts serving low-income African American students. We investigated the possibility that changing environments would disrupt SEL. Evidence did not overwhelmingly support this possibility, at least when looking at average effects. Only in one case (when looking at self-awareness levels for elementary students) were mean SEL trajectories different post-move, and because trajectories remained positive and consistent post-move, students were projected to have recovered to their initial levels of self-awareness within a couple of years. This is reminiscent of Kerbow’s (1996) study finding that it took mobile students 2 years to fully recover to initial levels of academic achievement following a move. Therefore, moving in general only seemed to have a temporary negative consequence, and only for one construct and one group of students.
For what reasons might elementary students have lower mean levels of self-awareness after moving? Because average trajectories only changed in terms of their intercept, it’s possible that our finding does not represent a change in average self-awareness, just a change in perceived self-awareness standards (West et al., 2016). Or, when looking at the items that comprise self-awareness, it’s easy to see how starting over with a new group of students and teachers might lead students to rate themselves lower. For the first item, the prompt reads: “If someone asks me right now, I can describe how I am feeling.” It’s understandable that students might feel uncomfortable communicating their feelings to those who might be described as strangers. The third item has the prompt, “I ask for help from my teachers or other when I need it.” It seems feasible that students would feel less comfortable asking teachers they barely know for help relative to teachers they know well. According to Paunesku and Farrington (2020), SECs aren’t characteristics students “have” that translate equally across contexts. Instead, SECs are “cued and exhibited to a greater or lesser extent in different environments” (p. 6). Indeed, how students respond to questions about their own SECs across two different classrooms have been found to differ based on differences in classroom environments (Farrington et al., 2019). Our findings seem to support this perspective when considering the questions asked.
We also found evidence of negative intercept shifts for self-awareness when students moved to less safe or lower-performing schools. More specifically, the estimated general negative effect of moving on self-awareness for elementary students was more extreme when students moved to lower-performing or less safe schools. For middle school students, moving was only associated with a statistically significant negative intercept shift for self-awareness when students moved to less safe schools. These findings support the net vulnerability model of stress (e.g., see Osher et al., 2020), which asserts that the more stressors and risk factors a child is exposed to, the more detrimental to their development unless additional stress is buffered by positive relationships or experiences. For our sample, evidence suggests that the most detrimental transitions in terms of self-awareness are those to schools that are deemed less safe on average by other students. However, the detrimental effects were largely estimated to be dips in post-move mean levels of self-awareness, not changes in trajectory, again suggesting that students are responding differentially, on average, in their new environment.
Some of our hypotheses were not supported by this study. While considering our null results, it is important to note that we looked at average effects, which obscures what is happening for individual students. For some students, school mobility may have had a very detrimental effect on SEL; and for others, a positive one. These null findings do not imply that none of the students in the sample struggled after changing schools.
With that said, we did not find evidence that moving during the school year was more detrimental for SEL (on average) than moving between school years. This goes against our original hypothesis (and some prior literature; Engec, 2006; Grigg, 2012; Hanushek et al., 2004; Schwartz et al., 2009) that within-year moves are more stressful, and therefore more detrimental for SEL. One potential explanation for this finding is that students moving to a new school in the middle of the school year receive more attention and support from school staff (because there are fewer students needing support at a given time). Conversely, students joining a new school at the beginning of the year might get lost in the “shuffle.” Each fall, all students are “new” to teachers who focus on specific grade levels, and there are many demands competing for their attention (e.g., preparing materials and classroom management). Future studies could shed light on this possibility by accounting for student transition support in models estimating the impact of mobility.
We also didn’t find any evidence of detrimental effects on the other two SEL constructs social skills and self-regulation. If the observed intercept shifts for self-awareness were due to “reference bias” (i.e., changes in student perceptions as to where they stand relative to other students), we would expect this bias to be consistent across SEL constructs. Because this was not the case, we are left with the explanation that self-awareness is more sensitive to context than social skills or self-regulation (Paunesku and Farrington, 2020). Indeed, theories of development assert that adaptations (e.g., coping or resilience strategies) made in one environment can carry over to new contexts (see Osher et al., 2020). Perhaps these other competencies are more robust and consistently displayed than self-awareness. More longitudinal studies are needed to unpack the nature of SEL constructs as stable “attributes” or contextually sensitive skills.
With only four time points across 2 years, we were unable to discern the longer-term effects of school mobility; however, there is some signal to suggest that the self-awareness trajectories of middle school students moving to less safe schools represent long-term detriments. The overall self-awareness mean trend was positive for both non-movers and students moving to safer or similarly safe schools and negative for those moving to less safe schools. This means that the gap in self-awareness is projected to widen over time. Future research should investigate this possibility with additional follow-up surveys. With more time points, it would be possible to discern whether mobile students recover quickly or remain underperforming in SEL long term. It would also be possible to capture non-linear trends in SEL.
Also important is our finding that moving to a similar or “better” school in terms of school safety was associated with better SEL trajectories than not moving at all. This suggests that changes in school environments can benefit students in terms of SEL when the change is associated with an improvement in school safety. Considering this in addition to the fact that school safety is associated with worsening SEL trajectories, our research supports the idea that the environments of sending and receiving schools may be more influential in terms of SEL than school mobility itself. This supports prior research that has shown positive school environments can buffer students against negative family or other life stressors (see DiMaggio & Garip, 2012; Osher, 2017).
Limitations
It is important to note that this study has several limitations. First, although we were able to rule out several confounding variables, we cannot rule them all out without randomly assigning students to change schools. Generally, this type of approach is unfeasible and unethical. We consider our approach an improvement relative to cross-sectional studies because we were able to compare pre-and post-move trajectories within students. However, it’s possible that the trajectories of students who moved would have been worse than non-movers even had they not moved.
Second, because we conducted a large number of statistical tests, the likelihood of finding a significant result due to chance alone is elevated (i.e., familywise error). This seems somewhat likely for our finding that self-awareness levels shifted downwards (i.e., intercept shift) for elementary students post-move, however we are more confident in the effects we found based on school safety. Differences in slopes were consistent across all constructs and were quite large in some cases.
Third, we were interested in examining how consequences surrounding school mobility affected SEL. Unfortunately, the district did not consistently document the reasons behind school moves, and therefore we were unable to isolate school mobility from residential mobility, nor distinguish between a wider range of consequences precipitating school moves. Generally, this type of information is not gathered consistently by districts. We were able to document when students moved due to school closure, but our small sample size prevented us from being able to estimate the effect of moving due to school closure relative to other types of moves. Finally, it is possible that school mobility affected students who did not participate in the study. Our larger evaluation found some differences between students who consented and those who did not (see Gonzalez et al., 2020).
Areas for Future Research
As more school districts begin to complement existing accountability systems with measures of student SEL and school culture and climate, several fruitful extensions of this work will become possible. Increasing the number of survey timepoints (either by increasing the frequency of survey administration or surveying for additional years) will allow researchers to estimate SEL trajectories in better detail and across longer timespans. It is also yet to be determined to what extent district demographics and regional context matter when assessing the impact of school mobility on SEL trajectories. Therefore, it is important that future researchers repeat this methodology across diverse school districts serving a variety of student populations across the country to see whether and to what extent the results of this study generalize to other populations.
Future research on SEL trajectories should also account for independent variables beyond school safety, performance, and move timing. When considering the list of factors thought to foster successful transition adaptation (Schlossberg, 1981), examples might include measures of transition support (i.e., how much particular schools provide formal supports like mentors for transitioning students), number of previous school transitions, measures of support beyond those provided by schools (e.g., family or community supports), number and demographic composition of peers who transition to new schools together, and the circumstances surrounding school transition. Transition circumstances are especially important to understand because the impact of school changes likely depends on whether a student voluntarily left the school. If districts can do a better job conducting exit interviews and recording primary reasons for school changes, then future research can assess the impacts of school mobility under specific conditions, laying the groundwork for targeted transition supports.
Finally, there are several methodological directions researchers could take in the future. First, there is a need for more robust quasi-experimental research on the impact of schools on SEL trajectories. Examples of research designs that could better capture causal effects of schools include those that use propensity score matching, which entails creating artificial control groups by matching students based on a series of variables; and regression discontinuity, which could be used to estimate transition support effectiveness, for example, in cases where transition supports are given to students who score below a certain needs threshold. Finally, future studies could employ a more exploratory mixture modeling approach (Collins & Lanza, 2010) to explicitly address the heterogeneity in SEL trajectories across students (see Schnittka Hoskins, forthcoming). Mixture modeling can be used to identify unobserved (latent) subgroups of students who exhibit certain SEL trajectories, and these subgroups can be compared across a variety of variables (e.g., school composition, location, and poverty levels) to uncover additional factors that are affecting SEL trajectories. As the body of work on SEL trajectories across school contexts grows, schools will be better positioned to address social and emotional needs of diverse students.
Implications
Our main takeaway from this study is that the quality of school environments appears to matter for SEL (but only for one of three constructs). The school-level variable most linked to SEL was school safety, which was defined in this study by an absence of crime, violence, and bullying. If kids are being bullied then they perhaps are more fearful, are less likely to have positive social interactions, and feel less capable mentally, socially, and emotionally. Prior research on stress might also explain this finding. Studies show that when children experience stressors within the context of supportive relationships, those relationships can buffer any long-term negative effects, resulting in only temporary derailing (Center on the Developing Child at Harvard University, 2016). In the absence of supportive relationships, stress can instead snowball. Thus, it is especially important to provide students with supportive, buffering relationships immediately after a stressful transition like school mobility. Helping new students feel safe and socially supported could help prevent disruptions in SEL.
Our findings also support the idea that schools are important contexts for improving SECs (Loeb et al., 2018; Fricke et al., 2021). Prior research has shown that school climate and SEL are linked. Safer school environments are typically comprised of students with higher levels of social-emotional competence (Kendziora et al., 2008). This is theorized to occur because improvements in school climate can lead to improvements in student levels of social-emotional competencies, creating a positive feedback loop (Berg et al., 2017). Teachers in safe and supportive schools can better implement proactive strategies to reduce bullying and violence, which can lead to social-emotional learning. Individual social-emotional competence can then collectively promote safe and supportive environments (Osher et al., 2008; Sprague & Walker, 2010). In contrast, if students feel unsafe, they are more likely to engage in bullying behaviors, which can further exacerbate feelings of a lack of safety (Elsaesser et al., 2013). Addressing both SEL and school climate is essential because according to Berg et al. (2017), “SEL cannot flourish in a school independent of positive and supportive school and classroom climates” (p. 4). Failing to address climate might explain the lack of efficacy of SEL programming in certain low-income, urban contexts (Farahmand et al., 2011). If students are exposed to high levels of violence in their community and schools (as students in this district were; email correspondence with district administrator, July 2015), then SEL is much more difficult to improve when taught on an individual level.
In order to improve school climate and SEL, Berg et al. (2017) recommends addressing the complex ecologies within which students develop. They recommend that interventions involve more than just student competency, combining student with community, family, and teacher supports. Building SECs in teachers, for example, might give students positive role models, and can also promote more orderly, positive, and supportive classroom environments, which have been shown to improve SEL (Jennings & Greenberg, 2009). They also recommend that programs focus on building culturally responsive, participatory approaches to improvement using tiered supports. Students who have experienced a lot of trauma might need individualized school mental health services in addition to second-tier and universal school-wide supports (Berg et al., 2017). Recommendations for preventing school violence from the US Center for Disease Control are similar but also include collaborative partnerships with out-of-school community programs like after-school, mentoring, or community outreach programs (David-Ferdon et al., 2016). Thus, a customized, participatory, multifaceted approach to preventing and buffering against stress might be more effective than narrower approaches focusing on individual student competency development. Future research could illuminate which of these facets are most essential for different types of school and community contexts.
Footnotes
Acknowledgements
Special thanks goes to Dr. Noreen Webb, who provided thoughtful and thorough feedback on many drafts of this paper. Her guidance and mentorship have been invaluable. The late Dr. Mike Rose also contributed significantly to this work as a mindful thought partner and sounding board. He will be sorely missed.
Declaration of Conflicting Interests
The author(s) declared no potential conflicts of interest with respect to the research, authorship, and/or publication of this article.
Funding
The author(s) disclosed receipt of the following financial support for the research, authorship, and/or publication of this article: This project was made possible with funding from the National Institute of Justice.