
Abstract
The meteoric rise in charter schools has several implications for traditional public schools and their students. One understudied implication is the geographic competition for students. Given traditional public school boundaries are often fixed while charter school boundaries are more flexible, charter schools can draw students away from existing traditional public schools, and we have very little information about how distance matters in the competition for students. Because of this, traditional public schools and school districts have little ability to plan for enrollment changes in the face of charter school growth. Our paper uses data on enrollments and demographics in all charter and traditional public schools in Los Angeles from 2000 to 2013 to better understand these dynamics. We find that traditional public school enrollments clearly decline with competition from nearby charter schools. However, we also observe that charter schools tend to locate where traditional public school enrollments are on the decline. Competition is more relevant for elementary schools at short distances—within about 1 mi appears to be where the associations between charter school enrollments and TPS enrollment declines are the strongest. For middle and high schools, those connections are apparent within 2 to 6 mi in some models.
Introduction
Between 2000 and 2018 the number of charter schools nationwide more than tripled, and now make up over 7% of all public schools (National Center for Education Statistics, 2019). The Los Angeles Unified School District (LAUSD) is the second largest school district in the country, one with explosive growth in the number of charter schools. Between 2000 and 2017, the number of charter schools in LAUSD grew from 10 to 297. They now comprise 29% of all public schools in the district and enroll 24% of its students (Education Data Partnership, 2018). There is much reason to believe that charter schools will continue to grow in number and prevalence throughout American education. It is a popular and growing movement (Peterson & Chang, 2018) and charter schools have support at the highest levels of government—recent U.S. Secretary of Education Betsy DeVos was an ardent supporter of school choice through vouchers and charter schools.
Several questions arise with respect to the effects of charter schools (CS) on traditional public schools (TPS). A common justification for investments in charter schools is that it enhances parental choice, particularly for households that are zoned for underperforming schools. This enhanced choice has ramifications for existing traditional public schools in close proximity to new charter schools. For some charter school advocates, this is appealing—the hope is that competition from charter schools may push existing public schools to improve or face reduced enrollments and accompanying budget cuts (Arsen & Ni, 2012). For those that support traditional public schools—and question the extent to which charter schools provide better educational outcomes—this competition unnecessarily takes resources away from longstanding institutions vital to the community (Ewing, 2020).
In the context of rapid charter school growth, traditional public schools lack information about the extent to which charter school openings affect their enrollments. Research has found that charter schools can have detrimental effects on traditional public schools at a district level (Bettinger, 2005; Bifulco et al., 2009; Garcia, 2008; Reback, 2008). And there is growing evidence that traditional public schools are likely to face budget cuts when charter schools open in their districts (Arsen & Ni, 2012; DeAngelis & Barnard, 2021; Jones, 2018). However, school districts are often geographically large, and individual school districts often lack discretion over whether and where charter schools will emerge. The intra-district spatial competition for students between charter and traditional public schools has not been examined, meaning we know very little about the nature of spatial competition for enrollment between charters and traditional public schools within districts. Because of this, traditional public schools and school districts have little ability to plan for enrollment changes in the face of charter school openings and expansions. This is vital—in the extreme, traditional public schools face closures if charter growth pulls enough students.
Further, examining changes in traditional public school enrollments provides a window into whether and how charter schools may affect neighborhood change. Given the well-established connection between school locations, property values, and residential location decision-making (Bayer et al., 2007; Davis & Oakley, 2013; DeSena & Ansalone, 2009; Hankins, 2007), changes in the composition and enrollment of traditional public schools geographically adjacent to opening charter schools can tell us how charters may be affecting neighborhood housing markets and demographics. Given the pace of neighborhood change in cities like Los Angeles in recent decades, we need to examine the role that charter schools may play in accelerating such change. While we do not directly test those effects in this paper, we can inform a set of hypotheses given the centrality of schools in the residential decision-making process.
In this paper we assess the effects of charter school openings and closings on traditional public school enrollments and demographics using data from Los Angeles. To do this, we use data including the point location, enrollments, and demographics (race, ethnicity and percent receiving free or reduced price lunch) for all LAUSD charter schools and traditional public schools annually from 1999 to 2013. Using a distance-decay function, we create indices that estimate the extent of charter school competition near every LAUSD traditional public school in a given year. We then estimate models that quantify how traditional public school enrollments are affected by charter school openings and enrollment changes. We also estimate competition within particular demographic groups, including race, ethnicity, and students receiving free or reduced price lunch.
We find consistent evidence that traditional public school enrollments clearly decline concurrent to charter schools opening nearby. However, we also observe that charter schools tend to locate where traditional public school enrollments are on the decline. There is a two-way relationship between TPS enrollment declines and charter school enrollments. The associations are strongest at the elementary school level, where we estimate that a one standard deviation increase in nearby charter school enrollments is associated with 45 fewer TPS enrollments at that school. The links are also statistically significant for middle and high schools in most models. The differences between elementary and secondary schools likely reflects how students travel longer distances for school as they become older, making neighborhood school locations less crucial. However, this clearly shows that neighborhood schooling is still very typical, particularly at the elementary school level. We also find that these associations hold for particular racial groups—the Black student population decreases at traditional public schools that see large increases in the Black population at neighboring charter schools, for example—and those receiving free and reduced-price lunches. We also find that TPS enrollments decline most where TPS have higher minority populations. Competition is more relevant for elementary schools at short distances—within about 1 mi appears to be where the associations between charter school enrollments and TPS enrollment declines are the strongest. For middle and high schools, those connections are apparent within 2 to 6 mi in some models.
Research Context
While charter schools have exploded in number across the country, their placement is not random. In fact, the majority of charters are located in just five states: Arizona, California, Florida, Ohio, and Texas. As of 2015, over half of charter schools nationwide were located in urban areas, 26% were located in suburban areas and 17% in small towns and rural areas (vs. 29% for traditional public schools) (Pendergrass, 2018). Within urban areas, research shows that charter schools frequently locate near, but not always within, the highest-need census tracts. For example, Hoxby and Murarka (2009) find that charters are more likely to locate in disadvantaged neighborhoods in New York City—on average, incomes are lower and the share of disadvantaged racial groups and people living in poverty is higher. In Michigan and California, Glomm et al. (2005) find that more charters locate where households are more diverse by race and adult educational attainment. They also find that the quality of traditional public schools appears to play a significant role in charter school locations. Gulosino and d’Entremont (2011) look at school districts and block groups in New Jersey where charter schools were open as of the 2006-07 school year and finds that the block groups where charter schools were located had significantly lower percentages of African-American students than the surrounding school district. However, those charter school locations tended to be adjacent to African-American neighborhoods. Using our data in Los Angeles, we confirm that charter schools are more likely to open in relatively disadvantaged areas—census tracts with charter schools have a median tract income that is $13,000 less than census tracts without them.
Charter School Performance
Given the recent explosion in the number of charter schools in the United States, they are the subject of several studies, chiefly focused on their educational efficacy. A review of this scholarship is outside the scope of this paper. However, a brief summary of studies that compare charter and traditional public school effectiveness is warranted, given parent perceptions of comparative quality between the two types of schooling options will drive the nature of spatial competition. In all, the results are decidedly mixed—whether charter or traditional public schools are find to be more effective depend on the student population, location, research methodology, and operator of the charter schools, among other factors.
The Center for Research on Education Outcomes (CREDO, 2009, 2013) at Stanford University has produced two major, national reports—one in 2009 and a follow up report in 2013—on student performance in charter schools versus TPS. CREDO also regularly produces state-specific reports on charter school outcomes. The 2009 study includes data from 15 states and the District of Colombia, creating a sample that represented more than 70% of all charter school students nationwide. To measure differences in student performance in charters versus TPS, CREDO matched TPS and charter students (including 84% of all charter students at the time) based on demographic, educational, and socioeconomic characteristics. They find no evidence that charter schools improve public school students’ performance. State-by-state comparisons showed similar results. In California, charters outperformed TPS in reading achievement, but performed more poorly in math.
The 2013 report expanded to include 27 states and accounted for 95% of charter school students nationwide. CREDO find that reading and math results show improvement in charter schools compared to the 2009 report. Charters outperform TPS in reading, and were comparable to TPS in math.
Angrist et al. (2012) look at whether higher test scores for charter school students than traditional public school students may be the product of selection bias. This is in response to accusations that charters target more motivated students at the expense of more difficult to teach students. They focus specifically on Knowledge is Power Program (KIPP) schools in Massachusetts. To control for selection bias, they use data on students that entered applicant lotteries and compare students who randomly gained admission and students who did not. Their results show gains in test scores independent of race, ethnicity, limited English proficiency, or special education needs. For these groups, as well as students who entered charters with low test scores, the effect on scores is particularly large. An important caveat is that lottery studies may only involve the best charter schools, since those are the high demand schools that warrant a lottery.
Location also matters. Dynarski (2015) summarizes related lottery studies from Massachusetts (e.g., Abdulkadiroglu et al., 2011; Angrist et al., 2013). She concludes that charter schools are more likely to add value in urban schools that serve a nonwhite, lower income population. In suburban districts, there is very little evidence that charter schools have done better than existing traditional public schools, and in some cases, they have performed worse.
School quality comparisons at the neighborhood level are particularly important for our inquiry, as we need to know whether households can expect that a local charter school opening will provide a better option than the traditional public schools that already exist in their neighborhoods. Logan and Burdick-Will (2016) look at test scores in relation to poverty concentration and racial composition and find that for students in high-poverty areas, attending a charter means attending a better performing school, while the opposite is true for students in low-poverty areas. However, they find that the educational disadvantages for Black and Latino students are only slightly offset by attending a charter.
Competition
While very few studies look directly at the question of spatial enrollment competition, several studies examine what happens in traditional public schools when charters open. These studies tend to look at student achievement and demographics, segregation and integration in traditional public schools. There is no clear pattern or consensus in the literature on the effects of charter school openings on student achievement in traditional public schools. Bettinger (2005) finds that in Michigan, charters have had no significant effect on the test scores of students in neighboring traditional public schools. Booker et al. (2008) find the opposite trend in Texas. Using an 8-year panel dataset and controlling for demographics, peer group, and family background characteristics, they find a positive relationship between charter school openings and traditional public school student outcomes.
Bifulco and Ladd (2006) examine the impacts of charter schools on student achievement for students that transfer to charters and to those that remain in existing TPS. They find that students that move to charter schools experience statistically significantly smaller gains in test scores than had they remained in TPS. Further, they find that students remaining in TPS within 2.5 mi of charter schools experience a reduction in reading scores, but not math scores. In other words, the charter school-based competition for TPS left students in those TPS worse off, which Bifulco and Ladd theorize is due to increased student turnover. However, the authors questioned whether charter schools actually served as strong competitors for TPS in North Carolina at the time of the study, and therefore may not have provided a conclusive test of the potential effects of competition.
Winters (2012) uses data from New York City to look at charter school exposure to TPS, which he defines as the percentage of TPS students who moved to charters at the end of the previous year. He finds that TPS with greater exposure are unaffected by charter competition or see a small increase in math and English achievement. In other words, Winters finds that losing students to charter schools may not be an entirely bad thing for remaining TPS students. These findings are echoed in New York City by Cordes (2018), who analyzes the timing of charter school openings, distance to the nearest charter school, and co-location of charters in TPS. She finds that charters increase the performance of TPS students in English and math while decreasing the probability of grade retention. In her models, these effects increase with charter school proximity, in particular in TPS with co-located charters.
A series of RAND Corporation studies by Zimmer and Buddin (2005, 2006, 2007, 2009) and Zimmer et al. (2009a, 2009b) examine charter school effects on achievement, attainment, integration, and competition between TPS and charters. In their review of existing studies, they find mixed effects on public schools resulting from charter school growth. Ladd and Singleton (2020) look at the effects charters have on funding for traditional public schools in one urban and two non-urban school districts in North Carolina. They find a negative effect on per pupil traditional public school funding associated with the funding of charter schools in both contexts.
An important motivation for our study is the growing body of evidence that shows how traditional public school budgets are affected by charter school openings. As DeAngelis and Barnard (2021) suggest, these effects are theoretically ambiguous. On one hand, administrators may spend more money on traditional public schools to compete with incoming charter schools. On the other hand, uncertainty about future enrollments may lead administrators to restrict spending. DeAngelis & Barnard conduct an experiment using a survey of Texas school administrators. The treatment is a hypothetical charter school opening in a district. They find strong evidence that the expectation of an additional charter school reduces planned spending on traditional public schools. In Michigan, Arsen and Ni (2012) find that charter school competition creates additional fiscal stress in school districts in Michigan. In an analysis of revenue and charter school data from several states, Jones (2018) finds that school districts have marginally lower revenues as charter schools move closer to (or into) their districts. Taken together, there is strong preliminary evidence that the continued growth of charter schools is likely to reduce traditional public school budgets.
TPS Demographics, Segregation, and Integration
A few papers examine the relationship between charter schools and demographic shifts in traditional public schools, focusing on segregation by race and income. Stein (2015) tracks individual students who move to charter schools from traditional public schools in Indianapolis. Indiana has a very permissive school choice environment, which allows Stein several data points to examine demographic shifts across charter and traditional public schools. Although he finds that students of all racial groups move in and out of charter schools during this time, students tend to enter charter schools that contain students of their own racial group. Due to this, Stein find that charter school choice in Indianapolis increased racial isolation and reduced racial diversity within schools.
Ritter et al. (2016) examine charter school effects on integration in the Little Rock metropolitan area. They find that charters are less likely, though only slightly, to be “hyper-segregated” than traditional public schools. Like Stein (2015), they track individual students; however, unlike Stein, they find that transfers to charters improve integration levels at the schools students depart. They attribute this to students of color mostly leaving schools with predominantly students of color and white students leaving predominantly white schools.
In Delaware, a court-ordered busing program implemented in 1975 was halted in 1995, and accompanied by wider latitude for school choice and growth in charter school options. Archbald et al. (2018) examine enrollment patterns in five different school districts in Delaware and find that segregation by race and income between schools accelerated after choice policies were implemented. Although school segregation likely would have increased simply as a result of the end of the busing program, they, unfortunately, find that charter schools accelerated this growth.
Using a large national sample, Bischoff and Tach (2018) explore charter school effects on the demographic similarities between traditional public schools and their surrounding neighborhoods. They find that in neighborhoods with greater income inequality and ethnoracial diversity, the presence of educational alternatives such as charter schools makes neighborhood schools less demographically representative of the surrounding neighborhood. Additionally, they find that urban schools are less demographically similar to their neighborhoods than suburban ones. Their findings are not only specific to charter schools, as they include magnet and private schools as well.
What has not been explored to date is the spatial nature of competition between charters and traditional public schools within school districts. This paper focuses on this gap, using sophisticated measures for spatial competition for student enrollment.
Data
To assess the spatial competition for students between emerging charter schools and existing traditional public schools, we obtained administrative records from the California Department of Education (CDE) from 2000 to 2013 for all LAUSD traditional public schools. We appended this to data on charter schools in the LAUSD catchment area from the LAUSD Charter Schools Division. Together, these data include point location (X/Y coordinates), level 1 (elementary, middle, and high), enrollments, and Academic Performance Index (API) for all charter schools 2 and traditional public schools, in addition to demographics for enrolled students (including race, migrant status, and participation in Free or Reduced Price Meal programs). We also use data on opening and closing dates for each school.
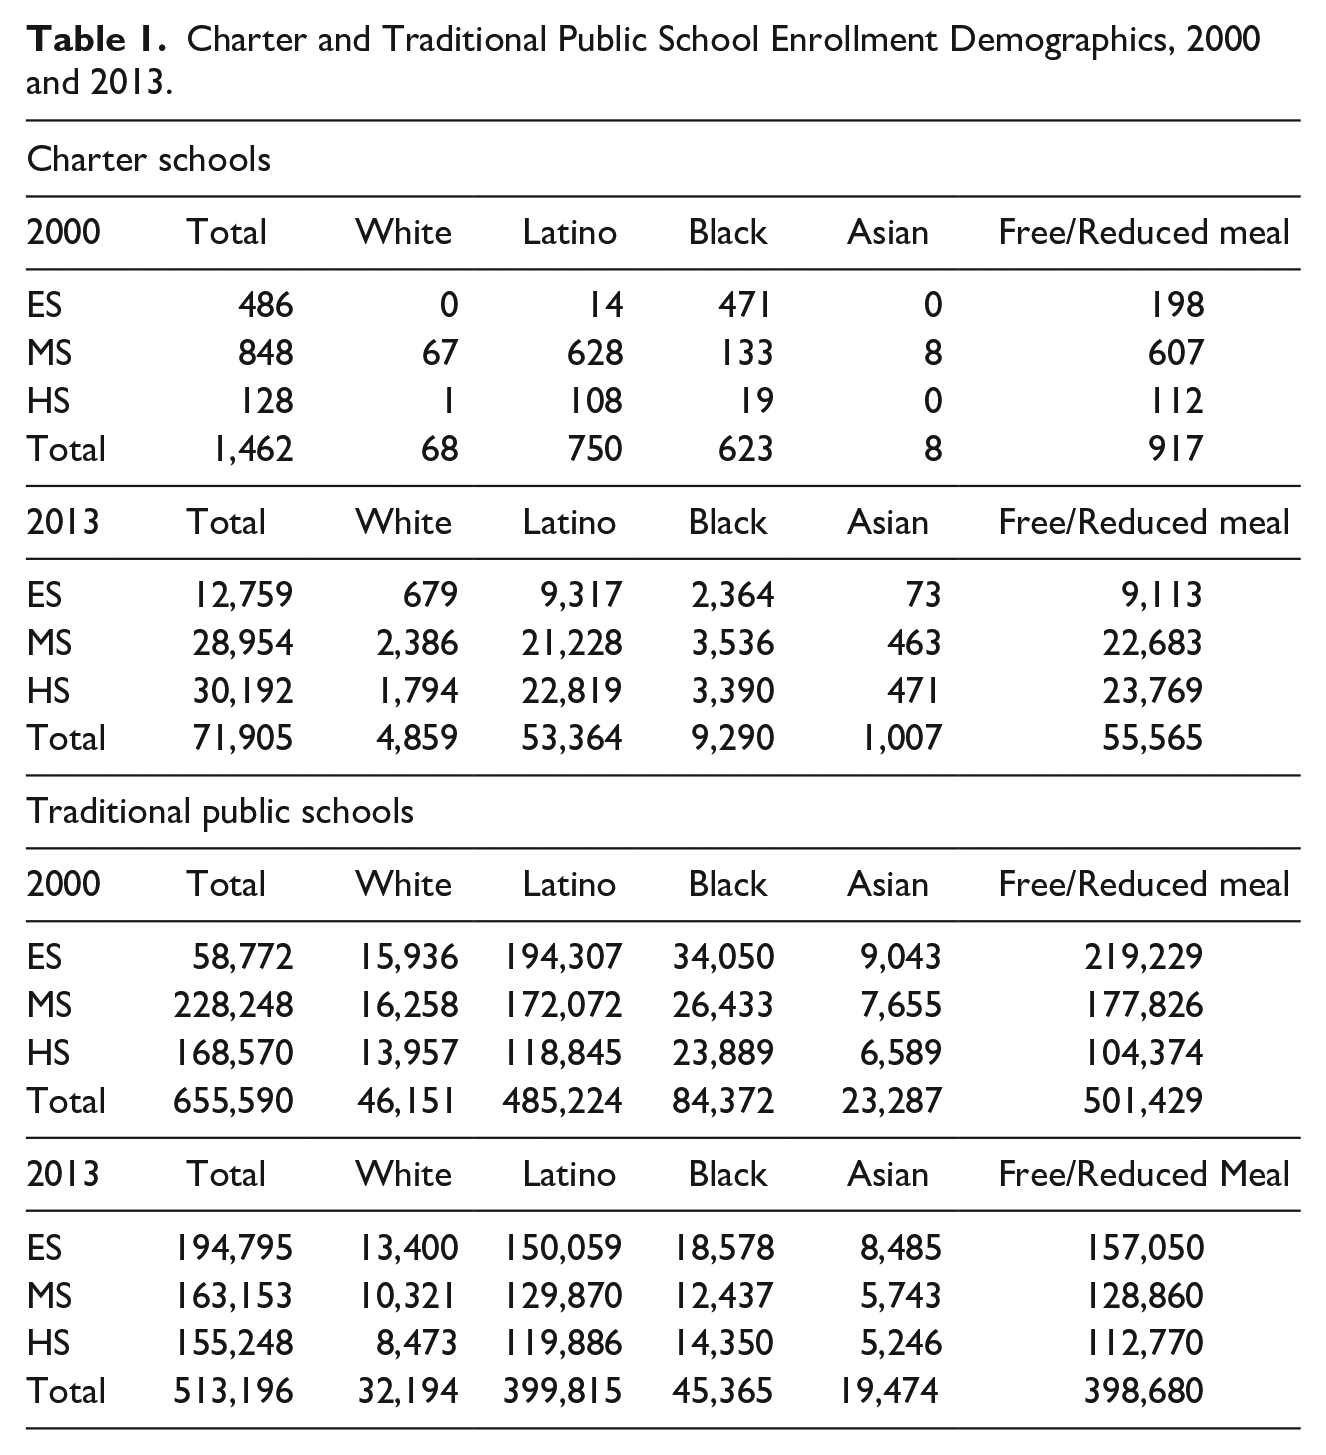
Our dataset includes 731 traditional public schools open as of 2013. This includes 338 elementary schools, 207 middle schools, and 186 high schools. Table 1 displays enrollments in charter schools (elementary, middle, and high), in Los Angeles, highlighting the explosive growth in these schools during the study period. Appendix A1 shows the number of elementary, middle and high traditional and charter schools by year. Table 1 also displays the decline of traditional public school enrollments during that time period. 3 In 2013, charter schools enrolled 10% of all LAUSD students. LAUSD currently enrolls more than 640,000 students annually, and is the second largest school district in the nation.
Charter and Traditional Public School Enrollment Demographics, 2000 and 2013.
Methods
The first analytic step is to create a measure that estimates the extent of charter school competition for a given traditional public school (i) in a given year (t). To do this, we use a distance-decay function that weighs the enrollment of a charter school near a traditional public school of the same level in inverse proportion to its distance from that traditional public school. In other words, the decay function discounts open charter schools—and their enrollments—if they are farther away, up to a distance of 15 mi. We assume that charter school enrollments 15 mi away or more have no meaningful effects on traditional public school enrollments. This is an arbitrary line to draw, but such arbitrary decisions are inevitable given a lack of microdata to paint a clearer picture of how far households are willing to travel for schools. Further, the decay function heavily discounts charter schools that are farther away, meaning the 15 mi boundary line does not have much impact. The steepness of the decay is another arbitrary decision but is supported by what little survey data we have, which largely comes from the National Household Transportation Survey (NHTS). Specifically, the decay function takes the following form:

Here, Compit is the distance-weighted competition from charter schools for each traditional public school (i) in year (t). Enrolljt is the enrollment of charter school j in year t, and dijt is the distance between a traditional public school and every charter school within 15 mi.
While the selection of a distance decay parameter is inevitably arbitrary, we are confident that our weights are sensible after comparing them to two sources of data. First, survey data from the NHTS tells us a few things about the distance traveled to school across the U.S. These numbers are certainly different in Los Angeles due to the extreme density and traffic patterns when compared to most of the U.S. The typical LAUSD student probably travels shorter distances (but relatively similar durations) than students in the rest of the country. With that caveat in mind, we note that the 2009 NHTS reported that the nationwide average distance traveled to school or church was 6.3 mi (Santos et al., 2011). To get a sense of the distribution across spatial categories, we produced a frequency table of the reported distance in miles between 2017 NHTS survey respondents’ home and school locations. We observed that approximately 19% of respondents were between 0 and 1 mi from their school, an additional 20% were between 1 and 2 mi, and 15% were between 2 and 3 mi. In all, about 72% reported traveling to schools that were less than 5 mi from their homes.
A more localized view of distances traveled to school comes from Schlossberg et al. (2006). In a study of two communities in Oregon—Springfield and Bend—they find that only 17.8% of students travel more than 3.5 mi to school. These communities, which total approximately 135,000 people compared to over four million in Los Angeles, with population densities around one-fourth of what is found in Los Angeles, are obviously not perfect comparisons. But, the stark differences between these two Oregon cities and Los Angeles suggest potentially offsetting differences in typical school travel distances. On the one hand, the geography covered by LAUSD is vastly larger—almost 10 times the size. On the other, the substantially larger population density leads to more school options closer by.
Finally, we have the LAUSD attendance boundaries to consult in determining how school competition recedes with distance. Using shapefiles from LAUSD, we observe that the radius of the average attendance boundary increases at each school level. Means, standard deviations, and quartiles are reported for attendance boundaries in Appendix A3. For elementary schools, the average radius is 0.5 mi, which increases to 0.8 mi for middle schools, and to 1.29 mi for high schools. School attendance areas are still relatively small even at the high school level—the radius of the 75th percentile attendance area is 1.72 mi. Given all these data, we feel comfortable that our preferred distance decay function has a steeper distance decay the higher the level of education, and that these weights largely reflect how people travel to school on a daily basis, despite the heterogeneous travel preferences in cities such as Los Angeles. When we change our decay parameters and use simpler distance decay functions such as
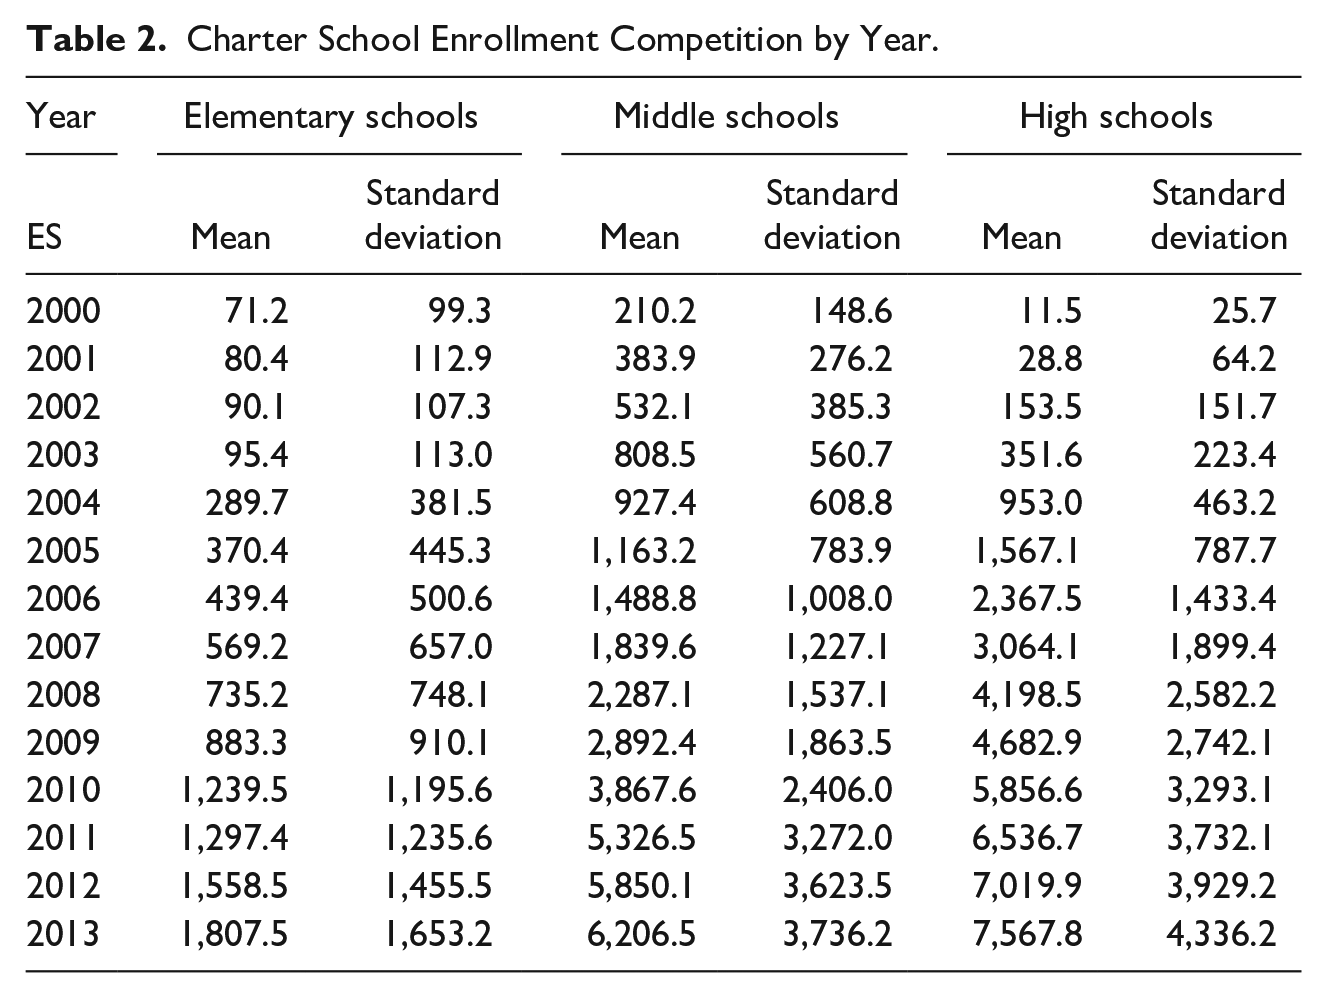
Using these weights and the resulting measures of spatial competition from charters for each traditional public school, we first produce estimates of the enrollment competition coming from charter schools for the average traditional public school and report those for the 2000 to 2013 period in Table 2. The explosive growth in charter school enrollments is clear. We then estimate simple regression models of the following form:

Where TPSEnrollit is the enrollment of TPS i in year t, Compit is the distance-weighted enrollment from equation (1), and TPS and year are TPS and year fixed effects respectively. We estimate models separately for each school level (elementary, middle, and high) and for total enrollment, White enrollment, Asian enrollment, Hispanic/Latino enrollment, Black enrollment, and enrollment of students receiving free and reduced-price lunch. Standard errors are clustered at the school level.
Charter School Enrollment Competition by Year.
Results
Table 3 summarizes the findings from our model with all students included, regardless of race, ethnicity, or free/reduced lunch status. Here, we find that in elementary, middle, and high schools separately, as well as in an aggregate model of all school types, that as nearby charter school enrollments rise, traditional public school enrollments fall. Given that the distance-weighting of the charter school enrollments makes it difficult to interpret the size of these coefficients, it is useful to look at what a one standard deviation increase in charter school enrollments might do to TPS enrollments. For elementary schools, the coefficient is −0.09 and statistically significant at the 1% level. The standard deviation in 2006 (one of the midpoint years in the data period) was 500.6. At a standard deviation of 500.6, we estimate that a one standard deviation increase in nearby charter school enrollments is associated with 45 fewer TPS enrollments at that school. Another way to look at this is that from 2000 to 2013, the average elementary school experienced an increase of 1,736 nearby charter school enrollments. Such an increase is associated with 158 fewer students in that elementary school. The strongest effects are clearly for elementary schools, but this is complicated by the fact that we use a steeper distance decay for elementary schools than for middle and high. Thus, a charter school has to be nearer to a TPS to count as competition for traditional elementary schools, and the larger coefficient may reflect that fact—we have a tighter spatial band for elementary schools, and the correlations between charter school and TPS enrollments are perhaps higher as a result. But another way to interpret this is as confirmation that space matters more for elementary schools—charter schools very nearby serve as strong competition for students.
Primary Regression Results.
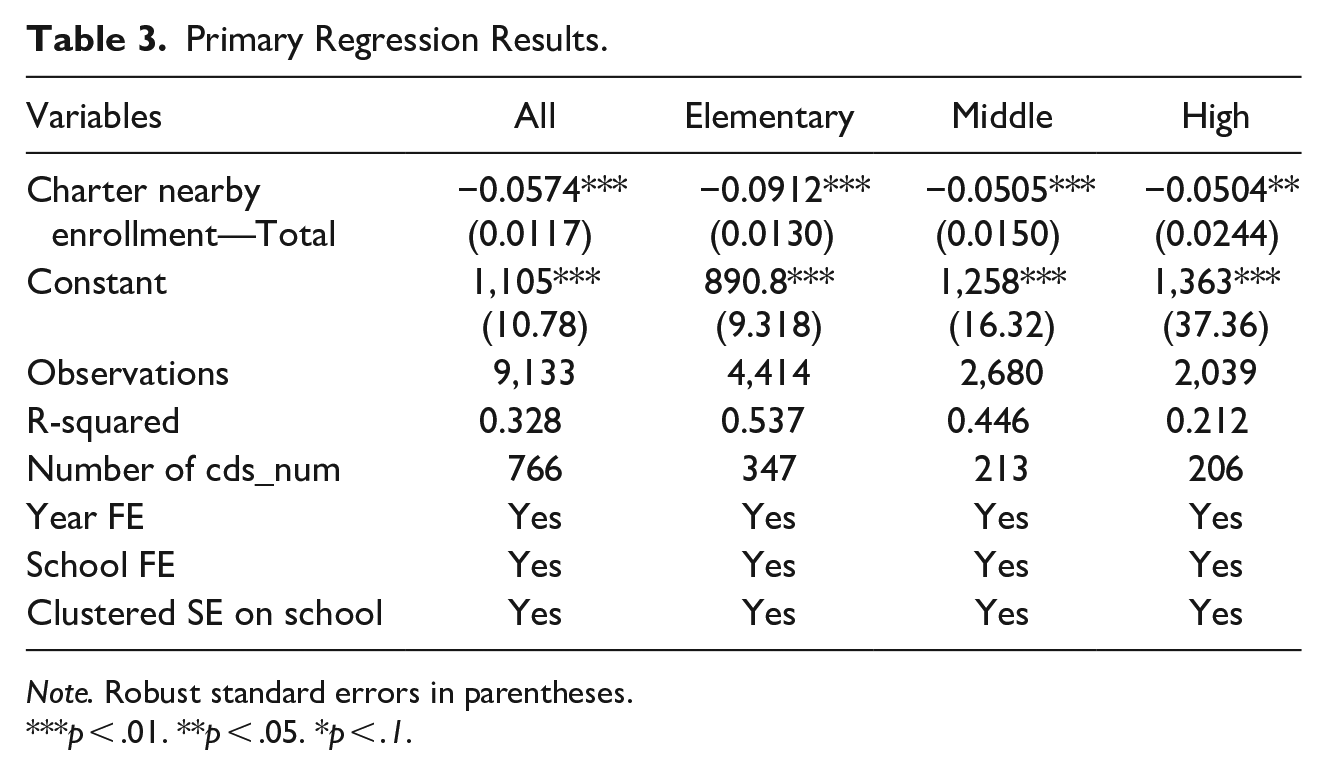
Note. Robust standard errors in parentheses.
p < .01. **p < .05. *p < .1.
Race and poverty are particularly important to consider in the context of charter schools. Research suggests that charter schools tend to locate adjacent to neighborhoods with high proportions of nonwhite students, perhaps to attract students from schools that are typically underperforming (Gulosino & D’entremont, 2011). Further, school segregation is something that charter schools could theoretically address—they may be able to loosen the grip between housing segregation and school segregation—but data suggests that charter schools are often more segregated than their traditional counterparts (Archbald et al., 2018; Stein, 2015).
We ran two sets of models to identify the racial nature of competition between charter schools and TPS. First, we ran demographic-specific models, the results of which are presented in Table 4. In these models, we make the independent and dependent variables race-specific, to test whether rising charter school enrollments of a particular racial group correspond to declining enrollments of that same racial group in a traditional public school. We did the same thing for students receiving free or reduced-price lunch. We find that in elementary schools, the effects are all statistically significant, and the effects are largest for Black and Asian students. The results are somewhat different in middle and high schools—the effects are not statistically significant for White or Asian students. Generally speaking, these results support the hypothesis that charter schools are pulling Black and Hispanic students from TPS, and likely from schools that have high proportions of these students.
Regression Coefficients for Competition for Specific Demographic Groups.
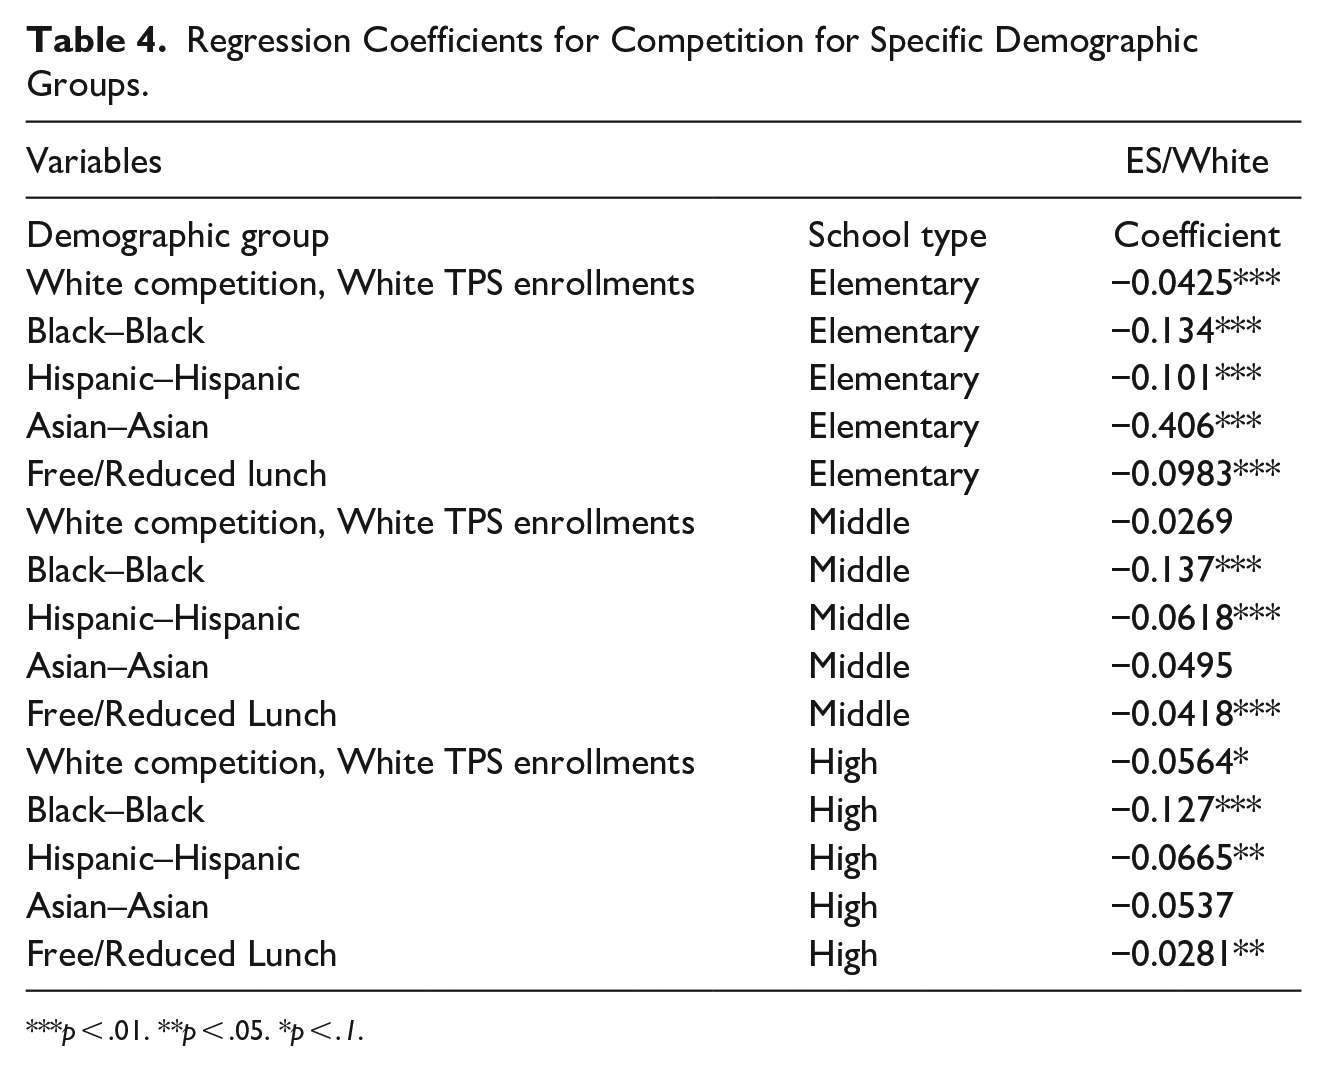
p < .01. **p < .05. *p < .1.
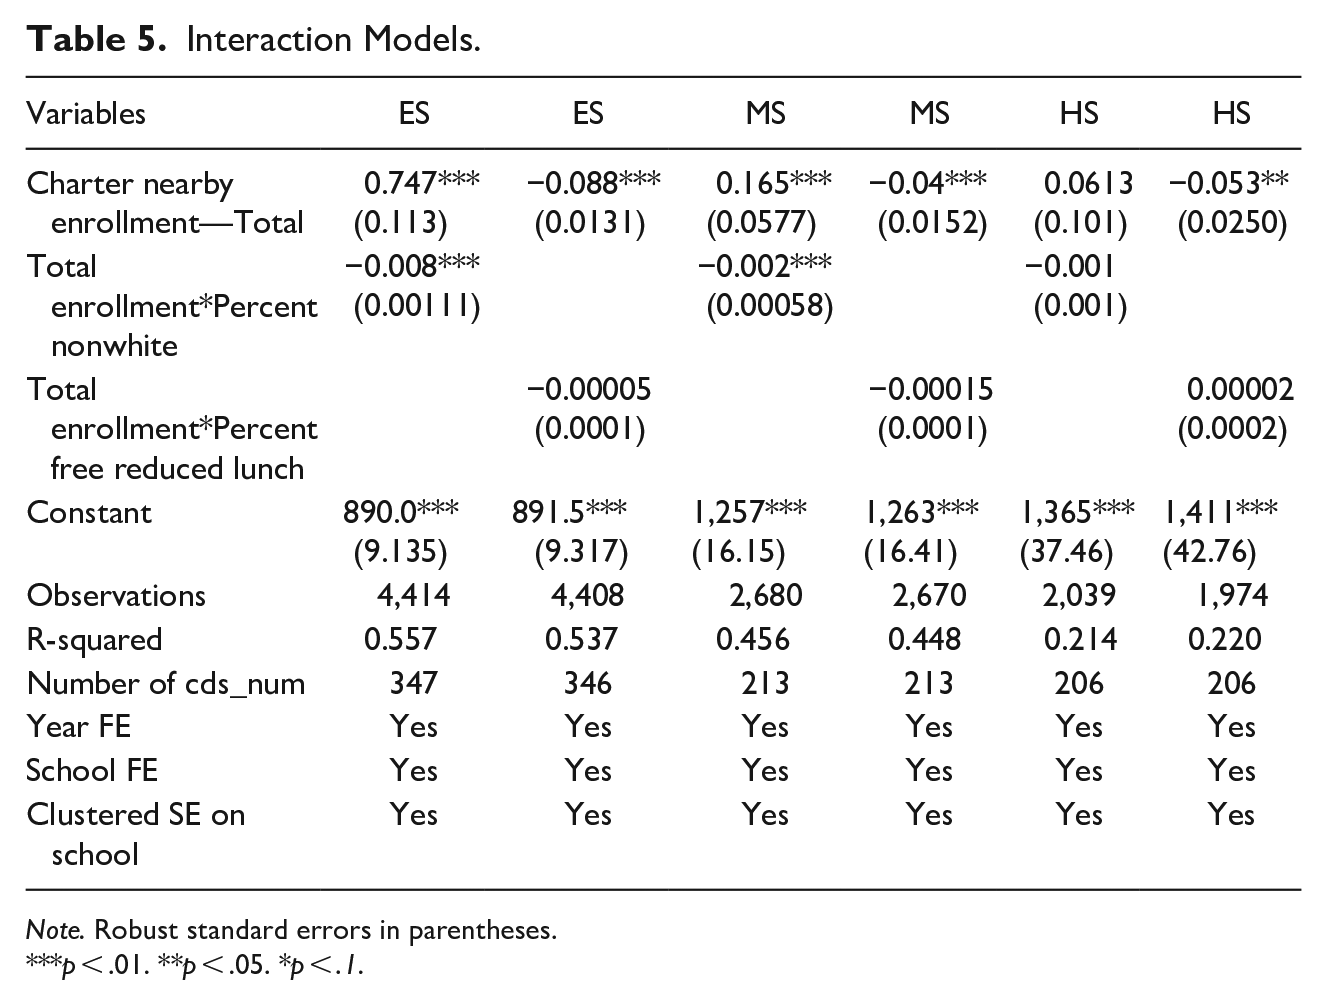
We test this last proposition directly using interaction terms between the baseline race and poverty characteristics of the TPS. Given the stigma surrounding schools with high proportions of racial minorities, we wanted to see if the charter school-based declines in TPS enrollments were higher in schools that were more nonwhite and higher in poverty. Table 5 presents results from models that test for an interaction effect between the baseline percent nonwhite (or percent free and reduced-price lunch) of the TPS and the total nearby charter school enrollment, separately for elementary, middle, and high schools. If the coefficient on the interaction terms (the second and third row of coefficients in the table) is significant and negative, it provides support for the hypothesis that nearby charter school enrollments have a stronger negative impact on TPS enrollments where those TPS populations are more nonwhite (or have a higher proportion of students receiving free or reduced-price lunch). We find support for a stronger enrollment decline in elementary and middle schools with a higher percent nonwhite, but not in high schools. We do not find any evidence for an interaction effect between free and reduced-price lunch receipt and enrollment declines—none of the coefficients are significant.
Interaction Models.
Note. Robust standard errors in parentheses.
p < .01. **p < .05. *p < .1.
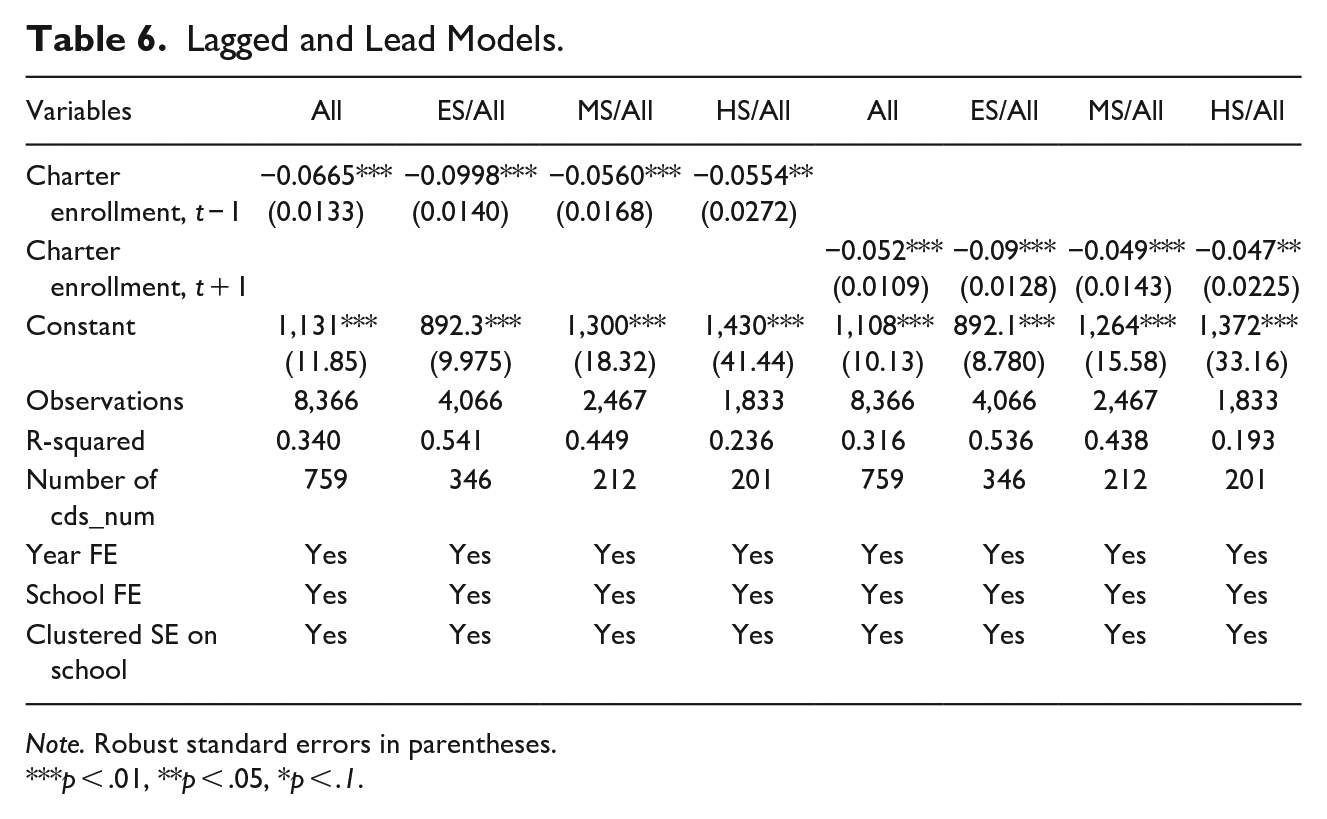
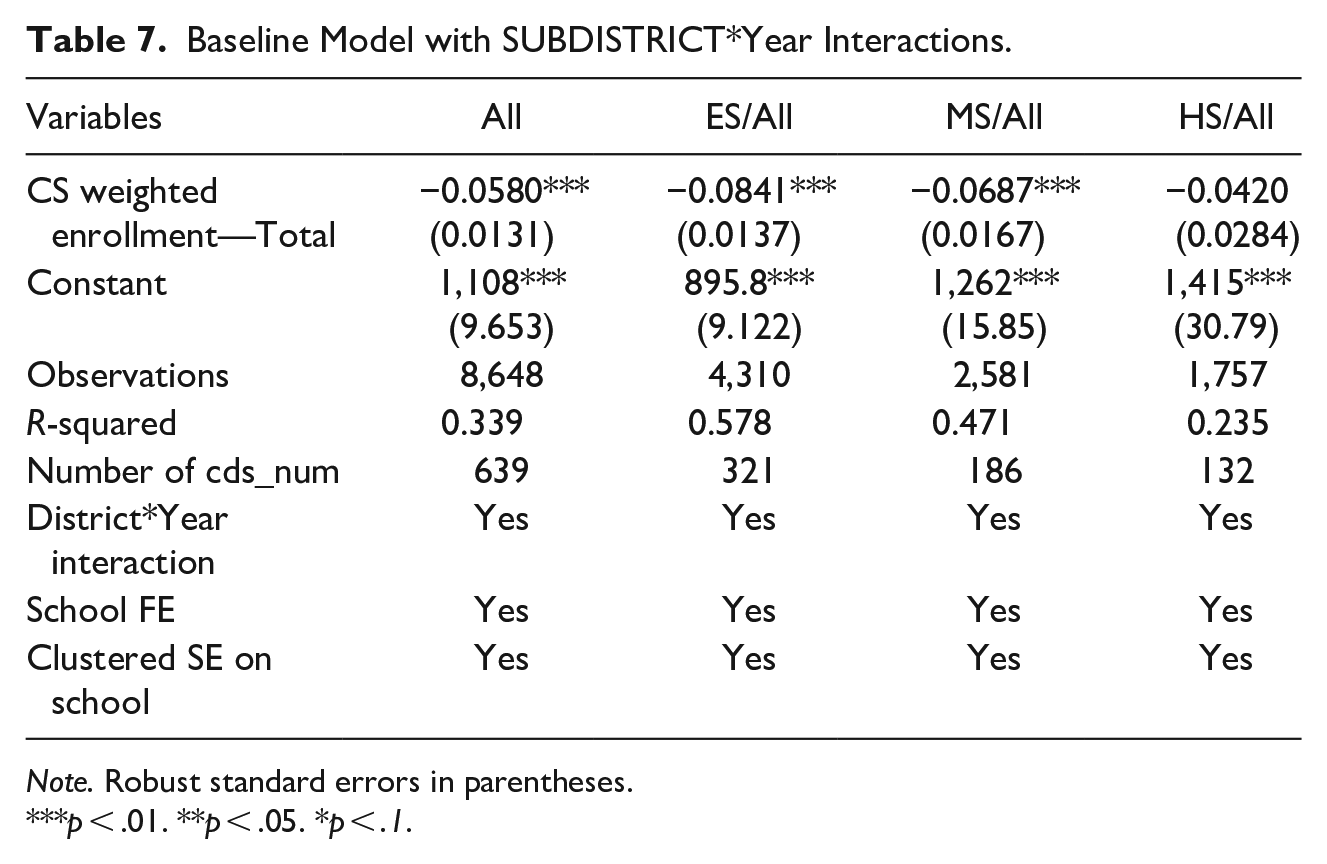
In all of the results reported thus far, there is a strong possibility that we are observing associations rather than causation. The most direct threat to causal inference is due to the possibility that charter schools could open in areas with declining TPS enrollments, and these enrollment declines are causing the presence of charter schools, rather than the charter schools causing the declining enrollment trends. In other words, causality can go both ways. Despite the fact that the panel data and fixed effects models control for the baseline enrollment characteristics and identify off of deviations from the mean, it is still possible that declining enrollment trends at the TPS level are not controlled for. To help diagnose whether the timing of charter school enrollments play a part in declining TPS enrollment numbers, we run two sets of models: one with nearby charter enrollments lagged 1 year and the other set in the future 1 year; the results are displayed in Table 6. If these results were causal, we would expect to perhaps see an effect from the lagged models, but no effect from future charter school enrollments, since something cannot be caused by a future change in the dependent variable. We find that the lag and future results are virtually identical, suggesting that despite the controls for time-invariant characteristics of the TPS and year-fixed effects that control for annual trends, there may be TPS-specific downward trends in enrollment that are independent of charter school enrollment increases. We provide two robustness checks to better isolate the effects of charter school enrollments. First, in Table 7, we control for subdistrict-specific time trends rather than time trends across the district. There are four subdistricts in Los Angeles, pictured in Figure 1. South LA is historically and persistently low-income and nonwhite. Downtown/East LA has a similar composition, though income has risen marginally and housing values are rising. The San Fernando Valley is solidly middle-income and majority Latino; however, white comprises the second-largest racial group. West LA is the wealthiest subdistrict and includes some of the most valuable real estate in the world.
Lagged and Lead Models.
Note. Robust standard errors in parentheses.
p < .01, **p < .05, *p < .1.
Baseline Model with SUBDISTRICT*Year Interactions.
Note. Robust standard errors in parentheses.
p < .01. **p < .05. *p < .1.
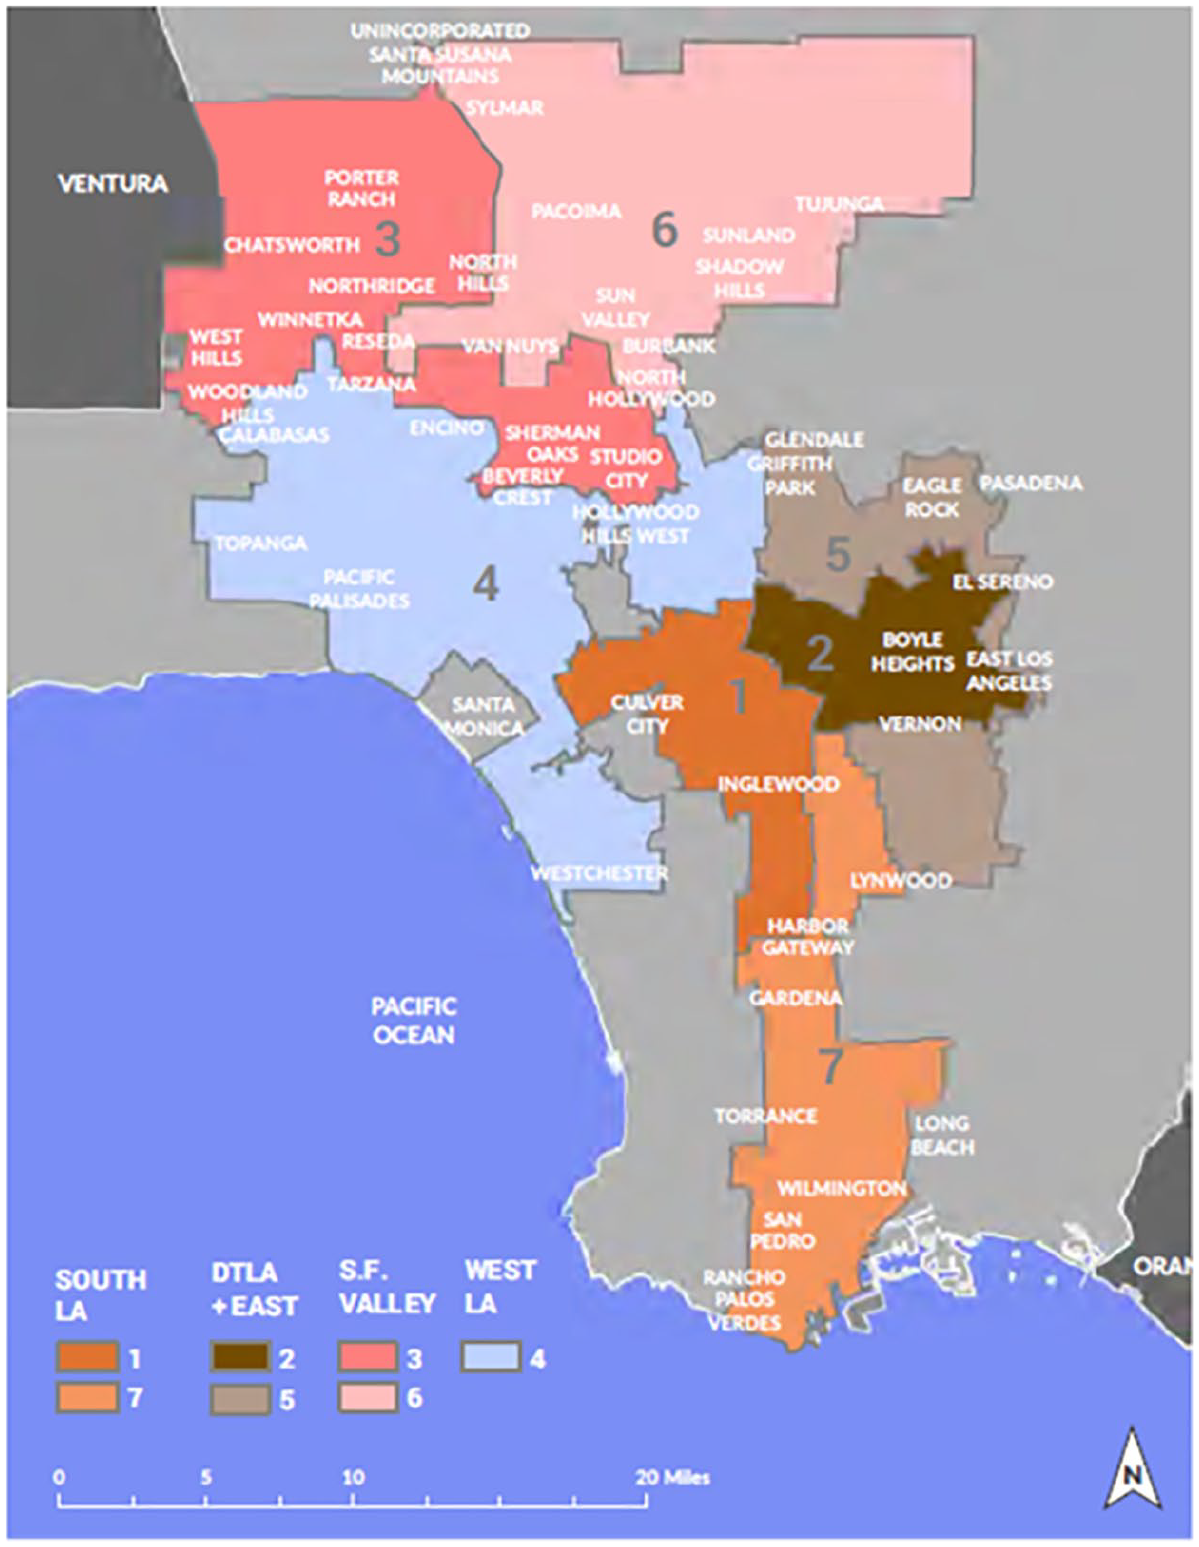
LAUSD subdistrict map.
The subdistrict is a good option for a smaller geography to control for a time trend, particularly given something as small as a zip code or census tract would squeeze out nearly all variation in the independent variable (distance-weighted charter school enrollments). After controlling for subdistrict-specific time trends, the results in Table 7 are very similar to the baseline results in the full sample of schools as well as elementary and middle schools (the coefficient in the elementary school sample is slightly smaller and in the middle school sample it is slightly larger), but the effect goes away for high schools.
The second way we try to better isolate the charter school effect is by estimating first difference models. We keep the fixed effects specification but add an additional control for time trends by regressing the change in TPS enrollments on the change in nearby charter school enrollments. These results are displayed in Table 8. While the magnitude of the coefficient declines—as do the R-squared values—the effect is statistically significant and negative in the full sample of schools, and elementary and middle schools, but again, not high schools. This tells us that although charter schools may be opening and expanding concurrently with secular declines in nearby TPS enrollments, years with large decreases in a TPS’s enrollment are also years with large increases in charter school enrollments. We take this as supporting evidence that annual changes in nearby charter school enrollment can cause enrollment declines for TPS. However, we cannot discount the fact that TPS enrollment declines also tend to influence charter schools to open near declining schools.
Change Models, Dependent Variable: Change in TPS Enrollment t − 1 to t.
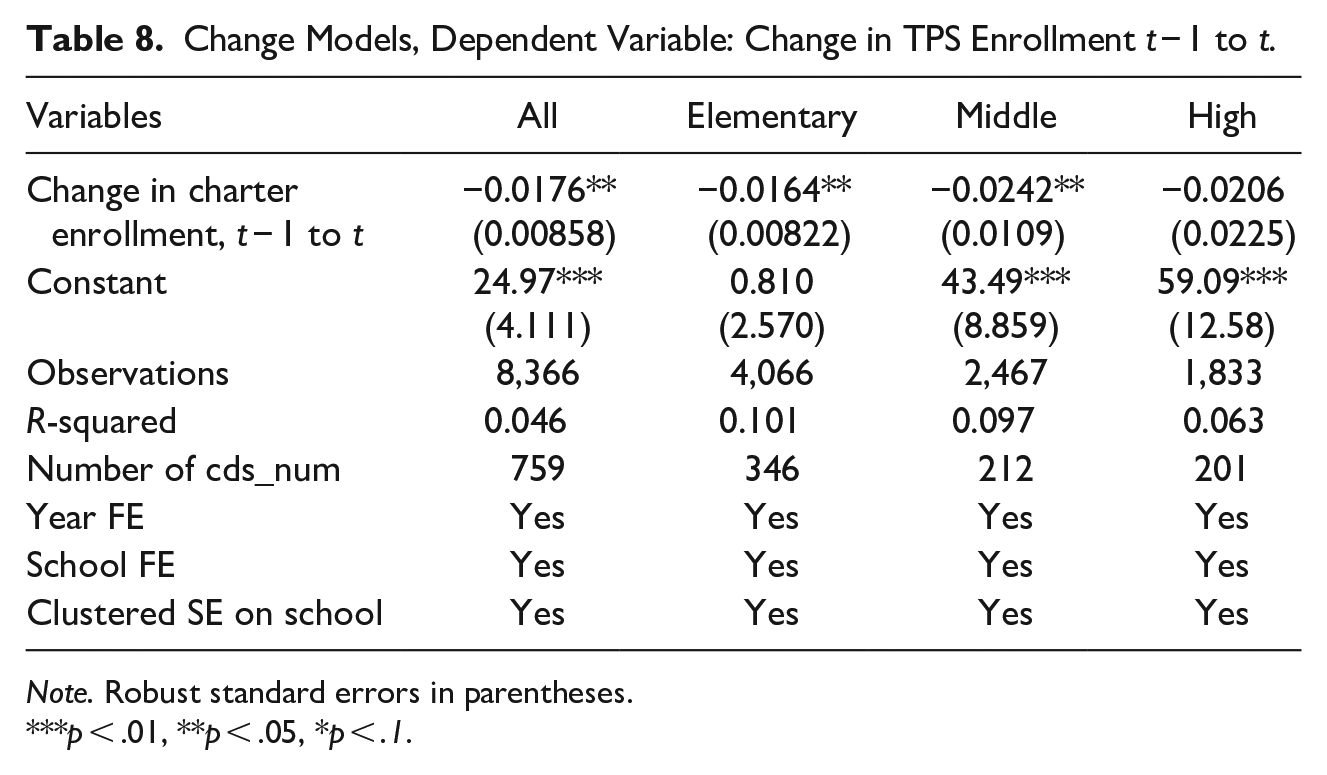
Note. Robust standard errors in parentheses.
p < .01, **p < .05, *p < .1.
Finally, we estimate a set of models that allows us to identify the distances that appear to matter for competition between charter and traditional public schools. We draw concentric rings around each traditional public school in Los Angeles, and estimate charter school enrollments in each of those concentric rings. These charter school enrollments are not distance-weighted. Here we again estimate change models—the change in traditional public school enrollments are regressed on the change in charter school enrollments in a series of concentric distance rings ranging from a 0.5 to 10 mi. Model results are provided in Table 9. In the full sample of schools, the connection between traditional and charter school enrollments dissipates after the 2 mi radius, as the coefficients are statistically significant and negative at the 1 and 2 mi distances. For elementary schools, that connection is only relevant within 1 mi. With middle schools, the enrollment decline effects are only weakly significant at any point, and that is through 2 mi. For high schools, the strongest negative relationships are at 2, 4, 6, and 10 mi, and there is a positive relationship at 9 mi. These results reflect our assumptions that elementary school students travel shorter distances and the charter school competition is likely to drive changes in elementary schools very close by—specifically, within a mile. For middle schools and high schools, the stronger enrollment connections are within 2 to 6 mi.
Change Models Within Distance Radii, Dependent Variable: Change in TPS Enrollment t − 1 to t.
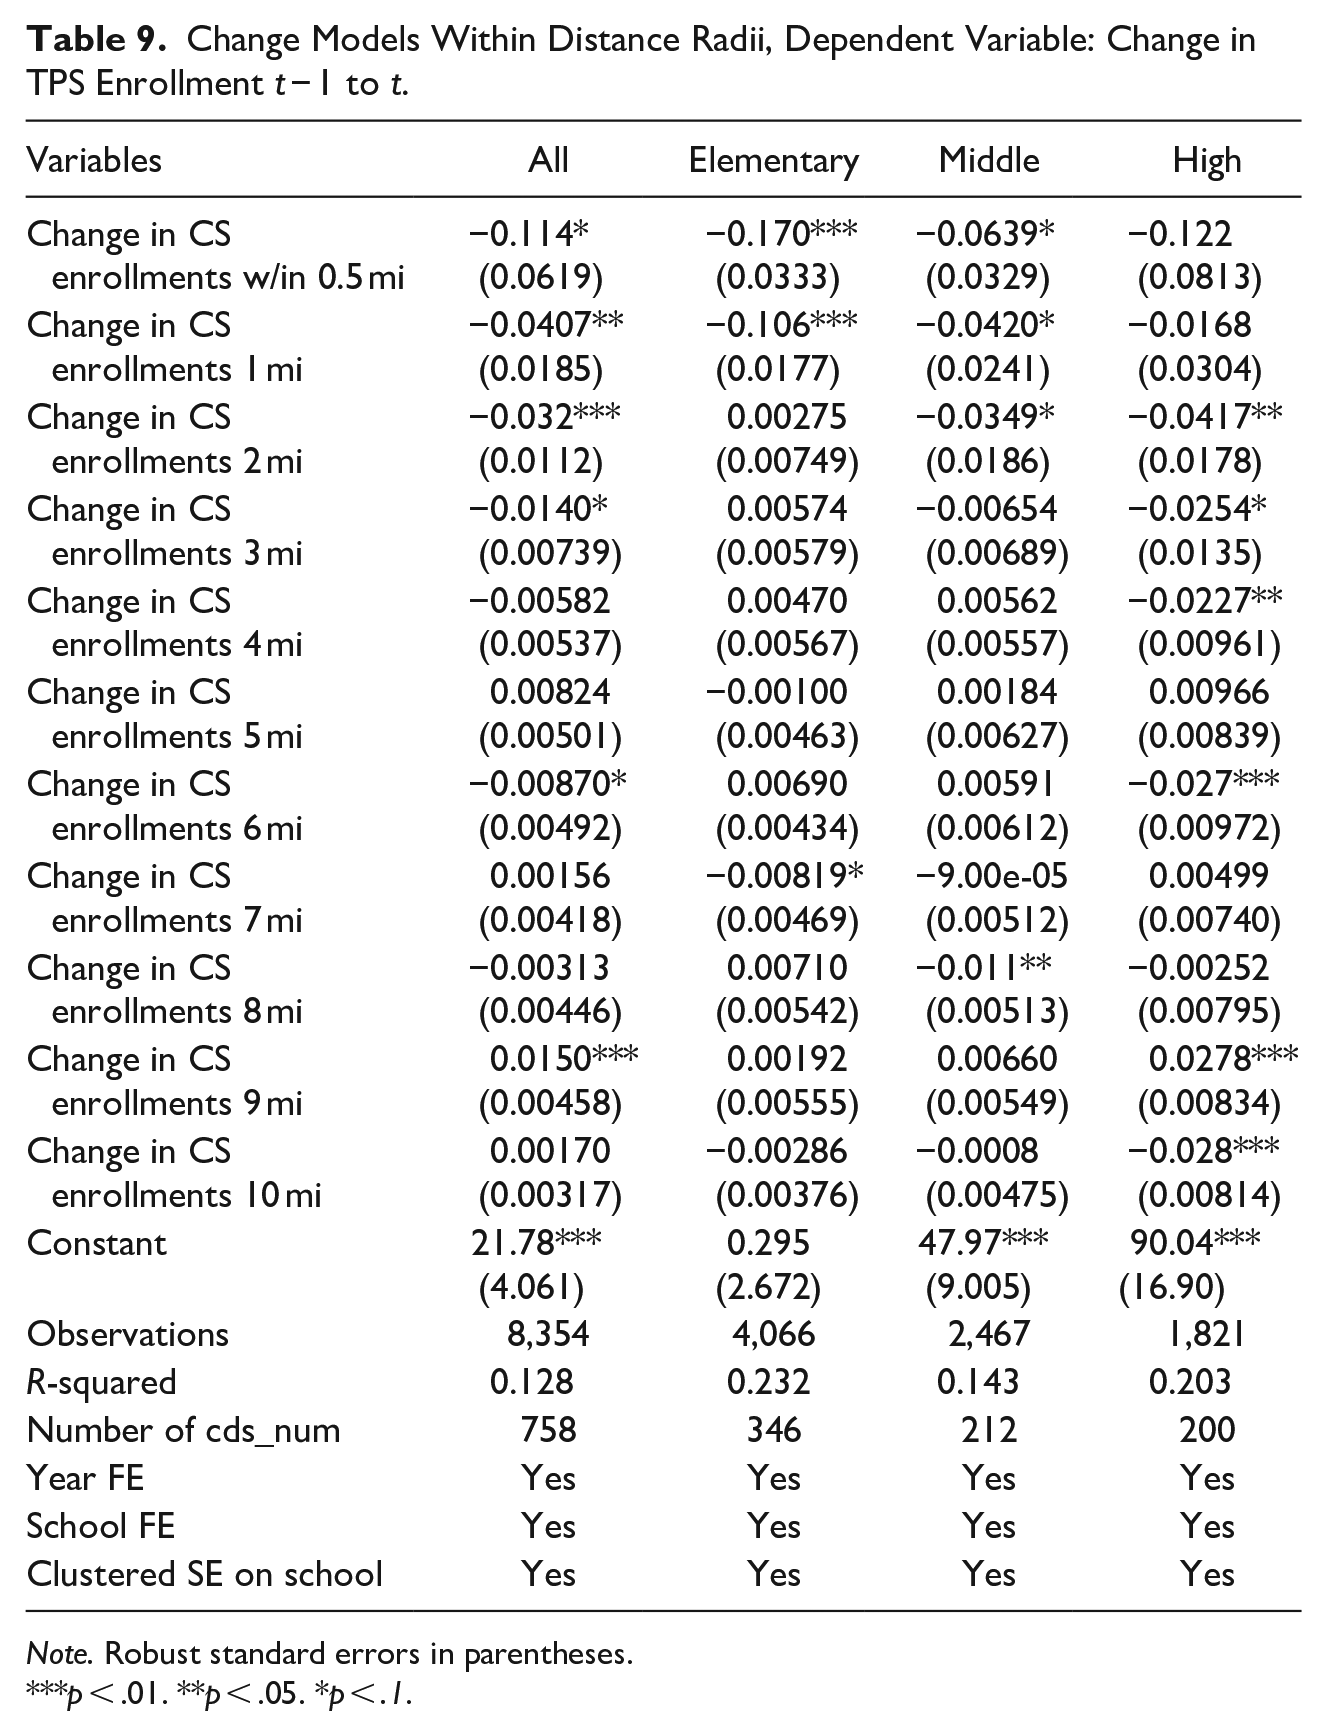
Note. Robust standard errors in parentheses.
p < .01. **p < .05. *p < .1.
Discussion
From 2000 to 2017, charter schools in the Los Angeles Unified School District increased from almost nothing to educating 24% of the students in the District. Through 2013, the time period under investigation in this paper, the number of students in TPS in Los Angeles declined by 142,000, with charter schools growing by half that much. Thus, while there are forces leading to enrollment declines in the District’s TPS beyond the presence of charter schools, the time trend suggests that charter school openings affected these declines. This paper examines the spatial competition between charter and traditional public schools at the neighborhood level.
We find substantial evidence that TPS enrollments decline most sharply as charter school enrollments increase, but the causal pathways are somewhat ambiguous. While it appears that increased charter school enrollments do indeed cause TPS enrollment declines, we also find that charter school enrollments rise after TPS enrollments declined, meaning that charter schools are more likely to open where TPS are struggling. The causal pathway is likely that charter schools target areas with struggling TPS, and opening charter schools cause a further drag on TPS enrollments. We find that these effects are strongest for elementary schools within a mile and for middle and elementary schools within 2 to 6 miles.
Whether or not school choice and competition among schools is a good thing for parents, students, and schooling outcomes more generally, declining enrollments have potentially negative ramifications. School closures produce negative stressors and given they typically occur in low-income areas, can exacerbate preexisting educational inequalities (Ewing, 2020; Kirshner et al., 2010). Regardless of the quality of the school, enrollment declines and closures are inevitably disruptive to students, staff, and the surrounding community. School administrators must be able to forecast potential enrollment declines resulting from nearby charter school openings, and this paper quantifies the extent to which such enrollment declines can be expected and where.
Footnotes
Appendix
Alternate Decay Function of
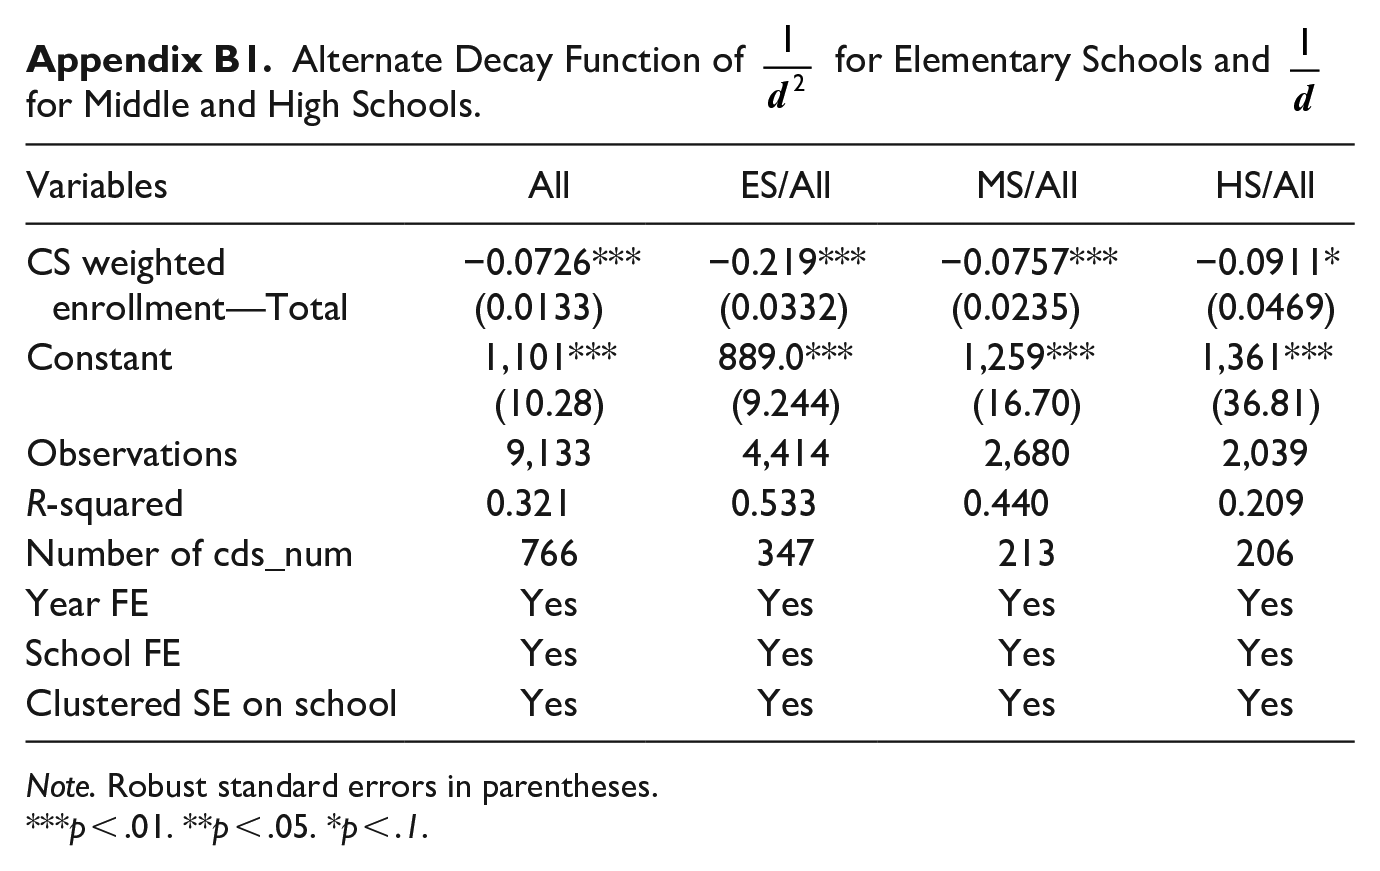
| Variables | All | ES/All | MS/All | HS/All |
|---|---|---|---|---|
| CS weighted enrollment—Total | −0.0726***(0.0133) | −0.219***(0.0332) | −0.0757***(0.0235) | −0.0911*(0.0469) |
| Constant | 1,101***(10.28) | 889.0***(9.244) | 1,259***(16.70) | 1,361***(36.81) |
| Observations | 9,133 | 4,414 | 2,680 | 2,039 |
| R-squared | 0.321 | 0.533 | 0.440 | 0.209 |
| Number of cds_num | 766 | 347 | 213 | 206 |
| Year FE | Yes | Yes | Yes | Yes |
| School FE | Yes | Yes | Yes | Yes |
| Clustered SE on school | Yes | Yes | Yes | Yes |
Note. Robust standard errors in parentheses.
p < .01. **p < .05. *p < .1.
Declaration of Conflicting Interests
The author(s) declared no potential conflicts of interest with respect to the research, authorship, and/or publication of this article.
Funding
The author(s) received no financial support for the research, authorship, and/or publication of this article.