
Abstract
Studies often explain differences in family behaviors by migration status by testing four hypotheses: socialization, selection, disruption, and assimilation/adaptation. These hypotheses were initially formulated as competing explanations, but some scholars have argued that they are complementary. Currently, however, this complementary relationship is not well understood. In this article, I draw on intersectionality theory to challenge this hypothesis-based narrative of the relationship between migration and family formation and dissolution trajectories. I use retrospective information on marriages, union dissolutions, and births of men and women from five waves of the National Survey of Family Growth (1995–2015) to construct a six-category typology of family trajectories. This typology divides men and women into groups with similar family formation and dissolution trajectories. I correlate this typology with information on each respondent’s race/ethnicity, educational attainment, place of birth, and age at migration. The exploratory analysis of these correlations underlines the need for approaches that move beyond testing the above-mentioned hypotheses toward nuanced descriptions of the multiple ways in which family formation and migration paths are intertwined, and how these relationships are influenced by gender and social class inequalities.
Introduction
Although migration, fertility, and partnership are intertwined, quantitative studies rarely examined them jointly. Instead, the relationship between migration and family formation is usually studied in one direction or the other (Bean et al., 1996; Kulu and Milewski, 2007). Moreover, these studies tend to concentrate on comparing mean levels of fertility and the timing of family formation by individuals’ country of origin, migration status, and migrant generation (Adserà and Ferrer, 2015; Kulu and González-Ferrer, 2014). These comparisons typically test the competing relevance of the socialization, selection, disruption, and assimilation/adaptation hypotheses regarding differences in family outcomes and trajectories between migrants and non-migrants (Kulu, 2005). Overview studies have concluded that competing hypotheses are complementary; why this is the case is still poorly understood. Albeit informative, the competing/complementary story seems insufficient, particularly when contrasted with qualitative evidence on the multiple relationships between migration and family formation (Herrera, 2013; Hondagneu-Sotelo, 1994).
According to some migration scholars, hypothesis-based approaches are limited because they refer to an abstract agent, namely, the ‘average migrant’, and therefore overlook the underpinning drivers of migrants’ demographic and social outcomes (De Haas, 2014; Garip, 2012). These studies suggest that differences in would-be migrants’ and migrants’ opportunity structures might contribute to the differential explanatory power of these hypotheses. Therefore, a holistic approach to migrants’ opportunity structure could help us understand the potential drivers of their demographic patterns in terms of family formation (Portes, 2010; Van Hear, 2014).
The present work explores the propensity of individuals to have followed certain family paths based jointly on their sex, race/ethnicity, educational attainment (as a proxy for social class), and age at migration, during the second half of the 20th century in the United States. This approach allows me to capture the structural role of gender and social class in shaping migrants’ opportunity structures, and therefore how they influence family formation and migration trajectories. My results challenge existing hypothesis-based narratives by revealing a more comprehensive spectrum of relationships between family and migration (i.e. beyond the experience of the ‘average migrant’) and the concrete groups underpinning these relationships, that is, men and women from a particular social class, with specific family and migration histories.
Besides advancing our knowledge on how migration and family relate, this study contributes an innovative approach to the quantitative analysis of family formation and migration, using an intersectional lens. Despite the growing number of studies using intersectionality theory, few examine family and migration using the appropriate methods (Bauer et al., 2021; Choo and Ferree, 2010). The present study makes an important contribution, given the increasing significance of migration in contemporary societies and the key role of family as a social institution.
Theoretical background
Complementary and competing hypotheses
Most studies on migration and family rely on four explanatory hypotheses regarding the differences in fertility and marriage/union formation outcomes by migration status: selection, socialization, disruption, and adaptation/assimilation (Dubuc, 2012; Kulu and González-Ferrer, 2014; Lindstrom et al., 2021; Parrado, 2015).
The first two hypotheses focus on conditions before migration, such as the family norms and values learned during childhood (socialization) or whether migrants have less family-oriented attitudes (selection). Scholars have attributed the higher fertility observed among African migrants in Spain (Castro-Martin and Rosero-Bixby, 2011) and Canada (Adserà and Ferrer, 2014) and Turkish migrants in Germany (Milewski, 2010) to the fact that their primary socialization occurred in contexts where families are relatively large. Similarly, given that international migration requires planning, it has been posited that individuals may choose to avoid childbearing or formalize an informal union with a partner before migration because childlessness and marriage facilitate emigration (Kulu, 2005).
The last two explanations emphasize that changing circumstances caused by migration can disrupt migrants’ family formation trajectories, but also that the living conditions at destination can prompt migrants to assimilate to the behaviors prevailing in the host society, thereby diminishing the overall impact of the initial disruption. The low fertility rates observed among Mexican men after migration to the United States have been linked to spousal absence and to high fertility rates after family reunification (Lindstrom and Giorguli Saucedo, 2002). Studies of fertility among migrants in Canada (Adserà and Ferrer, 2014), the United States (Parrado, 2011), Italy (Mussino and Strozza, 2012), France (Toulemon, 2004), and Sweden (Andersson, 2004) have found that migrants’ fertility rates tend to be lower in the years before migration, but their birth rate peaks within 5 years after their arrival.
Similar patterns have been reported for the marital dynamics of African and Latin American and Caribbean (LACar) migrants in Europe (Beauchemin et al., 2015; Cortina Trilla et al., 2009) and Mexican migrants in the United States (Parrado, 2004). This latter study showed that, for Mexican men in the United States, marriage is delayed and associated with circular migration, as men often need to return to their region of origin to find a partner. There is evidence that migrant women are more likely to marry a US-born individual than migrant men (Choi and Tienda, 2017). These sex-specific patterns influence the validity of disruption and assimilation hypotheses for marital dynamics, with the former being more likely to apply to men than women, and vice versa.
An intersectional lens to overcome theoretical limitations
The main limitation of these hypotheses-based studies is that they describe the experience of an abstract agent, the ‘average migrant’, and therefore tend to overlook the potential heterogeneity in the relationship between family formation and migration across migrant subgroups. Even if the evidence favors one hypothesis, such as assimilation, it would be hard to assert that all migrants adopt the prevailing family behavior of the host society. Moreover, since family trajectories are not homogeneous in either the origin or the destination countries, there may be multiple socialization influences and forms of assimilation beyond adaptation to the family practices of the majority, as well as different migration-related disruptions.
Acknowledging that these explanations are complementary rather than competing is not sufficient. To make a significant theoretical contribution to addressing this question, the drivers of this complementary relationship must be identified. I argue that the main drivers are intersecting gender and social class differences in the opportunity structure of family formation (intensity and timing) and migration (when and with what resources).
This argument implies a fundamental change in the way we study family and migration, moving from a hypothesis testing approach to a nuanced description of multiple family trajectories resulting from social class and gender inequalities. 1 This approach recognizes that the mechanisms of socialization, disruption, selection, and adaptation/assimilation play a role within the structural components of social class and gender relations. Although this statement could be read as a hypothesis, it is different from pre-existing formulations because it is grounded on structural concepts as opposed to behavioral ones. The research that emerges from this perspective is exploratory and it aims to describe the complexity of social processes rather than testing deductively defined mechanisms (Bourdieu, 2005, Introduction).
There are two theoretical premises to this argument. First, full family trajectories are more comprehensive and complex study objects than family/fertility events because they reflect the cumulative opportunity gaps over the life course (Ryder, 1965). Second, the intersection of individual characteristics (e.g. gender, social class, and age at migration) is a superior measure of the implications of the migration experience than separate economic and demographic characteristics because it captures the confluence of past and present conditions including both privileges/opportunities and disadvantages/oppression (Johnson-Hanks et al., 2011).
The second premise, borrowed from intersectionality (Hill Collins and Bilge, 2016), asserts that inequality in opportunities emerges from intersecting forms of oppression affecting individuals’ social and demographic behavior (Crenshaw, 1991). This theoretical framework is useful for this study because intersecting forms of oppression are pervasive in the origin countries of US immigrants, particularly in LACar countries (Viveros Vigoya, 2015). As shown in the following section, people of LACar origin account for a large share of the US immigrant population during the period of study, making it relevant to understand migration and family dynamics in this region.
Migration and family dynamics at origin and at destination
The national origins of US immigrants in the second half of the 20th century differed significantly from those of their counterparts in the first half. The number of migrants from European countries declined, while the number of migrants from Asian and LACar countries increased substantially (Castles et al., 2014: 6). In 1930, 83% of migrants living in the United States were of European origin, while 1.9% were of Asian origin and 5.6% were of LACar origin. By 1990, these shares had changed to 23%, 26%, and 44%, respectively; by 2000, migrants from LACar countries had become the majority, representing 52% of the foreign-born population (Gibson and Jung, 2006).
The factors that triggered migration from LACar to the United States during this period were predominantly economic (Clark et al., 2003; Donato et al., 2010). Most of these migrants moved to the United States in search of better economic opportunities often as a response to state policies targeting male workers, for example, the 1942–1964 Bracero program (Garip, 2017; Massey et al., 2014; Piore, 1979). Violence and deprived living conditions at origin were also drivers of international migration from LACar to the United States (Alvarado and Massey, 2010). Given the unequal geopolitical relations and living conditions between populations in countries of origin and destination, economic-driven migration, in general, and poverty- and violence-driven migration, in particular, contribute to persisting oppressive relations against LACar migrants in the United States. This oppression manifests in segmented assimilation into the United States, precarious labor force participation, xenophobia from the receiving population and government toward immigrants, and forced family separation via deportation (Donato, 2016; Massey et al., 2015; Portes and Zhou, 1993)
In addition to these waves of violence-driven and economically driven migration, smaller numbers of migrants from LACar moved to the United States to improve their professional skills through participation in specialized training and higher education (Rendall and Parker, 2014). The women who migrated did so mainly for family reunification reasons, as the labor recruitment. Because of this sharp gender divide in the targeting of migration policies, the migration trajectories of women were much more attached to their family paths than those of men (Curran and Rivero-Fuentes, 2003; Donato, 2010; Kanaiaupuni, 2000).
Family formation dynamics in the United States
During the second half of the 20th century, family formation dynamics in the United States were strongly stratified. Although the transitions to first birth and first marriage were continuously delayed during this period, both period and cohort fertility remained stable, hovering at levels of approximately two children per woman (Monte and Ellis, 2014). Meanwhile, increasing levels of marital instability and single motherhood among low-socioeconomic-status (SES) groups coexisted with positive views regarding the importance of marriage for individual fulfillment and societal well-being (Coontz, 2014; Hayford et al., 2014; Thornton and Young-DeMarco, 2001). Therefore, substantial differences in the timing of fertility across socioeconomic groups in the United States were associated with bimodal distributions in the ages at first birth (Sullivan, 2005).
Two similarities between the family dynamics in the United States and LACar countries are worth noting. First, educational attainment has played an increasing role in influencing the timing and stability of unions, as well as the timing and quantity of children (Castro Martin and Juarez, 1995; Furstenberg, 2014). Second, the family formation trajectories that distinguish the life courses of low-SES and high-SES individuals have become increasingly polarized, particularly among women (García and de Oliveira, 2011; Landale and Oropesa, 2007). It is apparent, then, that the relationship between migration and family might be affected by the gendered and stratified nature of the migration and family formation processes at origin and at destination.
Data and methods
I use five waves of the National Survey of Family Growth (NSFG, 1995, 2002, 2006–2010, 2011-2013, 2015). The NSFG is a cross-sectional, stratified, multistage area probability sample that is nationally representative of non-institutionalized US men and women from 15 to 44 years old (49 after 2015). The information is collected through in-person interviews, and sensitive questions are self-administrated in private. Starting in 2002, the NSFG includes an independent sample of men. 2
Only the NSFG of 1995 asked about the country of origin of all foreign-born women, recording 37 countries. In this sample, Mexican women and women from other LACar countries account for 29% and 27% of the foreign-born population, respectively, followed by women from Asia (19%) and Europe (16%). The NSFG waves after 1995 included only two categories for recording country of origin: Mexican and Other Latin American countries. In these NSFG waves, more than 55% of the foreign-born population is of Latin American origin.
To capture diverse family formation and migration paths, I include migrants of all origins in the analysis. Patterns that emerge from this very diverse sample signal more robust relationships among demographic processes compared to patterns that could be observed among individuals from a single national/continental origin. This premise follows the ‘maximum differences’ research design (Przeworski and Teune, 1982), and it aims to address some of the limitations of the so-called methodological nationalism, that is, the use of country of origin or racial/ethnic categories as explanatory factors, at the expense of social class and gender (Glick Schiller and Faist, 2010).
Family formation trajectories and the analytical sample
I use retrospective information on individuals aged 39 and older to reconstruct their marital and birth histories starting at age 15. Therefore, the analysis covers the birth cohorts 1950–1975 and the period 1965–2015. I code the family statuses of these individuals into 16 categories that result from the combination of four marital status categories (never-married, cohabiting, married, separated/divorced/widowed) and four parity levels (zero, one, two, and three or more). Using age 39 as a cut-off point provides a reasonable threshold for the completeness of family formation histories. Although family events could occur before age 15 and after 39, more than 95% of them occur within these years of age. Using a higher cut-off point for age substantially diminishes the sample size and precludes disaggregation of results.
Table 1 displays the number of individuals in the analytical sample by sex. I divide the US-born population into four racial/ethnic groups: Non-Hispanic White (NH White), Hispanics, Non-Hispanic Black (NH Black), and Non-Hispanic Other (NH Other). The inclusion of these four major racial/ethnic groups provides reference points for understanding the significance of the differences between US-born and foreign-born individuals.
Analytical sample by sex, race/ethnicity, and age at migration.
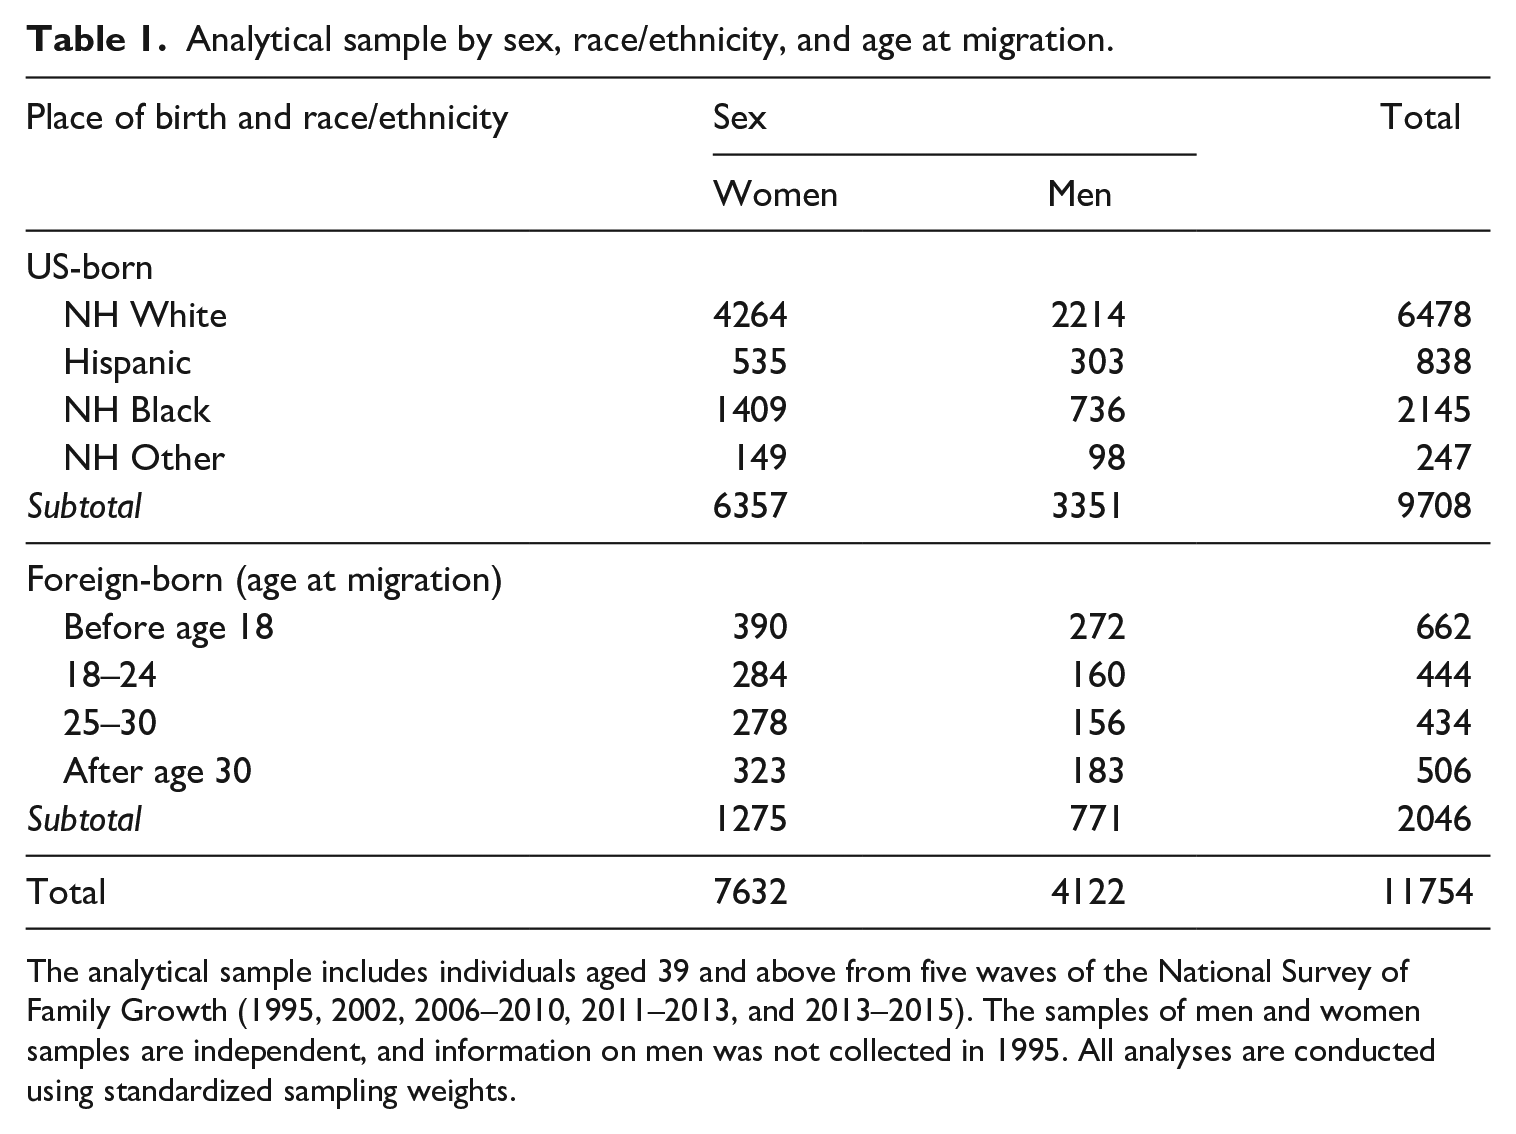
The analytical sample includes individuals aged 39 and above from five waves of the National Survey of Family Growth (1995, 2002, 2006–2010, 2011–2013, and 2013–2015). The samples of men and women samples are independent, and information on men was not collected in 1995. All analyses are conducted using standardized sampling weights.
For foreign-born individuals, I use their reported year of entry to the United States to calculate their age at migration into groups: before age 18 (1.5-generation), 18–24, 25–30, and after age 30. 3 Individuals in the first two age groups were less exposed to family norms in the country of origin than the individuals in the last two age groups. Also, these groups capture the age schedule of family formation. The age patterns of fertility and union formation display clear peaks during young adulthood (18–24) among low-SES individuals and at slightly older ages (25–29) for high-SES individuals.
The shares of Hispanics from the earliest (before age 18) to the latest (after age 35) age at migration groups are 50.2%, 61.0% 43.4%, and 47.9% among women and 62.1%, 67.7%, 51.2%, and 53.1% among men. This sample composition prevents me from disaggregating results by race/ethnicity among foreign-born. Substantively, however, this sample composition offers two benefits. First, it does reflect the reality of migration trends to the United States during the second half of the 20th century (Donato, 2010). Second, it allows me to underline dimensions of variation in family formation and migration trajectories relatively overlooked by studies that focus on migrants’ country of origin and generation.
I use educational attainment, measured at the time of the survey, as a proxy for social class as it reflects lifelong limitations and opportunities to accumulate economic and cultural capital, particularly during their transition to adulthood, a transition that typically implies leaving the parental household and forming a family (Bourdieu, 1986; Furstenberg, 2008, 2010). Educational attainment is also less volatile than other measures associated with social class, such as occupation (only available in the NSFG 1995) and total yearly income (included in all NSFG waves). The correlation between educational attainment and yearly income is strong in the analytical sample. For example, 39% of women without a high school diploma lived in households with a total yearly income below US$20,000; only 8% of these women lived in households with an yearly income above US$75,000. Among men without high school diplomas, these two percentages are 34% and 12%, respectively.
Moreover, in accordance with intersectionality theory, the interaction among educational attainment sex, place of birth, age at migration, and race/ethnicity provides a robust intersectional measure of individuals’ social position, given that all these variables are associated with privileges and disadvantages in the US context.
A three-step analytical strategy
First, to create a family formation typology, I measure the dissimilarity among individual family formation trajectories (25-year-long individual retrospective family statuses) by calculating the minimum number of changes that must be made in a trajectory to transform it into another (optimal matching). This minimum number of modifications is called transformation cost (Abbot and Tsay, 2000; Studer et al., 2011). Transformation costs are double-weighted to account for qualitative differences among family statuses and family formation age patterns (Studer and Ritschard, 2014). For example, changing from ‘single’ to ‘married’ status should cost more than changing from ‘married’ to ‘divorced’ status because these last two are ever-married statuses (i.e. more similar). Similarly, a change from ‘married’ to ‘separated’ status should cost more if it occurs at a younger age because the implications of marital dissolution are more significant for younger than older individuals. These two sets of weights are the between-state Gower’s dissimilarity index and the inverse of the age-specific transition rates across states (Gower, 1971; Lesnard, 2010). Tables 2 and 3 in Appendix 1 show the list of attributes for computing the Gower’s index and the resulting dissimilarity measures, respectively.
Using these double-weighted transformation costs, I compute a pair-wise dissimilarity matrix for the individual trajectories. I rely on this matrix to cluster individuals with similar family trajectories by hierarchically grouping them using the Ward method (Pardo and Del Campo, 2007). This classification is consolidated using the k-means algorithm over cluster solutions from 2 to 15 clusters (Kaufman and Rousseeuw, 1990). Based on the goodness-of-fit measures for these partitions, I select a six-cluster solution; I call this partition a ‘family typology’.
Second, I estimate the conditional distribution of men and women in this typology by educational attainment across the four race/ethnicity and six age-at-migration groups. I call these distributions ‘family profiles’. To account for changes in family dynamics over time and differences across subgroups in terms of religious affiliation, I estimate family profiles, including dummy variables for three birth cohorts (1950–1959, 1960–1969, 1970–1975) and four religious affiliation groups (No religion, Catholic, Protestant, Other). The baseline specification predicts the family typology based on the birth cohort dummy variables. For more complex model specifications, I measure the percentage change in the Akaike Information Criterion (AIC), with negative relative changes indicating a better fit (Dobson and Barnett, 2008). The lowest AIC is obtained when controlling for birth cohort and religious affiliation, but the results do not differ substantially between specifications with or without control variables.
Third, I conduct a principal component analysis (PCA) on the table that appends the 32 family profiles. I use the first two factorial axes of the PCA to display the within-group variability and the between-group discrepancies in family profiles. These plots present jointly the socially disadvantaged and socially privileged groups in terms of socioeconomic and migration status, and the types of family formation trajectories they are associated with.
Results
Figure 1 displays the aggregate prevalence and timing of births and the changes in marital status over individuals’ life courses for women (Panel A) and men (Panel B). This figure validates the use of retrospective information in the NSFG, as it reflects the main differences in family patterns among racial/ethnic and migration status groups in the United States (Furstenberg, 2007; Parrado and Flippen, 2012).
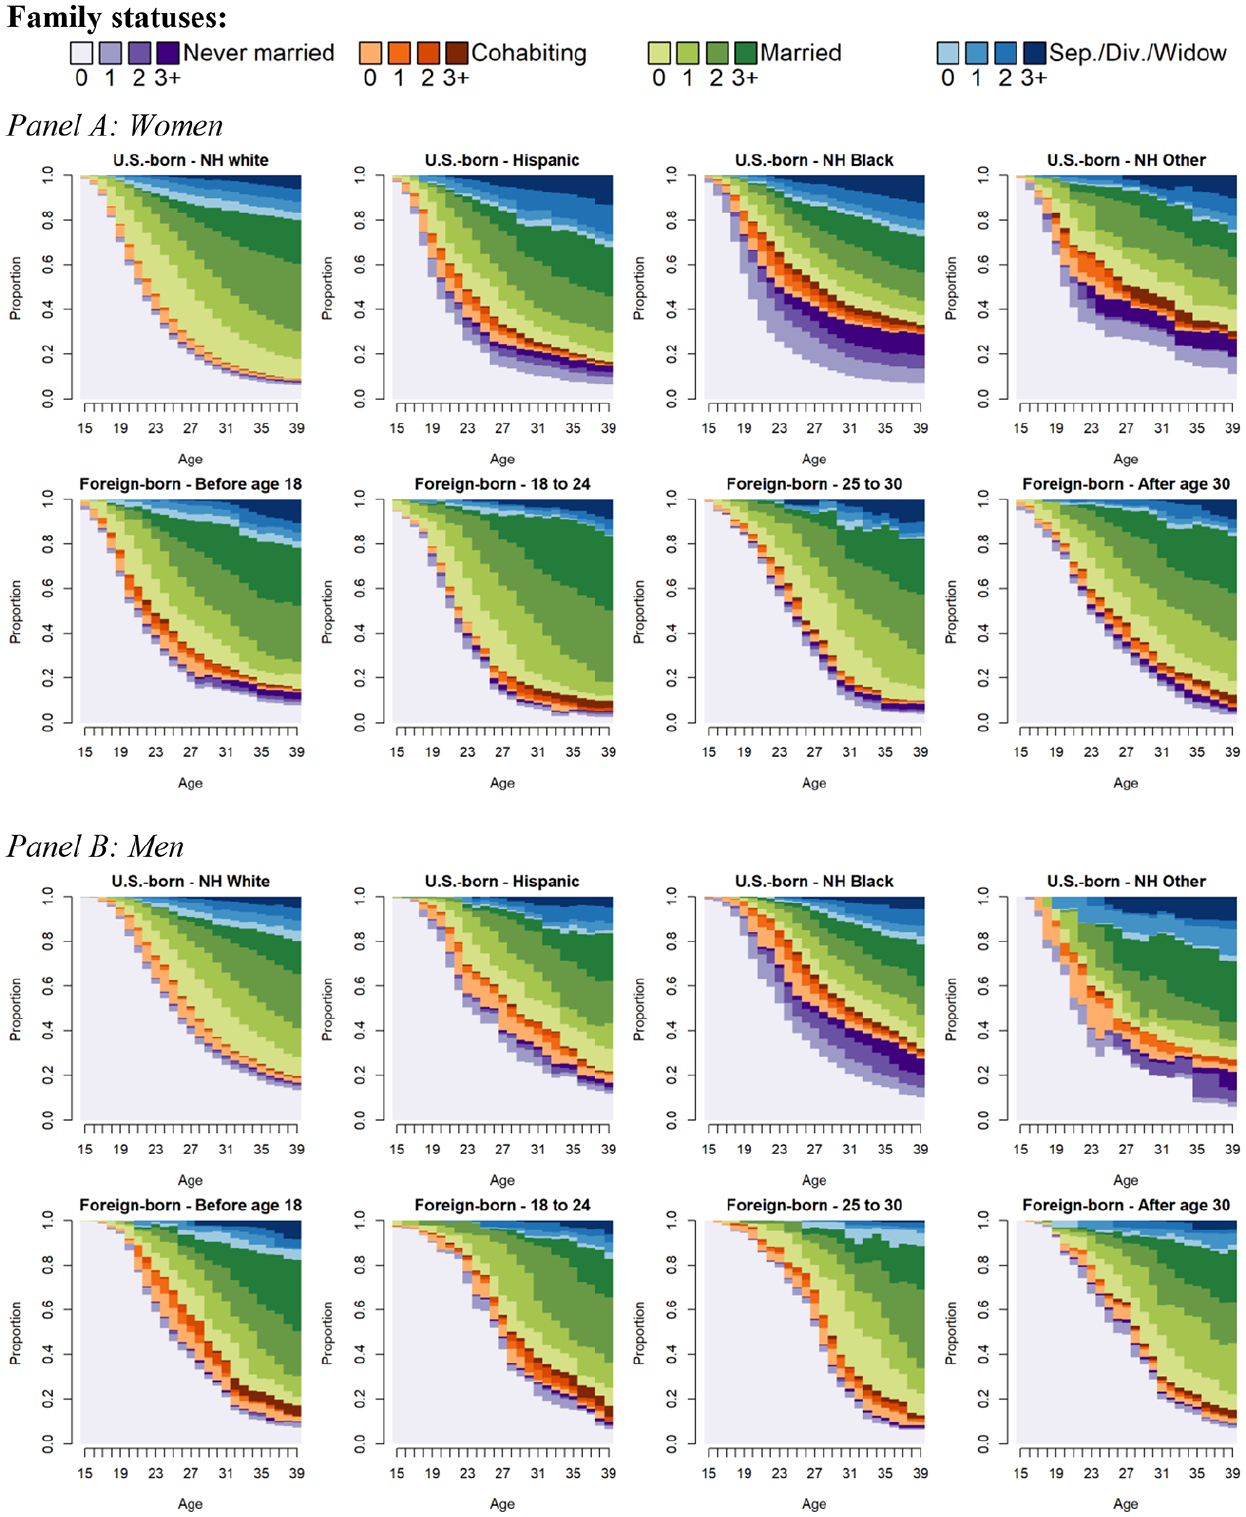
State distribution of family statuses across ages by race/ethnicity among US-born, and age at migration groups for foreign-born women (Panel A) and men (Panel B).
According to Figure 1, by age 39, the vast majority of individuals were married or had been married at least once. The only exceptions were individuals in the NH Black and NH Other categories. Non-White US-born individuals also displayed the highest prevalence of marital dissolution, which contrasted with the low levels observed among the foreign-born groups (small blue areas in the top-right area of the panels). NH White individuals, and to a lesser extent Hispanics, stand out as groups with a very low prevalence of single parenthood. The main differences between the sexes and age-at-migration groups are related to the timing of family formation events. Transitions to marriage and first births occurred later, and the birth intervals were longer among foreign-born than US-born individuals, with the exception of those who arrived before age 18. These patterns were especially pronounced for men, among whom transitions to family formation occurred later than they did among women.
Figure 2 displays individual family formation trajectories for women and men according to the six family typology categories (refer to Table 4 in Appendix 1 for the goodness-of-fit measures). This typology accounts for 51% and 55% of the total variance of individual family trajectories for women and men, respectively. These two values are very high compared to the variance that can be accounted for by socioeconomic and demographic variables, such as educational attainment (6.6% for women, 3.6% for men; see Figure 5 in Appendix 1), religious affiliation (1% for women, 1.8% for men), and race and ethnicity (2.6% for women, 0.9% for men). The same is true for the Average Silhouette Width (ASW). Despite the low value of the ASW, which indicates lack of consistency in the clusters, their consistency is much stronger than that of groupings based on educational attainment, religious affiliation, and race/ethnicity.
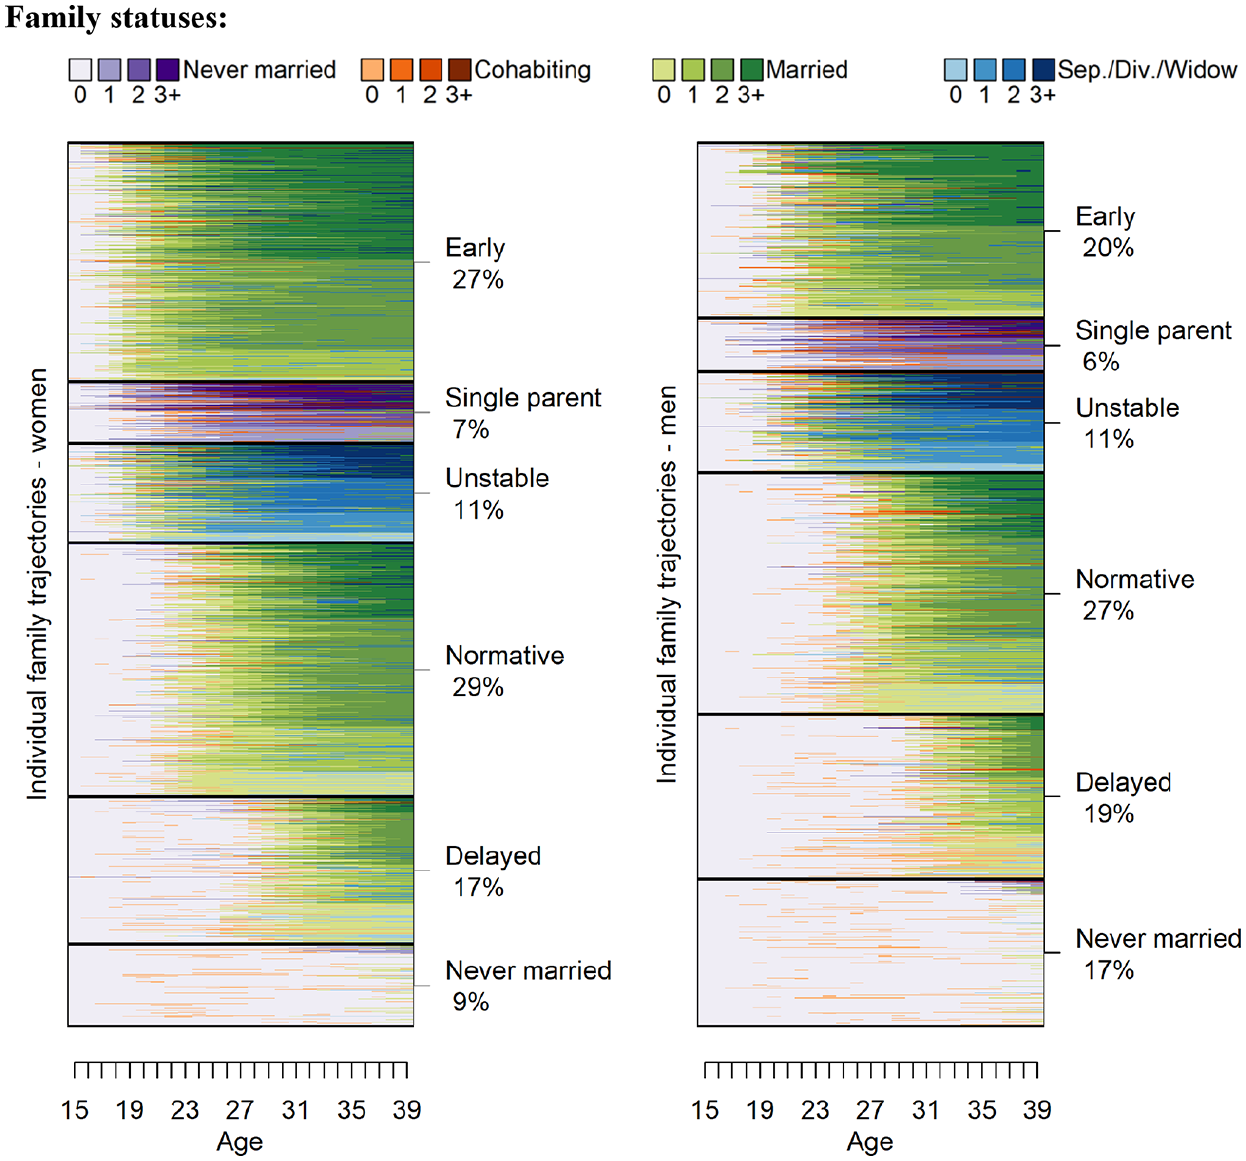
Individual family trajectories and family typology by sex.
I sort these six types by average completed fertility, ranging from low (bottom) to high (top), and I label them based on their most salient characteristic: ‘never-married’, ‘delayed’, ‘normative’, ‘unstable’, ‘single-parent’, and ‘early’.
This typology separates family trajectories according to two criteria: (1) the number and type of family events that occurred between ages 15 and 39, and (2) (dis)similarity with respect to the normative trajectory (i.e. their degree of ‘normativeness’). The bottom area in Figure 2 presents the family paths of delayed or no transition to family formation and low completed fertility. The upper area displays the family trajectories in which men and women started family formation early, had a large number of children, and, in some cases, formed multiple unions (blue spells within green lines). The categories of stable marriages (normative, delayed, and, to a lesser extent, early) constitute normative trajectories, whereas the never-married, unstable, and single-parent categories are non-normative trajectories.
The largest shares of men (27%) and women (29%) belonged to the normative category – which is the main reason why the category is called normative. The women and men who followed this family path had, on average, 2.0 and 1.9 children, respectively. Marriages in this category were stable, with only 12% of marriages being dissolved by age 39; marriages were entered into at approximately the same ages for both sexes. The timing, order, and number of family events (two children, one marriage) of this category correlate with positive socioeconomic outcomes for families and children, which reinforces the normative aspect of this family path (Amato et al., 2015; Hogan, 1978).
Two other family path types can be considered close to normative because they were followed by large proportions of individuals and had a high prevalence of unique/stable marriages. Those two path types are early and delayed. Some 44% of women and 39% of men belonged to these two categories combined. The three remaining types were far less common; they are associated with worse socioeconomic outcomes for parents and children, which reinforces the idea that they correspond to non-normative (and thus less socially rewarded) family paths.
Figure 3 displays the main patterns across the family profiles of 56 subgroups defined in terms of sex, educational attainment, race/ethnicity (omitting the NH Other group due to small sample size), and age-at-migration groups. These representations account for 73% and 58% of the total variance of women and men’s family profiles, respectively. This high percentage of explained variance allows me to focus on these two axes to examine family profiles’ variability. I included a line connecting educational attainment categories to highlight the educational differences and background lines separated by 1 standard deviation in order to provide a glimpse of the statistical significance of the results. 4
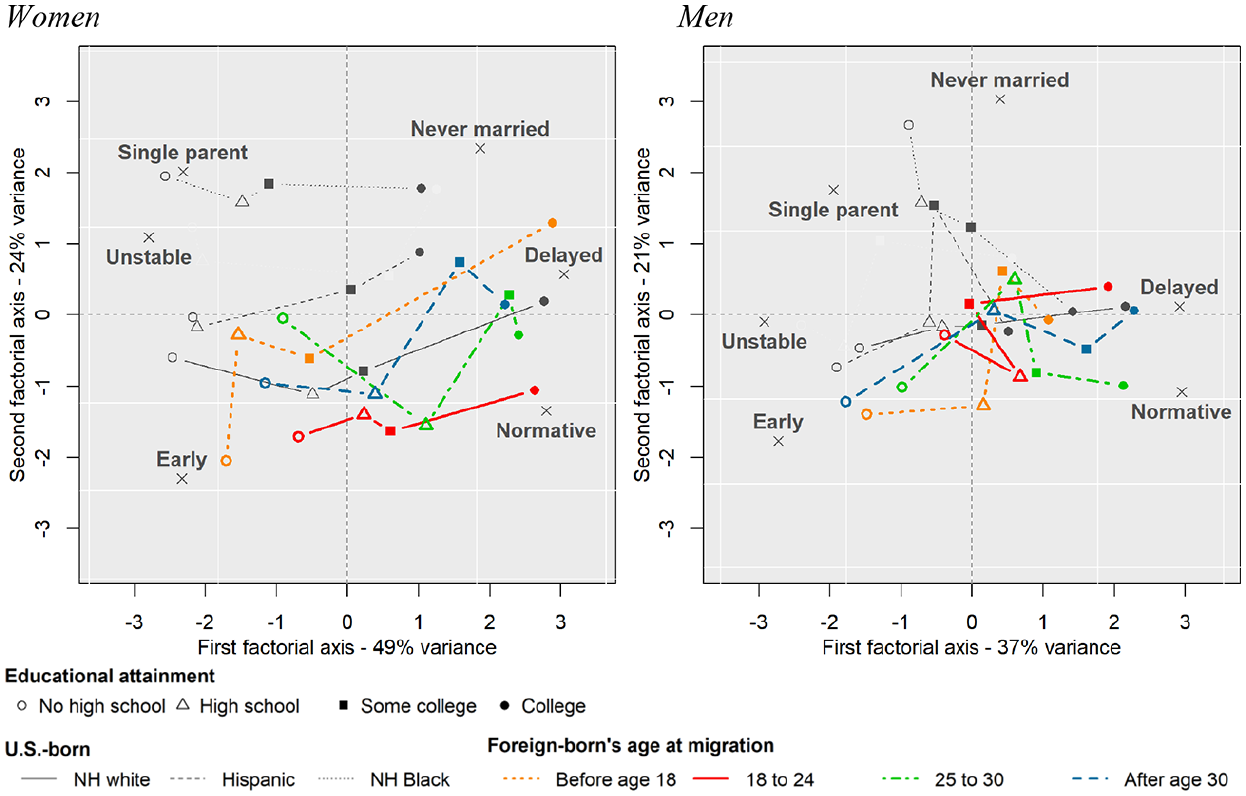
Factorial coordinates of family profiles by sex, race/ethnicity, age at migration, and educational attainment.
The interpretation of Figure 3 has two features. First, the proximity of the family typology categories implies that the predicted probabilities in these categories were simultaneously high for the same educational attainment, race/ethnicity, and age-at-migration groups. For example, the two closest family categories for women were single-parent and unstable, meaning that the proportions of individuals in these two categories were positively correlated among women’s family profiles. The opposite is true for family categories that were distal (e.g. early vs never-married). Second, for the points representing the race/ethnicity, age-at-migration, and educational attainment groups, closeness to the center implies that the family profiles of the group resembled the mean family profile (the observed distribution in Figure 2). The reverse indicated that the family profiles differed from the mean family profile. For example, the most distinct family profile among women, compared to the mean, was that of NH Black women without a high school education. The family profile of this group was positively associated with the single-parent and unstable categories; indeed, the percentages of women in these two trajectories were 41% and 19%, respectively. These figures were considerably higher than the overall proportion: 7% and 11%, respectively.
Figure 3 captures three phenomena. First, it shows the racial/ethnic and educational disparities in family profiles among the US-born population. Second, it points to the role of migration in compressing/lowering educational gaps in family profiles due to the strong negative association between migration and the unstable and single-parent family categories, with the exception of the 1.5-generation. Third, it shows the gendered nature of these two results due to the lower explanatory power of educational attainment and age at migration for men’s family profiles compared to those of women.
Racial/ethnic and educational disparities: The educational disparities in family profiles among US-born NH White women were significant. Among this group, those with a college education were more likely to be in family categories characterized by low fertility and delayed transition to family formation (right side of the plot). Low-educated NH White women were more likely to follow family formation types characterized by higher fertility, early transition to marriage, marital instability, and single motherhood (left side of the plot). NH Black and Hispanic women had smaller educational disparities compared to NH White women, and their family profiles were associated with less traditional family categories, namely, single-parent and unstable, for disadvantaged NH Black women, and never-married, especially for college-educated Hispanic and NH Black women.
The role of migration: The family profiles of foreign-born women were spread along the vertical dimension, and the educational differences were more disrupted compared to the pattern observed among US-born women, meaning that educational attainment had a different association with the family profiles of migrant women than with those of native-born women. Unlike among US-born women, low educational attainment among migrant women was not associated with single motherhood or, to a lesser extent, with family instability. There is no marker representing migrant women in the second quadrant of the plot (top-left), the quadrant that contains the single-parent and unstable categories.
The association between migration and family profiles also varied by age at migration. For example, of all groups depicted in Figure 3, women who migrated before age 18 had the largest educational disparities, meaning that the family profiles of the low- and high-educated were very different. Whereas 66% of the 1.5-generation women without a high school diploma were in the early category, this share was only 5% among those with a college education. These educational patterns resemble those of NH White US-born women, which signals that assimilation paths depend on migrants’ socioeconomic background, especially when migration occurs at early ages. The percentages of women in the early family path among NH White US-born were 49% for high school dropouts and 8% for those with a college degree (Table 5 in Appendix 1).
Among the other age-at-migration groups, the lines connecting educational categories were shorter and the greatest differences appeared in the vertical dimension (less traditional vs more traditional family categories). Migration at early-adult ages (18–24) was strongly associated with the normative and early types, meaning that the confluence of the decision to migrate and the formation of a family was associated with family stability and reduced the differences across educational attainment groups. The last two age-at-migration groups had smaller educational disparities than those observed among NH White women. Unlike among US-born women, the family profiles of women with a partially completed college education and with college education did not differ substantially. These two groups of women were more likely to follow less intense and less traditional family trajectories, signaling the adoption of college-educated, NH White family patterns. This is an intriguing finding given the lower value that educational credentials had for migrants compared to the native-born population.
Sex differences: Educational differences for US-born men were like those of US-born women, in that the groups with the most distinct family profiles (compared to the mean) were the groups of college-educated NH White men and NH Black men without a high school diploma. The former group of men tended to follow family formation trajectories of low fertility, delayed family formation, and stable marriage (right side of the plot). NH Black men without a high school diploma were more likely to be single parents, never-married, or be part of unstable unions (top left area of the plot). As in the case of women, the family profiles of migrant men were far from single-parent trajectories.
The patterns among migrant men were much less clear than they were for migrant women. Migrant women displayed more similarities to their US-born counterparts than migrant men to US-born men. Among women, all of the age-at-migration groups had a flat U-shaped pattern across educational attainment groups. These results are indicative of ‘distinct assimilation’ paths (i.e. class-specific/segmented assimilation) to the US family system. This mismatch between sexes resulted from the lack of differences among men by age-at-migration groups and, to a lesser extent, by educational attainment. These mean that migrating at different ages and going/dropping out of school were markers of an individual’s opportunity structure during the transition to adulthood; they influenced women’s family formation trajectories more than men’s.
Conclusion and discussion
This article identified six typical family trajectories among men and women who were born between 1950 and 1975. This typology describes the substantial heterogeneity and robust connection among family formation events across individuals’ life courses. These family trajectory types were strongly associated with individuals’ gender and socioeconomic backgrounds. These associations were particularly strong and patterned among women. The exploratory analysis presented here shows that migration to the United States disrupted these associations in ways that varied depending jointly on migrants’ sex, socioeconomic backgrounds, and age at arrival.
Hypothetico-deductive studies of migration and family have overlooked these multiple relationships, building up an abstract narrative of complementary/competing hypotheses (socialization, selection, disruption, assimilation/adaptation). In contrast, and by acknowledging that the mechanisms of these hypotheses operate within the intersecting inequalities of gender and social class, an intersectional approach to family and migration uncovers the multiple and specific relationships between family formation and migration. Despite being purely exploratory and descriptive, the results shown here suggest that differences in the opportunity structures of individuals are potentially the root cause of differences in family and migration trajectories. Narratives based on the ‘average’ migrant have erroneously neglected gender’s and social class’s intersecting influences on family formation and migration. Acknowledging intersecting social categories yields a more nuanced narrative on how migration and family relate to one another, and therefore could better inform differentiated family and migration policies.
For US-born individuals, the increasing importance of schooling to positive socioeconomic outcomes and the differential access to formal education have strengthened the association between socioeconomic background and family trajectories (Furstenberg, 2014). Individuals with a college education were more likely to follow family formation paths characterized by a delayed transition to marriage, marital stability, and low fertility, compared to individuals with fewer years of education. At the other end of the educational scale, people without a high school diploma were more likely to experience single parenthood and marital instability, two trajectories with negative implications for the socioeconomic conditions of both adults and their children (Amato et al., 2015; McLanahan and Percheski, 2008). This association also varied by race/ethnicity. The association between higher education and marital stability was weaker for Hispanic and NH Black than for NH White women.
Migrants entered the stratified family context of the United States in ways that depended on their social position, defined by the intersection of their sex, educational attainment, and age at arrival. Migrating as a child or adolescent (before age 18) was associated with the most substantial differences in family profiles across educational attainment levels, meaning that there were differential assimilation paths according to the socioeconomic backgrounds of the 1.5-generation. Early adult migration was strongly associated with normative family paths, yet the direction of the social class difference was the same as for the overall population, underlining the prominence of class in the migration experience. Finally, moving to the United States at later ages was associated with delayed and less intense family formation trajectories in terms of number of children and marriages (i.e. fewer children and a unique marriage).
These patterns were clearer for migrant women than migrant men. Three related dynamics drove this sex difference. First, early migration to the United States strengthened educational differences in family profiles. This was likely due to the more prolonged exposure to the US stratification system and the very distinct socioeconomic backgrounds of the so-called 1.5-generation married migrants (Landale and Oropesa, 2007). Second, because marriage itself may help individuals cope with the challenges of migration, migrants tended to follow more normative/stable trajectories, especially when migrating as young adults (Parrado and Flippen, 2005). Therefore, there was a negative association between moving and staying in the United States and both single parenthood and marital instability. The extent to which return migration drove these results remains unanswered. Third, among individuals who migrated after age 18, the family profiles of those with a partially completed college education and college education were similar, and lower levels of educational attainment were not associated with an early transition to family formation and high fertility. These individuals’ lower rates of early family formation before migration likely explain why, despite their relatively low educational attainment, most migrants did not follow trajectories of a rapid transition to family formation and high fertility.
The finding that these patterns applied less to men than to women implies that men’s family trajectories were less affected by the socioeconomic characteristics studied in this article, underlining yet again the importance of an intersectional lens when it comes to gender. To the extent that these characteristics (race/ethnicity, age at migration, educational attainment, religious affiliation, and birth cohort) reflected individuals’ opportunity structures to develop their family lives, men faced fewer social constraints than women during this process (Curran and Rivero-Fuentes, 2003; Kanaiaupuni, 2000; Pedraza, 1991). This result is in line with studies in other contexts showing that the timing of migration influences differently the family formation trajectories of African men and women in Europe (Kraus, 2019). Migrant men had higher mobility during this period, meaning that they could travel back and forth or eventually return to their origin countries in the process of finding a partner or sustaining a family. Women, by contrast, have always had more restricted mobility, and, when they have migrated, they have been more likely to stay (Massey, 1987; Raley et al., 2004; Stephen and Bean, 1992).
Results based on information collected in the United States, such as the NSFG, are likely to suffer from the so-called immigration bias (Beauchemin, 2014). This bias in the sample could explain why single parenthood, sustained cohabitation, and unstable marriages were not prevalent among migrants, although these three phenomena were on the rise in the origin countries during the period of analysis (Liu et al., 2017). In the same vein, the experiences and family formation trajectories of migrants without legal status in the United States were likely underrepresented in this work (Massey and Zenteno, 2000). Hence, future research using transnational samples and samples that better capture the experiences of migrants with varying legal statuses have much to add to the findings presented in this article.
Footnotes
Appendix 1
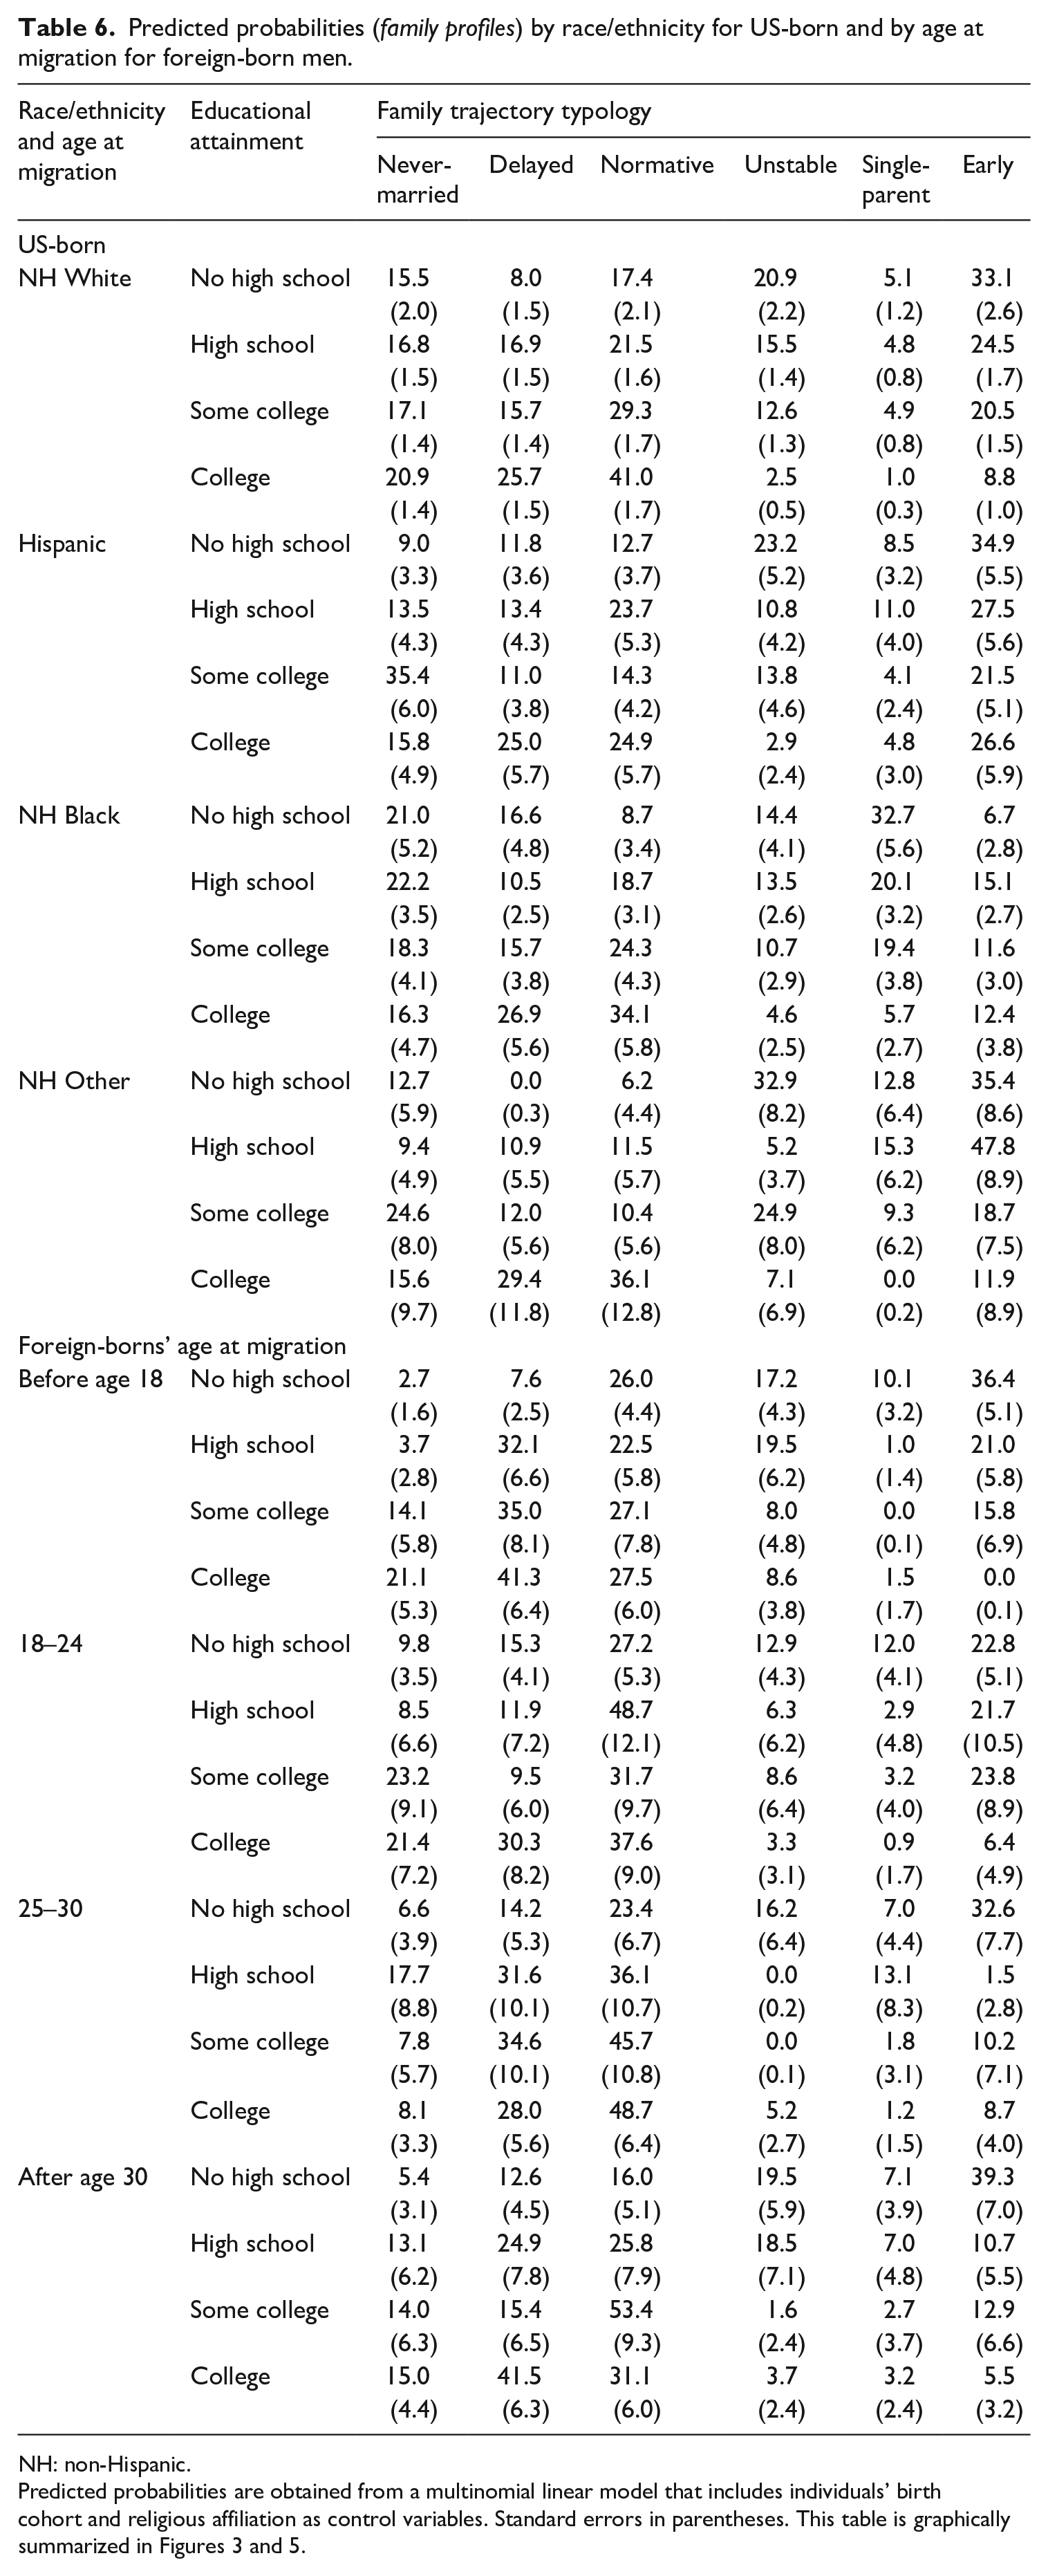
Predicted probabilities (family profiles) by race/ethnicity for US-born and by age at migration for foreign-born men.
| Race/ethnicity and age at migration | Educational attainment | Family trajectory typology | |||||
|---|---|---|---|---|---|---|---|
| Never-married | Delayed | Normative | Unstable | Single-parent | Early | ||
| US-born | |||||||
| NH White | No high school | 15.5 | 8.0 | 17.4 | 20.9 | 5.1 | 33.1 |
| (2.0) | (1.5) | (2.1) | (2.2) | (1.2) | (2.6) | ||
| High school | 16.8 | 16.9 | 21.5 | 15.5 | 4.8 | 24.5 | |
| (1.5) | (1.5) | (1.6) | (1.4) | (0.8) | (1.7) | ||
| Some college | 17.1 | 15.7 | 29.3 | 12.6 | 4.9 | 20.5 | |
| (1.4) | (1.4) | (1.7) | (1.3) | (0.8) | (1.5) | ||
| College | 20.9 | 25.7 | 41.0 | 2.5 | 1.0 | 8.8 | |
| (1.4) | (1.5) | (1.7) | (0.5) | (0.3) | (1.0) | ||
| Hispanic | No high school | 9.0 | 11.8 | 12.7 | 23.2 | 8.5 | 34.9 |
| (3.3) | (3.6) | (3.7) | (5.2) | (3.2) | (5.5) | ||
| High school | 13.5 | 13.4 | 23.7 | 10.8 | 11.0 | 27.5 | |
| (4.3) | (4.3) | (5.3) | (4.2) | (4.0) | (5.6) | ||
| Some college | 35.4 | 11.0 | 14.3 | 13.8 | 4.1 | 21.5 | |
| (6.0) | (3.8) | (4.2) | (4.6) | (2.4) | (5.1) | ||
| College | 15.8 | 25.0 | 24.9 | 2.9 | 4.8 | 26.6 | |
| (4.9) | (5.7) | (5.7) | (2.4) | (3.0) | (5.9) | ||
| NH Black | No high school | 21.0 | 16.6 | 8.7 | 14.4 | 32.7 | 6.7 |
| (5.2) | (4.8) | (3.4) | (4.1) | (5.6) | (2.8) | ||
| High school | 22.2 | 10.5 | 18.7 | 13.5 | 20.1 | 15.1 | |
| (3.5) | (2.5) | (3.1) | (2.6) | (3.2) | (2.7) | ||
| Some college | 18.3 | 15.7 | 24.3 | 10.7 | 19.4 | 11.6 | |
| (4.1) | (3.8) | (4.3) | (2.9) | (3.8) | (3.0) | ||
| College | 16.3 | 26.9 | 34.1 | 4.6 | 5.7 | 12.4 | |
| (4.7) | (5.6) | (5.8) | (2.5) | (2.7) | (3.8) | ||
| NH Other | No high school | 12.7 | 0.0 | 6.2 | 32.9 | 12.8 | 35.4 |
| (5.9) | (0.3) | (4.4) | (8.2) | (6.4) | (8.6) | ||
| High school | 9.4 | 10.9 | 11.5 | 5.2 | 15.3 | 47.8 | |
| (4.9) | (5.5) | (5.7) | (3.7) | (6.2) | (8.9) | ||
| Some college | 24.6 | 12.0 | 10.4 | 24.9 | 9.3 | 18.7 | |
| (8.0) | (5.6) | (5.6) | (8.0) | (6.2) | (7.5) | ||
| College | 15.6 | 29.4 | 36.1 | 7.1 | 0.0 | 11.9 | |
| (9.7) | (11.8) | (12.8) | (6.9) | (0.2) | (8.9) | ||
| Foreign-borns’ age at migration | |||||||
| Before age 18 | No high school | 2.7 | 7.6 | 26.0 | 17.2 | 10.1 | 36.4 |
| (1.6) | (2.5) | (4.4) | (4.3) | (3.2) | (5.1) | ||
| High school | 3.7 | 32.1 | 22.5 | 19.5 | 1.0 | 21.0 | |
| (2.8) | (6.6) | (5.8) | (6.2) | (1.4) | (5.8) | ||
| Some college | 14.1 | 35.0 | 27.1 | 8.0 | 0.0 | 15.8 | |
| (5.8) | (8.1) | (7.8) | (4.8) | (0.1) | (6.9) | ||
| College | 21.1 | 41.3 | 27.5 | 8.6 | 1.5 | 0.0 | |
| (5.3) | (6.4) | (6.0) | (3.8) | (1.7) | (0.1) | ||
| 18–24 | No high school | 9.8 | 15.3 | 27.2 | 12.9 | 12.0 | 22.8 |
| (3.5) | (4.1) | (5.3) | (4.3) | (4.1) | (5.1) | ||
| High school | 8.5 | 11.9 | 48.7 | 6.3 | 2.9 | 21.7 | |
| (6.6) | (7.2) | (12.1) | (6.2) | (4.8) | (10.5) | ||
| Some college | 23.2 | 9.5 | 31.7 | 8.6 | 3.2 | 23.8 | |
| (9.1) | (6.0) | (9.7) | (6.4) | (4.0) | (8.9) | ||
| College | 21.4 | 30.3 | 37.6 | 3.3 | 0.9 | 6.4 | |
| (7.2) | (8.2) | (9.0) | (3.1) | (1.7) | (4.9) | ||
| 25–30 | No high school | 6.6 | 14.2 | 23.4 | 16.2 | 7.0 | 32.6 |
| (3.9) | (5.3) | (6.7) | (6.4) | (4.4) | (7.7) | ||
| High school | 17.7 | 31.6 | 36.1 | 0.0 | 13.1 | 1.5 | |
| (8.8) | (10.1) | (10.7) | (0.2) | (8.3) | (2.8) | ||
| Some college | 7.8 | 34.6 | 45.7 | 0.0 | 1.8 | 10.2 | |
| (5.7) | (10.1) | (10.8) | (0.1) | (3.1) | (7.1) | ||
| College | 8.1 | 28.0 | 48.7 | 5.2 | 1.2 | 8.7 | |
| (3.3) | (5.6) | (6.4) | (2.7) | (1.5) | (4.0) | ||
| After age 30 | No high school | 5.4 | 12.6 | 16.0 | 19.5 | 7.1 | 39.3 |
| (3.1) | (4.5) | (5.1) | (5.9) | (3.9) | (7.0) | ||
| High school | 13.1 | 24.9 | 25.8 | 18.5 | 7.0 | 10.7 | |
| (6.2) | (7.8) | (7.9) | (7.1) | (4.8) | (5.5) | ||
| Some college | 14.0 | 15.4 | 53.4 | 1.6 | 2.7 | 12.9 | |
| (6.3) | (6.5) | (9.3) | (2.4) | (3.7) | (6.6) | ||
| College | 15.0 | 41.5 | 31.1 | 3.7 | 3.2 | 5.5 | |
| (4.4) | (6.3) | (6.0) | (2.4) | (2.4) | (3.2) | ||
NH: non-Hispanic.
Acknowledgements
I am thankful to Professor Herbert Smith for his support while I developed this work. I also thank the Max Planck Institute for Demographic Research and the American Sociological Association for the opportunities to present this article in the internal seminar series and the annual meeting, respectively. Thanks to my colleague Dr Chia Lui for her valuable comments on a previous version of this work.
Funding
The author received no financial support for the research, authorship, and/or publication of this article.