



Abstract
Theft is widely recognized as an important source of guns to offenders, yet direct evidence remains limited. Using linked California administrative records (2010–2021) on firearm transactions, thefts, and crime recoveries, we examine characteristics associated with reported theft and, among stolen guns, predictors of recovery in crime. Cox models show theft risk factors closely mirror established correlates for law enforcement recovery: low-cost, medium- and large-caliber handguns and firearms purchased by younger, male, Black, or previously arrested buyers faced elevated theft risk. Among female purchasers, recent high-volume handgun buying was associated with substantially higher theft hazard, suggestive of straw purchasing. Among stolen firearms with prior retail records, shorter purchase-to-theft time strongly predicted recovery, suggesting rapid diversion into criminal circulation.
Introduction
With an estimated 200,000 to 250,000 guns stolen each year in the United States (Bureau of Alcohol, Tobacco, Firearms and Explosives, 2023a; Cook, 2018; Hemenway et al., 2017) theft represents a potentially significant pathway by which legally purchased firearms enter illegal circulation and arm offenders. Yet the importance of theft in supplying guns used in crime remains debated (Cook, 2018). Surveys of incarcerated individuals suggest that direct theft is relatively rare, with only 3% to 6% reporting that they had stolen the firearm they used in crime (Alper & Glaze, 2019; Cook et al., 2015). However, theft likely plays a much larger indirect role in arming offenders via secondary channels on the illicit market, and recent empirical evidence on permissive concealed carry laws supports this possibility. State adoption of permitless carry is estimated to increase firearm thefts in large cities by an average of 50% and violent crime by an average of 20% (Donohue et al., 2022). By increasing carrying outside the home, these laws expand opportunities for theft, particularly from vehicles, and are estimated to account for an additional 100,000 guns stolen each year (Donohue et al., 2019).
While research on permissive carry laws suggests that theft may be more consequential to criminal firearm use than self-reports imply, direct evidence linking stolen guns to criminal use remains limited. In the California crime gun recovery data used in this study, 15% of stolen handguns were recovered by law enforcement in connection with a crime during the 11-year follow-up. Most stolen guns recovered in crimes were recovered within 2 years (median time: 269 days). The fact that most guns reported stolen were not subsequently recovered by law enforcement could imply that many guns are stolen to be sold or traded like other valuable stolen goods rather than for criminal use. On the other hand, many stolen guns may be used in crimes soon after theft, but are then discarded or transferred such that they are no longer at risk of recovery (Cook, 2018). Survey research in Chicago jails offers some support for this latter scenario, with several respondents reporting demolishing “dirty” guns (i.e., guns that had been used in violent crime) or selling them across state lines (Cook et al., 2015). Case level studies have also shown that guns are recovered in only a small minority of shooting investigations (e.g., 9%; Barao & Mastroianni, 2025).
In addition to these uncertainties about how stolen guns are used, little is known about what makes a firearm more or less likely to be stolen in the first place. Prior survey research has documented characteristics of firearm theft victims, finding that they are disproportionately male, own multiple firearms, and often store their firearms in unsecured or visible locations (Hemenway et al., 2017). Handguns are more vulnerable to theft than long guns (Hemenway et al., 2017). Yet no studies, to our knowledge, have used administrative data to examine the types of legally purchased guns, owners, or transactions associated with theft risk. Consequently, little population-level evidence exists on which legally purchased firearms are most vulnerable to theft or how frequently stolen guns reappear in crime.
This study addresses these gaps by leveraging California’s comprehensive transaction, theft, and recovery records to provide population-level evidence on firearm theft and subsequent criminal use. California’s unique firearms data environment allows direct observation of two key points in the diversion process: (1) which legally purchased firearms are later reported stolen, and (2) among those, which are subsequently recovered in connection with a crime.
California is distinctive not only for the availability of these administrative data but also for its regulatory environment governing firearm acquisition and ownership. All firearm sales must go through licensed dealers with universal background checks, mandatory documentation, a 10-day waiting period, a one-gun-per-month limit, and prohibitions that extend beyond federal law (e.g., including those with misdemeanor violent convictions). These safeguards make straw purchasing and so-called “lie-and-buy” attempts (i.e., falsifying information on background check forms) more difficult than in most states. As a result, theft may represent a comparatively more important mechanism of diversion in California. The state’s record systems provide a rare opportunity to study theft empirically.
To situate our analysis, Figure 1 illustrates potential pathways by which a legally purchased firearm may be diverted from the legal market into illegal use, noting which are and are not observable in our data. A firearm may be stolen or not; if stolen, the theft may be reported or unreported. Importantly, some firearms may also be falsely reported as stolen—for example, by a straw purchaser (an individual who legally buys a gun on behalf of someone prohibited) seeking to disassociate their name from the firearm, or by an owner concealing an undocumented transfer to a family member or acquaintance to avoid future legal liability. Among reported thefts, only a fraction are later used in crime and recovered by law enforcement, and some of these may not be successfully linked to prior records.

Conceptual trajectories following a documented firearm purchase. After purchase, a firearm may be stolen (reported or unreported) or not stolen (with some false reports). Firearms reported stolen may be used illegally, with only a fraction subsequently recovered by law enforcement and a subset of these matched to prior theft reports. Bold boxes indicate outcomes observed and analyzed in our data; regular boxes represent events that are unobserved or not used as analytic outcomes.
Our analyses focus on two observable points in this process: reported theft and recovery by law enforcement. First, we examine predictors of theft among legally purchased firearms, identifying firearm, purchaser, and transaction features associated with theft. Unlike previous research, which has relied on survey data, our analyses utilize administrative transaction records, providing direct empirical evidence on which legally owned firearms and purchasers are at highest risk of experiencing theft. Second, we investigate what happens after firearms are stolen, by analyzing the likelihood that stolen guns will be recovered in crime by law enforcement. We examine risk factors for recovery including the firearm type, caliber size, estimated cost, and the city of reported theft. Among a subset of stolen firearms with a prior legal transaction record, we also examine the association between features related to the most recent recorded purchase and crime gun recovery.
Together, these complementary analyses provide new evidence on firearm theft as a mechanism of diversion from legal to illegal markets. Understanding these patterns can inform law enforcement strategies and policy interventions aimed at disrupting the illicit firearms market.
Methods
Data
This study draws on data provided by the California Department of Justice (CA DOJ), including stolen gun reports (2010–2021), crime gun recovery records (2010–2021), and legal firearm transaction records (2000–2021). The CA DOJ Automated Firearms System (AFS) database includes crime gun recovery records as well as records for when a firearm is reported lost or stolen. Since the early 2000s, California has required that all recovered firearms be submitted to CA DOJ for tracing through the Bureau of Alcohol, Tobacco, Firearms and Explosives (ATF), and mandates that the records be retained for at least ten years (California Penal Code § 11108.3, California Legislature, 2002). These crime gun records include the date of recovery, the associated crime, and firearm details including make, model, caliber or gauge, and serial number. Crime gun records can be linked to other firearm transaction data using the CA DOJ “linkage number.” Consistent statewide reporting is available beginning in 2010.
Stolen firearm reports are maintained in the same database. Since 2012, California has required private citizens to report lost or stolen firearms (ATF, 2023), and, since July 2017, the report is required to be filed within five days of the time the owner discovered or reasonably should have discovered the loss or theft (CA Penal Code § 25265, 2016). The stolen reports include information on the date of theft, agency to which the theft was reported, and the firearm serial number. We note that theft reports reflect incidents reported to law enforcement and may underrepresent theft among individuals acquiring firearms through informal or unlawful channels.
The CA DOJ Dealer Record of Sale (DROS) system includes all legal transactions and transfers in the state since 1996 for handguns and since 2014 for long guns. For the analysis examining purchases and risk of subsequent theft, our primary analysis includes DROS transactions from 2000 to 2021; earlier transactions are used to construct relevant firearm and purchaser history variables. DROS records contain details on the firearm, the purchaser, and the dealer. Firearm details include make, model, type, caliber, and serial number. Purchaser information includes demographics (age, sex, etc.) and residential address. We used purchaser address to link transactions to community characteristics, including census tract-level social vulnerability and a measure of rurality.
Finally, we also used data from the CA DOJ Automated Criminal History System (ACHS), which were linked to the DROS records by CA DOJ personnel using unique individual identifiers. These data were used to generate purchaser-level indicators for prior arrests and infractions.
Sample Construction
We conducted two complementary analyses using these datasets. The first examined predictors of theft among firearms with a record of transaction in California’s Dealer Record of Sale (DROS) database between 2000 and 2021. In a sensitivity analysis, we limited the transaction window to include only firearms that were sold from 2010 forward given consistent theft reporting did not begin until 2010. The second set of analyses focused on predictors of criminal recovery among firearms reported stolen from 2010 to 2021.
The analysis of theft predictors included 9,636,183 transactions (8,376,606 firearms) and 35,184 firearms later reported stolen (30,206 handguns and 4,978 long guns). The analysis of all firearms reported stolen included 122,088 firearms (85,632 handguns, 29,880 long guns, and 6,576 unknown), 15,160 of which were recovered in crimes. Finally, in the analysis of DROS-linked stolen guns, we were able to link 43,036 stolen firearms (38,101 unique handguns and 4,935 unique long guns), of which 7,176 were recovered in crime. This DROS-linked subsample enabled the inclusion of additional predictors related to purchaser and transaction characteristics.
Outcomes
Theft
The first analysis examined time to reported firearm theft. Firearms were followed from the date of transaction until the earliest of the following: a reported theft in the California Automated Firearms System (AFS), the end of the study period (December 31, 2021), or a reported firearm destruction.
Crime Gun Recovery
The second analysis examined the time from theft report to the firearm’s recovery in a crime. Firearms were followed from the date of reported theft until a recorded crime recovery, a documented destruction, or the end of the study period (December 31, 2021). Our primary outcome was any crime gun recovery. As a secondary analysis, we also estimated models for recovery in a violent crime (defined using the CA DOJ Uniform Offense Codes).
Predictors
Firearm Characteristics
Both analyses included variables related to the firearm. We generated a categorical “caliber size” variable with four levels: small-, medium-, and large-caliber handguns (classified using make, model, and caliber information), and long guns of any gauge, included as a distinct category because caliber groupings are not typically applied to rifles or shotguns (Laqueur et al., 2023; Laqueur & Robinson, 2025; Robinson et al., 2024). We also generated proxy variables for low- and high-cost firearms using manufacturer prices listed in the Blue Book of Gun Values (Blue Book of Gun Values, n.d). We used a Possibly Gapped Histogram to select manufactures in the bottom and top quantiles of retail prices, respectively (Fushing & Roy, 2018). The “low-cost” indicator captured firearms with a manufacturer whose median price was $200 or less; the “high-cost” variable included manufacturers with a median price of $2,000 or more. Firearms linked to DROS were classified as semiautomatic or not. Prior trace data research on crime gun recovery risk factors has consistently shown that larger caliber, lower cost handguns and semiautomatic pistols are disproportionately represented among firearms recovered in crime, reflecting their availability, portability, and desirability in illicit markets (Koper, 2014; Pierce et al., 2003, 2004).
Purchaser Characteristics
For the predictors of gun theft analysis and the analysis of stolen guns with a record in DROS, we included purchaser information available in DROS including age at the time of purchase, sex, citizenship status, birthplace (US or not), and race and ethnicity. We also included indicators for whether the purchaser had any prior infraction or prior arrest in the past 10 years for alcohol intoxication, firearm-related crimes, major violent crime, or major property crime. These demographic and criminal history variables have been shown in prior research to correlate with criminal justice involvement and the likelihood of crime gun recovery (Koper, 2014; Pierce et al., 2004; Robinson et al., 2024).
Measures of purchasing history included the total number of firearms previously purchased and past-year handgun purchases coded as a categorical variable (0, 1, 2–5, 6–12, >12) for the theft analysis and as a binary indicator (≥1 vs. 0) for the stolen-gun analysis due to the smaller dataset and low cell counts in several categories. High-volume purchasing is an established crime gun risk factor and is often used as an indicator of potential diversion risk (Braga et al., 2021; Koper, 2014). Finally, we included the number of times the purchaser had previously reported a firearm stolen.
Transaction Characteristics
In addition to characteristics of the last known purchaser, we included variables describing the nature of the last recorded firearm transaction. Specifically, we identified whether the firearm was acquired through a standard sale, pawn redemption, or other type of transfer. We also included several time-varying indicators capturing aspects of a firearm’s official history prior to the theft report. These included whether the firearm had ever been placed on a law enforcement hold, whether it had subsequently been released by law enforcement, and whether it had been previously reported lost. These events may affect a firearm’s availability for theft or the likelihood that it enters criminal circulation.
Community and Geographic Characteristics
Community and geographic predictors varied by analysis. In the models examining theft among legal transactions and recovery among stolen firearms with a prior legal transaction record, we included the Social Vulnerability Index (SVI) and its component scores, based on the purchaser’s residential census tract. Developed by the CDC, the SVI summarizes community-level vulnerability across four domains: socioeconomic status, household composition and disability, minority status and language, and housing type and transportation. We also included the region in which the firearm was purchased (e.g., Los Angeles County, San Francisco Bay region).
In the analysis of crime gun recovery among all stolen firearms and among DROS-linked firearms, we included the city where the firearm was reported stolen. This was entered as a factor variable indicating whether the theft occurred in one of the 20 cities with the highest number of stolen gun reports or in another location.
Finally, to assess the geographic proximity between purchase and theft, we created an indicator for firearms reported stolen in the same county where they were originally purchased. This variable serves as an approximate measure of local diversion, recognizing that county boundaries are an imperfect proxy for neighborhood or jurisdictional markets. Prior research on crime gun recovery has shown crime guns originate relatively close to the point of original retail sale (Koper, 2014; Pierce et al., 2003, 2004).
Statistical Analysis
We used Cox proportional hazards models with left truncation to account for incomplete theft and crime gun reporting prior to 2010. In the first analysis, we modeled the hazard of theft among firearms legally purchased between 2000 and 2021, with the firearm transaction as the unit of analysis. Firearms purchased before 2010 entered the risk set on January 1, 2010, while those purchased thereafter entered at the date of purchase. Time at risk ended at the earliest instance of a reported theft, removal from the registry due to firearm destruction, or the end of the study period (December 31, 2021). Firearms not reported stolen were treated as right censored. Standard errors were clustered at the firearm and purchaser levels to account for multiple transactions per firearm and multiple firearms owned by the same individuals.
The second set of analyses estimated the hazard of criminal recovery among firearms reported stolen between 2010 and 2021. The time scale was the number of days from the reported theft date to the date of recovery by law enforcement. Firearms not recovered by the end of the study period were treated as right censored. We estimated two models: one in which all firearms reported stolen were included, with the unit of analysis as the individual firearm; the other was restricted to the subset of stolen firearms that linked to a prior DROS record, with the firearm transaction as the unit of analysis. This latter specification included purchaser and transaction characteristics to assess whether features previously associated with diversion or rapid transfer (e.g., high-volume purchasing or short purchase-to-theft intervals) were also associated with downstream criminal recovery.
As sensitivity analyses, we repeated the risk of theft models including only firearm transactions from 2010 forward, re-estimated the recovery model among the DROS-linked subset of stolen firearms without purchaser and transaction covariates (to distinguish differences driven by the restricted sample from those driven by the inclusion of additional covariates), and estimated the risk of recovery models excluding the 2,645 firearms (37% of recoveries) that were reported stolen and recovered in crime on the same day. These cases likely reflect firearms whose theft was discovered or reported only upon recovery, making the measured time from theft to recovery unreliable.
Secondary analyses included sex-stratified models for risk of theft and models for recovery in a violent crime. Because the firearm-level Cox models repeat purchaser characteristics across multiple firearms owned by the same individual, we also estimated a purchaser-level Poisson model in which the outcome was the count of crime gun recoveries among stolen firearms linked to each purchaser. This specification provides a complementary assessment of whether purchaser characteristics predict the concentration of crime gun recoveries at the individual level.
Results
Descriptive Results
Between 2010 and 2021, there were 85,632 stolen handgun reports, 29,880 stolen long guns, and 6,576 firearms of unknown type reported stolen. Among all stolen guns (n = 122,088), 15,160 (12%) were subsequently recovered in a crime during the study period, with over half (56%, n = 8,551) recovered within the first year. Recovery rates varied by firearm type: 15% of handguns (n = 12,403), 5% of long guns (n = 1,362), and 21% of firearms of unknown type (n = 1,395). Recovery rates also varied by the city in which the theft occurred. For example, among all reported stolen firearms, the proportion later recovered in crime ranged from 6% in Bakersfield to 15% in Long Beach. Overall, the median time between theft and recovery was less than 1 year (269 days).
Among over 8.3 million legally purchased firearms in the Dealer Record of Sale (DROS) database between 2010 and 2021 (with long gun recording beginning in 2014), 35,359 were later reported stolen. Among these stolen firearms, 7,176 (17%) were recovered in crime. Recovery rates varied across cities, ranging from 8% to 28%—with Long Beach (28%), Los Angeles (22%), and San Francisco (22%) at the higher end.
Among firearms with a record in DROS, 14% of those recovered in crime had a previous stolen report. For comparison, there was roughly one DROS-linked firearm reported stolen per 180 DROS sales (0.6%), indicating that stolen firearms are overrepresented among recovered crime guns by more than twentyfold.
Table 1 presents select firearm, purchaser, and transaction characteristics, shown by theft status (stolen vs. not stolen) and, among stolen firearms that linked to DROS, by recovery status (recovered vs. not recovered). Compared with all DROS transactions, stolen firearms were more often semiautomatic (81.6% vs. 71.2%), medium- (43.8% vs. 31.7%) or large-caliber (35.6% vs. 27.9%), and from low-cost manufacturers (5.1% vs. 1.7%). Purchasers of stolen firearms were younger (mean age = 37.4 vs. 43.2 years), more often female (14.3% vs. 9.0%), and more likely to be Black (13.1% vs. 3.7%) or Hispanic (24.2% vs. 16.8%). Prior criminal justice contact was also more common among purchasers of firearms reported stolen, including any prior arrest in the past 10 years for property crime (1.9% vs. 0.4%) and firearm-related offenses (1.8% vs. 0.7%). Differences between recovered and unrecovered firearms were generally modest.
Characteristics of Firearms and Purchasers by Theft and Recovery Status.
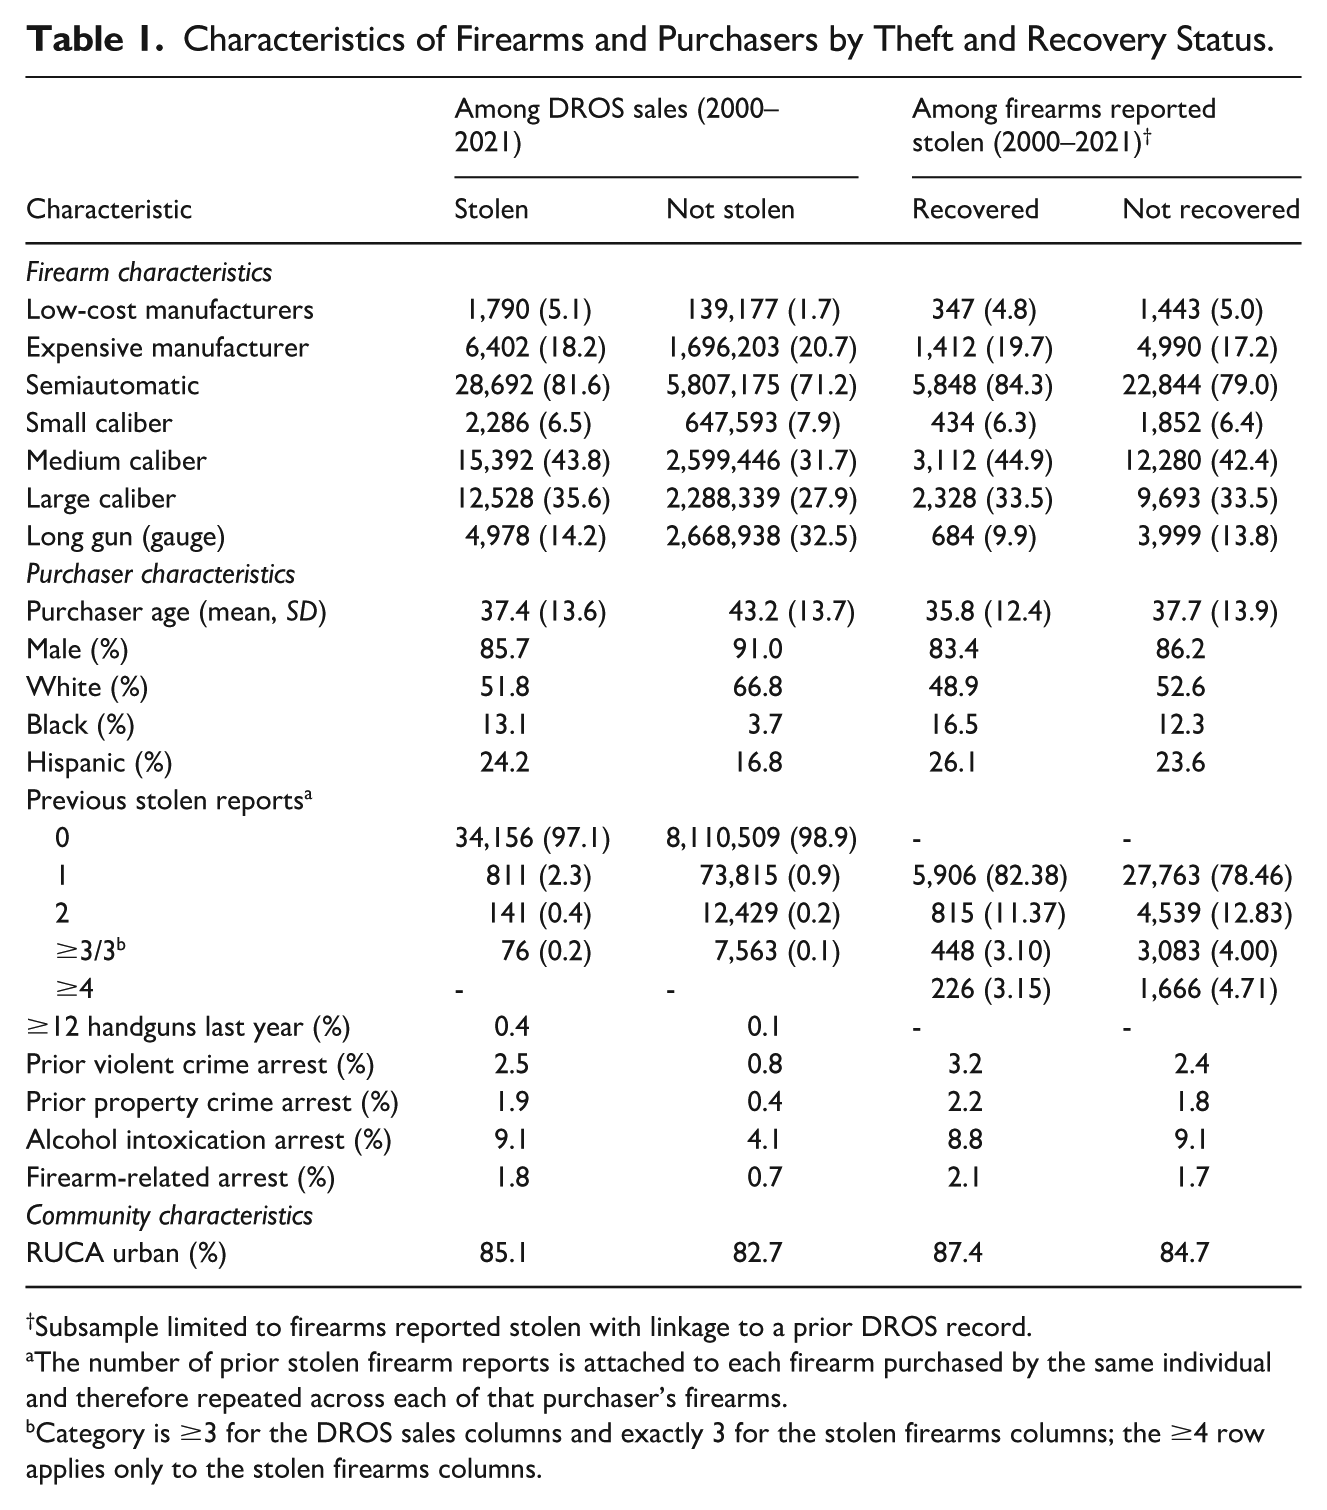
Subsample limited to firearms reported stolen with linkage to a prior DROS record.
The number of prior stolen firearm reports is attached to each firearm purchased by the same individual and therefore repeated across each of that purchaser’s firearms.
Category is ≥3 for the DROS sales columns and exactly 3 for the stolen firearms columns; the ≥4 row applies only to the stolen firearms columns.
We next present the multivariable survival models to assess how firearm, purchaser, and transaction characteristics are associated with theft and subsequent recovery.
Multivariate Survival Analyses
Predictors of Theft
Table 2 presents select results for key firearm, purchaser, transaction, and geographic predictors of reported theft. Full model estimates and sex-stratified results are presented in the Appendix Table A1.
Predictors of Firearm Theft. a

Note. SVI = CDC Social Vulnerability Index, scaled per standard-deviation increase.
Select significant variables presented. Appendix Table A1 presents the results for all variables included in the model.
p < .05. **p < .01. ***p < .001.
Firearm Characteristics
Inexpensive handguns were associated with a 74% higher hazard of theft (Hazard Ratio [HR] = 1.74, 95% CI [1.66, 1.82]). In contrast, expensive handguns were significantly less likely to be stolen (HR = 0.83, 95% CI [0.80, 0.86]). Compared to small-caliber handguns, both medium- and large-caliber handguns had elevated hazards of theft (HR = 1.36 for each), while long guns were significantly less likely to be stolen (HR = 0.51).
Purchaser Characteristics
Risk of theft was higher among younger male purchasers, with each 10-year increase in age associated with a 19% lower hazard of a subsequent theft report, and purchases made by males associated with 22% higher hazard. Relative to White purchasers, Black purchasers faced nearly three times higher risk of theft (HR = 2.87).
A more extensive cumulative firearm purchase history was associated with reduced risk of theft: for example, purchasers with more than 20 prior firearm transactions had a 70% lower hazard of theft compared to those who had only one firearm. In contrast, recent handgun purchasing was not associated with theft risk in either the full sample or among male purchasers. However, among female buyers, high-volume recent handgun purchasing was associated with a substantial increase in theft risk: women who had purchased 12 or more handguns in the past year had 3.7 times greater hazard of firearm being reported stolen compared to those with no prior handgun purchases in that period (95% CI [1.31, 10.38]).
A purchaser’s prior history of theft reporting was strongly associated with subsequent theft: compared to purchasers with no prior reports, those with one, two, and three or more prior reports had 2.50, 3.01, and 3.81 times the hazard of another reported theft, respectively.
Purchaser criminal history within the past 10 years was consistently associated with increased risk of theft. A prior property crime arrest was associated with twice the hazard of theft (HR = 1.98), as was any prior infraction (HR = 1.99). Arrest for alcohol-related intoxication (HR = 1.58), major violent crime (HR = 1.49), and firearm-related offense (HR = 1.36) were also each significantly associated with elevated theft risk.
Transaction Characteristics
Several transaction features were significantly associated with theft risk. Firearms acquired through private party transfers were less likely to be reported stolen (HR = 0.72). In contrast, firearms redeemed from a pawn shop were more likely to be reported stolen (HR = 1.23), while those put up for sale by a pawn shop were less likely (HR = 0.50).
Geographic and Community Characteristics
Components of the Social Vulnerability Index (SVI) were associated with significant but small increased risk (HRs ranging from 1.01 to 1.10 per one-standard deviation increase). Firearms purchased in urban areas (RUCA code 1) had a higher hazard of theft risk (HR = 1.26). Theft risk also varied significantly by region: compared to the greater Sacramento region, risk was lower in San Diego County (HR = 0.54), Orange County (HR = 0.64), Los Angeles region (HR = 0.75) and somewhat higher in the San Joaquin Valley (HR = 1.18) and the North/Mountain Region (HR = 1.12).
Sensitivity Analysis
Results were comparable in the model restricted to firearm transactions from 2010 onward (Appendix Table A1).
Predictors of Recovery Among All Stolen Firearms
We next examined predictors of recovery among all firearms reported stolen, regardless of linkage to a prior legal transaction in the DROS system. Predictors were limited to firearm characteristics and the city where the theft was reported. Results are shown in Table 3. We note that crime gun recovery reflects not only patterns of criminal firearm use but also variation in law enforcement practices, tracing completeness, and reporting across jurisdictions; estimates reflect observed recovery rather than the full incidence of criminal firearm use.
Predictors of Crime Gun Recovery Among All Reported Stolen Firearms. a

Select significant variables presented. Appendix Table A2 presents the results for all variables included in the model.
p < .05. **p < .01. ***p < .001.
Firearm Characteristics
High cost stolen firearms had a 22% lower hazard of recovery. There was not a significant association between low-cost firearms and recovery risk. Compared to small-caliber handguns, both medium-caliber (HR = 1.36) and large-caliber (HR = 1.34) firearms were more likely to be recovered, while long guns were significantly less likely to be recovered than handguns (HR = 0.57).
The model included an indicator for whether the stolen firearm had a prior record in DROS. This was associated with an increase in risk of crime gun recovery (HR = 1.56), which may reflect the greater traceability of firearms with documented transaction histories rather than greater criminal use. Results were substantively unchanged when the indicator was excluded from the model.
City of Theft
The likelihood of crime gun recovery varied by the city in which the theft had been reported. Firearms stolen in Long Beach (HR = 1.69), Los Angeles (HR = 1.56), San Diego (HR = 1.38), Fresno (HR = 1.36), and Stockton (HR = 1.27) were more likely to be used and recovered in crime compared to cities not included in the model. Firearms reported stolen in Bakersfield (HR = 0.66) and Merced (HR = 0.61) were less likely to be recovered. These city-level differences likely reflect not only variation in local criminal markets and patterns of firearm use but also differences in law enforcement practices, including NIBIN participation, proactive tracing, and crime gun investigation protocols.
Secondary Analysis
Results were largely unchanged when we examined recovery in connection with a violent crime and when firearms reported stolen and recovered on the same day were excluded (Appendix Table A2).
Predictors of Recovery Among DROS-Linked Stolen Firearms
Multivariable results for stolen firearms linked to a prior DROS transaction are shown in Table 4. This specification incorporated purchaser and transaction characteristics in addition to firearm and geographic predictors. Selected results are highlighted here, with complete estimates reported in Appendix Table A3.
Predictors of Recovery Among DROS-Linked Stolen Firearms. a

Note. SVI = CDC Social Vulnerability Index, scaled per standard-deviation increase.
Select significant variables presented. Appendix Table A3 presents the results for all variables included in the model.
p < .05. **p < .01. ***p < .001.
Transaction and Firearm History
Shorter time between purchase and theft report was among the strongest predictors of recovery: each additional year reduced the hazard by 55%. A more extensive firearm purchase history was associated with a progressively lower recovery risk: compared to purchasers with only one prior transaction, 23% lower for 2 to 5 purchasers, 41% lower for 6 to 10, 48% lower for 11 to 20, and 63% lower for more than 20 prior purchases. In contrast, recent handgun purchasing (at least one handgun in the past year) was associated with a 25% higher hazard of recovery. Prior history of reporting stolen firearms was associated with reduced recovery risk: compared to purchasers with only one stolen report, hazards were significantly lower for those with two (HR = 0.82) or four (HR = 0.78) prior reports.
Firearm Characteristics
Expensive stolen firearms remained inversely associated with recovery (HR = 0.92), though the magnitude of the association was attenuated compared to the model with fewer covariates (Table 2). Compared with small caliber handguns, medium and large caliber was no longer associated with recovery in this fully adjusted model, while long guns remained protective (HR = 0.55). In a supplementary model restricted to this DROS-linked subset but excluding the purchaser and transaction covariates, medium and large caliber were again significantly associated with recovery, though the effect was smaller than in the full stolen firearm sample (Appendix Table A3).
Several firearm history variables were associated with reduced recovery risk including any prior law enforcement hold (HR = 0.11), law enforcement release (HR = 0.25), or previous lost report (HR = 0.40).
Purchaser Characteristics
Purchaser-related variables were generally weakly associated with crime gun recovery or were non-significant. Sex and race/ethnicity were not meaningfully associated with recovery. Older age was modestly protective (HR per 10-year increase = 0.90). Firearms acquired by foreign-born purchasers (HR = 0.93) and U.S. citizens (HR = 0.82) were also somewhat less likely to be recovered in crime. Most criminal history measures showed no association with recovery; the exception was a history of major violent crime, which was associated with a lower hazard of recovery (HR = 0.72).
City of Theft Report
Firearms reported stolen in Fresno (HR = 1.61), Stockton (HR = 1.66), Sacramento (HR = 1.36), San Diego (HR = 1.25), San Bernardino (HR = 1.16), and Tulare (HR = 1.31) were significantly more likely to be recovered; recovery was less likely for firearms reported stolen in Bakersfield (HR = 0.59). Associations previously observed for Los Angeles, Long Beach, Merced, and San Joaquin in the all-stolen-firearms model were no longer significant in this DROS-linked model that included purchaser and transaction covariates. In the supplementary version of the DROS-linked model that excluded the purchaser and transaction variables, some of these city associations again reached significance (Appendix Table A3).
Community and Geographic Characteristics
Recovery risk varied somewhat by the region in which the firearm was originally purchased. Compared with the Greater Sacramento Region, recovery was significantly less likely for firearms purchased in the North/Mountain Region (HR = 0.62) and the San Joaquin Valley (HR = 0.81), while firearms purchased in Los Angeles County were more likely to be recovered (HR = 1.18). Firearms purchased in urban areas (RUCA code 1) were slightly more likely to be recovered (HR = 1.12). Firearms reported stolen in the same county where they were originally purchased were also more likely to be recovered (HR = 1.36, 95% CI [1.28–1.46]). Measures of community vulnerability based on the purchaser’s address—including SVI components for housing status, racial and ethnic minority status, and housing type and transportation—were not significantly associated with recovery risk.
Secondary Analysis
Limiting the outcome to recovery in connection with a violent crime yielded substantively similar results (Appendix Table A3).
Results from the purchaser-level Poisson model showed that multiple prior stolen firearm reports were strongly associated with higher recovery counts (Risk Ratio [RR] = 2.84 for two prior reports; RR = 2.07 for ≥3; Appendix Table A4). Otherwise, the associations were comparable to the transaction-level Cox model, showing no or weak relationships between purchaser characteristics and crime gun recovery risk.
Discussion
This study provides new evidence on firearm and purchaser characteristics associated with reported theft, and on the features of stolen firearms associated with increased risk of law enforcement recovery in crime. We found the risk factors for theft substantially overlap with those previously documented for crime gun recovery: low-cost semiautomatic handguns, medium- and large-caliber handguns, and purchasers who were younger, male, Black, had prior arrests, and lived in disadvantaged urban areas (Koper, 2014; Pierce et al., 2003; Robinson et al., 2024). Theft risk was also elevated among female buyers with recent high-volume handgun acquisitions (≥12 in the past year)—a purchasing pattern we previously found to be associated with a 13-fold higher hazard of crime gun recovery from an illegal possessor (Laqueur & Robinson, 2025). Other studies have similarly linked multiple short-interval acquisitions to elevated risk of crime gun recovery (Koper, 2014). Together, these firearm and purchaser profiles suggest that theft is likely an important pathway into illicit firearm markets, whether through direct criminal use, trafficking networks, or false reporting to conceal illicit transfers.
Theft risk was markedly higher among purchasers who had previously reported firearm(s) stolen: compared to purchasers with no prior theft reports, those with one, two, or three or more reports had a 2.5-, 3-, and nearly 4-fold higher hazard of a subsequent theft report, respectively. This pattern of progressively higher risk is consistent with concerns that some theft reports may be used strategically among straw purchasers seeking to distance themselves from firearms diverted into the illicit market (Ridgeway et al., 2011; Smart, 2020). California’s regulatory environment helps contextualize why such strategic reporting might emerge. The state’s lost-and-stolen reporting requirements increase pressure to account for missing firearms, while California’s comprehensive transaction and tracing systems elevate the perceived liability associated with unrecorded transfers. Because all firearm transfers in California must be completed through a licensed dealer with a background check, purchasers who divert a gun through an undocumented transfer cannot plausibly claim a lawful private sale if the firearm is later recovered. In this context, reporting a gun as stolen becomes one of the few legally viable explanations for a firearm’s disappearance. Experimental evidence from Los Angeles lends support to this mechanism: gun purchasers who received a reminder letter about their obligations to record any future transfers subsequently reported their guns stolen at twice the rate of those who did not receive the letter (Ridgeway et al., 2011).
At the same time, repeated victimization remains a plausible alternative explanation, particularly for individuals living in higher-crime areas where both theft and crime-gun recovery are more common. A more extensive cumulative purchase history was associated with substantially lower theft risk, which may reflect more secure storage practices among experienced gun owners (e.g., safes, lock boxes), greater familiarity with theft prevention, or a form of survivorship in which long-term owners who have retained multiple firearms without incident represent an inherently lower-risk group. Differences in theft risk by purchaser demographics may similarly reflect differential exposure to property crime victimization, variation in storage and carrying practices, or neighborhood-level differences in theft risk.
Our data cannot adjudicate between diversion and genuine victimization, but the combination of repeated theft reports, short purchase-to-theft intervals, and high-volume purchasing may merit enhanced scrutiny from enforcement agencies. Although California has relatively stringent firearm regulations, it does not have a “permit-to-purchase” law (Giffords Law Center to Prevent Gun Violence, 2025). Such laws require prospective buyers to apply in person for a permit before purchasing a firearm, undergo an enhanced background check, and be fingerprinted. Research suggests that permit-to-purchase laws reduce the diversion of guns for use in crime, and that the application process itself may deter prospective straw purchasers (Crifasi et al., 2017, 2019, 2023).
The finding that firearms stolen soon after purchase were substantially more likely to be recovered in crime lends further support to the interpretation that many firearm thefts reflect illicit market diversion. Each additional year between purchase and theft reduced the recovery hazard by more than half. This rapid diversion aligns with prior research identifying short “time-to-crime” as a marker of trafficking or illicit transfer (Braga et al., 2021; Bureau of Alcohol, Tobacco, Firearms and Explosives, 2023b; Stansfield et al., 2025). These stolen firearms may have been rapidly diverted for criminal use after retail sale via theft or may have been falsely reported stolen by a straw purchaser seeking to disassociate themselves from the firearms before their use in crime (Smart, 2020). In either case, monitoring short time-to-theft patterns could help identify suspicious transactions warranting closer review by enforcement agencies.
Among stolen firearms with a prior record in DROS, a more extensive cumulative purchase history among the last known purchaser was inversely associated with recovery, likely reflecting the same underlying dynamic as the lower risk among firearms with longer intervals between purchase and theft. Firearms stolen from purchasers with a more extensive lifetime purchase history have likely been owned longer and may be more likely to represent genuine theft victimization rather than rapid diversion into criminal markets.
Purchaser demographic characteristics showed weaker associations with recovery than we found with risk of theft or than has been reported in the crime gun literature. Race, age, and criminal history showed little or no association; older age (Koper, 2014) and foreign birth were modestly protective. This suggests that, while some false reporting likely occurs, most reported thefts likely reflect genuine victimization—so once a gun is stolen, the characteristics of the original purchaser are largely unrelated to whether it is later recovered in crime.
Counterintuitively, we found that a more extensive history of prior theft reports was associated with a lower hazard of recovery. This may reflect a spurious association from conditioning on only stolen firearms (which could induce collider bias) or relate to the structure of the firearm-level model, where each firearm inherits the purchaser’s theft history and prior theft reports are repeated for purchasers who buy many guns. To assess this latter possibility, we estimated a purchaser-level Poisson model, which showed that having multiple prior theft reports was strongly associated with higher crime recovery counts.
We found crime gun recovery risk varied substantially by both the city where the theft was reported and, for DROS-linked firearms, by the region in which they were originally purchased. These differences may reflect variation in local criminal markets but could also stem from variation in local tracing diligence, theft reporting completeness, or crime gun investigation practices. Most prior research has reported on single jurisdictions or national survey statistics, which mask this heterogeneity across place. Firearms reported stolen in the same county where they were originally purchased were modestly more likely to be recovered, suggesting that diversion often occurs within the same local contexts, though county boundaries provide only a coarse measure of proximity. This pattern is consistent with prior research showing that firearms recovered in crime tend to originate from nearby sellers (Koper, 2014). The pattern could also partly reflect regional law enforcement practices—for example, if nearby agencies share NIBIN data or operate within shared tracing and recovery systems, firearms stolen and recovered within the same broader region may be more likely to be identified and linked in the data.
Despite the general patterns suggesting theft as a diversion into criminal markets, most stolen firearms were never recovered in crime: about 12% overall, and 17% among DROS-linked firearms. The lower recovery rate among long guns, and their lower hazard of recovery in adjusted models, suggests that they are more often stolen for retention or resale, consistent with the fact that most firearms recovered in crime are handguns (~70%). Similarly, high-cost firearms had a lower risk of recovery, which may indicate that, at least for this small subset, they are more likely to be stolen for personal use or resale, akin to other high-value stolen property.
For the remaining stolen firearms never recovered in crime, the relatively low recovery rate may not mean that they are not used in crime. The percentage recovered reflects only a lower bound on the share of stolen guns used in crime, since many crime guns are never recovered, and many that are recovered are not successfully linked to a prior theft. Many may be used in crime and then quickly disposed of, trafficked, or moved out of California. The 269-day median time from theft to recovery suggests that, when stolen firearms do enter criminal circulation, they often do so quickly. Moreover, stolen guns are clearly overrepresented among recovered crime guns: among DROS-linked firearms, 14% of those recovered in crime had previously been reported stolen, whereas there were roughly 180 DROS transactions for every reported theft (0.6%). This suggests that firearms reported stolen are more than 20 times as likely to be recovered in connection with a crime as would be expected if stolen and non-stolen guns were equally likely to be used in crime.
Limitations
This study has several limitations. The analysis captures only thefts reported to law enforcement; unreported thefts are not captured, and reporting practices may vary across jurisdictions. Reporting incentives may also differ by purchaser characteristics and local enforcement practices, which could influence who reports thefts and when. Recovery is also an imperfect proxy for criminal use, as many guns used in crimes are never recovered. While California’s mandatory tracing and reporting requirements help standardize recovery data, differences in investigative follow-up, tracing completeness, and reporting accuracy could contribute to geographic variation in recovery risk. Several of our predictors are proxies and subject to measurement error. In particular, our firearm cost measure was based on manufacturer median values from the Blue Book of Gun Values; this provides only a rough proxy and does not capture actual transaction prices, inflation adjustments, or secondary market variation. Another limitation concerns the analytic sample: the more detailed analysis of predictors among stolen guns is restricted to firearms with prior legal transaction records in DROS, and the characteristics of stolen firearms without such records may differ systematically from those with records. A substantial share of stolen firearms could not be linked to a DROS transaction record. This likely reflects firearms acquired prior to DROS reporting, guns originally purchased out of state, unrecorded private-party transfers, and incomplete or degraded serial-number information that prevented definitive matches. As a result, the DROS-linked subsample may differ from unlinked stolen firearms in ways we cannot observe. The study is limited to California, which has stronger firearm regulations than many other states; patterns of theft and recovery may differ elsewhere. Finally, this is a descriptive study that documents associations between firearm, purchaser, and transaction characteristics and the risk of theft or recovery, but it does not establish causal relationships.
Conclusions
Despite these limitations, this study provides new population-level evidence on firearm theft as a diversion mechanism. While only a minority of stolen guns were later recovered in crime by law enforcement, the overlap in risk factors for theft and crime gun recovery, together with evidence of rapid diversion, point to theft and stolen-firearm reporting as important pathways into illicit firearm markets. These patterns highlight opportunities to improve identification of suspicious transactions and underscore the importance of continued attention to how stolen firearms contribute to criminal activity and illicit market dynamics.
This research was made possible by California’s comprehensive firearms data infrastructure. Expanding such integrated data systems to other jurisdictions would advance understanding of how firearms move from legal to illegal markets and enable evaluation of risk factors and interventions across different regulatory environments.
Footnotes
Appendix
Purchaser Characteristics Associated with Crime Gun Recovery Counts.

| Variable | Risk ratio (95% CI) |
|---|---|
| Purchaser age, per 10 years | 0.979 (0.960–0.997)* |
| Purchaser is male | 1.005 (0.937–1.077) |
| Purchaser is a citizen | 1.002 (0.853–1.176) |
| Purchaser is foreign born | 0.986 (0.908–1.070) |
| Purchaser race and ethnicity | |
| White | Reference |
| Native American/Pacific Islander | 1.073 (0.902–1.276) |
| Asian | 1.128 (1.023–1.245)* |
| Black | 1.167 (1.084–1.258)**** |
| Hispanic | 0.998 (0.934–1.066) |
| Other | 1.098 (0.898–1.342) |
| Purchaser number of gun purchases | |
| 1 | Reference |
| 2–5 | 1.074 (1.016–1.135)* |
| 6–10 | 1.087 (0.979–1.207) |
| 11–20 | 1.185 (1.019–1.378)* |
| More than 20 | 1.047 (0.831–1.318) |
| Handguns bought in the last year | |
| 0 | Reference |
| 1 | 1.167 (1.079–1.261)*** |
| 2–5 | 1.252 (1.120–1.399)**** |
| 6–12 | 1.133 (0.839–1.531) |
| Purchaser’s previous reported stolen | |
| 1 | Reference |
| 2 | 2.838 (2.542–3.169)**** |
| ≥3 | 2.071 (1.594–2.690)**** |
| Criminal history (past 10 years) | |
| Infraction | 1.025 (0.727–1.445) |
| Alcohol intoxication | 0.961 (0.884–1.044) |
| Firearm-related | 0.827 (0.696–0.983)* |
| Major violent crime | 0.857 (0.734–1.000) † |
| Major property crime | 0.951 (0.795–1.138) |
| Community characteristics | |
| SVI, socioeconomic status | 0.982 (0.966–0.997)* |
| SVI, housing status | 0.987 (0.976–0.997)* |
| SVI, racial/ethnic minority status | 1.039 (1.024–1.053)**** |
| SVI, housing type/transportation | 0.994 (0.984–1.005) |
| RUCA code 1 (urban) | 1.286 (1.186–1.395)**** |
*p < .05. ***p < .001. ****p < .0001. †p = .05.
Acknowledgements
We thank Philip Cook for his thoughtful suggestions on the analysis plan and helpful comments on manuscript drafts, and Chris McCort for his work on data preparation and model setup during the early stages of the project.

Funding
The authors disclosed receipt of the following financial support for the research, authorship, and/or publication of this article: This research was supported by the California Firearm Violence Research Center and by a grant from the the National Collaborative on Gun Violence Research (Award # A21-1440-001).
Declaration of Conflicting Interests
The authors declared no potential conflicts of interest with respect to the research, authorship, and/or publication of this article.