
Abstract
The unavailability and inaccessibility of official crime data in developing countries present a major challenge for crime analysis. This study explores the potential of transforming news media content into a structured dataset suitable for pattern analysis in Georgetown, Guyana. A corpus of 5,487 newspaper articles was systematically extracted across three different newspaper platforms using crime-related keywords. In order to reveal the spatio-temporal pattern of crime in the city, the extracted news articles were analyzed using spatial point pattern methods. Findings revealed a clear temporal trend of crime peaking at 7:00 pm during weekdays and late in the night to early mornings on weekends. The temporal analysis also revealed that crime peaks on weekends. The spatial point pattern analysis confirmed significant clustering of crime at micro places, while the bivariate relationship showed the spatial dependence between pairs of crime types.
Keywords
Introduction
Crime is a type of behavior considered illegal by the laws of a given society or government (Noor et al., 2022). Crime, therefore, is an act that violates the established rules, norms, and expectations that regulate people’s behavior in a community.
Crime influences the quality of life and the economic well-being of a society (Shohan et al., 2022) and serves as a pivotal gauge of a country’s development and social welfare, and consequently policymakers and law enforcement agencies have often prioritized crime prevention (Bernasco & Block, 2011). However, in many developing countries, understanding the nature and extent of crime remains a challenge due to the unavailability of comprehensive official crime data. Issues such as delayed publication and geospatial precision restrict the utility of traditional sources like police records and national crime statistics. In response to this challenge, researchers are increasingly turning towards alternative data sources (e.g., Azam et al., 2015; Cummings et al., 2024; Gerber, 2014; Umair et al., 2020). The deluge of big data has facilitated the growing body of literature that harnesses crowdsourced data for spatial analysis. Platforms such as X (formerly Twitter) and Next-door, which enable users to generate and share real-time, location-specific content have become increasingly valuable sources of crime data. Scholars (e.g., Bendler et al., 2014; Wojcik & Hughes 2019) have demonstrated the utility of these platforms for examining various social phenomena, including crime patterns, prediction, and public sentiment.
The increasing coverage of internet-based crime news has provided data that are useful for crime analysis (Marsh, 1991; Ristea et al., 2020). In contrast to social media data, where the accuracy of content can be questioned since posts are often unverified and could contain misinformation, news articles are typically written by Journalists and most times are governed by regulatory agencies that set standards and guidelines ensuring that news are fact-checked, validated, and adheres to journalistic ethics before publishing (Marsh, 1991). Often, the news media provide in-depth coverage of crime incidents, including spatial references such as street names, neighborhoods, and recognizable landmarks that are crucial for effective spatial analysis (Umair et al., 2020). Beyond geographic details, news reports frequently offer rich contextual information, including the nature of the crime, the backgrounds of both the victim and the offender, the relationship between them, and subsequent judicial proceedings (Umair et al., 2020), enhancing the analytical value of news media as a data source. In contrast, social media platforms typically rely on user-generated geotagged content, which can be unreliable or absent (Groff & Haberman, 2023). Furthermore, when posts are not made at or near the location of the crime event, spatial accuracy becomes compromised (Gerber, 2014). These limitations give news media a distinct advantage over social media for rigorous and context-sensitive spatial crime analysis.
While news articles have been adopted for crime and spatial analysis in developing countries (see Cummings et al., 2019, Umair et al., 2020), it is important to acknowledge that news articles are primarily written to provide information to the public, hence they are inherently unstructured and require robust data extraction and coding techniques to make them useful for spatial analysis (Ceccato et al., 2021; Umair et al., 2020). Previous studies (e.g., Cummings et al., 2019, 2024; Sulieman, 2020) have relied on the traditional content analysis which are time-consuming and labor-intensive, particularly when each news article must be manually reviewed to extract relevant variables for crime analysis. This study seeks to extend previous work by examining how the data extraction of the crime reported news and variables can be automated by applying Natural Language Processing (NLP) techniques. Although studies (e.g., Umair et al., 2020) have incorporated NLP methods, most have been conducted in data-rich countries where pretrained NLP models are optimized for dominant language patterns and editorial standards. In contrast, this study focuses on Guyana, a developing nation where existing pretrained NLP models may not perform reliably due to underrepresentation in global training datasets and linguistic nuances. To address this gap, we examined how machine learning algorithms can be used to train NLP models capable of extracting crime-related information from news articles within the Guyanese context. Specifically, we aim to: (1) automate the extraction of reported crime-related news articles in the Guyanese news using NLP techniques, (2) train a specific NLP to addresses issues surrounding underrepresentation in existing pretrained models, (3) generate a structured database that captures key variables needed for crime pattern analysis, and (4) analyze the spatiotemporal distribution of crime based on the extracted crime reports in the news using both the first and second-order spatial point pattern analytical methods. This study contributes to the growing literature on alternative crime data sources in developing nations while also revealing the spatiotemporal pattern of crimes as depicted in local newspapers.
Related Work
Crime and Media
The use of media as a data source for understanding crimes dates back to the 1950s. Early studies, such as Davis (1952), used newspaper archives to look at the public opinion on crime trends and how it influences crime news. Similarly, Ditton and Duffy (1983) analyzed crime content reported in six different newspapers across Strathclyde Region in Scotland. In recent years, the use of social media data for spatial analysis has received some attention, particularly in its applications in understanding crime patterns, predicting crime, and studying the behavior of potential victims and offenders (Burnap & Williams, 2016; Gerber, 2014). The use of social media, however, warrants caution since only a small number of users create most of the tweets (Wojcik & Hughes, 2019). Also, only a small percentage of users include their precise location when posting on X (Aghababaei & Makrehchi, 2018). Although studies have expanded to include social media data, traditional news outlets still retain their longstanding role in shaping crime narratives.
Crimes are typically represented in the news through a variety of ways, including headlines, articles, and multimedia such as images or videos. It has been argued that these news outlets serve the general public as people often get first-hand information on crime from them before accessing police reports (Davis, 1952, Ditton & Duffy, 1983). Marsh (1991) identified that the “freedom of the press” granted to newspapers has protected them and encouraged the dissemination of accurate information to the public. However, Emery (1972) criticized their operation on the premise that the freedom of the press has rendered them immune to scrutiny, thereby enabling the dissemination of information without adequate checks or accountability. Further, Smith (1984) emphasized the pivotal role of newspapers in reporting incidents of crime within society. This role, however, comes with significant responsibility, as misrepresentation within these reports has the potential to distort the overall crime landscape.
When news articles inaccurately portray the prevalence or severity of criminal activities, it can contribute to the creation of an exaggerated perception of the crime situation, and whether intentional or not, may lead to an increased fear of crime in the public. Consequently, crime reporting can influence community behavior, trust in institutions, and even policy responses. In light of these implications, various scholars (e.g., Davis, 1952; Ditton & Duffy, 1983; Sheley & Ashkins, 1981) have sought to evaluate how accurately media coverage represents actual crime patterns. Sheley and Ashkins (1981) compared crimes reported in television news and print media against the police crime reports and found that print media had a closer distribution to the official report on crime. However, these studies did not look at the spatial distribution of crime news, rather focusing on how the perception of fear and overrepresentation of crime news in the media contribute to creating even more fear.
In recent years, the analysis of news reports has become an increasingly valuable method for understanding crime patterns. Through content analysis, researchers have been able to extract detailed insights into specific crime types and demographics. For instance, Heide and Boots (2006) reviewed and interpreted the content of over 200 news reports to study parricide cases on a global level, revealing the key differences between the U.S and non-U.S. cases. Similarly, Vinnakota et al. (2022) analyzed data from six British newspapers to explore the characteristics of knife crime victims, highlighting vulnerabilities among specific demographic groups. News reports have also been adopted in developing nations where official crime data and social media are not readily available. With the use of newspaper archives, Cummings et al. (2024) were able to extend the law of crime concentration to a developing nation setting. These studies underscore the potential of mass media as a rich data source in crime analysis. However, transforming unstructured news articles into usable spatial data remains a methodological challenge. Previous research (e.g., Cummings et al., 2019, 2024) primarily relied on manual data extraction, where relevant details were painstakingly retrieved from each article by hand. To improve efficiency and scalability, recent advances in automation and Natural Language Processing (NLP) offer promising alternatives (see Indurkhya & Damerau, 2010; Umair et al., 2020; Vajjala et al., 2020). These technologies can be used to automatically extract key information such as locations, dates, crime types, and involved parties, enabling researchers to process large volumes of text-based data more rapidly and systematically.
Crime Geography and Analysis
Crime geography, broadly defined, pertains to the spatial distribution and patterns of crime incidents within a specific geographical area (LeBeau & Leitner, 2011). Crime geography includes but is not limited to the study of where crimes occur, why they occur in certain locations, and how various factors such as social, economic, and environmental conditions contribute to the occurrence and distribution of crime. It is important to note that crime does not occur randomly due to underlying social, economic, and environmental factors (Li & Haining, 2022). As a result, a growing number of scholars have devised various methods to analyze patterns observed in both space and time (see Cummings et al., 2024; Nakaya & Yano, 2010; Wooditch & Weisburd, 2016; Zhang et al., 2015). These studies aim to enhance understanding of crime dynamics, improve the accuracy of crime predictions, and formulate effective preventive strategies and measures.
To assess the spatial dynamics of crime, the literature distinguishes between first-order and second-order spatial analytical approaches. Distinguishing between first-order and second-order approaches provides a framework for analyzing both the distribution of crime events and the spatial relationship between them.
First-Order
The first-order approaches are density-based, and these methods look at spatial variation of phenomenon being studied as a result of underlying properties of the local environment (O’Sullivan & Unwin, 2010). One of the most recognizable methods of measuring crime density is the hotspot analysis which relies on Kernel Density Estimation (KDE). KDE has been used by Scholars (see Gerber, 2014; Kamalov, 2020; Prathap et al., 2021; Cummings et al., 2019) not only to visualize crime hotspots but also to forecast potential crime based on spatial patterns. This non-parametric method applies the kernel (mathematical function e.g., Gaussaian and Epanechnikov) across all data points and then averages the point location with respect to other points to create a continuous surface representing the crime density across the geographic area. While KDE has been used to reveal spatial patterns, some issues with this approach have been mentioned in literature. First, its sensitivity to the choice of kernel, cell size, and search radius might impact accuracy (Curman et al., 2015; Groff & Haberman 2023). Similarly, the “edge effect” may lead to high inflation of crime density at the boundary of the study area without considering locations where crime cannot occur (Groff & Haberman, 2023).
Another simple and effective statistical method used to measure the density of points in a location is the Quadrat Counting Method (QCM) (Thomas, 1977). When combined with a
Second-Order
Second-order approaches are interaction-based that relies on the spatial dependence of the points using the distance between points to determine a random, clustered, or uniform spatial pattern (O’Sullivan & Unwin, 2010). These approaches are grounded in Tobler’s (1970) first law of geography—“everything is related to everything else, but near things are more related than distant things.” Distance-based point pattern analysis methods, such as Ripley’s K-function has been widely utilized to investigate spatial patterns (e.g., Dixon, 2002; Groff et al., 2010). The Ripley’s K-function assesses the spatial dependence between points by measuring the expected number of points within a given distance
Temporal Patterns
The need for the inclusion of temporal patterns in crime analysis has begun to gain relevance in recent literature. Getis et al. (2000) identified the need to study the variation in crime rates between day and night, weekday and weekend in a space-time format. In response, a growing body of research has begun to explore these temporal dynamics. In the domain of hot spot analysis, Ratcliffe (2002) introduced the term “aoristic signatures” which are histograms of the temporal distribution of crime within spatial hotspot. Building on this, Ratcliffe (2004) later developed the “Hotspot Matrix,” a framework that categorizes spatial hotspots based on temporal patterns, classifying them as diffused, focused, or acute, according to the shape of their corresponding temporal histograms. The temporal patterns of crime have also been revealed using different approaches. Lauritsen and White (2014) used time series analysis on 7 years of U.S. victimization data to identify seasonal trends in crime. Their findings showed a general decline in household victimization and revealed that most crimes peaked in summer, except for robbery, which showed no seasonal pattern, and assault which peaked in winter. Similar approaches have also been used in other studies to describe and model the seasonal fluctuation of specific crime type (see Ekwall & Lantz, 2022; Stalidis et al., 2018). Findings from these studies have consistently shown a relationship between weather conditions and violent crime rates in the Global North, with violent crimes tending to increase during the summer months, while property crimes are more prevalent in the winter (Cohn, 1990; Corcoran & Zahnow, 2022; Farrell & Pease, 1994). While these studies reveal important seasonal variations in crime, other research has emphasized the significance of finer temporal scales, such as daily or hourly patterns, in understanding crime dynamics.
Time of day plays a critical role in shaping the temporal dynamics of crime across geographic space. The importance of high temporal resolution is highlighted in Schubert’s (2014) study, which examined fluctuations in crime rates in relation to population movement across different locations and time intervals. Building on this perspective, Hipp et al. (2019) utilized social media data to investigate the relationship between crime rates and time of day, offering valuable insights into how variations in the ambient population can influence crime levels within specific spatial units over short time periods.
Methods
Study Area
This research focuses on Georgetown, the capital city of Guyana—a country in the South American continent bounded to the east by Venezuela and west by Suriname. It shares a cultural heritage with other neighboring Caribbean countries such as Trinidad and Tobago and Jamaica (Cummings et al., 2019). In 2015, Guyana made significant offshore oil discoveries and started oil production in December 2019 (Guyana Chronicles, 2019). Like other oil-producing countries, this accelerated the development and growth of the country, attracting foreign expertise and industry establishment (Cummings et al., 2024). What distinguishes Guyana, however, is the highly centralized nature of its development; most economic, infrastructural, and institutional growth is concentrated in and around Georgetown, creating a unique urban dynamic within the national context (Cummings et al., 2024).
Georgetown (Figure 1) is the country’s hub for commerce, governance, and recreation (Cummings et al., 2019). Located at an approximately 6.8044°, −58.1552° Georgetown covers a land area of about 70 km2. With an estimated population of 191,810 (Bureau of Statistics, 2014; Cummings et al., 2024) and approximate population density of 2,740 per km2, Georgetown is the most densely populated city in Guyana. The concentration of people within the city increases the possibility of intersection between the awareness space of a motivated offender and that of a potential victim, presenting several opportunities for criminal activity, hence why it is an ideal study area for this research. Since its inception in the 18th century by the European colonists, Georgetown has evolved into a unique blend of African, Indian, Amerindian, and European influences, making it a microcosm of the country’s diverse heritage (Cummings et al., 2024; Edwards et al., 2005). The city, originally designed by the Dutch, features a canal system built for agricultural irrigation, drainage, and coastal protection. Today, the city reflects a sharp contrast between its historic architecture and areas characterized by some level of urban decay and dilapidation (Cummings et al., 2024). In recent years, the city’s architecture has evolved to include modern shopping centers, which are run by local business owners and foreign investors. The streets along the water channels, which were originally designed for light, low-capacity transport typical of earlier eras, have since been modified to accommodate modern vehicular use, facilitating the concentration of commercial and recreational activities, providing opportunities for crime.
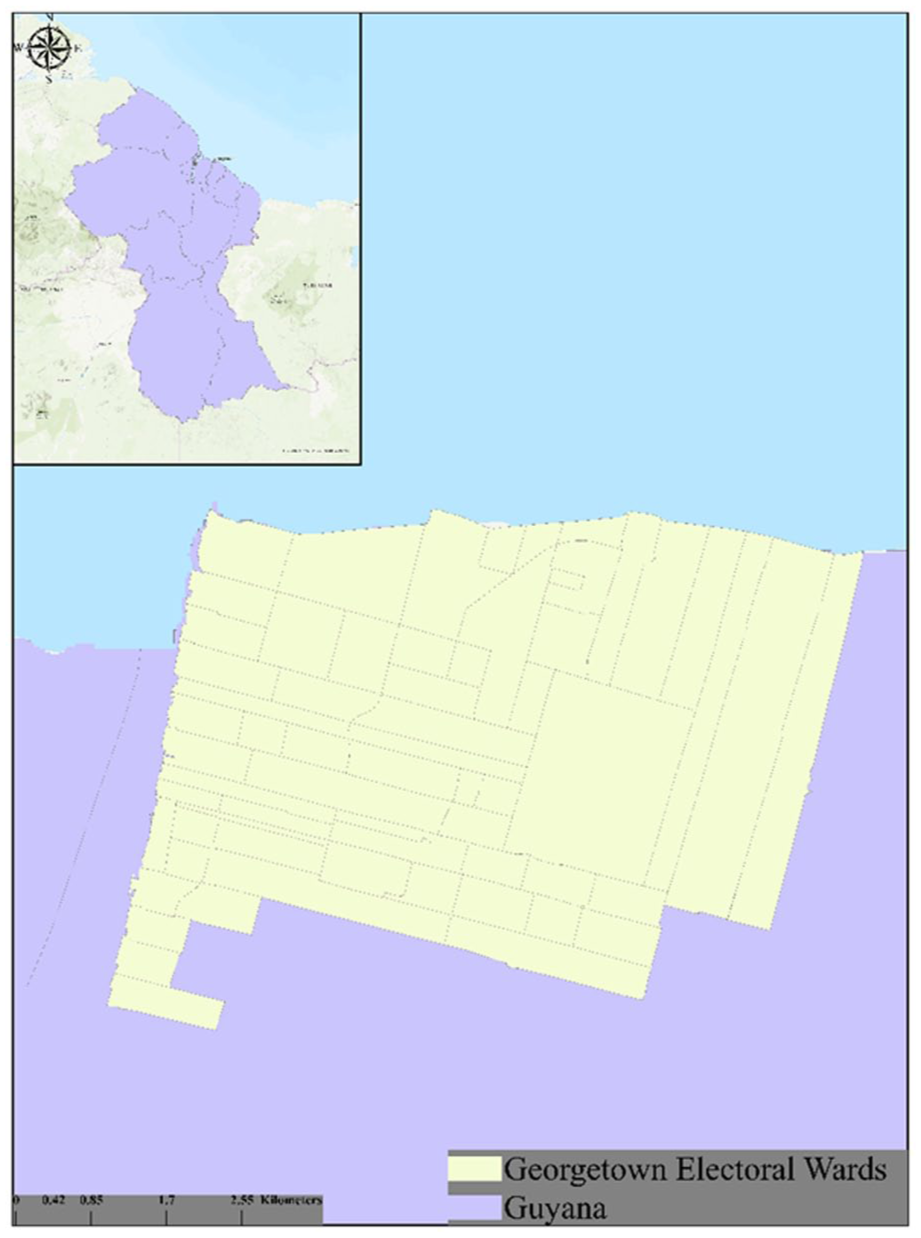
Study area.
As a typical city, Georgetown suffers from many crimes, including robbery, homicide, and aggravated assault. According to the Guyana Police Force’s Annual Crime and Traffic Report for the country, the total reported crime in 2020 was approximately 10,050, which represents a 15% increase from the previous year (Guyana Police Force, 2022). Although this figure might appear modest in absolute terms, it is significant when contextualized against the country’s relatively small population. In response to the rising crime rates, the Guyanese government allocated roughly USD105 million toward public safety—an amount that shows its commitment to crime prevention, as it is nearly three times higher than the allocation for education in the national budget (Department of Public Information, 2023). Despite this investment, in 2022 the United States Department of State placed Guyana at level 3 advisory, suggesting that people should reconsider traveling to the country due to concerns about increasing crime (U.S. Department of State -Bureau of Consular Affairs, 2023). There appears to be a disconnect between the amount of money spent on crime prevention in Guyana and the response observed in the reduction of crime rates. Whether such warnings are based on crime data from Guyana or other sources remains uncertain. Nevertheless, what is certain is that the government of Guyana and the United States appear to agree that crime rates are increasing.
Data and Data Source
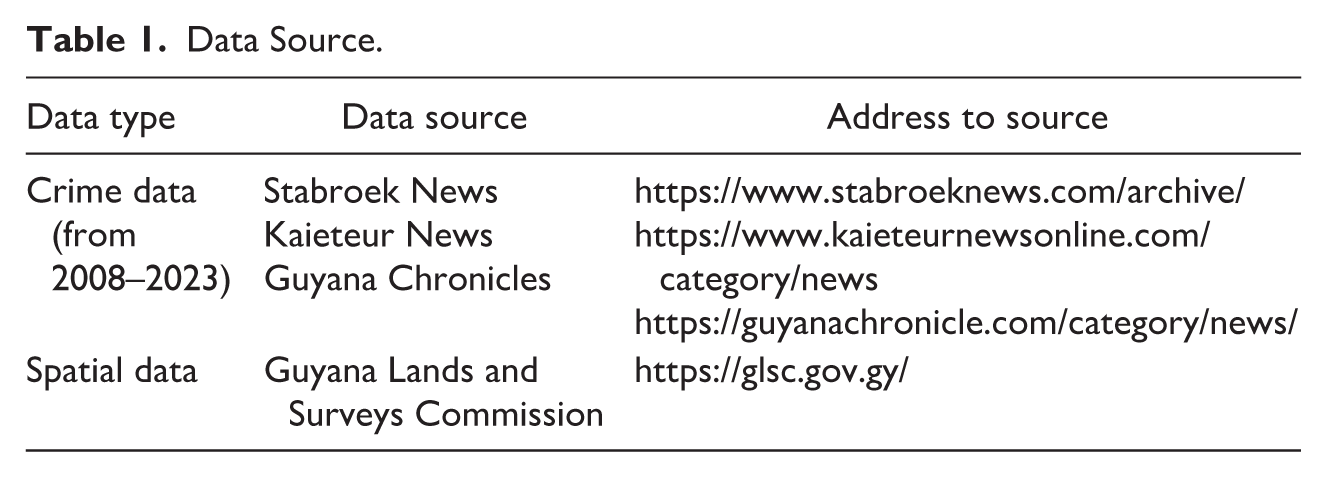
At the time of this study, the only available official documents on crimes for Guyana are aggregated crime counts across the ten administrative regions of the country. The aggregated nature of the data makes it difficult to complete spatial analysis of crime patterns. Hence, this study adopted other unofficial documents for crime incidents, which will serve as crime proxies. Reports on crime incidents have been on the increase over the past two decades in Guyana with emerging newspapers not only reporting crime incidents but also the judicial proceedings that trail behind crimes. This isn’t surprising because crime sells (Cummings et al., 2019). While newspapers offer valuable information for crime analysis, it is essential to acknowledge the potential biases inherent in media reporting. Given the multitude of potential events for coverage, journalists must exercise selectivity. The act of choosing which events to cover marks the first stage in what Tuchman (1978) referred to as news creation. Previous studies (e.g., King, 1987; Marsh, 1991) have demonstrated that certain types of crimes are more likely to receive media attention than others, often influenced by factors such as the nature of the crime, the individuals involved, or the level of public interest and sensationalism surrounding the incident. Nevertheless, mass media are still a valuable source of information. To answer the research questions, the availability of crime news in the media was tapped into. This study relies on three newspaper outlets in Guyana which all have an online archive namely: Stabroek News, Kaietuer News, and Guyana Chronicles (see Table 1). The decision to utilize three different newspapers is intended to mitigate potential reporting bias that may arise from relying on a single news source.
Data Source.
Data Retrieval Methods
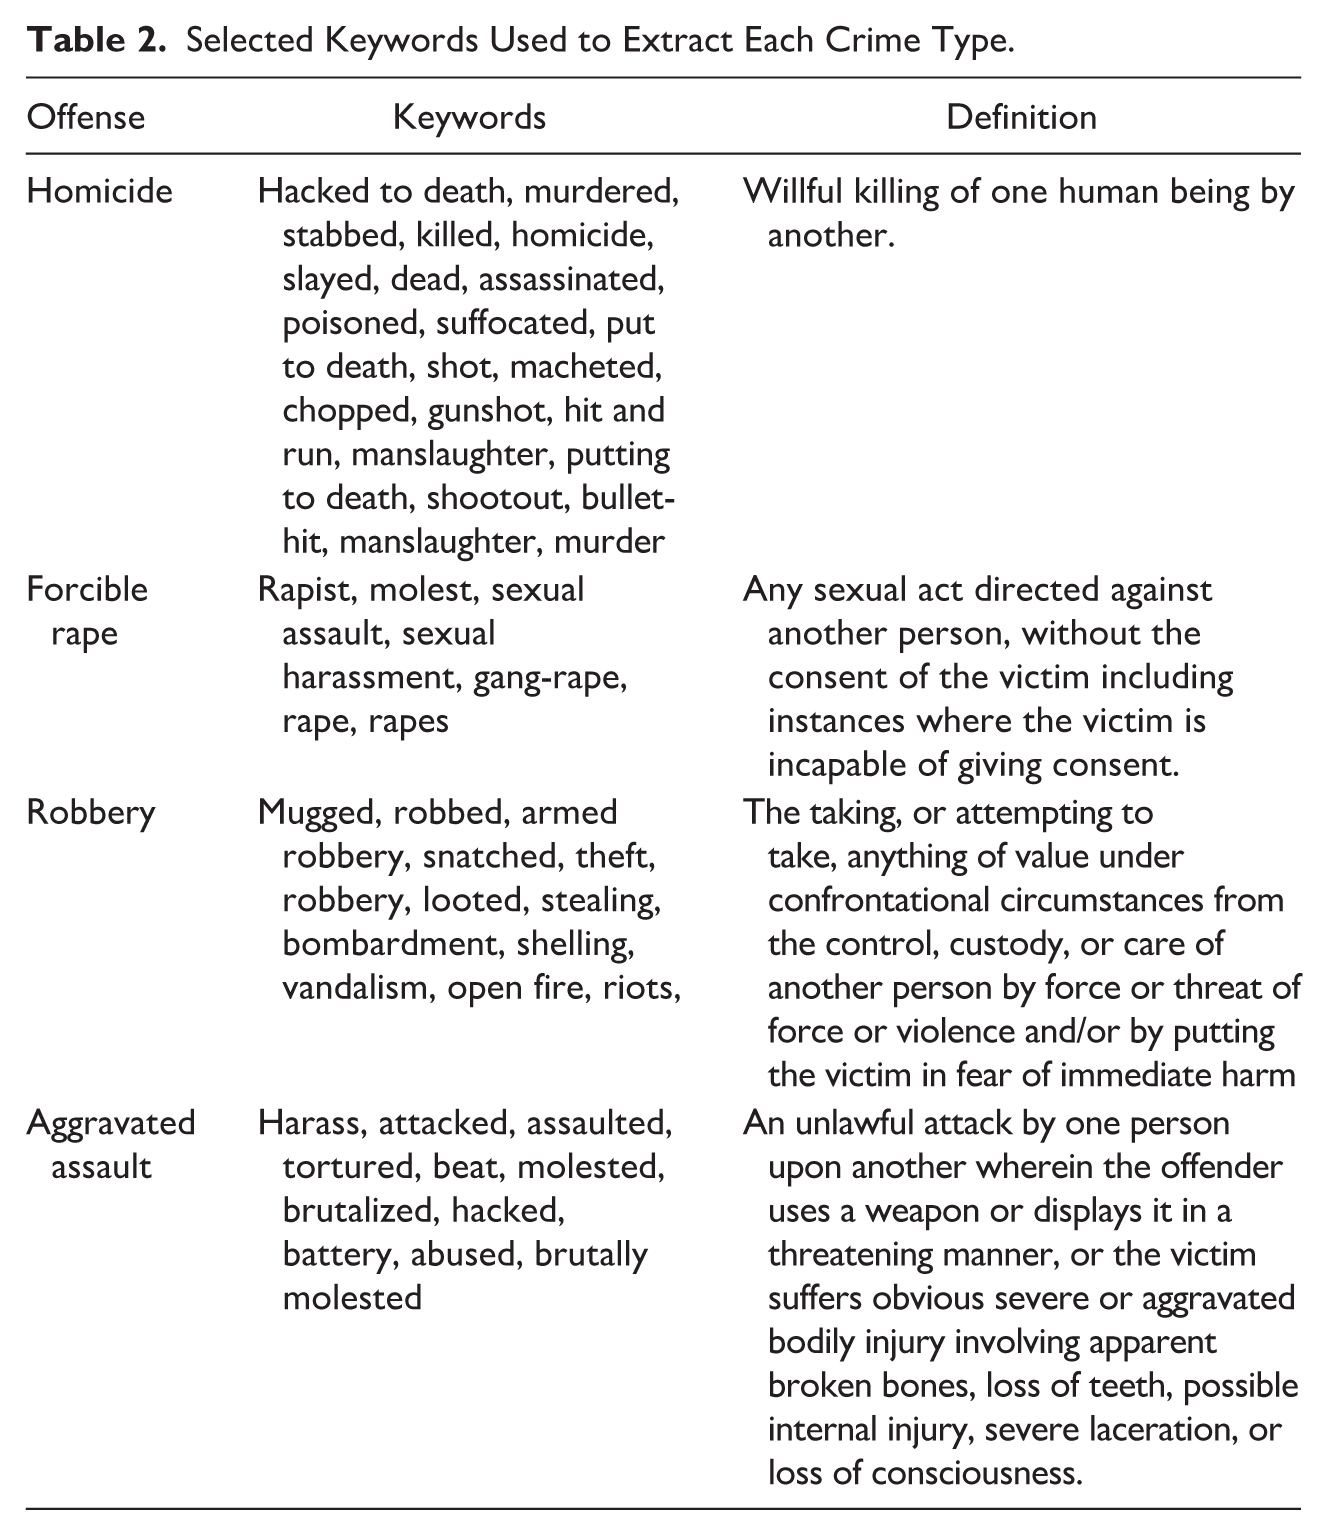
This study only focuses on violent crimes as defined by National Incident-Based Reporting System (NIBRS) covering: homicide, robbery, forcible rape, aggravated assault (see Table 2 for definition of each crime). The first stage in the extraction phase was the identification of keywords (see Table 2) that might be used to describe the identified violent crimes. The selection of these keywords was guided by previous work including Cummings et al. (2019) and Umair et al. (2020), both of which used content analysis approaches to support crime analysis through media sources.
Selected Keywords Used to Extract Each Crime Type.
The related articles were scrapped into a database using Python-based web crawling frameworks: Scrapy (Scrapy, n.d.) in combination with the BeautifulSoup (Richardson, 2007) Python library. The Scrapy was selected because of its flexibility which makes it possible to send HTTP requests to certain pages while BeautifulSoup provides the functions for parsing the HTML of the newspaper archives over the fifteen (2008–2023) years selected and storing them in a database for further processing. It is important to note that the entire article content was analyzed rather than relying solely on headlines, as headlines may contain crime-related keywords without the article itself being relevant to crime (e.g., metaphorical or sensational language). To address this, a few words before and after each matched keyword was looked at ensuring that the article describes a crime incident. Each extracted article was stored alongside the keyword(s) that triggered its retrieval and the publication date, providing important metadata for later filtering and analysis.
After extraction, the news articles underwent preprocessing using SpaCy v3.0, an open-source Natural Language Processing (NLP) library for Python (Explosion, 2021). During this stage, punctuation and stop words were removed, as they do not contribute significantly to the semantic content of the articles. Following text cleaning, each article was categorized according to its corresponding crime type, based on the keyword(s) used during the extraction process. In cases where an article described multiple crime types for example, a robbery incident that resulted in a homicide the article was classified as “more than one crime” to accurately reflect the complexity of the event.
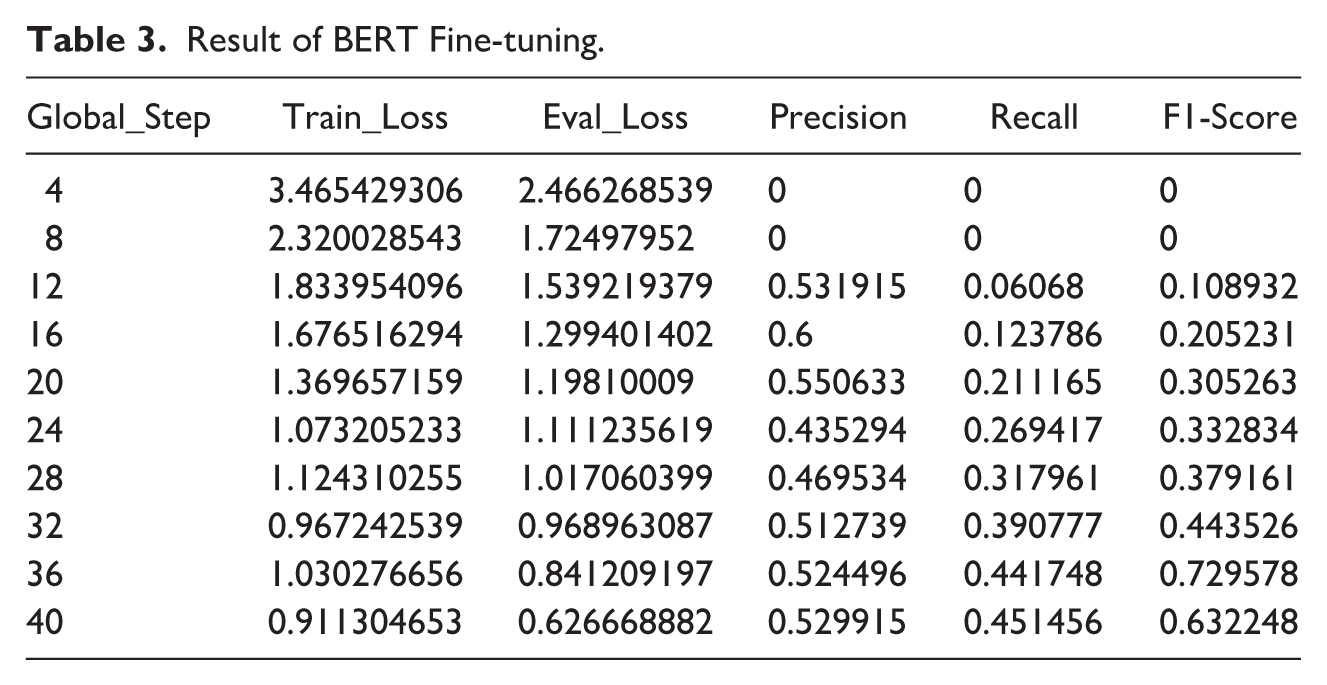
Following classification, each news article was treated as a data source using a semantic analysis approach, a branch of Natural Language Processing (NLP) focused on extracting meaning from text. This study employed a pretrained Named Entity Recognition (NER) model from SpaCy (Explosion, 2021) to identify and extract key information, including demographic details (e.g., age, gender, occupation) of both victims and offenders; temporal data such as the date and time of the incident; weapons used; the relationship between victim and offender; the type of land use associated with the crime location; and contextual events that preceded the occurrence of the crime. However, the pretrained model was unable to capture some semantics due to the reporting style and language. Hence the need to fine-tune a Bidirectional Encoder Representations Transformer (BERT) from Hugging Face Transformers (Wolf et al., 2020). To achieve this, 25% of the extracted articles were selected as training data. All the words in the selected article were manually annotated, with each word treated as a token to support the supervised fine-tuning process and improve the model’s understanding (Table 3). This structured extraction process was essential for converting textual data into a format suitable for spatiotemporal analysis. After 40 training steps, the BERT model achieved its best performance with an F1-score of 0.632, alongside progressive improvements in precision and recall at each global step.
Result of BERT Fine-tuning.
In this type of content analysis, it is important to validate the extracted news ensuring that the extracted data are reliable and credible. To achieve this, every 100th article in the database was manually checked to ensure that it is accurately classified, that the content aligned with the intended crime category, and that the extracted variables were accurate.
Crime Mapping
Developed countries like the U.S. have census geocoding services (TIGER) which makes it easy to convert an address to Cartesian coordinates (x − y). Developing nations, on the other hand, have challenges with geocoding because they do not have an established database to handle this. To achieve the goal of this study, the national gazetteer of Guyana, Open Street Map (OSM), and Google maps geocoding API were utilized. The national gazetteer, which contains place names along with their coordinates, was used to extract geographic locations mentioned in the news articles. When a match was found, the associated coordinates and place name were stored in two separate columns. The OSM and Google maps geocoding API were used as a supplement in cases where detailed addresses were not included in the Gazetteer or a mismatch. The OSM provides points (place names), lines (street segments), and polygons (buildings), which can all be downloaded and used for spatial analysis. Also, it provides additional place characteristics such as the land use type of both the incident location and adjoining properties.
In some cases, the news articles did not provide an exact crime location but instead referenced a generic neighborhood, street name, or well-known landmark. To ensure these incidents were not excluded, they were geocoded at the next available spatial resolution. For example, location generalized to a neighborhood were assigned to neighborhood centroid, while those with only a street address were assigned to the corresponding street segment. Reported crimes generalized to nearby landmarks (e.g., “near Stabroek Market”) were geocoded to the coordinates of the landmark. While this approach introduced variation in locational accuracy, it preserved valuable spatial information sufficient to analyze the spatial pattern of crime within the city. For temporal information, not all articles provided exact date, day of the week, and time of incidents. In some cases, reporters used relative expressions such as “yesterday,” “last Friday,” or “earlier this week.” To address this inconsistency in reporting style, Natural Language Processing techniques were applied to infer the actual incident date and day of the week by cross-referencing the article’s publication date with the temporal expression. For example, an article published on Sunday that stated “the incident occurred yesterday” was coded as Saturday. In addition to relative calendar expressions, some articles described incidents using vague time-of-day phrases such as “early in the morning,” “last night,” or “shortly after midnight.” These references were standardized into approximate hourly ranges on a 24-hr crime clock. For instance, “early in the morning” was coded as crime that occurred between 05:00 and 07:59, “last night” as 19:00 and 23:59, and “shortly after midnight as” 0:00 and 02:59. Although this introduced some degree of approximation, it maintained consistency across the database and enable the temporal pattern to be presented on a 24-hr crime clock (Figure 2).
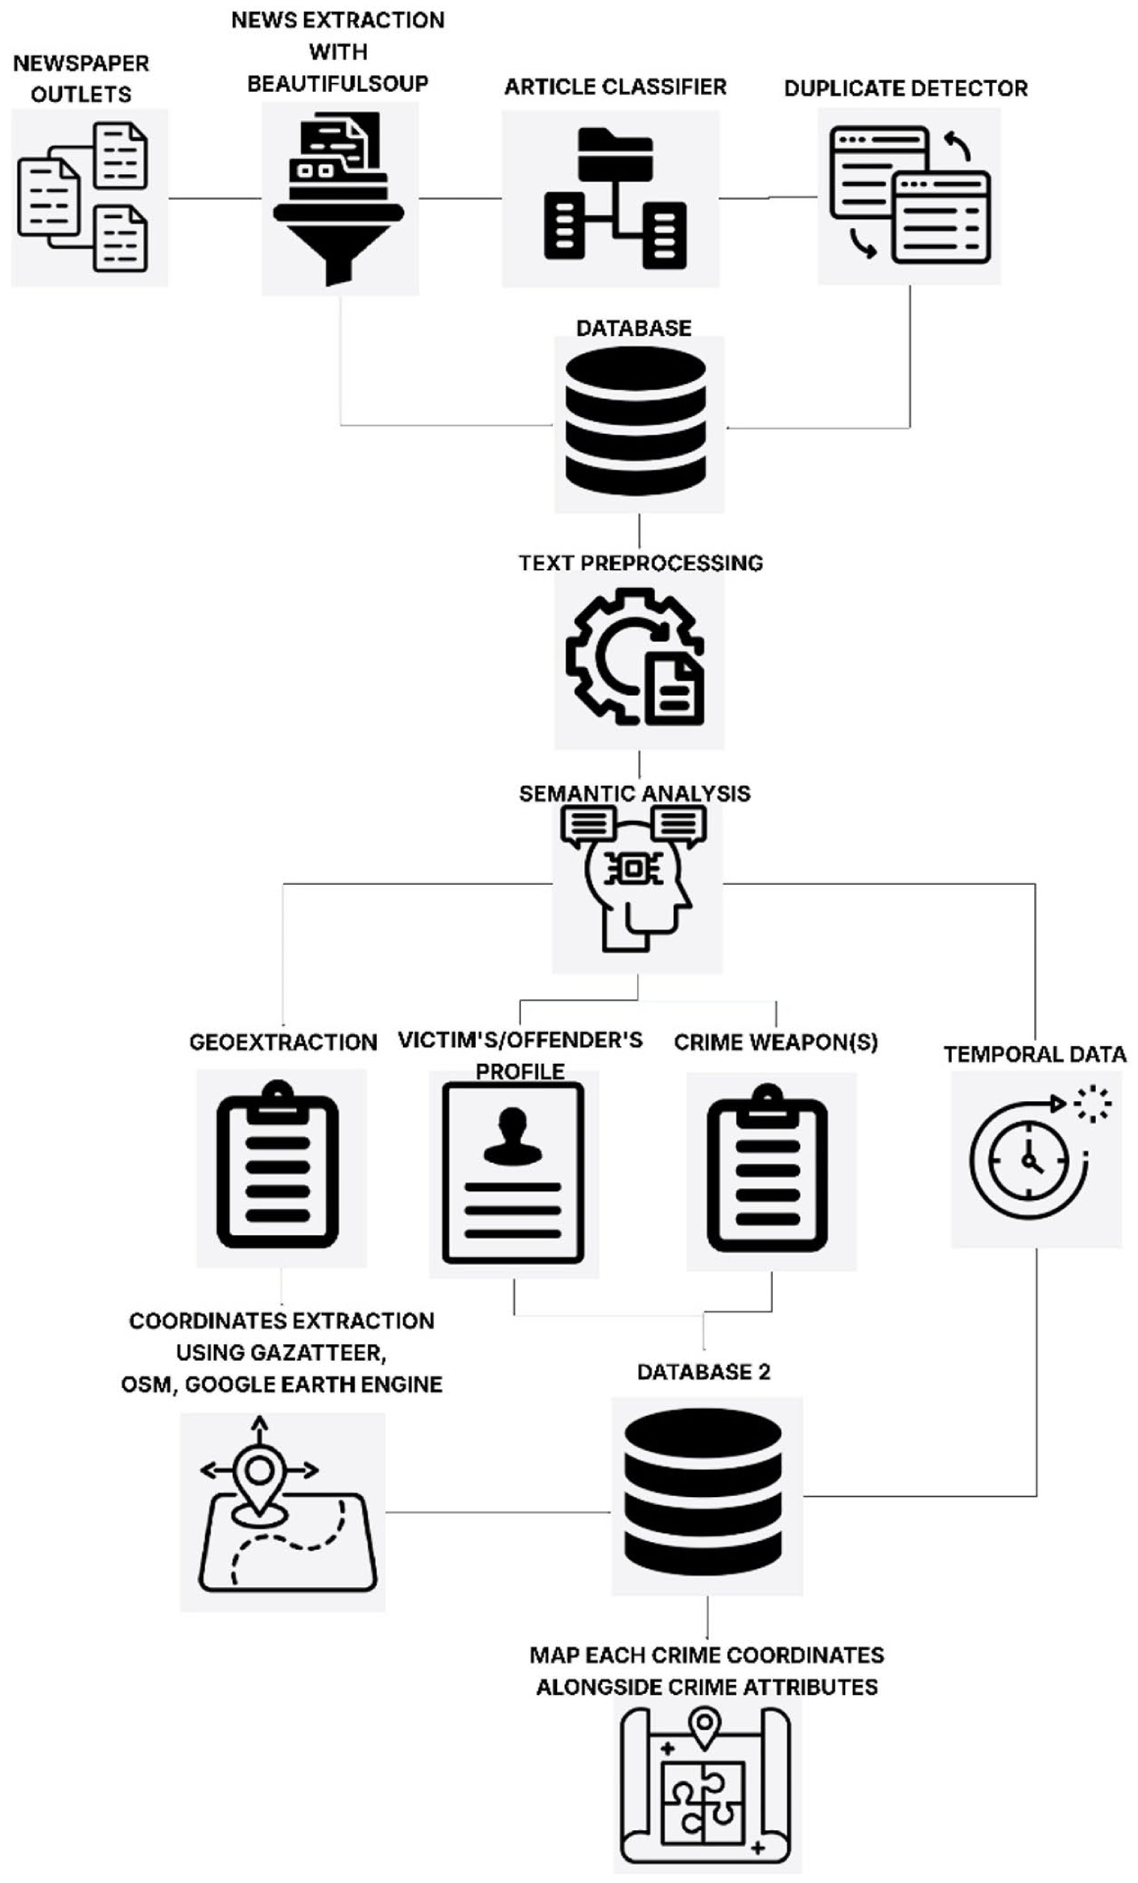
Flowchart of data collection.
Time Series Analysis
Time series was used to identify the temporal pattern of violent crimes reported in the news over the years. To achieve this, each crime incident alongside its corresponding date of occurrence was aggregated at the monthly level. The resulting dataset was a count of all crimes that occurred each month beginning from January 2008 through December 2023. The Plotly Express library (Plotly Technologies Inc., 2015) in Python was then used to create a line graph time series, providing a visual overview of trends and fluctuations of monthly crime counts. To further understand the underlying structure of the pattern, time series decomposition models were subsequently adopted.
Additive and multiplicative decomposing models were then used to break the time series into its three core components: (1) The basic trend (T): The overall direction of change in the data. The direction in which the graph of the series appears to be moving over a long period. (2) Seasonal variation (S): These are the short-term fluctuations in the time series. (3) Residual (R): The irregular variation not explained by trend or seasonal factors. An additive decomposing model is represented by the equation below:

where


The additive model is typically adopted when the seasonal variation remains constant, meaning the standard deviation of the seasonal component does not change significantly as the level of the series or seasonal means increases or decreases (Iwueze et al., 2011).
In contrast, the multiplicative decomposing model represented by the equation:

Assumes

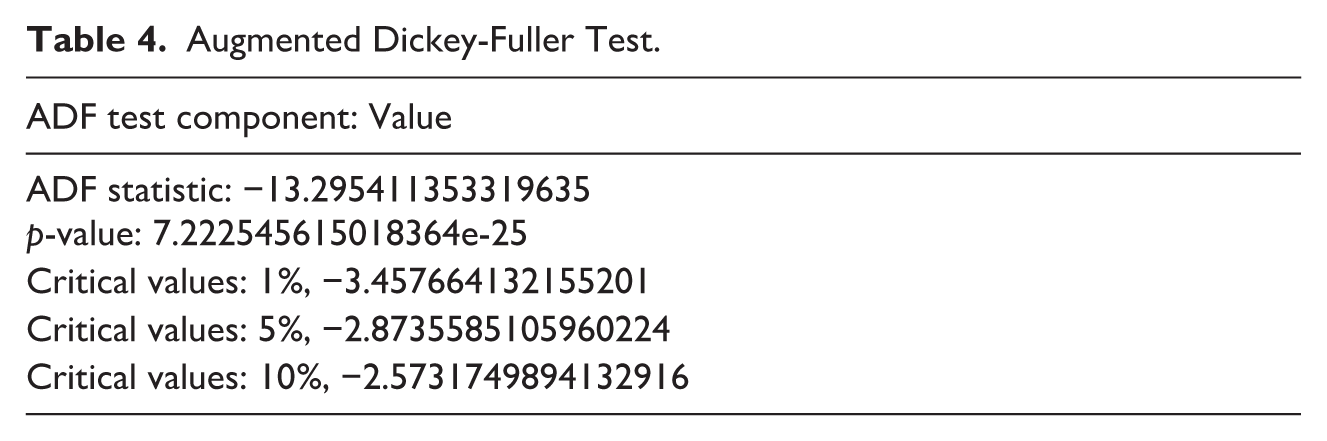
In as much as both the decomposition models have their unique properties and recommendations, since this study is exploratory and visual inspection in determining seasonality can be confusing, this study adopted both models as done in previous studies (see Rakhshandehroo & Rajabdorri, 2019; Zhao et al., 2022). In order to achieve this, the seasonal decompose () function from Python’s statsmodels (Seabold & Perktold, 2010) library was used to perform the decomposition, using the monthly crime count data as the input series, with a seasonal period set to 12 to account for yearly seasonality. Following the decomposition, the Augmented Dickey-Fuller (ADF) test was applied to assess the stationarity of the time series components, providing statistical support for interpreting the underlying temporal structure of the data.
The Augmented Dickey-Fuller (ADF) test is a widely used econometric series method that helps establish the statistical reliability of observed temporal patterns in reported crime data. In this study, it was used to determine whether there are systematic year-to-year changes in the frequency of violent crimes, beyond what could be attributed to random fluctuations, isolated shocks, or residual autocorrelation. By assessing whether the mean and variance remain constant over time. The ADF test estimates the following regression:

where
Quadrat Analysis
The Quadrat Count Method (QCM) which analyzes the first order property of a spatial pattern was used to assess the overall distribution of crime events across the study area. This density-based approach helps detect variation in intensity across the study area. It consists of a simple process which started by dividing the study area into grid cells and counting the number of crimes
The basic idea behind the QCM test is to find evidence against the null hypothesis of Complete Spatial Randomness (CSR) process (Miranda et al., 2011). Under the assumption of Complete Spatial Randomness (CSR), the event counts in each quadrat are expected to be independent and identically distributed, following a Poisson distribution with a constant mean. Based on this assumption, the Pearson Chi-square

where
To complement QCM, Ripley’s K-function was applied to assess second-order properties, specifically the degree of spatial interaction (clustering or dispersion) between events at multiple distance scales. Using both methods provided a more comprehensive understanding of the spatial structure of crime by capturing both large-scale intensity variation and local spatial dependence.
Ripley’s K Function
To evaluate the spatial distribution of crime incidents and assess the presence of clustering or dispersion, both univariate and bivariate Ripley’s K-function were applied. These second-order spatial point pattern analysis techniques offer complementary insights into the structure of point-based data. The K-function examines inter-point dependence by comparing the observed number of events within increasing distances of each event to what would be expected under Complete Spatial Randomness (CSR), thereby identifying clustering or dispersion across multiple distances (Fischer & Getis, 2010; Ripley, 1976). Unlike methods requiring data aggregation into predefined spatial units, the Ripley’s function are points based thereby reducing the bias that could be introduced by the modifiable areal unit problem (Desmond, 2020).
The univariate K-function was employed to assess the overall spatial distribution of all crime events under study, including homicide, robbery, aggravated assault, rape, and incidents involving multiple offenses. With the use of this method, we can deduce whether the spatial distribution of crimes follows a pattern that is random, clustered, or dispersed. The equation used in this study was from Baily and Gatrell (1995) and Pandit et al. (2016). To account for potential edge effects where points near the boundary of the study area may have part of their neighborhood fall outside the analysis window an edge correction term was incorporated. The adjusted equation is as follows:

where

where
The bivariate Ripley’s K, also referred to as Ripley’s Cross-K, was used to understand the spatial interaction between all possible pairwise combinations of the crime type being studied. More specifically, it was used to test if the spatial associations are independent, attraction, or repulsion. Independence is observed when there is no spatial relationship between the pair, attraction is observed when one set of events tends to occur closer to the other set than would be expected, repulsion describes a pattern in which the distance between two sets of events is farther than expected under independence (Pandit et al., 2016), suggesting a tendency to avoid one another spatially. This method calculates the average the number of events of type A within a specified distance from event of type B normalized by the density of type A in the study area to determine the spatial association between the two event types (Boyden et al., 2005). For example, it will count the number of robberies within a given distance of homicide, normalizes this count by the overall density of robberies in the study area and then compare it to what we would expect under Complete Spatial Randomness (CSR) to determine if the relationship between the two crime types reflects independence, repulsion or attraction. The bivariate Ripley’s K function is defined by the equation (Baily & Gatrell, 1995; Pandit et al., 2016):

where
Results
Over the study period, a total of 9,021 articles were extracted based on the identified keywords as described in Table 2. Of these, 5,184 articles reported crime incidents that occurred within the city limits of Georgetown. Among the crime types examined, robbery accounted for the highest proportion, representing 44.1% of all extracted crime news in Georgetown. This was followed by homicide (31%), aggravated assault (21%), and rape (3.95%). A small number of articles reported multiple crime types occurring in a single incident. According to the extracted articles, the yearly pattern can be categorized into three distinct phases (Figure 3). The first is the crime peak period (2008–2015) which marks the highest concentration (62.7%) of all reported crimes. The next era can be referred to as the decline phase (2016–2019) which accounted for 27.7% of the reported crimes in the newspapers. The last phase, which is the Sharp decline era (2020–2023), accounted for 9.6% of the reported crimes. Across all three phases robbery remained the most frequently reported crime with an average of approximately 143 reported incidents per year.

Yearly pattern of reported crimes.
Temporal Pattern
The reported articles were categorized by the hour of crime occurrence to examine the temporal distribution of crime over a 24-hr period. To capture potential variation in daily routines, the articles were divided into weekday (Monday–Friday) and weekend (Saturday–Sunday). This analysis reveals a distinct evening peak in criminal activity (Figure 4), with the highest concentration of incidents occurring at approximately 7:00 pm. A gradual rise in crime begins around 4:00 pm, increasing steadily into the evening. The crime begins to decline after 11:00 pm, with fewer incidents observed during late night and early morning hours. This weekday temporal trend suggests that crimes are more likely to occur during the post-work hours which aligns with increasing public movement during commutes and social activities. During weekends, the temporal patterns still appear to peak in the evenings, however, with a broader and more prolonged pattern of activity. Compared to weekdays, nighttime and early morning hours (12:00–3:00 am) shows a slight uptick in activity. These suggests that time of day and day of the week are factors influencing when crimes are most likely to occur, reflecting the differences in work schedules, social behavior, and nighttime activity.
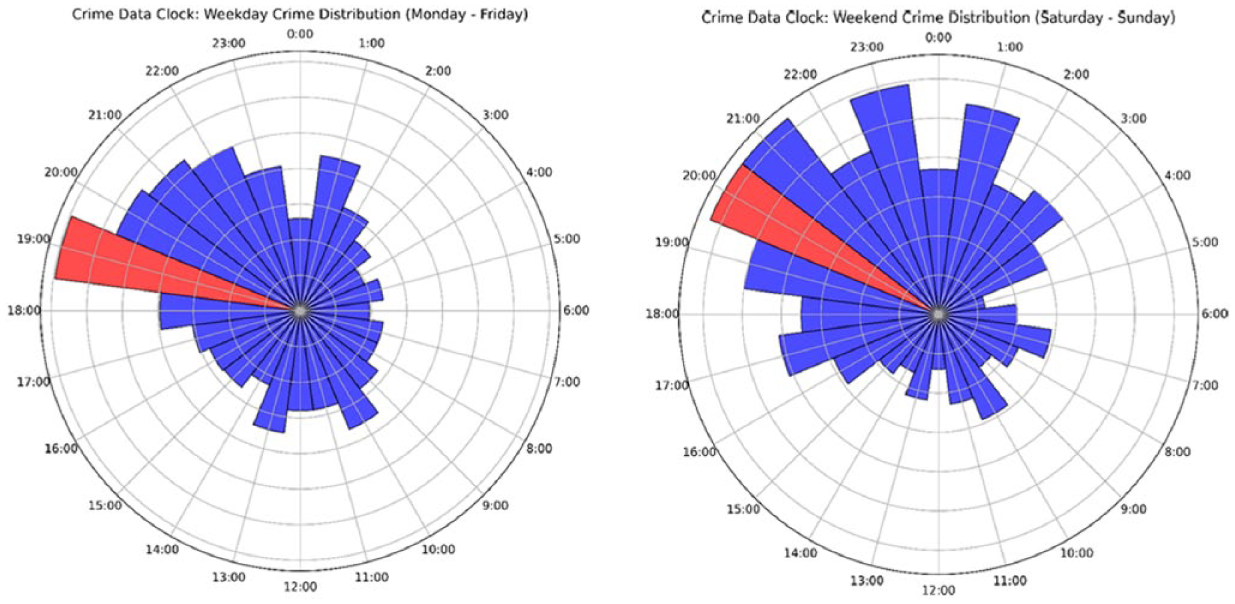
Weekday and weekend crime distribution.
A clear temporal pattern emerges in the distribution of reported crime incidents across the days of the week, with crime occurrences peaking during the weekends (Figure 5). Specifically, Saturday recorded the highest number of crimes of 1132, followed closely by Friday and Sunday, each with total crime exceeding 900 reported crimes. The number of reported crimes from Monday through Thursday remained consistent, ranging between 500 and 650 reported cases. A small number of the extracted crimes fell under the “unknown” category, indicating that the day of crime occurrence was not mentioned in the report.
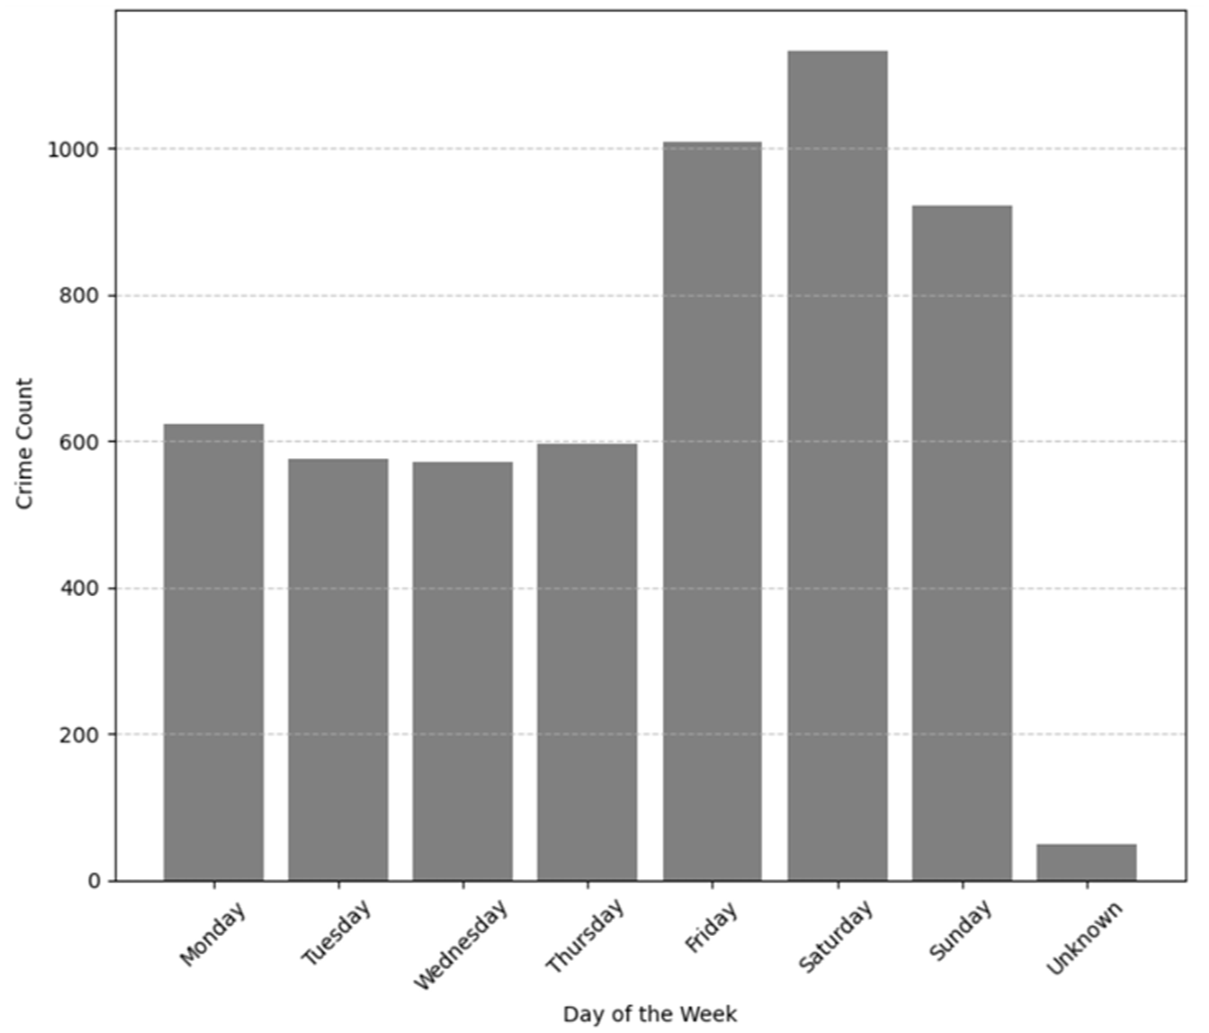
Distribution of reported crimes by weekday.
The monthly trend (Figure 6) reveals a distinct temporal pattern over the 15-year period. From 2008 through 2018, crime incidents exhibited moderate fluctuations, with monthly crime incidents ranging between 30 and 67 incidents. Several short-term peaks are also observable reflecting seasonal activity or specific local events that temporarily increased criminal activity. A noticeable decline in the overall crime started sometime in 2019 and became more pronounced in 2020, with monthly crime dropping below 20. The pronounced decline likely reflects societal disruption, particularly the COVID-19 pandemic, which limited mobility and public interaction, thereby reducing the opportunity for crime.
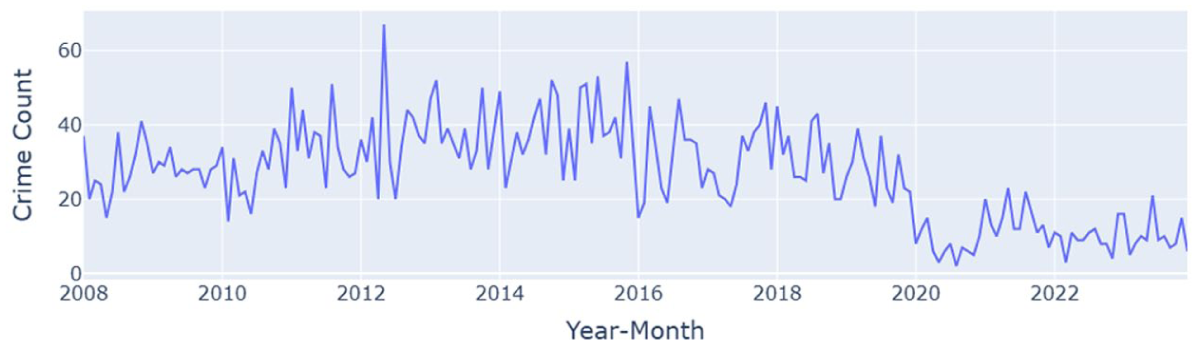
Monthly trend of all crime types.
The visual inspection of the time series is supported by the decomposition models (Figure 7) with the trend component suggesting a long-term transformation in crime patterns. The seasonal variation from both the multiplicative and additive models provided similar repeating annual cycle, with consistent peaks and troughs across the years. This suggests that reported crimes are influenced by predictable seasonal factors such as holidays or weather conditions which may affect routine activities and social behavior. The residual component from both models captures the irregular fluctuations that are not explained by the trend or seasonal patterns. The residual remained relatively stable over the study period. Contrary to expectation of increased volatility during the pandemic, the residuals do not exhibit heightened dispersion after 2019. This stability implies that the observed decline during the pandemic is not anomalous but rather systematic changes already incorporated into the trend, confirming that the temporal pattern over the 15 years are governed by a combination of long-term structural trends, stable seasonal variation, and modest random fluctuations.
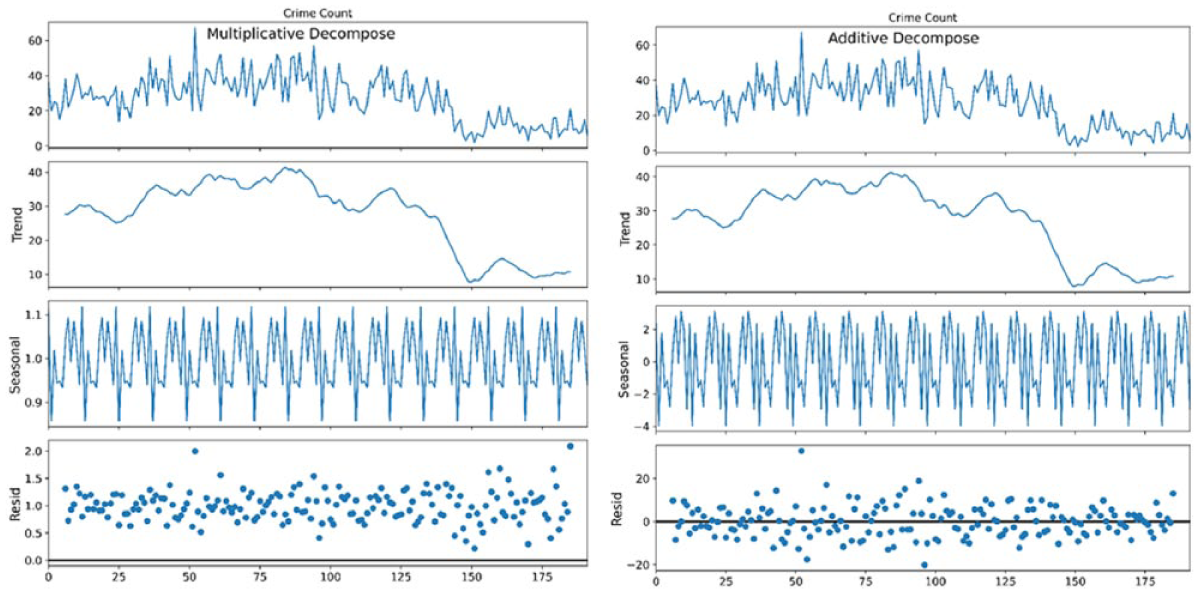
Additive and multiplicative decomposition of the time series.
The Augmented Dickey-Fuller (ADF) test was employed to assess the stationarity of the time series. The null hypothesis
Augmented Dickey-Fuller Test.
Spatial Point Pattern Analysis
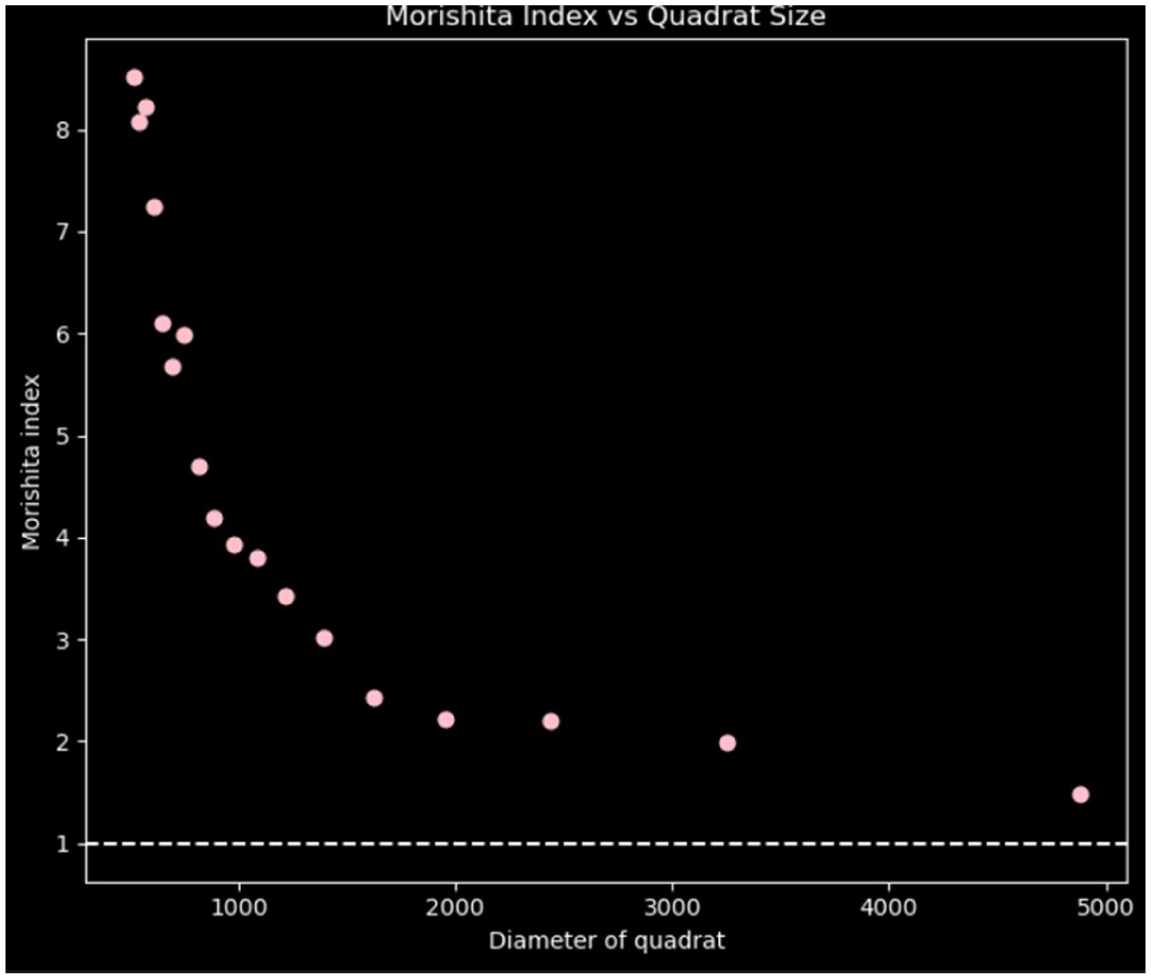
The quadrat analysis (Figure 8) compares the spatial distribution of observed crime incidents (left) with a set of randomly simulated points (right). Visual inspection of each grid cell when compared to what we would expect under complete spatial randomness (right image) shows that clusters are clearly visible in the upper left quadrant with some having over 800 crime incidents in it while some have little as 18 crime incidents. Statistically, the p-value of the Pearson Chi-square χ2 test (df = 24, p < .0001) confirms a statistically significant departure from randomness. With a P-value that is approximately 0.0, the null hypothesis of CSR is rejected concluding that the observed pattern exhibits a significant clustering. Similarly, the Morishita Index (MI) was calculated across a range of quadrat diameters to assess the scale-dependent spatial structure of observed crime events within the study area. As shown in Figure 9, the MI values remained consistently greater than 1 across all quadrat diameters evaluated, strongly indicating that the spatial distribution of crime is clustered rather than random or uniform. The clustering is more pronounced at smaller quadrat sizes, where the MI exceeds values of 8 which suggests the presence of micro-level hotspots that may be influenced by specific environmental or socio-economic factors. Although a positive linear relationship is observed between the MI and the quadrat sizes, the index remained consistently greater than 1. This suggests that while clustering persists at broader spatial scale, its intensity diminishes due to the aggregation of smaller clusters into larger units. As quadrat size increases, spatial heterogeneity diminishes, potentially masking localized crime patterns. This observation highlights the Modifiable Areal Unit Problem (MAUP), reinforcing the importance of selecting an appropriate spatial scale when analyzing point patterns.
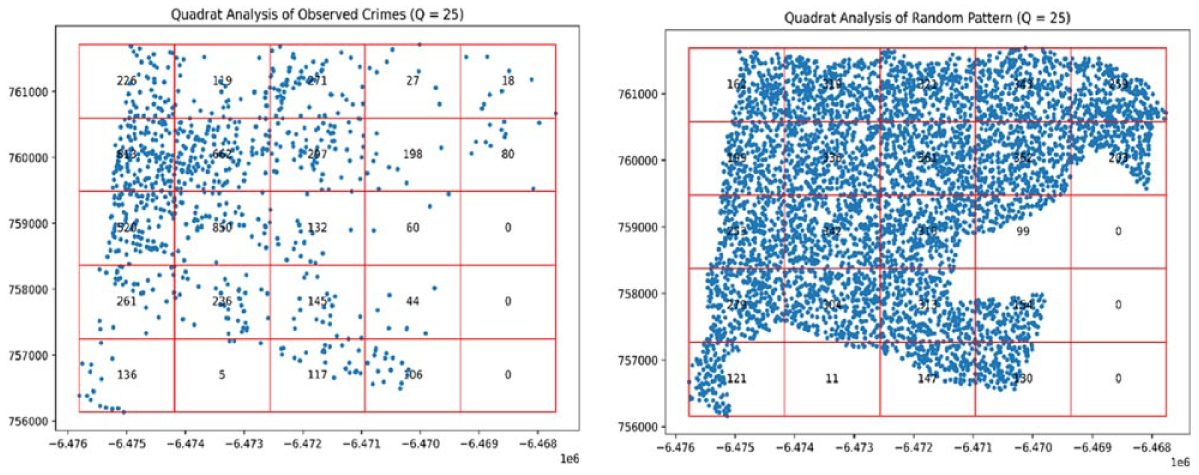
Distribution of observed versus randomly stimulated point over study area.
Morishita index.
Results from the univariate Ripley’s K and L function (Figure 10) further reveal consistent evidence of spatial clustering. The K-function (Left pane in Figure 10) shows that the observed distribution of events lies well above the theoretical expectation under Complete Spatial Randomness. This indicates that the cumulative number of events occurring within distance r is greater than what would be expected under random distribution. To assess the statistical significance of this, the Monte Carlo simulation envelop was generated using 99 permutations of CSR. Since the observed curve exceeds the upper bounds of the simulation at all distance
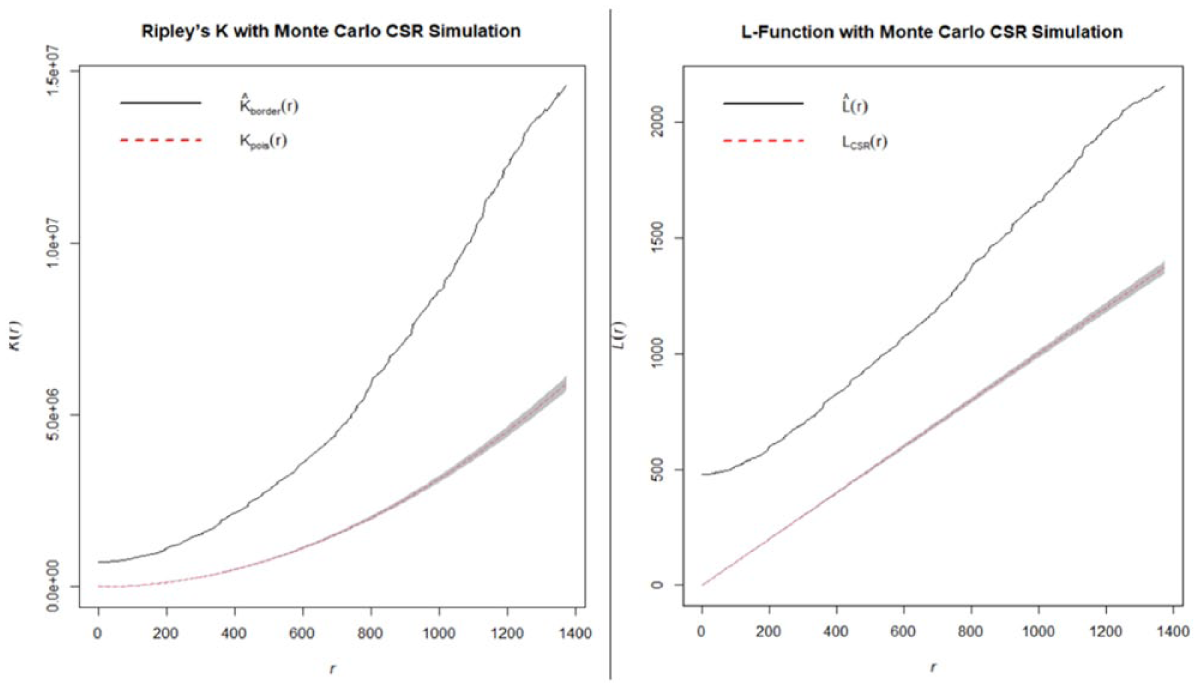
Ripley’s K and L-function of overall crime alongside Monte Carlo simulation.
The bivariate Ripley functions revealed the spatial association between two distinct crime types (Figures 11–16). The functions assess whether crime of one type tends to occur in proximity to another. The first of the bivariate analysis (Figure 11) reveals the spatial interaction between robbery and rape. From this, an initial clustering was evident at smaller scales, beginning from approximately 0.2 km to 0.6 km, suggesting localized spatial proximity between the two crime types. Although the clustering peaked at around 1.2 km, a more pronounced clustering pattern emerged between 0.8 km and 1.4 km. The L-function reinforces this clustering pattern showing a consistent upward deviation from the CSR baseline line especially at around 0.8 km to 1.4 km range. This suggest that number of robbery-rape pairs found within this distance band is significantly higher than what would be expected under spatial randomness. These points to a spatial dependence between the two crime types, reflecting a tendency for these crimes to occur in relative proximity signifying a clear pattern of spatial attraction.
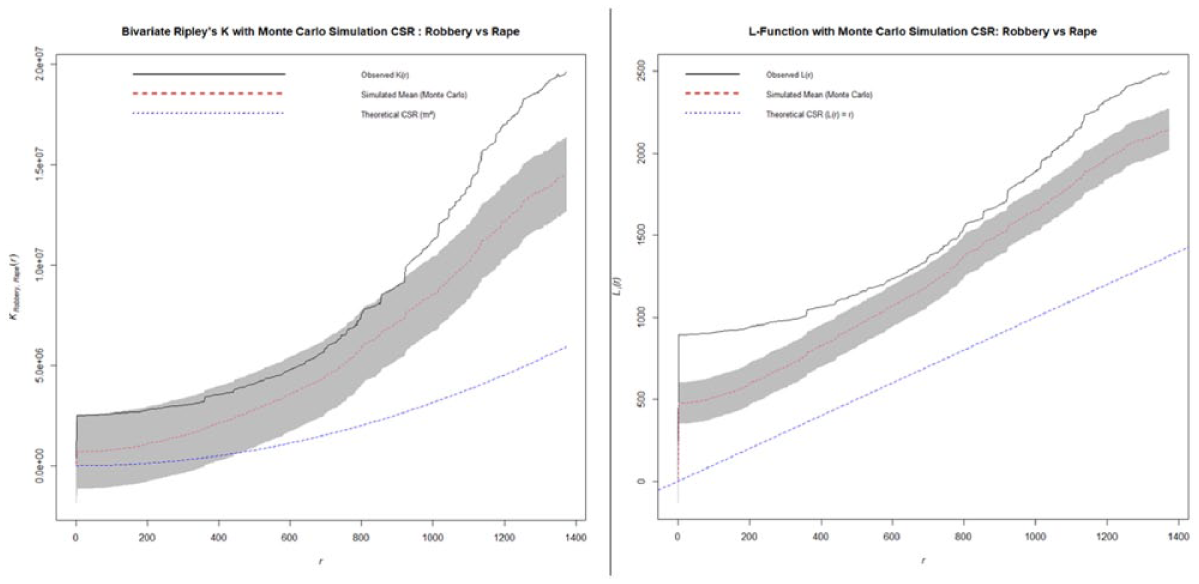
Ripley’s K and L-function of robbery versus rape.
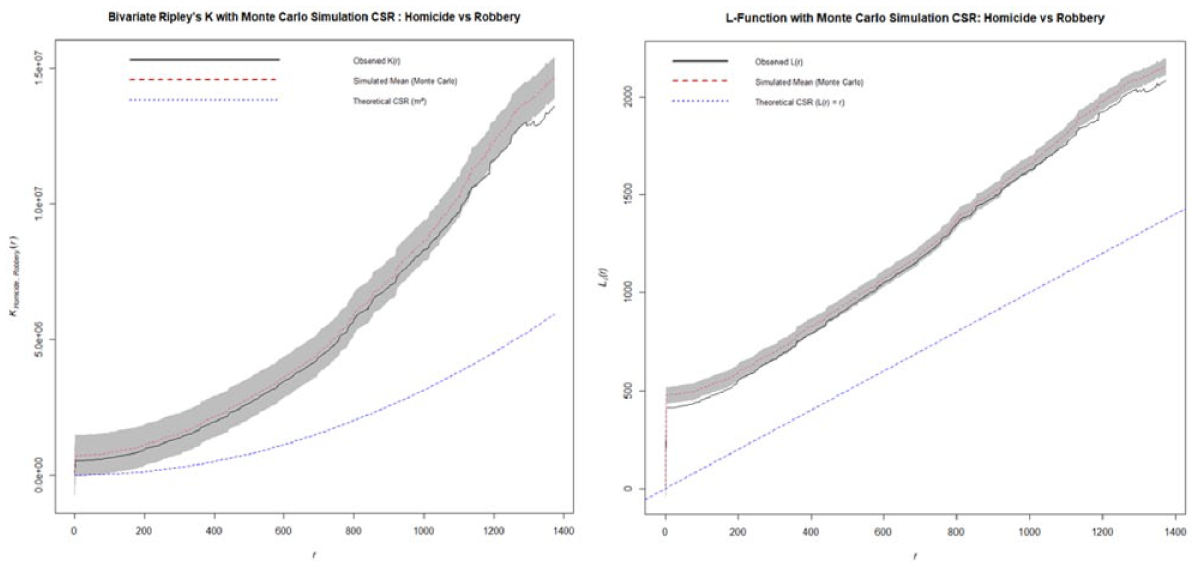
Ripley’s K and L-function of homicide versus robbery.
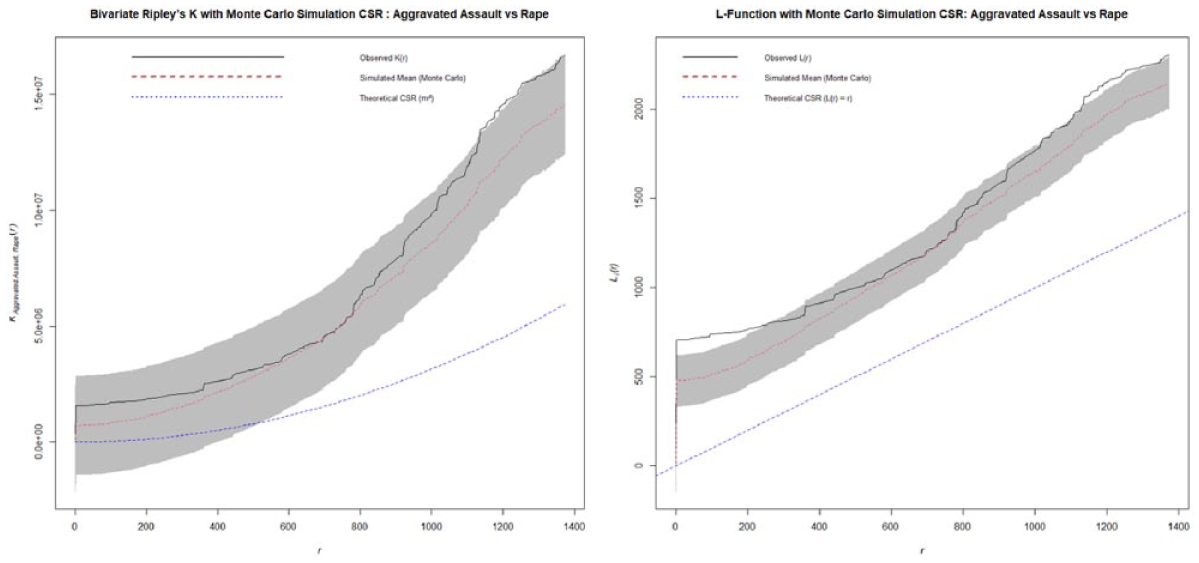
Ripley’s K and L-function of aggravated assault versus rape.
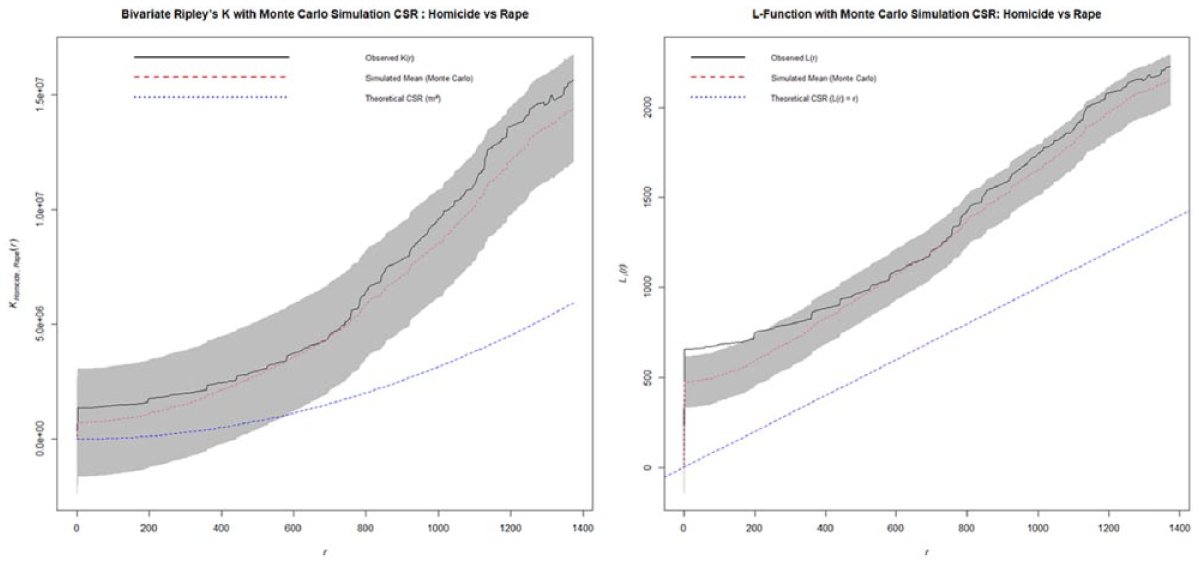
Ripley’s K and L-function of homicide versus rape.
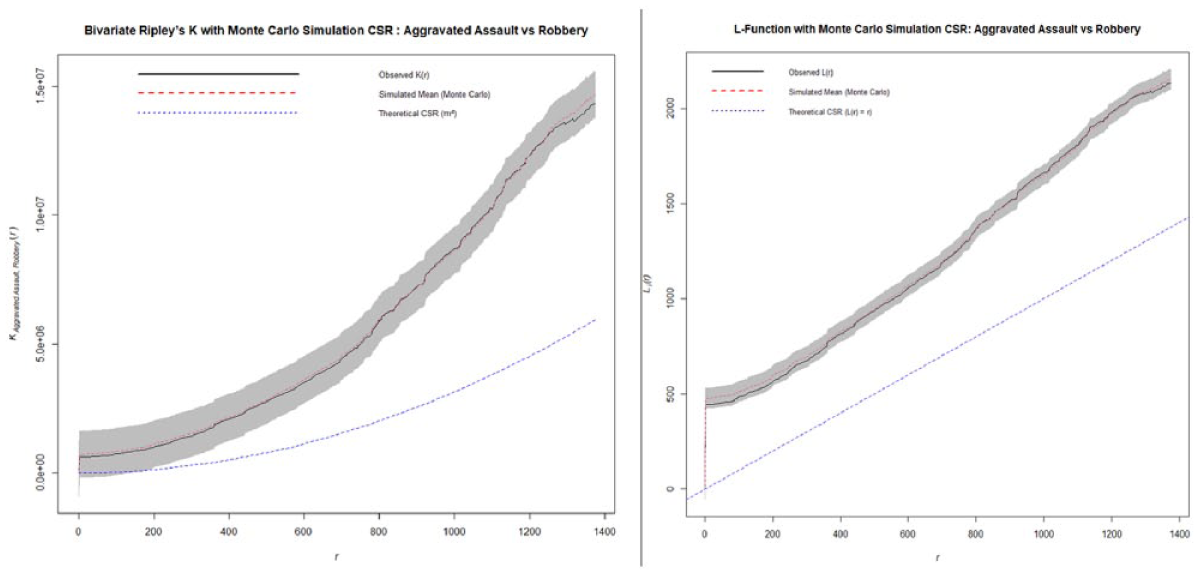
Ripley’s K and L-function of aggravated assault versus robbery.
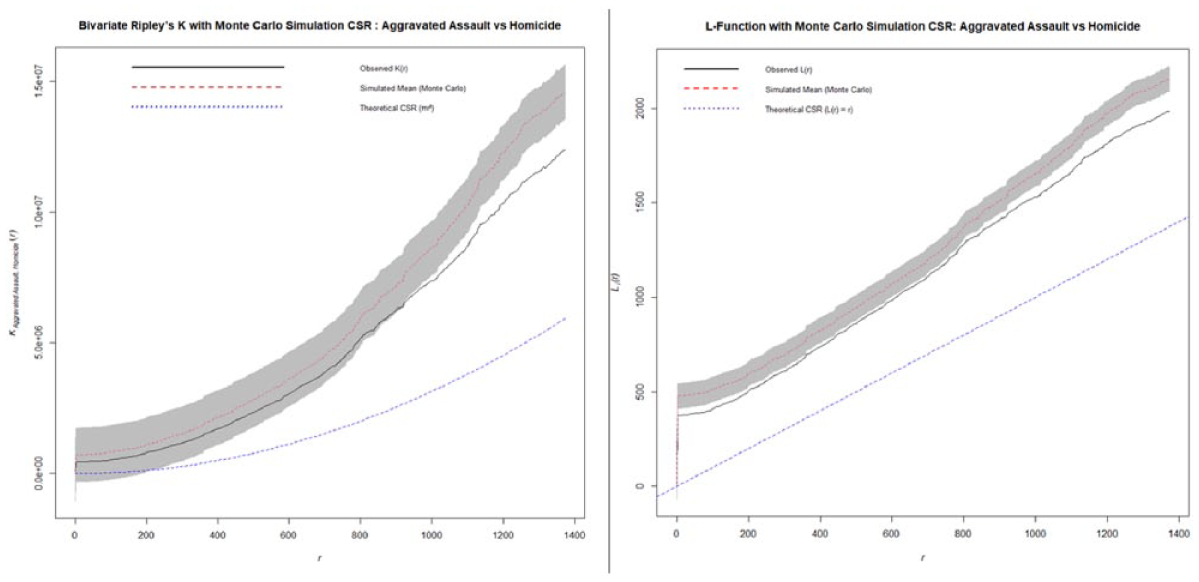
Ripley’s K and L-function of aggravated assault versus homicide.
The second bivariate relationship (Figure 12) assessed the relationship between homicide and robbery. Over the distances
The bivariate analysis between the aggravated assault and rape (Figure 13) shows no statistically significant spatial interaction between the two crime types. The observed functions remained within the confidence interval of the Monte Carlo simulation until approximately 1.1 km after which a slight departure was noted. However, this deviation is not substantial enough to indicate a significant clustering, as such, the spatial relationship between aggravated assault and rape appears to be independent. The spatial relationship between homicide and rape incidents reveals no spatial interaction since the observed functions remained within the 95% simulation envelop generated by the Monte Carlo simulation. While the observed values trend is slightly higher than the simulated mean (see Figure 14), this deviation is not sufficient to suggest clustering beyond what would be expected under spatial randomness. Similarly, the relationship between aggravated assault and robbery (Figure 15) indicate no statistically significant spatial interaction since the observed line remained within the confidence of the simulated interval. Lastly, the relationship between aggravated assault and homicide (Figure 16) reveals no statistically significant spatial interaction across all distance. In both functions, the observed trend remained within and at times below the Monte Carlo simulated envelope. This suggests that the spatial interaction in this case is less frequent than would be expected under a CSR. Therefore, the two crime types do not exhibit attraction across space and in fact demonstrate a weak repulsion, indicating that they tend to occur in distinct geographic area rather than in proximity.
Discussion and Conclusion
The goal of this paper was to demonstrate the possibility of using mass media data in spatial analysis particularly in a developing nation setting where accessing official data can be challenging. With the aim of contributing to the literature that bridges content and spatial analysis (e.g., Cummings et al., 2019, 2024; Umair et al., 2020), this study sets out to develop a robust data extraction across three news outlets in the study area and then analyze the spatiotemporal pattern as presented by the mass media. It is important to acknowledge the possible bias that could be present in news reporting such as news selectivity where Journalist chooses the crime news that are sensational in order to attract a broader audience. We tried to mitigate this by gathering our data from three respectable news outlets in the country ensuring broader coverage and reducing dependence on any single editorial perspective. This triangulation improves the feasibility of our methods, as it enhances the credibility of the extracted dataset, broadens the coverage of reported incidents, and increases the likelihood that crime events are consistently captured across three different reporting styles.
Our data extraction phase revealed a significant limitation of pretrained Natural Language Processing (NLP) models when applied to text with linguistic style different from the models’ training data. Specifically, some of the crime reports (207) were written in Creolese, an informal dialect with irregular grammar and non-standard spelling which led to misclassification. Similarly, applying pretrained models in a developing nation where they have not been trained also led to the omission of key entities and poor contextual understanding. We were able to overcome this challenge by training a Bidirectional Encoder Representation from Transformer (BERT) model. This improved the semantic analysis, and we were able to extract relevant information needed for spatiotemporal analysis. Importantly, credibility of the dataset was validated by systematically reviewing every 100th extracted article in our database, manually coding it and comparing it against the automated entity classification from the NLP pipeline. This comparison revealed a high degree of alignment between human-coded and machine-coded results. These checks, together with cross-corroboration across three newspaper reinforces our confidence in the accuracy of the extraction process and the overall reliability of the dataset.
The temporal pattern observed from our extracted data revealed a pattern which aligns with existing literature (e.g., Cai & Tan, 2024; Gruenewald et al., 2023) suggesting that criminal activity tends to increase during weekends, potentially due to factors such as increased social interactions, public gatherings, nightlife-related activities, and alcohol consumption. These same factors can also explain the hourly temporal pattern observed from our analysis where crime peaks extends to nighttime and early morning hours, a time window that often overlaps with nightlife activities, reduced public transportation, and decreased police visibility. These temporal findings have direct policy implications. Rather than evenly distributing resources across all hours, police patrols, surveillance systems, and public transport safety measures should be strategically intensified during these high-risk windows. For instance, improving street lighting, extending bus and taxi services into the night, and ensuring visible guardianship in nightlife districts could reduce the likelihood of offender-victim convergence. Although some articles reported temporal information in generalized terms, we standardized these into a 24-hour scale to maintain consistency across the dataset. While this introduced some approximation which may smoothen out fine-grained hourly variation in some few cases, it did not alter the broader result. Key patterns such as weekend, nighttime, and early morning peaks still emerged clearly, indicating that while the generalization might reduce precision at micro-level, it did not compromise the validity of the overall temporal trends.
The effect of COVID-19 pandemic was also evident from the sharp decline of reported crimes beginning around 2020. This abrupt shift likely reflects the broader structural changes brought on by the pandemic such as the government-imposed lockdowns, curfews and restrictions on public gatherings. A lot of crime generator centers such as clubs, entertainment centers, and businesses were either closed or operated at a limited capacity thereby reducing the chance of intersection of awareness space of motivated offender and potential victims. Furthermore, the pandemic also led to the increased police presence and enforcement of public health mandates providing guardianship which disrupts criminal behavior. This trend shows how changes to routine activities and urban rhythms can reshape crime opportunities, reminding policymakers that crime control is not only about enforcement but also managing social and environmental contexts.
The second part of the analysis focused on the spatial point pattern of the reported crimes. The results show that indeed crime is concentrated within the city. The Morishita index reinforces this pattern, showing decreasing values as quadrat sizes increased, which indicates that concentration is strongest at smaller spatial scales such as street blocks. Similarly, the univariate Ripley’s K function which was linearized with the L-function and tested through Monte Carlo simulations, confirmed that crime events display statistically significant clustering. Together, these findings align with Weisburd’s (2015) “law of crime concentration” which emphasizes that a small share of places account for a large portion of crime. The uneven distribution of crime counts within quadrats, particularly in the upper-left section of the grid highlights specific hotspot areas. These micro-level concentrations can often be explained by the social and physical characteristics of the built environment such as high population density, the presence of crime generators and attractors (e.g., bars, nightclubs, markets, and bus terminals), and deteriorated or abandoned buildings. From a policy standpoint these findings highlight the importance of place-based interventions and calls for strategies such as revitalization of abandoned structures, improving environmental design in vulnerable areas, and hotspot policing. Land-use and zoning regulations can also play a preventive role by limiting the over-concentration of high-risk establishments, separating incompatible land uses, and requiring design standards that enhance visibility and guardianship. By shaping the distribution of crime generators and attractors within the city, policymakers can reduce opportunities for crime and complement enforcement strategies. Focusing limited resources on high-crime micro-places can therefore produce disproportionate reductions in overall crime within the city—a valuable approach in resource-constrained settings like Guyana
The pairwise bivariate analysis offered additional insight into how different types of crimes interact spatially. Of all the pairwise comparisons, only robbery and rape exhibited statistically spatial dependence suggesting that these crime types tend to co-occur in the same environments. This co-occurrence is likely a result of shared situational context and opportunity structures. Areas with limited guardianship, poor lighting, and high levels of pedestrian activity such entertainment district, transport hubs, or poorly monitored streets may simultaneously provide opportunities for robbery while also creating conditions of vulnerability that increase the risk of sexual violence. The co-occurrence of robbery and rape only suggests that some environments produce overlapping risks for multiple forms of victimization, highlighting the layered nature of urban crime ecology. Addressing this spatial dependence calls for multi-dimensional intervention instead of the generic hotspot policing. Physical infrastructure improvements such as increased lighting and maintenance of safe pedestrian routes are the first critical steps and should be followed with social interventions which includes gender-sensitive policing community outreach and support for vulnerable population. Targeting areas where the crime co-occurs allows policymakers to mitigate the two crime types simultaneously. Ultimately, the co-occurrence of robbery and rape underscores how certain environments generate layered risks that cannot be addressed through single-issue intervention. Acknowledging these overlaps and designing responses around them not only strengthens theoretical understanding of urban crime dynamics but also enhances the practical effectiveness of crime prevention strategies in urban context.
In conclusion, this study has shown how news content can be systematically transformed into structured data for spatial analysis in Georgetown, Guyana. By automating the extraction of crime-related news article using Natural Language Processing, fine-tuning a BERT model to improve local representativeness in context where existing pretrained NLP models may underperform, and generating a structured crime database, we were able to achieve our broader aim of analyzing the spatiotemporal distribution in the absence of official crime data. The ability to leverage mass media source not only fills data gap but also serves as bedrock for hotspot identification, crime prediction and evidence-based policing. While the findings from this study are promising indicators for future research aiming to extend spatiotemporal crime prediction and studying crime concentrations, it is important to acknowledge the limitation inherent in using media-reported crime. Editorial decisions often influence the type of crimes that are deemed newsworthy. With a tendency to focus on violent or sensational crimes and a potential of underreporting or omitting less newsworthy crimes. This selective reporting might introduce potential biases in both the spatial and temporal representation of crime within the study area. In addition, media data can also present limitations particularly in terms of crime details such as generalization of spatial information to neighborhood, streets, or well-known landmarks instead of the exact address. Similarly, the crime details such as exact crime location and time of incident are sometimes generalized, omitted or approximated for privacy, legal, or narrative reason. These limitations might have implications for operational decision-making because analyses based on skewed data may distort crime patterns, influence resource allocation or policy intervention. While these limitations might reduce the precision of micro-level analyses, they do not obstruct the identification of broader spatiotemporal patterns and when interpreted with appropriate caution, these patterns remain highly relevant for strategic planning, preliminary hotspot detection, and exploratory analysis where official crime data is difficult to get.
Future studies can further improve accuracy by triangulating media reports with police data or primary data reported by citizens. Nevertheless, this study underscores the untapped potential of mass media data as a complementary resource for criminological research and urban safety planning in areas where official data is inaccessible.
Footnotes
Declaration of Conflicting Interests
The authors declared no potential conflicts of interest with respect to the research, authorship, and/or publication of this article.
Funding
The authors received no financial support for the research, authorship, and/or publication of this article.