
Abstract
This study examines whether group threats in the surrounding social context positively moderate disproportionate minority contact at preadjudication detention in the juvenile justice system. To do so, the study utilizes a multijurisdictional sample of 96,619 juvenile court referrals across 139 counties (within four states) to examine a series of group threats—racial, ethnic, economic, and age threat. Due to the nested structure of the data, multilevel models are employed. To test the hypotheses, cross-level interactions between group threats and defendant race and ethnicity are estimated following current best practices for measuring interactions with nonlinear dependent variables. Findings indicate mixed and mostly limited support for the group threat hypotheses, consistent with prior mixed findings. Implications for research and policy are discussed.
From its founding, the explicit mission of the juvenile court was to serve as parens patriae, a treatment-oriented institution based in the social welfare vision of Progressive reformers in the late 19th century (see Feld, 2017). Despite this, some have argued that the juvenile court has always served primarily as a mechanism for extending social control over certain segments of the population, such as the lower classes (Platt, 1969) or Black youth in particular (Ward, 2012). Today, persistent racial and ethnic disparities (RED) in the juvenile justice system, traditionally referred to as disproportionate minority contact (DMC), would appear consistent with this revisionist history. The most recent national data (2019) evidences DMC between minority and White youth at every major point of the juvenile justice system except adjudication of delinquency (Hockenberry & Puzzanchera, 2021). This national data tells us that DMC exists—minority juveniles, especially Black youth, are overrepresented in the juvenile justice system relative to White juveniles—but they do not tell us why DMC exists, where it is most prevalent, or how it could be reduced. Especially important in this regard is that DMC may not be uniform across jurisdictions (see Zane et al., 2020), and that differences in racial and ethnic disparities might be related to differences in macro-social context (see Leiber et al., 2021). As Sampson and Laub (1993) observe, “a macrosociological perspective suggests that systematic differences in case processing will arise from the social attributes of the communities in which juvenile courts are located” (p. 288). One possibility is that variation in DMC is due to different levels of social control and discrimination motivated by threatening populations—what have been called group threats.
While group threat hypotheses, especially minority threat, have been studied extensively with respect to incarceration and sentencing in the juvenile and criminal justice systems, less attention has been paid to early processing decisions such as preadjudication detention (see Feldmeyer & Cochran, 2018; Stults & Swagar, 2018). As Feld (2017) notes, preadjudication detention is a “critical decision” for several reasons (p. 108). First, disparities are particularly high at detention, higher than other post-referral outcomes in the juvenile court (Zane & Pupo, 2021). In part, this may be due to the high degree of discretion operating at the intake stage, with detention decisions made more quickly than final dispositions (see Barton, 2012). (Moreover, as others have suggested, group threat hypotheses are most plausible where there is a large amount of discretion; see Feldmeyer & Cochran, 2018). Second, detention is strongly associated with later punitive outcomes, such as secure placement and waiver to adult court. In this way, the detention decision likely contributes to the cumulative disadvantage of minority defendants in justice system processing (Zane et al., 2021). Perhaps for these reasons, detention is one of the most studied decisions in juvenile justice (see Zane & Pupo, 2021).
The present study seeks to make several contributions. First, while a large research literature is devoted to testing the minority threat hypothesis in the criminal and juvenile justice systems, less research has focused on other group threats such as economic and age threat (see Tittle & Curran, 1988). Second, most studies of group threats focus on one state (or the federal system). As Britt (2000) points out, this leaves open the possibility that most findings are idiosyncratic to particular jurisdictions—and potentially leads to contradictory research findings across these jurisdictions. As it turns out, support for group threat hypotheses is quite mixed in prior research (see Zane, 2018). To improve on the generalizability of prior research, the present study uses a sample of 139 counties across four states. Third, and most importantly, the present study also improves on prior research in terms of its analytical approach. Specifically, the relationship between racial/ethnic disparities and group threats (i.e., cross-level interactions) are assessed via second differences in marginal effects across different levels of group threat. Most prior research on group threats in the justice system has not employed this analytical approach, which represents current best practices for estimating cross-level interactions in the context of a non-linear dependent variable (Mize, 2019).
Theoretical Background and Prior Research
Group Threat Hypotheses
In the context of juvenile justice, group threat hypotheses predict greater racial and ethnic disparities in juvenile court outcomes in communities with larger (or growing) threatening populations (Tittle & Curran, 1988). This conflict perspective was originally formulated as the minority threat hypothesis, which posited that as a racial minority group grows relative to the dominant group, those in power may begin to feel threatened and discriminate against the minority group in economic and political contexts (Blalock, 1967). While this original formulation did not address discrimination by criminal justice officials, it has subsequently developed into a general social threat perspective where it is predicted that racial composition at the community level will be associated with larger racial disparities in the criminal justice system, possibly in a curvilinear relationship that decreases as the minority group grows large enough to exert power (Feldmeyer & Cochran, 2018). Black population size is the most common measure of minority threat (i.e., the racial threat hypothesis), though the same strategy has also been employed to examine Hispanic population size–the ethnic threat hypothesis (see, e.g., Caravelis et al., 2011, 2013).
While minority threat remains the most well-known (and most tested) version of the group threat perspective, other group threats have also been suggested. In the context of the juvenile justice system, Sampson and Laub’s (1993) theory of urban inequality is influenced by the minority threat perspective, but adds a specific focus on concentrated disadvantage and drug crime. Similarly, Tittle and Curran (1988) hypothesized that “disparities in juvenile court disposition by socioeconomic status and race/ethnicity will vary directly with the degree of threat to elites posed by various minority groups or by subordinate social classes in the court’s jurisdiction” (p. 33). They proposed three forms of group threat: racial threat, income threat, and age threat. Specifically, the authors argued that just as White people might be threatened by large minority populations (i.e., minority threat), high income people may be threatened by large poor populations and adults may be threatened by large youth populations. While these theoretical perspectives may differ in some nuances and applications (see Leiber & Peck, 2020), the central idea behind group threat hypotheses is that prior attributions about race and ethnicity will lead court actors to discriminate against minority defendants in response to perceived threats in the broader social context.
Testing Group Threats
There are some challenges to testing group threat hypotheses, however. Chamlin and Cochran (2000) have observed that what many studies take to be contextual indicators of threat are equally compatible with other, non-conflict perspectives. As Chamlin (2009) puts it, “Insofar as threat remains an unmeasured intervening construct, correlations between structural antecedents of threat and crime control are susceptible to multiple interpretations” (p. 540). For example, traditional social disorganization theory posits that contextual factors such as greater concentrated disadvantage, ethnic heterogeneity, and residential mobility impede social integration and contribute to the breakdown of informal social control (Pratt & Cullen, 2005). This breakdown creates the need for greater formal social control, presenting a non-conflict explanation for the relationship between structural variables and more punitive court outcomes. As Mears (2006) observes, “But is a symbolic threat really what drives state-level juvenile incarceration policies, or is it something else? One reasonable explanation . . . is that symbolic threats simply serve as a proxy for legitimate concern about crime” (p. 474).
One possible response to this conundrum of multiple interpretations is to use different contextual measures to assess group threats and social disorganization in the same analytical model. Crime rates, residential mobility, and urbanism, for example, are each associated with social disorganization but not explicitly with the group threats elaborated above. While including more contextual control variables may produce a better specified model—and is thus to be recommended—it will not solve the problem entirely since these variables remain open to different interpretations. This is perhaps most manifest in the case of community crime levels, which can be viewed as either a threat to elites and mainstream culture (i.e., conflict theory) or as a lack of social control that must be met with a formal, punitive response (i.e., consensus theory).
Another solution to the dilemma of multiple interpretations goes to the heart of what group threat hypotheses are attempting to measure: increased social control for all defendants (i.e., direct effects) versus increased racial and ethnic discrimination (i.e., interactive effects). Elsewhere these have been referred to as diffuse and targeted threats, respectively (see Zane, 2018). Unlike diffuse effects—which suggest an overall increase in formal social control that is equally consistent with social disorganization theory—targeted effects suggest that minority defendants are treated more punitively in the presence of group threats. While much research has tested the group threat hypotheses in terms of diffuse threats (see Feldmeyer & Cochran, 2018), such direct effects may be more consistent with a social disorganization perspective.
Targeted effects, however, provide more clear support for the group threat hypotheses, where court actors respond to threatening populations by discriminating against minority defendants (Mitchell, 2005). As Feldmeyer et al. (2015) observe, “the key question for racial/ethnic and immigrant threat is not whether racial, ethnic, and immigrant context shapes overall sentencing patterns for all defendants (as in the main effects) but whether it specifically increases punishment for racial and ethnic minorities” (p. 81). In keeping with this logic, the present study follows Britt (2000) and others (e.g., Mitchell, 2005; Zane, 2018) in positing that only targeted effects clearly support group threat hypotheses. Thus reframed, the question becomes: do group threats exacerbate racial and ethnic disparities in the juvenile justice system?
Prior Research on Targeted Group Threats
The targeted threat research question can be tested by estimating multilevel models with cross-level interactions between race/ethnicity (at the case level) and group threats (at the county level). A good deal of research has done so in both the criminal and juvenile justice contexts. In criminal justice, most research has focused on minority threat and arrived at mixed results overall (see Caravelis et al., 2011, 2013; Feldmeyer et al., 2015; but see Britt, 2000; King et al., 2010; Wang & Mears, 2010a, 2010b). Accordingly, there is no general consensus about the overall validity of the minority threat hypothesis (Feldmeyer & Cochran, 2018).
A wider range of group threats have been examined in the juvenile justice context, with similarly mixed results. For minority threat, some research finds support for targeted minority threat in terms of charge reductions (Lowery, 2021) and secure placement (Davis & Sorensen, 2013), while others find no relationship between minority threat and racial disparities at juvenile court outcomes such as intake (Leiber et al., 2016), petition (Andersen & Ouellette, 2019; Freiburger & Jordan, 2011), adjudication (Andersen & Ouellette, 2019; Hayes-Smith & Hayes-Smith, 2009), and judicial disposition (Andersen & Ouellette, 2019; Leiber et al., 2016). These mixed findings are similar in studies of economic threat, with some finding greater disparities associated with structural disadvantage (e.g., Freiburger & Jordan, 2011; Lowery, 2021; Lowery & Smith, 2020; Thomas et al., 2013) and others finding no relationship (e.g., Hayes-Smith & Hayes-Smith, 2009; Leiber et al., 2016; Rodriguez, 2007, 2013). Less tested is age threat; in one recent study Leiber and Peck (2020) found that racial and ethnic disparities at intake and disposition were not conditioned by youth population size.
One possible explanation for the mixed findings in both criminal and juvenile justice contexts is that group threats may be measured differently across studies. Arguably the most important operationalization distinction is between static and dynamic threat: group threat at a point in time (i.e., static) versus the growth in group threat over time (i.e., dynamic). While most minority threat research has used a static measure of threat (e.g., racial composition), others have argued that dynamic measures may better capture visible threats to which court actors might respond (Caravelis et al., 2011). Most studies of group threats in a juvenile justice have not employed dynamic measures of threat, however (but see Lowery, 2021; Lowery et al., 2018).
Another, less frequently discussed possibility for the inconsistent findings across studies is that most research assesses group threat hypotheses by looking at single jurisdictions (individual states or even counties). This raises the possibility that group threats operate in some jurisdictions but not in others. Notably, only a few studies have examined minority threat across multiple jurisdictions where results may be more generalizable (e.g., Leiber et al., 2016; Wang & Mears, 2015; Zane, 2018).
Finally, and perhaps most importantly, most research on targeted group threats has not followed current best practices for testing cross-level interactions in the context of nonlinear dependent variables. The editors of the American Sociological Review have recently advised as follows: “The case is closed: don’t use the coefficient of the interaction term to draw conclusions about the statistical interaction in categorical models such as logit, probit, Poisson, and so on” (Mustillo et al., 2018, p. 1282). For present purposes, this means that most prior studies of targeted group threats have not properly tested the research question of interest.
Current Study
The present study is motivated by several gaps in the group threat literature identified above. Using a sample of 96,619 juvenile court referrals across 139 counties in four states, the study tests a series of group threat hypotheses—minority, economic, and age—using both static and dynamic measures for each threat. Importantly, the present study also tests for cross-level interaction effects by calculating second derivatives of race/ethnicity effects across different levels of group threats (see Mize, 2019). This is in contrast to past studies which have interpreted the product interaction term itself as a test of the interaction effect, which is not sufficient in the context on nonlinear dependent variables (Mustillo et al., 2018).
The hypotheses to be tested in the current study predict that racial and ethnic disparities in juvenile court outcomes will be greater in the presence of larger group threats. First, it is predicted that racial and ethnic disparities will be greater in the presence of larger minority populations in the surrounding community:
Second, it is predicted that racial and ethnic disparities will be greater in the presence of more economic disadvantage in the surrounding community:
Third, it is predicted that racial and ethnic disparities will be greater in the presence of a larger youth population in the surrounding community:
Fourth, it is predicted that racial and ethnic disparities will be greater in the presence of growing minority populations in the surrounding community:
Fifth, it is predicted that racial and ethnic disparities will be greater in the presence of growing economic disadvantage in the surrounding community:
Sixth, it is predicted that racial and ethnic disparities will be greater in the presence of a growing youth population in the surrounding community:
Data and Methods
The present study used a combination of juvenile court data and county-level data. The case-level dataset consists of all juvenile case referrals across four states—Alabama, Connecticut, South Carolina, and Utah—for which final disposition was entered in 2010. 1 The original dataset consisted of 102,330 non-dependency referrals across 149 counties. The juvenile court data were merged with a level-2 dataset consisting of county demographic factors created using decennial Census 2000 and 2010, the American Community Survey (ACS) 5-year estimates for 2010, the long-form Census questionnaire sample from Census 2000, as well as aggregated official crime statistics from the Uniform Crime Reports (UCR). Cases were dropped from the final sample based on missing data for case-level variables (n = 4,452; 4.4%). Additionally, 10 counties were dropped due to low quality estimates for contextual variables (n = 1,262; 1.2%). 2 The resulting dataset consists of 96,619 juvenile court referrals across 139 counties.
Measures
Dependent variables
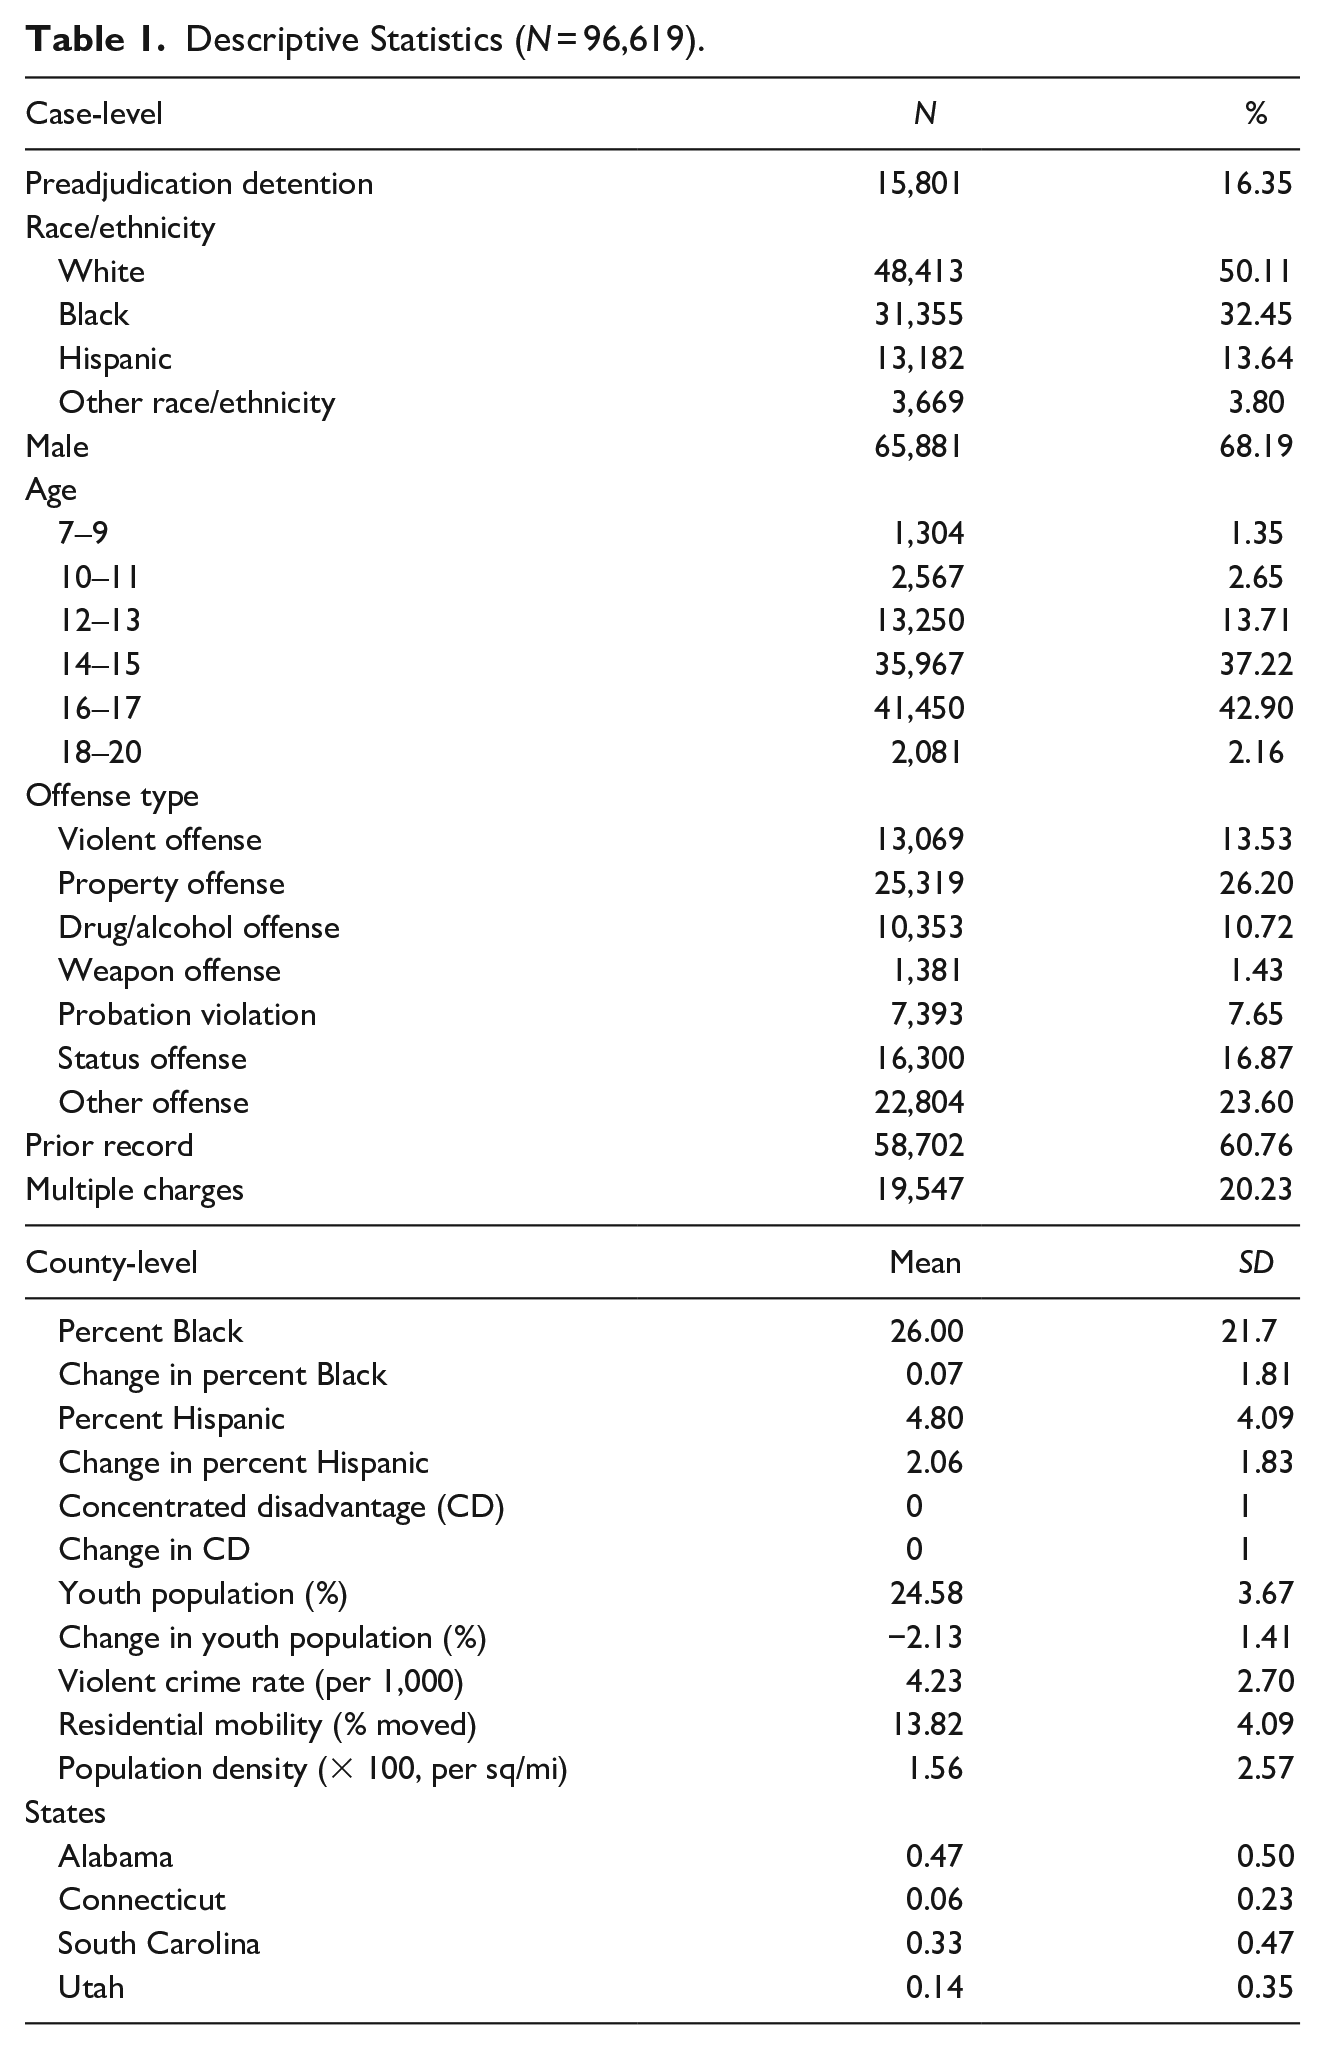
The dependent variable in the present study is preadjudication detention, which was coded as “1” for detention at intake processing and “0” for release at intake (pending petition of delinquency). Approximately 16% of cases were detained prior to petition (n = 15,801). Descriptive statistics for all variables are included in Table 1.
Descriptive Statistics (N = 96,619).
Case-level variables
The main independent variable of interest at the case-level was the race/ethnicity of the defendant, coded as Black, Hispanic (non-White), Other, and White (reference category). The final sample of juvenile referrals included approximately 50% White (n = 48,413), 33% Black (n = 31,355), 14% Hispanic (n = 13,182), and 4% Other (n = 3,669). Defendant age, sex, and offense type were included as controls. Age at referral was measured as a continuous variable ranging from 7 to 20, with a mean age (SD) of 15 (1.80). (Approximately 96% of referrals were between 10 and 17 years old.) All four states had extended jurisdiction to age 20 as well as no lower limit of jurisdiction; the common law limit of seven was used as a cutoff in determining miscodes. Sex was measured as a binary variable, coded as “1” for male (68.2%; n = 65,881) and “0” for female. Offense type was measured as a series of six dummy variables for each type of offense, based on most serious initial charge: violent offense (13.5%; n = 13,069), property offense (26.2%; n = 25,319), drug/alcohol offense (10.7%; n = 10,353), non-violent weapon offense (1.4%; n = 1,381) probation violation (7.7%; n = 7,393), status offense (16.9%; n = 16,300), and other offenses such as public order and traffic crimes (23.6%; n = 22,804). Property offense served as the reference category in all analyses since it is the most common type of offense. Prior record was coded as binary, with approximately 61% of referrals having a prior referral (n = 58,702). Number of charges was also coded as binary, with approximately 20% of referrals involving multiple charges (n = 19,547).
Contextual variables
Group threats included racial and ethnic threat, economic threat, and age threat. For each of these constructs, static and dynamic measures were employed. Racial and ethnic threat were measured as four variables based on decennial Census 2000 and 2010. First, static racial threat was measured as the percentage of Black residents in the county population, ranging from 0.3% to 83.2% Black (mean [SD] = 26.0 [21.8]). Second, dynamic racial threat was measured as percent change in racial composition (from 2000 to 2010); changes in percent Black ranged from −6.40% to 6.40% Black (mean [SD] = 0.07 [1.8]). Third, static ethnic threat was measured as the percentage of Hispanic residents in the county, ranging from 0.53% to 17.1% (mean [SD] = 4.8 [20.80]). Fourth, dynamic ethnic threat was measured as the change in Hispanic composition (from 2000 to 2010), ranging from −0.49% to 9.4% (mean [SD] = 2.1 [1.8]).
Economic threat was measured as two variables based on ACS 2010 5-year estimates. First, static economic threat was measured as a weighted index score for concentrated disadvantage based on four indicators: percent unemployment, percent households below poverty, percent families using supplemental nutrition assistance program, and percent female-headed households (α = .87). 3 Prior to standardization, concentrated disadvantage scores ranged from −3.22 (indicating low disadvantage) to 5.81 (representing high disadvantage), with a mean (SD) value of 0 (1.86). Second, dynamic economic threat was measured as change in concentrated disadvantage from 2000 to 2010; this represents the extent to which a county has become more or less disadvantaged over time. 4 Prior to standardization, change in concentrated disadvantage scores ranged from −5.30 to 2.15, with a mean (SD) value of 0 (0.90).
Age threat was operationalized in terms of youth population density. First, static age threat was measured as the percentage of the county population that is under age 18. Youth population density ranged from 14.5% to 37.4%, with a mean (SD) value of 24.6 (3.7). Second, dynamic age threat was measured as change in youth population density (from 2000 to 2010), ranging from −6.8% to 1.1% with a mean (SD) value of −2.1 (1.4). To examine non-linearity, quadratic terms were included for all static threat measures.
First, average violent index (i.e., felony) crime rates for the years 2009 to 2011 (per 1,000 residents) were included. Violent crime rates ranged from 0.25 (per 1,000) to 14.2 (per 1,000), with a mean (SD) value of 4.2 (2.7). Second, residential mobility was included as an indicator of social disorganization, measured as the percentage of the county that has moved in the past 5 years. This ranged from 4.1% to 25.1% (mean [SD] = 13.8 [4.1]). Third, urbanism was included, measured as population density based on Census 2010 (recoded as 100 persons per square mile). This ranged from 0.02 (i.e., two persons per square mile) to 14.7 (i.e., 1,470 persons per square mile), with a mean (SD) value of 1.6 (2.6) (i.e., 160 persons per square mile). Finally, since the data is multi-jurisdictional, a series of dummy variables for states were included. Alabama had the most counties (n = 65; 46.8%) and served as the reference category.
Analytic Strategy
The present study employed two-level multilevel logistic regression models to assess the relationship between group threats and racial and ethnic disparities at preadjudication detention. An unconditional model was first estimated to observe whether the odds of preadjudication detention varied significantly across counties. Next, random coefficient models were estimated for race and ethnicity to assess the variation in their effects on detention likelihood across counties. 5 Measures of concentrated disadvantage were standardized for interpretation purposes. All other non-binary variables were grand mean centered. Separate, reduced models were estimated for each group threat hypothesis due to multicollinearity concerns. 6 In the eight reduced group threat models, all variables presented low collinearity concerns (VIF < 5).
For each indicator of group threat, multilevel analyses proceeded in three stages. First, a model was estimated regressing juvenile court outcomes on race and ethnicity, controlling for case-level variables. Race was treated as a factor variable with four categories, and was designated as a random effect at the county level. This model serves as a baseline to assess the relationship between race and ethnicity and the outcome of interest, as well as the variation in the effects of race and ethnicity across counties (i.e., random effects). Second, a model was estimated that included the group threat measure of interest as well as contextual controls. This second model assesses the direct relationship between the group threat and juvenile court outcomes for all defendants (i.e., diffuse group threats) prior to adding interactions. In the third stage of the analysis, cross-level interactions were estimated between defendant race/ethnicity and the group threat measure to assess whether the effects of race and ethnicity were moderated by group threats (i.e., targeted group threats). All analyses used two-sided hypothesis testing with an α of .05, performed using Stata 15.
As others have recently pointed out, nonlinear dependent variables present a special case for interpreting interactions (Mize, 2019). Due to the nonlinearity of the dependent variable and the nonconstant effects of independent variables over the cumulative distribution of the dependent variable’s S-shaped probability function, the product coefficient of the interaction term does not adequately represent the interaction effect (Ai & Norton, 2003; Brambor et al., 2006; Long & Mustillo, 2021; Mize, 2019). Instead, when examining the interaction between a categorical (i.e., race/ethnicity) and continuous variable (i.e., group threats), the interaction effect is best represented by the “second differences” (i.e., second derivatives) of the marginal effects (i.e., first derivatives) of the categorical variable across different values of the continuous variable. The most straightforward approach is to estimate predicted probabilities and marginal effects, where testing the equality of multiple effects (i.e., second differences) is used to assess interactions. To accomplish this, the Spost13 package was used in Stata 15. For the interaction of a categorical and continuous variable, graphical presentation is most intuitive and figures were generated to display the interactive effects (see Mize, 2019). 7
Results
To assess whether preadjudication detention outcomes varied significantly across counties, an unconditional model was first estimated. The analysis (not shown here) indicates that there was significant variation in detention outcomes across counties (p < .001), with a level-2 variance component (ψ2) of .70 (intraclass correlation [ρ] of .18). 8 This indicates that before any predictors were added to the model, approximately 18% of the variation in detention outcomes was attributable to county-level differences.
Table 2 presents the results of multilevel analyses of detention outcomes, prior to estimating cross-level interactions. After adding contextual variables, there remained significant variation in detention outcomes across counties (p < .001), with a level-2 variance component (ψ2) of .50 (ρ = .13). Odds of detention were 22% greater for Black defendants compared to White defendants (OR = 1.22, p < .001) and 21% greater for Hispanic defendants compared to White defendants (OR = 1.21, p < .001). The effects of race/ethnicity on detention varied significantly across counties (p < .001), with a level-2 variance component (ψ) of .01 and intraclass correlation (ρ) of .00—indicating that less than 1% of the variation in these effects was attributable to between-county differences.
Multilevel Logistic Regression Models, Preadjudication Detention (N = 96,619).
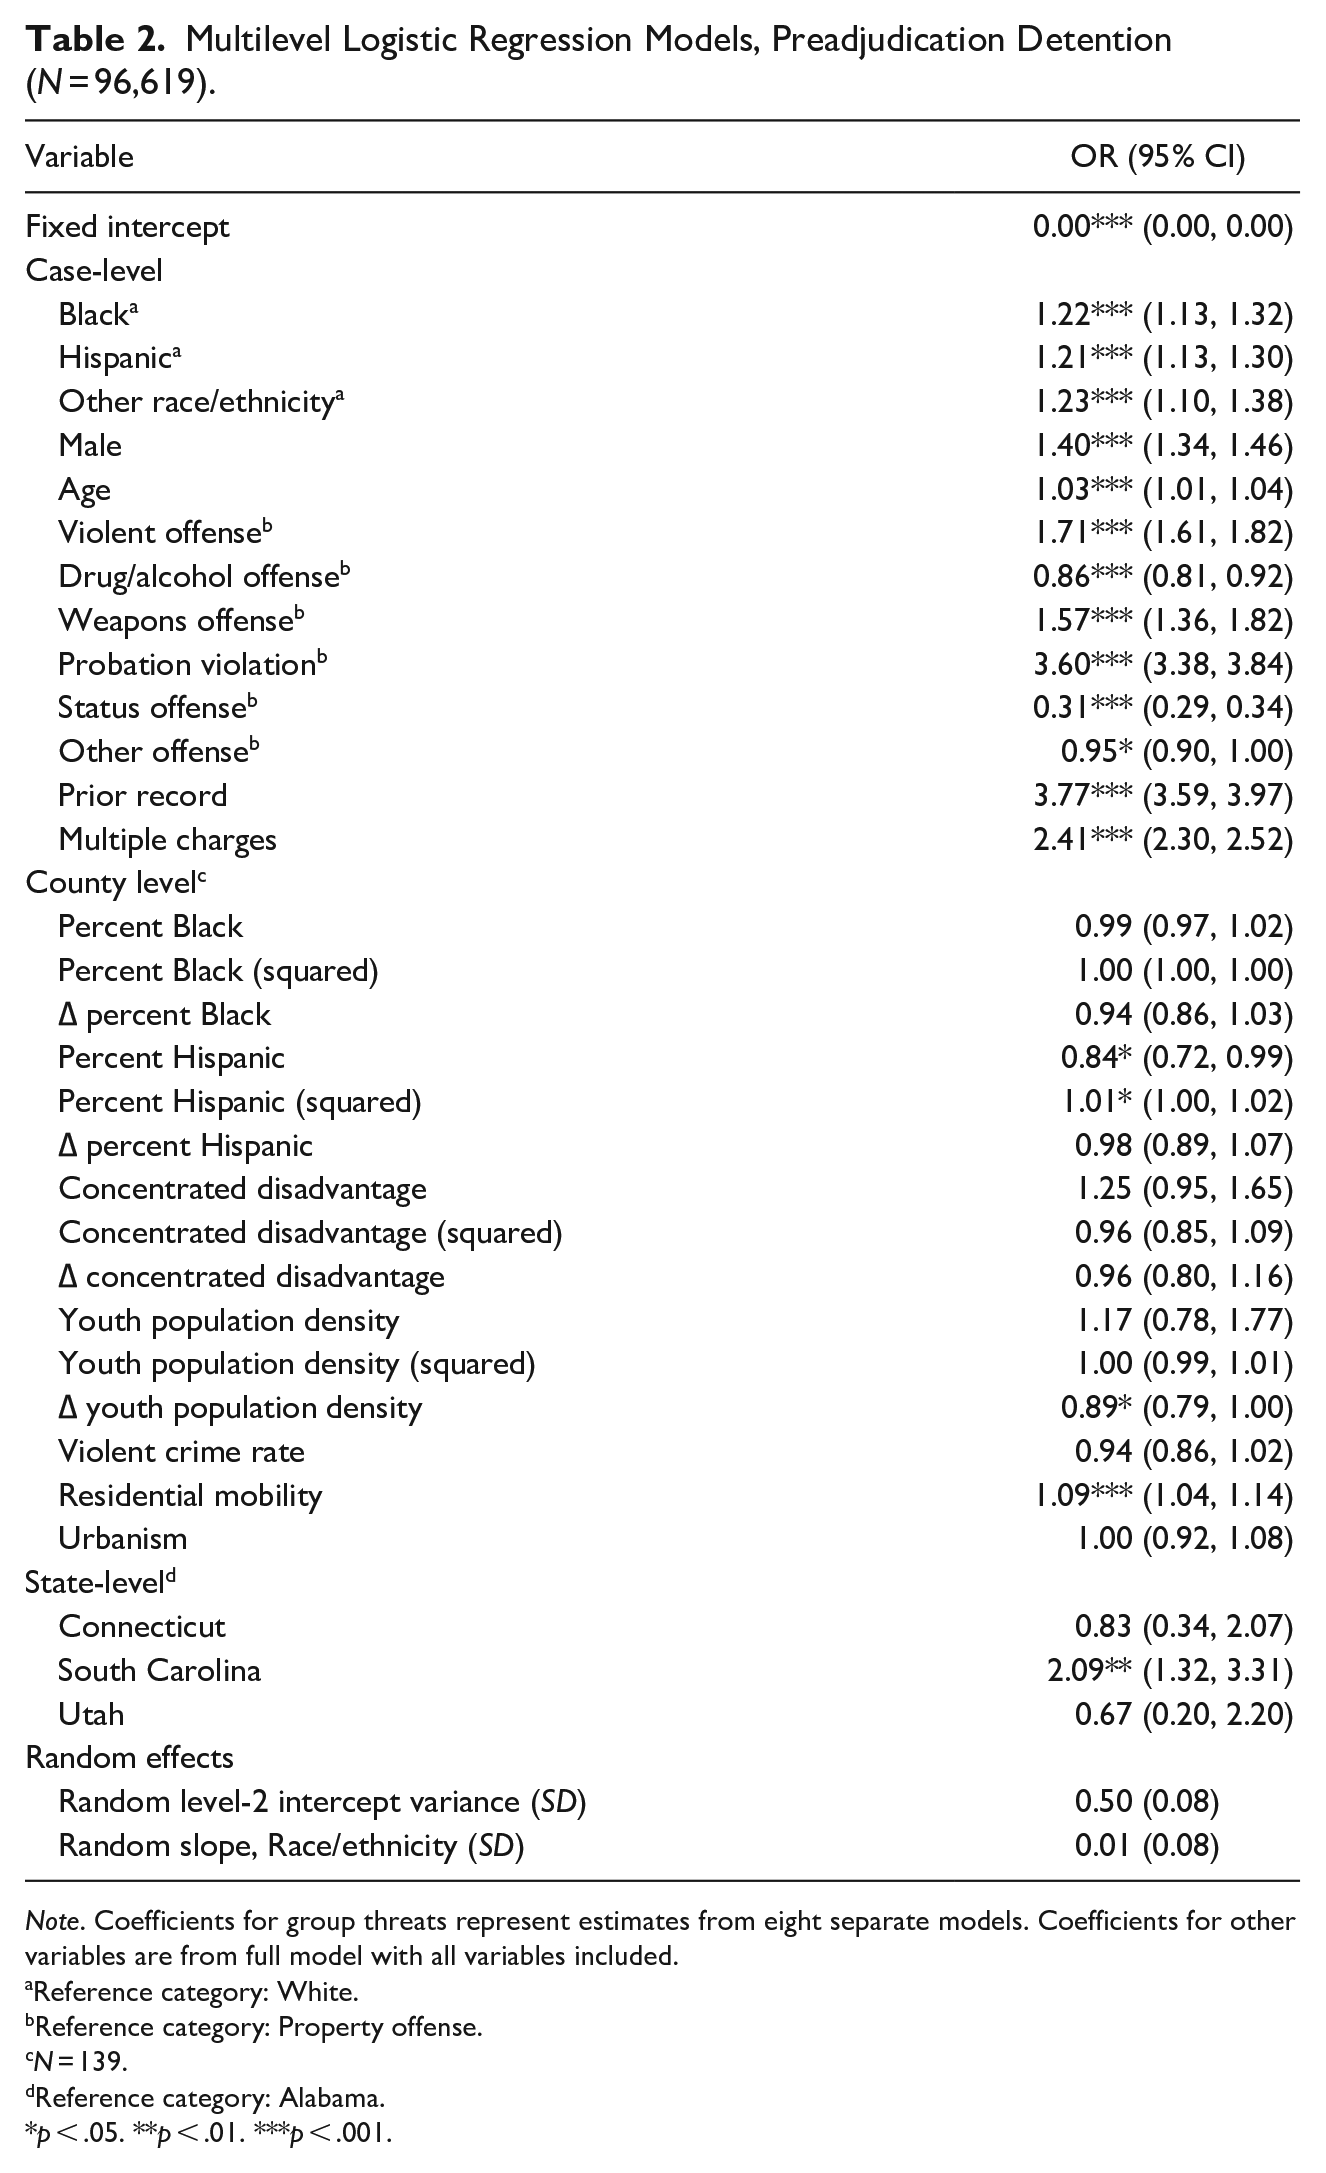
Note. Coefficients for group threats represent estimates from eight separate models. Coefficients for other variables are from full model with all variables included.
Reference category: White.
Reference category: Property offense.
N = 139.
Reference category: Alabama.
p < .05. **p < .01. ***p < .001.
Two group threats were significantly associated with odds of detention. First, percent Hispanic (i.e., static ethnic threat) was negatively associated with detention (OR = 0.84), such that odds of detention were 16% lower in counties with 1% larger Hispanic population. Second, change in youth population (i.e., dynamic age threat) was also negatively associated with detention (OR = 0.89), such that odds of detention were 11% lower in counties where the young population has increased by 1% over the prior decade. Interestingly, no group threats were positively associated with odds of detention.
Targeted group threat hypotheses were tested using cross-level interactions, estimated in separate regression models for each group threat. Based on regression estimates, predicted probabilities were calculated in post-estimation (using Stata’s margins command). Marginal effects were estimated to assess the differences in probability of detention by race and ethnicity. To test interactions, second differences in the marginal effects of race and ethnicity (i.e., first differences) were estimated across different values of each group threat. Given the large number of first and second differences used to test the cross-level interactions, findings are displayed using figures of predicted probabilities (Mize, 2019) (As discussed above, product terms do not represent a sufficient test of the cross-level interaction between race/ethnicity and group threats). In each figure, the x-axis represents continuous values of the group threat of interest (e.g., racial threat), the y-axis represents the predicted probability of detention, and lines represent Black, Hispanic, and White. As such, predicted probabilities of detention at each level of threat are displayed separately for each group.
Support for Research Hypotheses.
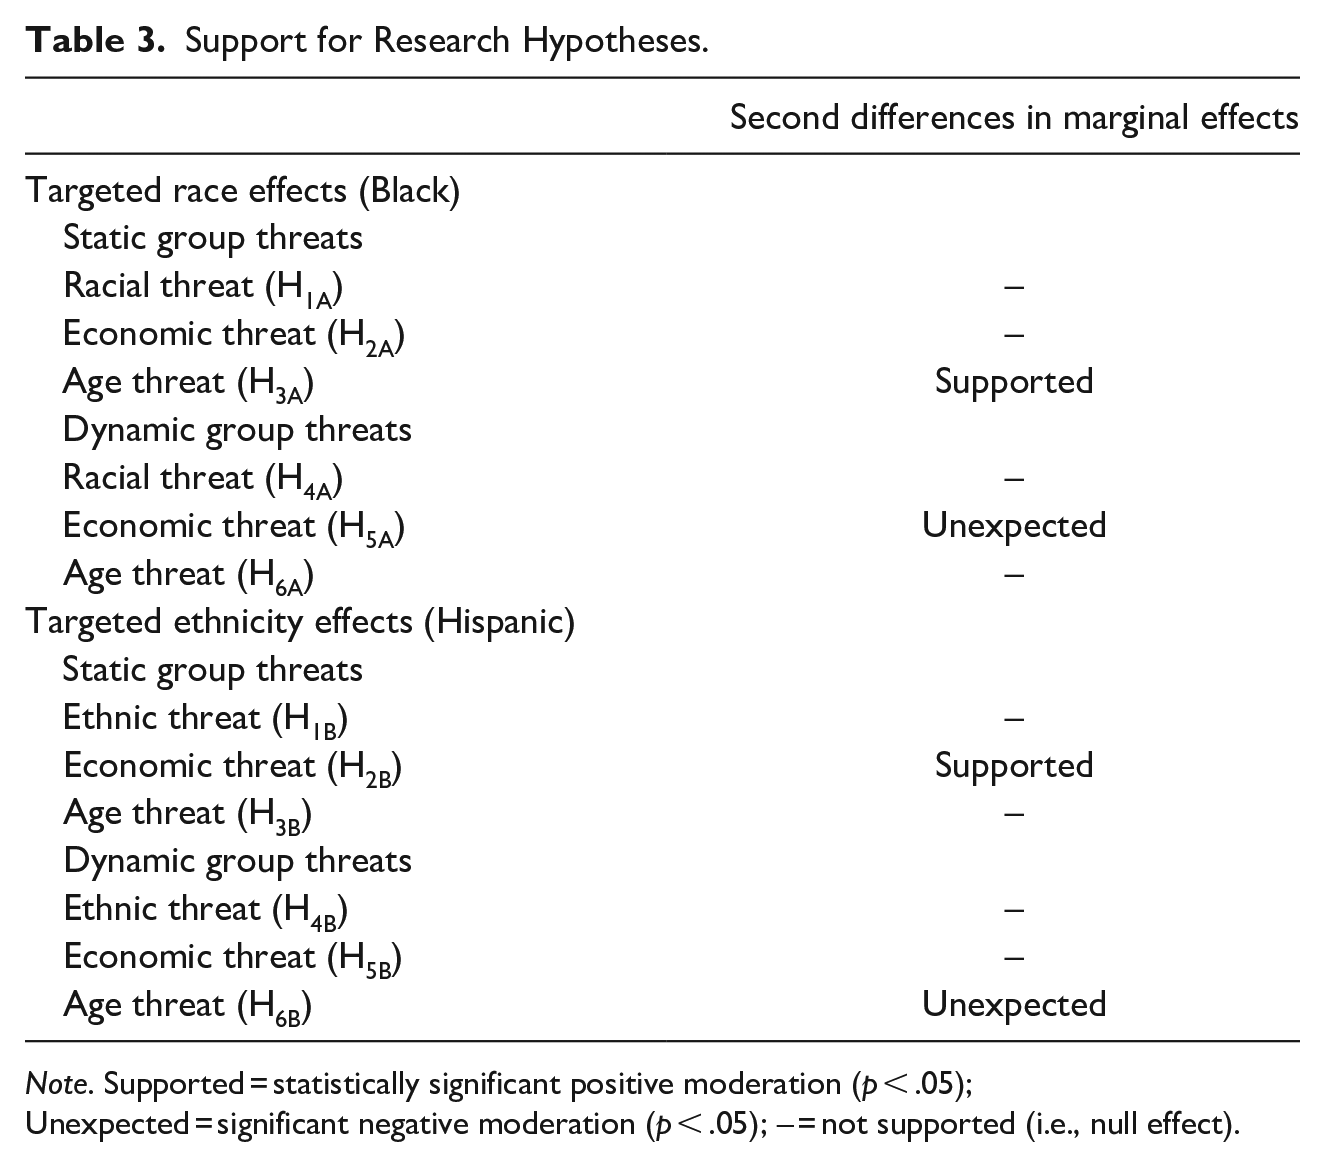
Note. Supported = statistically significant positive moderation (p < .05); Unexpected = significant negative moderation (p < .05); – = not supported (i.e., null effect).
Static Group Threats
Figure 1 plots the predicted probabilities of detention for Black, Hispanic, and White defendants across different levels of static group threats for racial, ethnic, economic, and age threat, represented by four panels.
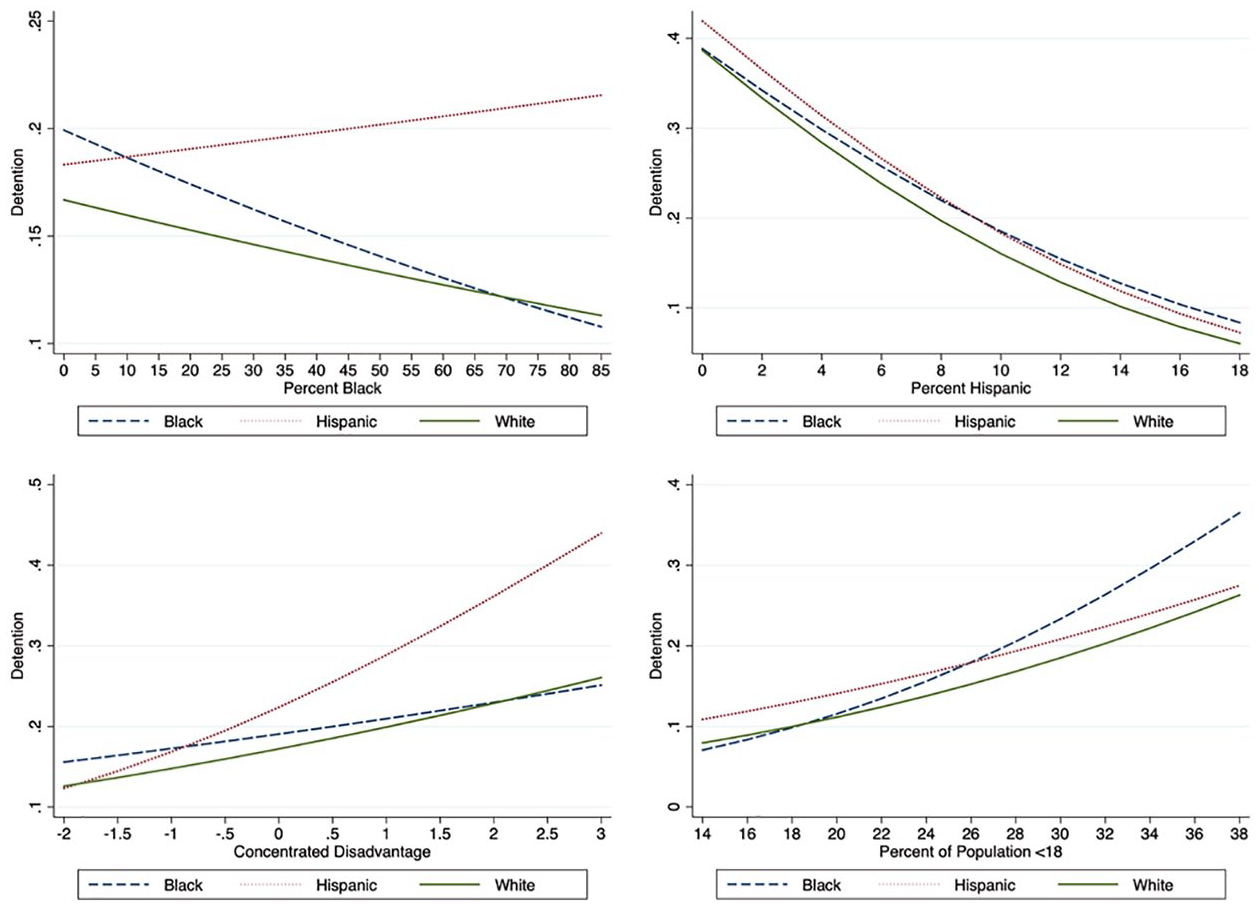
Predicted probabilities of detention by race/ethnicity and static group threats.
Racial threat
First, static racial threat is operationalized as percent Black, which ranged from 0% to 85%. As shown in Figure 1, at the lowest value, the predicted probability of detention was 16.7% for White defendants, 19.9% for Black defendants, and 18.3% for Hispanic defendants. At the highest value, the probability of detention was 11.3% for White defendants, 10.8% for Black defendants, and 21.6% for Hispanic defendants.
The Black-White difference in predicted probability of detention (i.e., the marginal effect) decreased from approximately 3.2% (p < .001) in counties with a small Black population (i.e., 0%–5%) to −0.01% in counties with a large Black population (i.e., 80%–85%). (Differences were no longer significant at 40% Black.) Tests of second derivatives did not reach significance, indicating no evidence of moderation.
The Hispanic-White difference in predicted probability of detention increased from approximately 1.6% (p < .01) in counties with a small Black population (i.e., 0%–5%) to approximately 10.3% (not significant) in counties with a large Black population (i.e., 80%–85%). (Differences were no longer significant at 70% Black). Tests of second derivatives indicated that the differences in Hispanic-White differences were significant from 0% Black to 15% Black, but not thereafter. This indicates that Hispanic-White differences were positively moderated by static racial threat in counties with a smaller Black population but not in counties with a larger Black population.
Ethnic threat
Second, static ethnic threat is operationalized as percent Hispanic, which ranged from 0% to 18%. As shown in Figure 1, at the lowest values of percent Hispanic, the predicted probability of detention was 38.7% for White defendants, 38.8% for Black defendants, and 41.9% for Hispanic defendants. At the highest value, the probability of detention was 6% for White defendants, 8.4% for Black defendants, and 7.2% for Hispanic defendants.
Black-White differences in probability of detention were near zero (and non-significant) in counties where the Hispanic population was smallest. In counties with 4% Hispanic population, Black defendants had a 1.4% greater probability of detention (p < .01) than White defendants. In counties with the largest Hispanic population, the Black-White difference reached 2.3% (p < .01). Tests of second derivatives indicated that the differences in Black-White differences were significant from 0% Hispanic to 8% Hispanic. This indicates that Black-White differences were positively moderated by static ethnic threat in counties with a smaller Hispanic population but not in counties with a larger Hispanic population.
The Hispanic-White difference in probability of detention decreased from a 3.3% difference (p < .05) at 0% Hispanic to a 1.2% difference (p < .01) at 18% Hispanic. Tests of second derivatives did not reach significance, however, indicating no evidence of moderation.
Economic threat
Third, static economic threat is operationalized as concentrated disadvantage scores from 2 standard deviations below the mean to 3 standard deviations above the mean. As shown in Figure 1, at the lowest values of disadvantage, the predicted probability of detention was 12.3% for White defendants, 15.2% for Black defendants, and 12% for Hispanic defendants. At the highest value, the predicted probability of detention was 27.6% for White defendants, 26.8% for Black defendants, and 45.8% for Hispanic defendants.
Black-White differences in probability of detention decreased from less to more disadvantaged counties. Where largest where concentrated disadvantage was lowest, Black defendants had 2.9% (p < .01) greater probability of detention than White defendants. Where concentrated disadvantage was highest, Black defendants had 0.8% lower probability of detention (not significant). Tests of second derivatives did not reach significance, indicating no evidence of moderation.
Hispanic-White difference in predicted probability of detention increased from approximately zero in counties with lower concentrated disadvantage (i.e., −2 standard deviations) to approximately 18.1% (p < .01) in counties with the most disadvantage (i.e., 3 standard deviations). Tests of second derivatives indicated that the differences in Hispanic-White differences were significant across all changes in values of concentrated disadvantage. This indicates that Hispanic-White differences were positively moderated by static economic threat.
Age threat
Fourth, static age threat is operationalized as proportion of the population that is below 18, ranging from 14% to 38% youth. As shown in Figure 1, in counties with the smallest youth population, the predicted probability of detention was 8% for White defendants, 7.1% for Black defendants, and 10.9% for Hispanic defendants. In counties with the largest youth population, the predicted probability of detention was 26.3% for White defendants, 36.5% for Black defendants, and 27.5% for Hispanic defendants.
Black-White differences in probability of detention increased from −.9% in counties with lowest youth density to 10% in counties with highest youth density, neither of which were statistically significant. Tests of second derivatives indicated that differences in the likelihood of detention were significant between low youth density (i.e., 14%–18%) and high youth density (i.e., 26%–38%). This indicates that Black-White differences were positively moderated by static age threat for low versus high values (but not across adjacent values).
Hispanic-White differences in probability of detention, on the other hand, decreased from 2.9% in counties with low youth density (i.e., 14% youth) to 1.1% in counties with high youth density (i.e., 38%), neither of which were statistically significant differences. Tests of second derivatives did not reach significance, indicating no evidence of moderation.
Dynamic Group Threats
Figure 2 plots the predicted probabilities of detention for Black, Hispanic, and White defendants across different levels of dynamic group threats for racial, ethnic, economic, and age threat, represented by four panels.
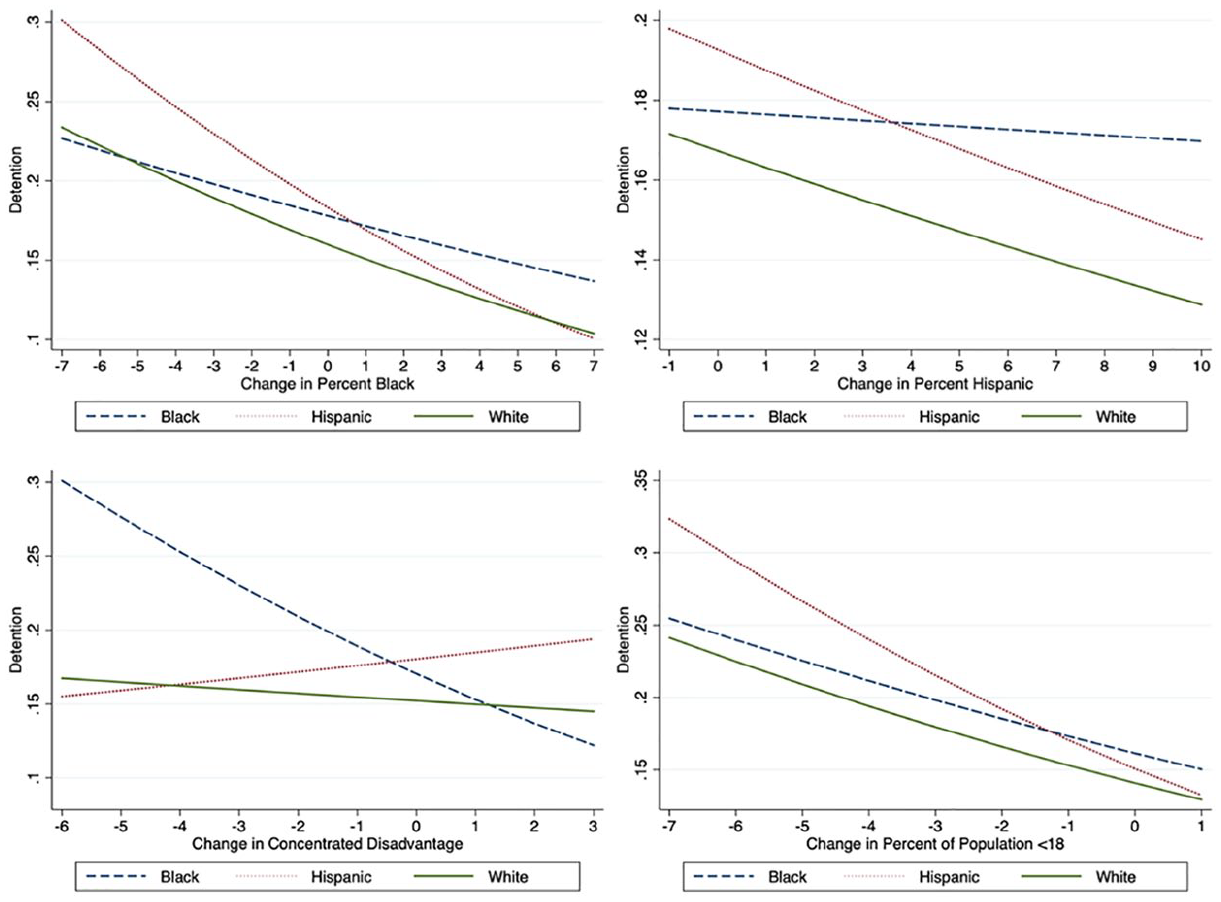
Predicted probabilities of detention by race/ethnicity and dynamic group threats.
Racial threat
First, dynamic racial threat is operationalized as change in percent Black from 2000 to 2010, which ranged from 7% decrease to 7% increase. As shown in Figure 2, at the lowest value, the predicted probability of detention was 23.4% for White defendants, 22.7% for Black defendants, and 30.1% for Hispanic defendants. At the highest value, the predicted probability of detention was 10.4% for White defendants, 13.7% for Black defendants, and 10.1% for Hispanic defendants.
Black-White differences in probability of detention were near zero (and non-significant) in counties where the Black population had decreased by 7%. In counties where the Black population had decreased by 1%, the Black-White difference is significant for the first time (1.5%; p < .01), and this difference increased to 3.3% (p < .05) in counties with the highest growth in Black population. Tests of second derivatives did not reach significance, however, indicating no evidence of moderation.
For Hispanic-White differences, there was a large but non-significant Hispanic-White difference in predicted probabilities in counties where the Black population had decreased by 7%. As the change in percent Black increased, this Hispanic-White difference declined to near zero. Tests of second derivatives did not reach significance, indicating no evidence of moderation.
Ethnic threat
Second, dynamic ethnic threat is operationalized as change in percent Hispanic, which ranged from 1% decrease to 10% increase. As shown in Figure 2, at the lowest values, the predicted probability of detention was 17.1% for White defendants, 17.8% for Black defendants, and 19.8% for Hispanic defendants. At the highest value, the predicted probability of detention was 12.9% for White defendants, 17% for Black defendants, and 14.5% for Hispanic defendants.
Black-White differences in probability of detention increased from approximately 1% in counties with 1% decrease in percent Hispanic to 4.1% (p < .05) in counties with 10% increase in percent Hispanic. Tests of second derivatives did not reach significance, however, indicating no evidence of moderation.
Hispanic-White differences in probability of detention decreased from 2.6% in counties with 1% decrease in percent Hispanic to 1.6% in counties with 10% increase in percent Hispanic. Tests of second derivatives did not reach significance, however, indicating no evidence of moderation.
Economic threat
Third, dynamic economic threat is operationalized as the change in concentrated disadvantage from 2000 to 2010, which ranged from 6 standard deviation decrease to 3 standard deviation increase. As shown in Figure 2, in counties with the largest decrease in disadvantage, the predicted probability of detention was 16.7% for White defendants, 30.1% for Black defendants, and 15.5% for Hispanic defendants. In counties with the largest increase in disadvantage, the predicted probability of detention was 14.5% for White defendants, 12.2% for Black defendants, and 19.5% for Hispanic defendants.
Black-White differences in likelihood of detention decreased as change in disadvantage increased, from 13.4% higher probability in counties where concentrated disadvantage most decreased (p < .01) to 2.3% lower probability in counties where concentrated disadvantage most increased (not significant). Tests of second derivatives indicated that the differences in Black-White differences were significant across different values of change in concentrated disadvantage. This indicates that Black-White differences were negatively moderated by dynamic economic threat.
Hispanic-White differences in odds of detention probability, on the other hand, increased as change in disadvantage increased, from −1.2% lower probability in counties where disadvantage most decreased (not significant) to 4.9% in counties where disadvantage most increased (p < .10). Tests of second derivatives did not reach significance, however, indicating no evidence of moderation.
Age threat
Fourth, dynamic age threat is operationalized as change in youth population proportion from 2000 to 2010, which ranged from 7% decrease to 1% increase. As shown in Figure 2, in counties with the largest decrease in youth population, the predicted probability of detention was 24.1% for White defendants, 25.5% for Black defendants, and 32.3% for Hispanic defendants. In counties with the largest increase in youth population, the predicted probability of detention was 12.9% for White defendants, 15% for Black defendants, and 13.3% for Hispanic defendants.
Black-White differences in detention probability increased from 1.3% (not significant) in counties with the largest decrease in youth density (i.e., 7%) to 2.1% (p < .10) in counties with the largest increase in youth density (i.e., 1%). Tests of second derivatives did not reach significance, indicating no evidence of moderation.
Hispanic-White differences in detention probability decreased from 8% (p = .01) in counties with the largest decrease in youth density to approximately zero in counties with the largest increase in youth density. Tests of second derivatives indicated that differences in the likelihood of detention were significant across all values of change in youth population. This indicates that Hispanic-White differences were negatively moderated by dynamic age threat.
Discussion
The main aim of this paper was to assess whether racial and ethnic disparities in preadjudication detention were positively moderated by group threats. To date, fewer than a dozen studies have examined targeted group threats in the context of the juvenile justice system (and none have examined all at once), most have only used static measures of threat, and most have examined single jurisdictions. Moreover, none have followed best practices for estimating cross-level interactions (see Mize, 2019). To make a unique contribution to this literature, the present study utilized a large, multijurisdictional sample that allowed for the simultaneous testing of minority threat, economic threat, and age threat for race (i.e., Black) and ethnicity (i.e., Hispanic), operationalized in terms of static as well as dynamic measures of threat.
The findings provided limited support for the group threat hypotheses (see Table 3). Of the 12 group threats tested, two supported the research hypotheses. First, Hispanic-White disparities in detention were significantly greater in counties with more concentrated disadvantage (i.e., static economic threat), supporting
There were two additional positive interactions not anticipated by the research hypotheses. Specifically, Hispanic-White disparities were significantly greater in counties with larger Black populations (i.e., static racial threat) while Black-White disparities were significantly greater in counties with larger Hispanic populations (i.e., static ethnic threat). While positive interactions would typically be considered supportive, these effects were unexpected: it is not clear why larger Black populations would only influence Hispanic-White disparities while larger Hispanic populations would only influence Black-White disparities.
There are several noteworthy takeaways from these findings. First, static group threats received more support than dynamic threats, contrary to theoretical expectations that dynamic threats may be more visible to community elites (see, e.g., Caravelis et al., 2011, 2013; Zane, 2018). Second, racial and ethnic threat received no support while economic and age threat received partial support. Given that most prior research has investigated group threats involving racial and ethnic composition (i.e., minority threat), this might motivate future research to pay more attention to other group threats. Most notably, structural disadvantage was strongly associated with Hispanic-White disparities. Third, no clear patterns were detected among the group threats under examination. For instance, no particular group threat moderated racial as well as ethnic disparities. It is not clear why this would be so if group threats were causally influencing the perceptions of court actors. It may be that racial and ethnic disparities cannot be explained by the same mechanisms, or that, more generally, group threats do not operate in any uniform fashion across different contexts. Instead, some group threats may be associated with racial and ethnic disparities in some places and not others. Notably, such heterogeneity of effects would be inconsistent with group threat as a general theory of systemic disparities in the juvenile justice system.
The present research is not without limitations. Most notably, although this study aimed at a more comprehensive test of the group threat hypotheses compared to prior research, it is possible that group threats are not best measured by structural proxies. While the core thesis of group threat is that discrimination is caused by perceptions of threat on the part of community elites, these perceptions are almost never directly measured (Chamlin, 2009). Instead, most studies rely on indirect measures of threat such as racial composition. As Blalock (1967) himself observed, such proxy measures are “often inadequate for obtaining reasonably direct measures of discriminatory behavior” (p. 144). 9 Nevertheless, since we cannot observe the psychological processes that ultimately produce decisions (Ulmer, 2012), we must instead utilize structural indicators of group threat to test the research hypotheses (see Feldmeyer & Cochran, 2018; Stults & Swagar, 2018). 10
An additional limitation is that the regression models did not include every relevant case- or county-level factor that may influence variation in detention. At the case-level, this includes unmeasured characteristics that are rarely included in criminal justice system research such as developmental maturity, substance abuse, family situation, attitudinal factors (e.g., remorse), victim characteristics, and strength of evidence. In the context of logistic regression especially, omitted variables may influence coefficient estimates (see Mood, 2010). At the community-level is the question of whether context is properly measured by county-level variables or whether certain levels of analysis are omitted. As Wenger (2021) observes, “there is no a priori reason to believe that complex theoretical constructs, like disadvantage, inequality, residential stability, and so on operate at only one geographic level” (p. 7). One possibility for group threat is that the relevant perceptions of juvenile court actors may involve either a broader perspective encompassing multiple counties or a narrower perspective encompassing sub-county (e.g., neighborhood) characteristics.
Another possible limitation involves the use of a dataset combining states with different juvenile justice systems. As noted above, the motivation for this approach is that support for group threat hypotheses is mixed in prior research, possibly due to idiosyncrasies in particular systems or courts (Britt, 2000). As such, combining multiple courts or systems provides for a more generalizable test of the hypotheses. Still, others have argued that it is preferable to study single jurisdictions because court processes across states may be simply incomparable (Myers & Talarico, 1987). 11 That is, the lack of support for group threats may indicate that such threats influence decision-making in some courts but not others—and these effects wash out in multijurisdictional research. Of course, the same observation could be made for any potential contextual influence. As noted elsewhere, studying only single jurisdictions “would leave us with the inability to make generalizable claims about juvenile punishment in the United States” and “would mean never moving beyond 51—or even 3000—different, possibly conflicting, conclusions about the contextual influences on the juvenile justice system” (Zane, 2022, p. 176).
Conclusions
The inability to detect robust relationships between county-level indicators of group threat and racial and ethnic disparities in preadjudication detention is consistent with prior research that has found mixed support for group threat hypotheses, in both the juvenile (e.g., Leiber et al., 2016) and criminal (e.g., Wang & Mears, 2010a) justice systems. Since the threat perspective is based in conflict theory, one plausible interpretation is that the conflict approach simply does not capture how justice systems operate. This is not a novel suggestion. Three decades ago, Hagan (1989) argued that “conflict theories do not provide sufficient attention to the structural relationships that emerge from a joining of organizational and political forces in the direction of criminal justice operations” (p. 117). Or as Britt (2000) later put it, “it is difficult to see how judges would perceive social and economic conditions similarly and then punish offenders in the same way” (pp. 729–730). Most recently, in a review of trends in racial disparities in criminal sentencing, King and Light (2019) observed: “We have tested and found support for the group threat perspective in our own research but have become skeptical of the theory’s relevance for explaining criminal punishment, including racial sentencing disparities” (p. 404). The present findings corroborate these conclusions, casting further doubt on the general validity of the group threat perspective as a theory of disparities in juvenile justice.
One final observation concerns the contrast between contextual and case-level effects. Notably, only approximately one percent of the variation in race and ethnicity effects on detention was attributable to county-level differences. This low variation can be contrasted with the variation in overall detention outcomes across counties, where 18% of the variation in outcomes was attributable to between-county differences. This might suggest that racial and ethnic disparities are in fact relatively uniform across courts, attributable to differential offending or differential treatment rather than macro-social context (see Engen et al., 2002). Community context certainly matters, but it may not matter much when it comes to racial and ethnic disparities in juvenile justice.
Footnotes
Declaration of Conflicting Interests
The author(s) declared no potential conflicts of interest with respect to the research, authorship, and/or publication of this article.
Funding
The author(s) received no financial support for the research, authorship, and/or publication of this article.