
Abstract
We assess if asking victims about the places where crimes happen leads to estimates of “crime in place” with better measurement properties. We analyze data from the Barcelona Victimization Survey (2015–2020) aggregated in 73 neighborhoods using longitudinal quasi-simplex models and criterion validity to estimate the quality of four types of survey-based measures of crime. The distribution of survey-based offense location estimates, as opposed to victim residence estimates, is highly similar to police-recorded crime statistics, and there is little trade off in terms of the reliability and validity of offense location and victim residence measures. Estimates of crimes reported to the police show a better validity, but their reliability is lower and capture fewer crimes.
Introduction
Police-recorded crimes have long been the main data source used by researchers, crime analysts, and policy makers to document community differences in crime risk and evaluate crime prevention strategies. While the accessibility and versatility of police-recorded crime data allow its usage in a wide variety of contexts, it has also been subject to criticism due to the substantial presence of measurement error resulting from the combined influences of victims’ under-reporting and inconsistences in recording practices across police jurisdictions (Coleman & Moynihan, 1996; HMIC, 2014; Skogan, 1977; Xie & Baumer, 2019). Studies have demonstrated that the analysis of community differences in crime from police data may be affected by variations in the magnitude of the “dark figure of crime” (i.e., crimes that are not recorded in police statistics) across neighborhoods (Buil-Gil, Medina et al., 2021; Goudriaan et al., 2006), with substantially more under-coverage in some small geographic areas than others (Buil-Gil, Moretti et al., 2021; Melo et al., 2020). This is problematic, calling into question the conclusions of many studies that examine the spatial distribution of crime using police data.
As a result, researchers are increasingly using crime surveys to obtain “unbiased” estimates of crime and to measure variation across geographic areas (Buelens & Benschop, 2009; D’Alò et al., 2012; Fay & Diallo, 2012; Hunter et al., 2021; Kershaw & Tseloni, 2005; McVie & Norris, 2006). However, survey-based crime data are not error-free. Like any other sample-based survey, crime surveys are affected by measurement error arising from the data collection process and the sampling design. This may include the effects of poor question wording, limitations with the questionnaire design, as well as inadequate training of survey personnel, sampling bias and non-response bias (Biemer, 2009; Lohr, 2019; Rosenbaum & Lavrakas, 1995). Crime estimates also suffer from unique errors arising from victims’ memory failures, social-desirability bias, underestimation or exaggeration of situations, and telescoping, contributing to substantial systematic bias and low reliability (Lohr, 2019; Schneider, 1981; Skogan, 1975).
However, there is another important problem affecting the quality of crime survey estimates in relation to the spatial distribution of crime, which has so far received limited attention. Estimates of crime in geographic areas derived from surveys tend to be unduly based on the places where victims live (“area victimization rates”), not the places where crimes happen (“area offense rates”). Based on estimates from the British Crime Survey 2002/03, Hodgkinsoi and Tilley (2007) observed that more than 27% of crimes take place further than 15 minutes walking distance from the victim’s household, and these tend to concentrate in city centers and business districts.
This distinction complicates efforts to compare and combine the estimates of crime from police and survey data (Bottoms & Wiles, 1997), and the extent to which survey-based estimates of area victimization rates can be treated as a valid measure of crime in place is currently unknown. While survey-based estimates of area victimization rates may provide valid measures of household crime in residential neighborhoods, they likely fail to accurately estimate crime in those places where crime is most prevalent. For example, in Barcelona, Spain, more than 60% of crimes recorded in the 2019 local victimization survey happened outside the victims’ neighborhood of residence, and these were highly concentrated in the city center (González Murciano & Murrià Sangenís, 2020).
In this paper we use data from six rounds of the Barcelona Victimization Survey (between 2015 and 2020) aggregated at the neighborhood level to document the extent of this problem. This survey is unique in its design, including a series of questions about the geographic area where each crime takes place, in addition to the more standard items about the victims’ neighborhood of residence and whether crimes are reported to the police. We assess which survey-based measure of crime (i.e., victim residence or offense location) show better measurement properties as a measure of crime across geographic areas. We also examine the effect of restricting the focus to the subset of offenses that are reported to the police, providing a more direct comparison with police recorded crime figures. We use longitudinal quasi-simplex models and criterion validity to estimate the quality of estimates of crime in neighborhoods obtained from the Barcelona Victimization Survey, comparing these to measures of crime recorded by the police over the same 6-year period.
Background
In response to the growing concern that police-recorded crime data may not provide valid measures of crime for comparisons across countries (Aebi, 2010; Von Hofer, 2000), regions/states (Fay & Diallo, 2012; Martin & Legault, 2005; Pina-Sánchez et al., 2021), neighborhoods (Buil-Gil, Medina et al., 2021), and micro places (Brantingham, 2018; Melo et al., 2020), a nascent body of literature has sought to rely on survey data to obtain estimates of crime in geographic areas. For example, Kershaw and Tseloni (2005) used regression models from British Crime Survey data and area-level administrative records of age, ethnic groups, poverty, and housing to estimate crime in local areas (see also Hunter et al., 2021). Similarly, Buelens and Benschop (2009) applied model-based small area estimation to produce estimates of violent crime incidence in 25 police zones in Netherlands from survey data. Small area estimation methods were also used by D’Alò et al. (2012) to estimate violence against women across regions in Italy, and by Fay and Diallo (2012) to estimate rates of different offenses in US states. More recently, Buil-Gil, Moretti et al. (2021) demonstrated how regression parameters from the Crime Survey for England and Wales and known demographic values from the Census could be used to generate synthetic crime data in small geographic areas in Manchester (a similar approach is followed in Akpinar & Chouldechova, 2021). Also in the UK, the Office for National Statistics uses data from the Crime Survey for England and Wales to calculate estimates of prevalence and incidence of crime types at the level of police force areas. 1
Whilst this research has been important in advancing our understanding of the geographical distribution of victimization rates, they may fail to accurately capture the spatial distribution of crimes where they happen. Therefore, in their attempt to avoid the measurement error present in police data, survey-based crime estimates may be affected by different forms of errors. With the exception of household offenses, it is likely that a large proportion of crimes do not occur within the immediate vicinity of the victims’ household. For example, González Murciano and Murrià Sangenís (2020) show that the majority of crime victims are victimized outside of their residential neighborhood, and crimes are highly concentrated in city centers (see also Hodgkinsoi & Tilley, 2007). This leaves open the possibility of misclassification errors if the area where the offense took place does not correspond to the area where the victim lives.
However, the scale of this problem is currently unclear. In the absence of survey questions seeking to identify the specific places where crimes happen, we can only speculate about the extent of the problem. None of the major victimization surveys offer this information. In (in the Appendix) we report the questions about places where crimes happen in eight of the most widely used crime victimization surveys. The national crime surveys in the United States, Mexico, and Chile ask participants to specify the municipality where each crime incident occurred, but this information is not included in the open access of the US National Crime Victimization Survey. In the cases of England and Wales, Scotland, Canada, New Zealand, and the International Crime Victims Survey, the questionnaire asks participants whether the crime took place near home or near the place of work, but the location of the place of work is not included in the surveys and the location of the household can only be accessed through a special license access to the surveys. None of the surveys examined includes a question about the address or neighborhood where incidents happen, and only some of them probe about the city where it happened. Thus, available data from these national and international crime surveys do not allow the estimation of area offense rates at levels below municipality.
To the best of our knowledge, the Barcelona Victimization Survey is the first regular public survey which probes respondents about the precise location where crime incidents take place, enabling survey administrators to code the specific longitude and latitude coordinates of the crime event (or at least the neighborhood when specific places cannot be located). The availability of this information brings a unique opportunity to assess the magnitude of potential misclassification errors arising from the use of victim location data to estimate area offense rates. The Barcelona Victimization Survey is unique in recording information about the respondents’ neighborhood of residence, neighborhood where each crime happens, and whether each crime is reported to the police. Thus, it makes it possible to investigate the validity and reliability of different area-level estimates of crime in place, and comparing these with police-recorded crime data.
We expect survey-based estimates of non-residential property crimes and violence incidents where they happen to be more valid and reliable measures of crime in place than survey-based area victimization estimates. However, this may not necessarily be the case for residential property crimes which take place in areas where victims live. Moreover, survey-based estimates of crimes reported to the police (whether offense or victim-location based) are expected to be closer to police statistics than any other measure. However, estimates of crimes reported to the police may be affected by the uncertainty arising from the small samples of crimes recorded in small areas (Rosenbaum & Lavrakas, 1995). Previous research has shown that crime in Barcelona is highly concentrated in the “old quarter” (González Murciano & Murrià Sangenís, 2020; Maldonado-Guzmán et al., 2021), which is characterized by very large concentrations of tourists, hotels, restaurants, museums, bars, and clubs, but not necessarily a larger population density (Graells-Garrido et al., 2020; Gutiérrez et al., 2017). As a result, we would expect survey-based estimates of offense locations to show large concentrations of crime in the city center, while this may remain hidden when we analyze survey-based estimates of area victimizations.
Importantly, having multiple measures of crime available for the same areas allows us to examine the extent of other potential problems affecting the accuracy of crime estimates in local areas (Lohr, 2019; Schneider, 1981). For example, whether victims’ non-recall and memory loss contribute to systematic non-response biases in questions about offense locations, and whether victims who suffer a crime in their local areas systematically answer this question more frequently, or more accurately, than victims who suffer crime incidents in other places.
Data and Modeling Strategy
Data Description
We analyze data from six rounds of the Barcelona Victimization Survey (2015–2020) aggregated in 73 neighborhoods. Barcelona is the second largest city in Spain, with a population of 1.6 million residents (3.2 million in the Barcelona Metropolitan Area). Our units of analysis are neighborhoods, with an average population of 22,608 residents (ranging from 686 residents in la Clota neighborhood to 58,642 in la Nova Esquerra de l’Eixample).
The Barcelona Victimization Survey is one of the oldest crime surveys in Europe, and it has recorded data annually since 1984. Its sampling frame is all Barcelona residents aged 16 or more. Citizens aged 16 to 64 complete the questionnaire via a web survey, while those aged 65 or more answer the questionnaire through Computer-Assisted Telephone Interviewing (CATI). The survey is designed to select stratified random samples based on the district of residence, sex, age groups and nationality of respondents, but sample sizes vary considerably across years depending on budget constraints (see Table A2 in the Appendix). In order to mitigate the effect of small sample sizes in neighborhoods, we aggregate data every 2 years (i.e., 2015–2016, 2017–2018, and 2019–2020). 2
Participants are asked questions about their perceptions of security and disorder, confidence in policing and other neighborhood perceptions, as well as screening questions about crime victimization in the last year (e.g., burglary, vehicle crime, robbery, theft, mobile phone theft, violence, threats, sexual violence, fraud). Importantly, and unlike other crime surveys, the Barcelona survey also includes questions designed to uncover the precise location where each incident took place: “Please, write down the street where it happened. We need to know the nearest possible street which crosses the place where it happened, or at least a nearby reference point to locate the neighborhood where it happened. Enter the street and building number, or a nearby place or intersection of streets.” 3 While some respondents did not answer the question about the location of crimes, the proportion of missing addresses is not associated with respondents’ demographic characteristics or area of residence. 4
Every time respondents report they suffered a crime, the questionnaire probes the number of times it happened in the last year. Then, a series of questions are asked about each crime incident, including the time and place of the event, and whether it was reported to the police. The survey imposes a cap of three crimes per crime type before asking follow-up questions about each event. This is not expected to be a major issue since only 1.3% of respondents, or 3.9% of victims, reported suffering more than three crimes in at least one crime category. In this study we aggregate incidents to three types of crimes to avoid geographic areas with no crimes recorded:
We used the survey weights provided by survey administrators, which are computed to adjust for non-response and to match the sample to population proportions based on the district of residence 5 and demographic characteristic of respondents, to calculate the weighted sum of crimes in areas. These weights are calculated to adjust individuals to population proportions so the mean of weights is 1, but these do not adjust the sample to population totals. Thus, the scale of our survey-based estimates of crime will vary substantially from that in reality, but the rank and distribution across areas are expected to be maintained. We return to this point in the Discussion.
We also accessed data about crimes reported to Mossos d’Esquadra, the police force of Catalonia, between 2015 and 2020 through a freedom of information request, enabling direct comparisons of survey estimates with police statistics.
In order to understand the impact of asking about the offense location and crime reporting on crime estimates in place, we define four different ways of measuring a crime depending on whether this is based on the victim residence or offense location, as well as whether the crime was reported to the police or not. These four ways of measuring crime are:
Modeling Approach
We use different strategies to estimate the data quality of our four measures of crime. We use descriptive analyses to compare the average of crime counts recorded in neighborhoods using the four different approaches. We also use police-recorded crimes as a criterion, comparing the geographical distributions and correlations of survey-based crime estimates and police data to study the extent to which estimates of crime obtained from survey data resemble police-recorded crime statistics.
We then exploit the design of the data (i.e., repeated measures of the same crime types based on different approaches) to build a series of statistical models to estimate data quality. We start by estimating the reliability of these measures using the quasi-simplex model (henceforth QSM; Alwin, 2007; Cernat et al., 2021; Heise, 1969; Wiley & Wiley, 1970). This model uses repeated measures of the same concept in order to estimate reliability (Figure A1 in the Appendix). This approach enables the estimation of reliability using only one measure collected at least three times in line with the Classical Test Theory (Lord & Novick, 1968).
The model can be decomposed into two parts. Firstly, a measurement model defines the relationship between the observed variable

The difference between the observed and the latent variable is the residual of this relationship and an estimation of random error,
Here, the latent score at each point in time,
In order to estimate the model, further restrictions are needed, especially in relation to the random error,
In addition to estimating reliability, the data also enables the estimation of validity. We define validity as that proportion of variance that measures the concept of interest and is not affected by random error or by variance specific to one particular way of collecting the data. We label the proportion of variance associated with each way of collecting data as the “method effect,” as it refers to that part of the variance that does not measure the concept of interest but is systematic (i.e., consistent over multiple measurements).
To estimate the validity, method effect, and random error, we use a Multi Item Quasi-Simplex Model (MI-QSM). This combines the longitudinal QSM with a Multitrait Multimethod model (Campbell & Fiske, 1959; Saris & Andrews, 1991)—a model used in psychometrics and survey research to estimate reliability and validity when multiple concepts (or “traits”) are measured using multiple approaches (or “methods”). Here we define as a “method” each of the different ways to estimate crime in place from our survey data and as a “trait” each of the different crime types (Figure A2 in the Appendix).
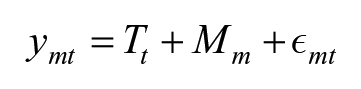
The MI-QSM also has a measurement model and a structural model. This time, we have multiple variables at each point in time, t, for each of the m methods used. These observed variables are explained by two latent variables. The estimate of the concept of interest is defined by
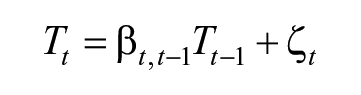
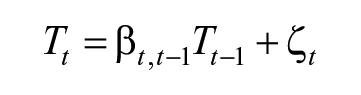
The same autoregressive structural model defined for the QSM is used to enable the change in time of the trait:
We run this model separately for each of the three types of crime: personal property crime, property crime against household or vehicle, and violent crime.
Using this model, we can decompose the variation of each observed variable into three parts. The variance explained by
The QSM and the MI-QSM can be estimated using standard structural equation modeling software. We estimate the models using R 4.0.5 (R Core Team, 2021) and the “blavaan” package (Merkle & Rosseel, 2018) with “Stan” for estimation. For the Bayesian estimation we use eight chains, a burn-in of 50,000 iterations and a sample of 5,000 to calculate the estimates. 6 In order to help with the estimation, and avoid skewed distributions, we add 1 and take the log of the number of crimes. All codes are available from a Github repository (https://github.com/alex-cernat/crime_long_me).
Results
Looking first at the raw bivariate correlations between our four survey-based estimates of crime and police-recorded crime in neighborhoods (Figure 1), we find remarkably high correlations when using the new offense location-based estimates. This ranges from a low of 0.8 for household and vehicle property offenses to almost 0.95 when personal property offenses are considered. Importantly, the correlation is only marginally lower for property offenses when we restrict the focus to the subset of these offenses that are reported to the police. The correlation is noticeably lower when reported incidents of violence are considered, although this does not seem to be a result of uneven reporting rates (on average, 21.9% of violent incidents were reported to the police, compared with 22.5% for personal property offenses and 31% of household/vehicle offenses). By contrast, the correlations are lower when the victim’s residential location is used, with a correlation of around 0.8 for violence and personal property offenses, and under 0.75 for household and vehicle property offenses.
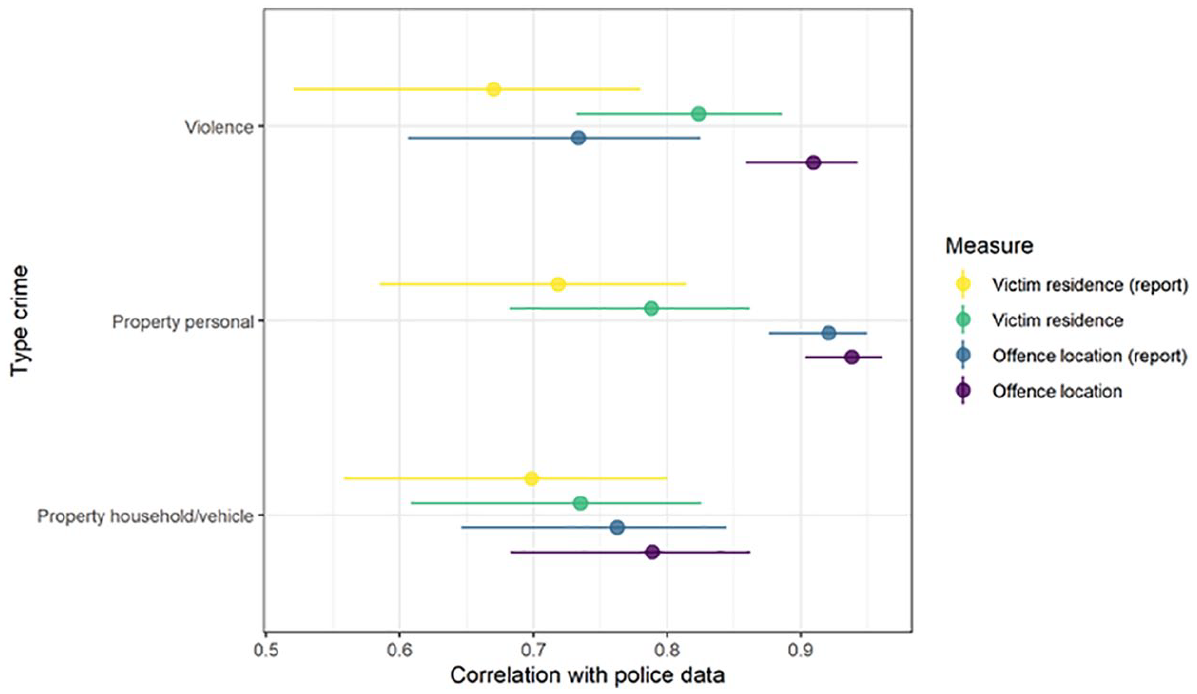
Correlation with the police data by topic and “method” in the data aggregated for 2015 to 2020. Variables were transformed prior by adding 1 and taking the log.
As expected, we observe a much closer correspondence between the estimates when household/vehicle property offenses are considered, which is likely the result of the high proportion of these offenses that occur within the victim’s residential location (70.9% of property household/vehicle offenses happened in the area of residence, compared with 53.9% of violent crimes and 30.7% of personal property offenses).
We also observe that correcting the measurements by restricting them only to those crimes that were reported to the police leads to lower correlations with police data both for the location- and residence-based measures. This runs counter to expectations, with existing research pointing to substantial differences in reporting propensities based on the individual characteristics (Skogan, 1994), severity of the offense (Skogan, 1984) and perceptions of police legitimacy (Tyler & Fagan, 2008), and official crime statistics typically focus on reported crimes. This may be due to the introduction of other types of measurement error in the reporting questions, such as memory effects or social desirability, limiting the utility of attempts to make the two data sources more similar by asking respondents about reporting to the police. But it will also be due to the small sample sizes of crimes reported to the police recorded in the survey, with the average number of crimes recorded in the survey in neighborhoods being much smaller when we restrict the measurement to crimes reported to the police (see Figure A3 in the Appendix). It is important to note, however, that as visualized by the 95% confidence intervals, some of the differences described here, especially those related to household and vehicle property offenses, are not significant, although this may be due to the small number of neighborhoods under study (i.e., our sample is 73 areas).
The close correspondence between the new offense-based estimates and police-recorded crime can be clearly seen when we plot the spatial distribution of crimes on a map (Figure 2). 7 Consistent with routine activities theory (Cohen & Felson, 1979), crime rates are highest in the City Center, with all four survey estimates correctly identifying higher crime rates in the “old quarter.” This is likely to reflect the higher daytime populations in these areas increasing the opportunities for motivated offenders (Malleson & Andresen, 2016), as well as the concentration of the night-time economy around the central business district (Allen et al., 2003). However, the victim-based estimates tend to identify a substantially higher proportion of offenses occurring throughout the rest of the study area, which is not shown in the police data. By contrast, the offense-based estimates more closely resemble police recorded crime data, with relatively fewer offenses occurring in the surrounding areas. Unlike victim-based estimates, location-based estimates appear to be unaffected by the spatial distribution of residential addresses across Barcelona, leading them to be more consistent with police data.
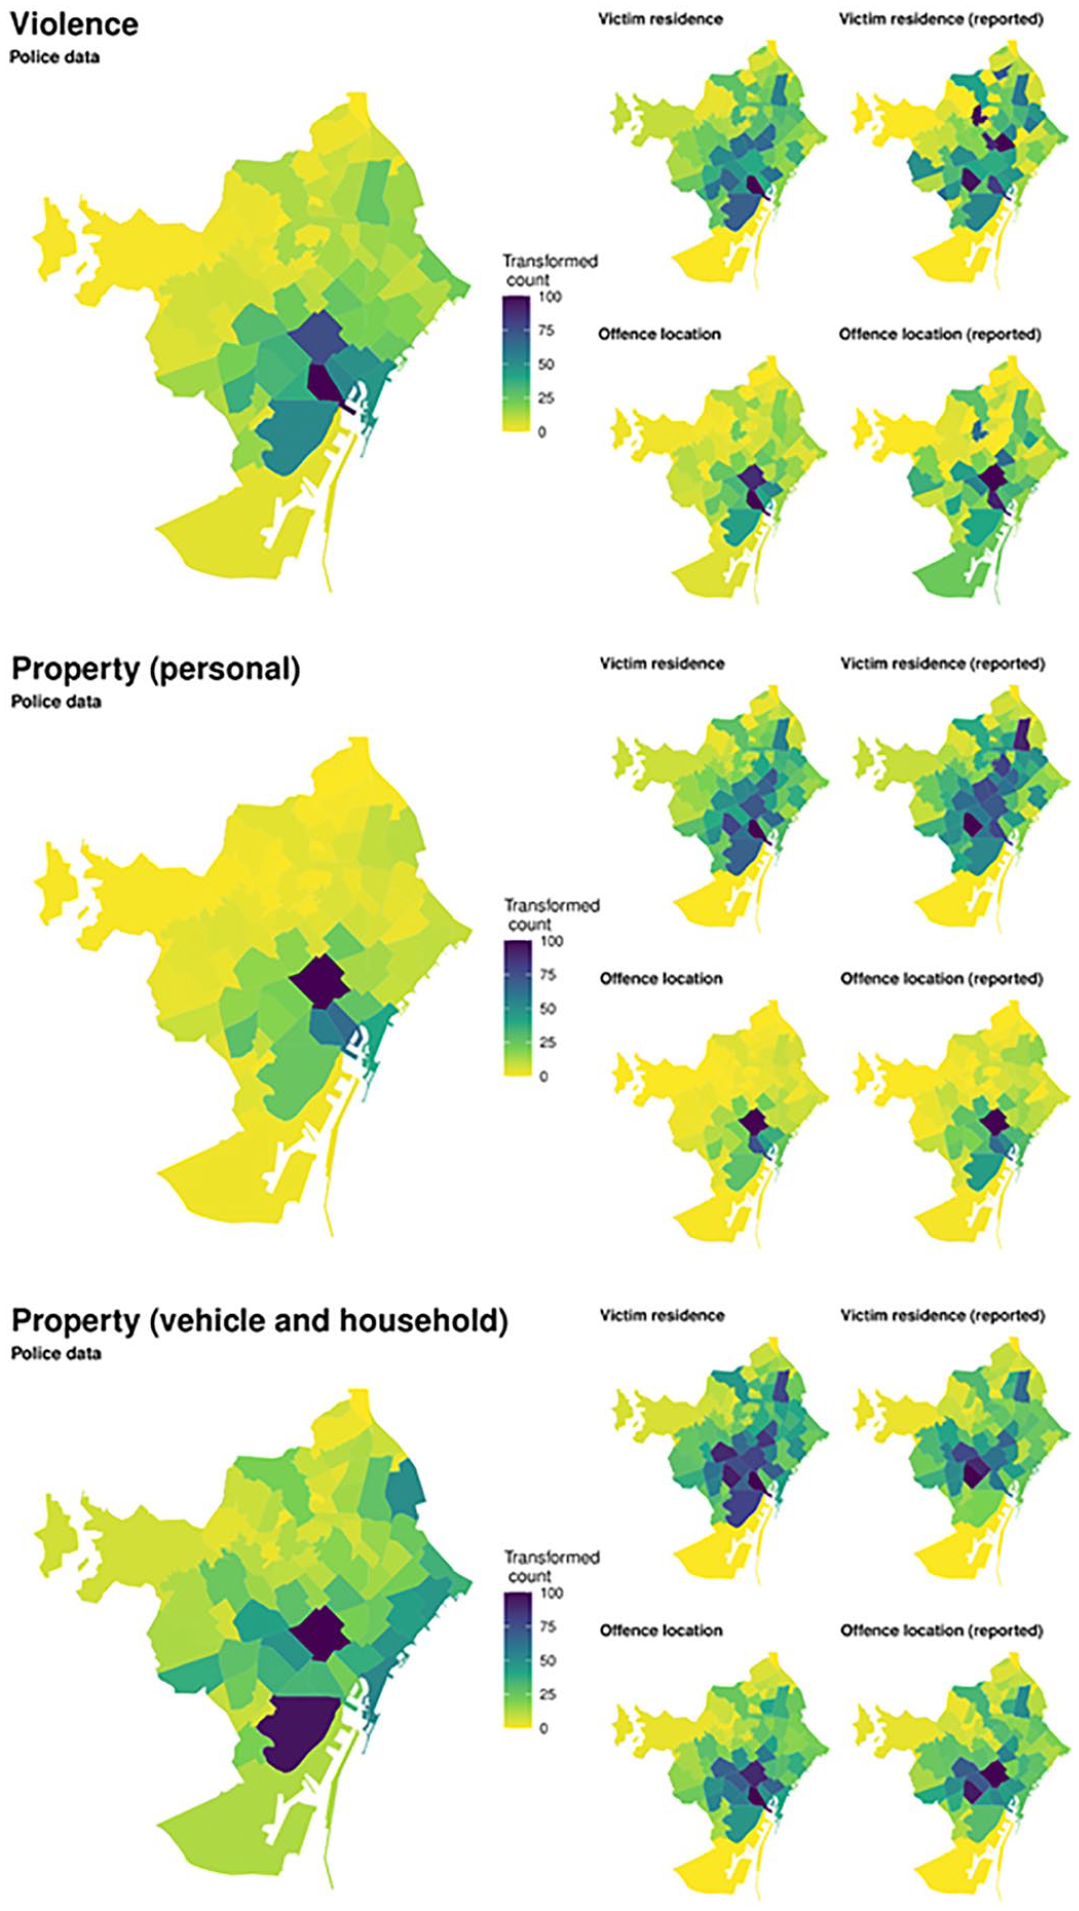
Estimates of crimes in neighborhoods from police and survey data (2015–2020).
For violent crimes and personal property crimes, the two maps based on offense location survey data and police records are highly alike, while survey-based victim residence maps fail to show the “hot spots” of crime in the city center. Contrary to expectations, however, offense location maps visualized from all survey-recorded crimes (reported and not reported) resemble more closely police-recorded crime statistics than maps produced from reported crimes only. This is likely the effect of the small sample of crimes reported to the police in the survey (Figure A3 in the Appendix). Examined visually, we can again see the close correspondence between all four estimates of household and vehicle property crime, although the offense location map still appears to show the closest distribution to police-recorded crimes.
Comparisons with police-recorded crime data suggest potential reductions in area-based misclassification errors if survey respondents are asked to provide details of the location where incidents occurred. To assess whether this has implications for the validity and reliability of our survey estimates, we turn our attention to the results of the longitudinal quasi-simplex models. Figure 3 reports the reliability estimates from the 12 QSM (three topics times four ways to measure them). Here, we find comparatively little evidence of a reliability trade off when asking respondents to locate incidents, with similarly high reliability estimates of around .9 using either victim residential location or offense location estimates. Individuals can consistently identify where offenses took place. Perhaps unsurprisingly, the reliability estimates are somewhat lower when restricting the focus to those offenses that are reported to the police, particularly when violent offenses are considered (with fewer than one in four violent offenses reported to the police).
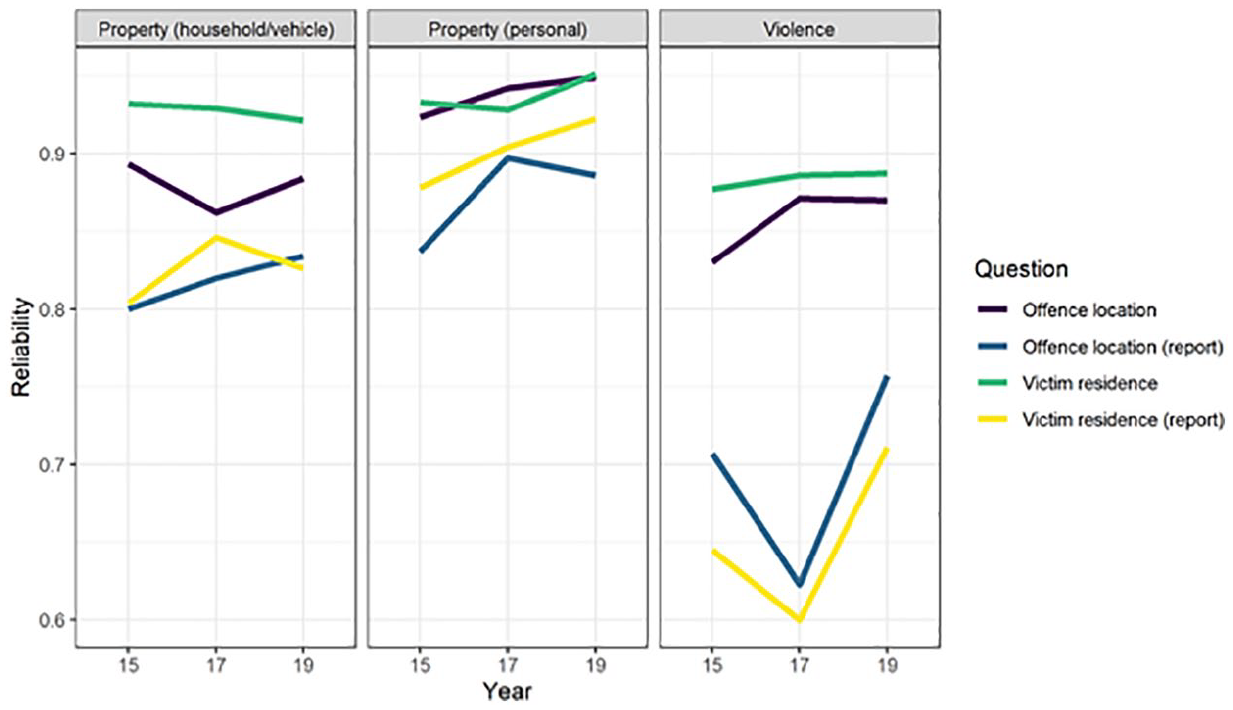
Reliability estimates by topic, type of measure, and wave based on the quasi-simplex model.
We also show the variance decomposition based on the three MI-QSM (Figure 4). We define “validity” as the proportion of variance due to the trait, “lack of validity” as the proportion of variance due to the method (or the way of asking the question), and “random error” as the unexplained variance in the observed scores. Results from the MI-QSM models (Figure 3, and Tables A3 and A4 in the Appendix) indicate that offense location measures have a higher overall quality (i.e., trait variance) compared to victim measures. This seems to be mainly due to the method effect which, in the cases of household and vehicle property crime and violence, is higher for victim residence measures than offense location measures. Once again, in the case of personal property crime, there is little difference between using offense location and victim residence measures. Importantly, according to these results, using the survey-based measures restricted to crimes reported to the police appears to lead to a moderate improvement in data quality, especially due to an overall decrease in the method effect. Thus, based on these results, the estimates of offense location-based crimes reported to the police appear to be the best way (in terms of data validity) to measure the three types of crime (see also Table A3 in the Appendix). We also find that the proportion of variance associated with the method is stable across the three time periods studied, pointing to the robustness of our findings.
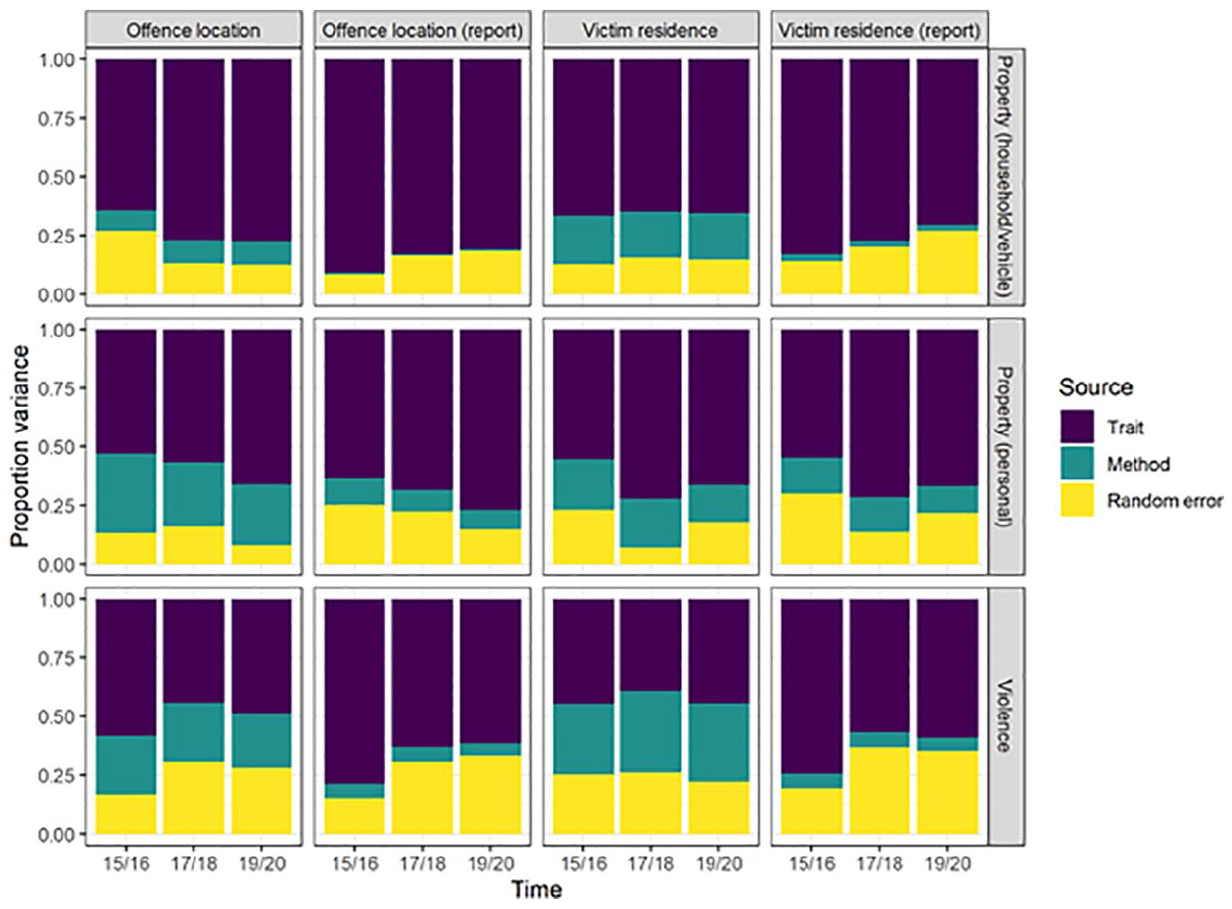
Variance decomposition by trait, method, and random error for the three topics and three ways of measuring crime.
Discussion and Conclusions
Crime surveys are increasingly used for research and policy making as they can bypass some of the limitations of police records. One example of this move toward the use of crime surveys is the increase in research applying small area estimation to crime counts in geographic areas (Buelens & Benschop, 2009; Buil-Gil, Medina et al., 2021; D’Alò et al., 2012; Fay & Diallo, 2012). In this paper, we discuss two important aspects of survey-based estimates of crime that can have substantial impacts on results: whether estimates refer to the offense location or victim residence, and whether these reflect all crimes or those reported to the police.
We argue that a more nuanced understanding of the measures of crime included in sample surveys is needed, and the assumption that the respondents’ area of residence equates the place where crimes happen may be incorrect. From previous research we know that large proportions of crimes take place outside the victims’ area of residence (González Murciano & Murrià Sangenís, 2020; Hodgkinsoi & Tilley, 2007) and tend to concentrate in certain places (Andresen & Linning, 2012; Weisburd, 2015). Thus, the assumption that estimates of “places where victims live” can be interpreted as “crimes in place” is dubious. Fear of crime researchers realized years ago that analyzing the geographic distribution of emotions about crime based on areas where survey respondents live vary substantially from the areas where events of fear actually concentrate, thus suggesting the use of place-based methods to capture fear of crime where it happens (Solymosi et al., 2015). A similar movement is needed in research using survey data to estimate crime in place. In this research we investigate how data quality can be influenced when the crime location and police reporting are measured in crime surveys.
All four survey-based measures correctly identified the highest levels of crime in the city center and “old quarter.” Consistent with routine activities theory (Cohen & Felson, 1979), crime is concentrated in those locations where there is the highest number of people and the greatest opportunities for offending. But the descriptive analysis has highlighted that survey area-level crime location estimates have a substantially higher correlation with police records than victim location estimates, and measures of offense location obtained from the survey and police records show highly similar geographical distributions. While offense location measures are remarkably similar to police-recorded crime data in most areas, victim residence measures overestimate crime rates in some residential areas outside the city center, since many victims live in these residential neighborhoods but they suffer crimes when they travel to more central areas. Offense location measures are thus preferred to enable estimates of crime in place that do not underestimate crime in high-crime-density areas nor overestimate crime in neighborhoods with a large residential population and a low workday population. Importantly, the QSM models indicate that this does not come at the expense of data quality, with similar reliability coefficients across the measures of offense location and victim residence for the three crime types. Measures of reported crime do, however, show slightly lower reliability coefficients in the case of property crime, and substantially lower reliability for violent crime. In terms of reliability, there appears to be relatively little trade off when asking respondents to locate crime, while the impact on reliability may be larger when asking respondents whether they reported it to the police. Existing research has identified a range of factors that impact on the willingness of individuals to report crimes to the police, including prior victimization (Skogan, 1984), offense severity (Skogan, 1977), fear of reprisal, and assessments of a lack of police legitimacy (Tyler & Fagan, 2008). These appear to be unevenly distributed across neighborhoods in Barcelona, contributing to the modest divergence from police recorded crime figures that we observe when we take reporting practice into account.
Yet whilst the reported crime estimates exhibit lower reliability, the MI-QSM results suggest that overall validity is actually highest amongst those offense location measures restricted to crimes reported to the police. In general, taking into account which crimes were reported to the police seems to decrease the systematic errors found in the original survey measures. Statistically, this might be explained by the “stabilizing” effect of restricting crime measures to offenses reported to the police, reducing the magnitude of the absolute differences between the volumes of crimes detected across different measures of crime. Whilst the unrestricted estimates of crime using offense location and victim residence are generally stable in time (as seen in QSM model results), there is less stability across measures. For example, victim residence estimates of crime are substantially larger than offense location measures, by contrast, measures of crimes reported to the police (both related to offense location and victim residence) are substantially lower and more similar to one another. However, unrestricted measures of offense location may still be preferable because they capture larger volumes of crimes experienced by victims and are more reliable.
An important distinction between victimization surveys and police recorded crimes is that the latter can include reports from witnesses or secondary victims. This might be another explanation why limiting survey crime statistics to police reported offenses does not necessarily improve correlations between the two data sources.
The analysis also identifies which types of crime may be most difficult to accurately estimate. Both the QSM and MI-QSM results highlight that violent crimes have the lowest overall data quality. This may be linked to the relatively smaller number of violent crimes recorded in our survey, though it may also relate to the inclusion of “threat of violence” as a form of crime, which may be more prone to subjective interpretations than other crimes analyzed. For example, the MI-QSM shows that the survey-based measures of violent crime used in previous research (i.e., based on victim residence and without correction for police reporting) have a quality indicator of around 0.5. This implies that around 50% of the observed variance is due to either random or systematic variance that is not related to the concept of interest. Whilst this proportion is smaller when using measures of offense location and measures restricted to crimes reported to the police, it is still substantial and underlines the difficulty of individuals correctly classifying incidents of interpersonal violence (Fraga, 2016). This is slightly less problematic for property crime, but in all three cases using offense location measures instead of the victim residence appears to contribute to an improvement in reliability, validity and resemblance to police records.
However, this work is not free of limitations. While we have studied three categories of crime defined by distinct spatial distribution patterns, these are likely to mask heterogeneity between specific crime types, in terms of their distribution in communities (Andresen & Linning, 2012; Quick et al., 2018) and the reliability of offense-based and victim-based estimates of crime in place. For instance, it is likely that the measurement quality of victim residence measures of residential burglary will improve substantially compared with the larger category of household/vehicle property crime used here. In this paper, we aggregated crimes in larger categories to avoid an excess of zeros at the level of small areas. But future work should use alternative data sources to investigate the measurement properties of more detailed crime categories, as well as at smaller and larger spatial scales. Additionally, the MI-QSM makes an assumption about the stability of the traits of interest: a linear lag 1 autoregressive change in time. As a sensitivity check, we also pool all 6 years of data together and estimate a simpler Multitrait Multimethod model (Campbell & Fiske, 1959; Saris & Andrews, 1991). We follow a similar a procedure to decompose variation as in MI-QSM. The results (Figure A4 in the Appendix) are similar to those reported, giving us greater confidence in our results.
While one of the limitations of survey data is that it may record very few crimes in certain areas (even zero in certain cases), this study shows that this is not a major problem for the reliability and validity of estimates of crime computed from survey data. Moreover, this is somehow expected given that some neighborhoods in Barcelona have a very small population size, and even the police record very few crimes in them. Nevertheless, this is something that studies developing methods to estimate crime prevalence from survey data will need to address in the future.
Overall, results indicate that there are potential gains to be obtained from using measures of offense location instead of victim residence, with apparently minimal impact on the reliability and validity of estimates. We do not find evidence of bias (e.g., from memory loss and non-recall) when asking victims about the place where crimes happened. Or at least we do not find that these potential issues are more problematic in measures of crime location than victim residence measures. This is observed not only when analyzing crimes that tend to happen outside the area of residence (property personal and violence), but also when analyzing property household and vehicle crimes that happen in victims’ area of residence to a larger extent.
As a result, larger national crime surveys, such as the Crime Survey for England and Wales and the US National Crime Victimization Survey should include measures of offense location in future waves. This will allow not only researchers but also policy makers to develop new techniques to estimate crime in place from survey data, thus potentially overcoming some of the sources of error that we know affect police-recorded crime statistics.
Future research should further explore this topic, investigating: (a) Do reliability and validity measure vary when using smaller or larger spatial scales? (b) Do these vary across rural and urban areas? (c) What is the effect of weights in this? And, can weights be used to mitigate some of the data quality issues described here? (d) What would happen if sample sizes were increased?
Footnotes
Appendix
Average Quality Estimates Based on MI-QSM.
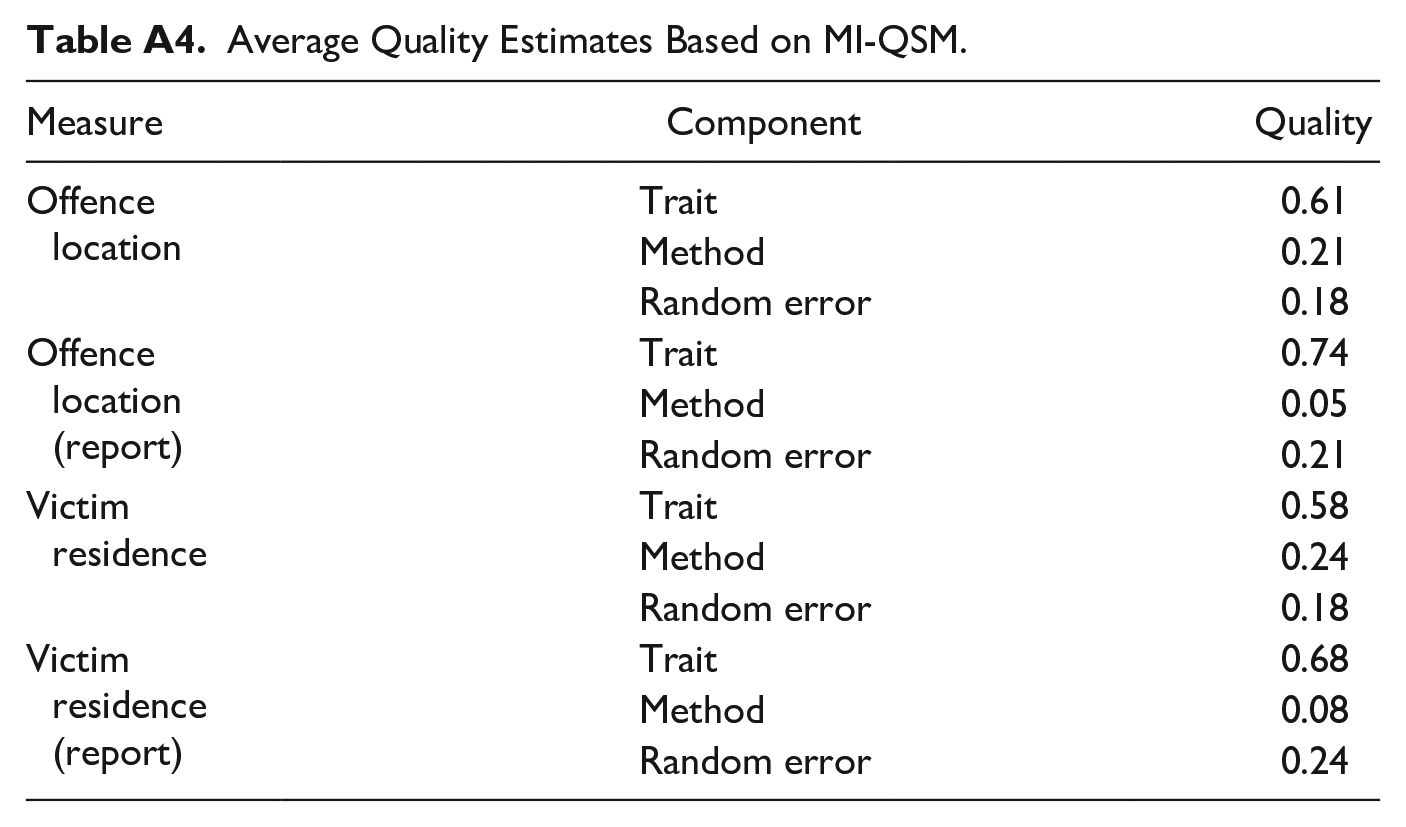
| Measure | Component | Quality |
|---|---|---|
| Offence location | Trait | 0.61 |
| Method | 0.21 | |
| Random error | 0.18 | |
| Offence location (report) | Trait | 0.74 |
| Method | 0.05 | |
| Random error | 0.21 | |
| Victim residence | Trait | 0.58 |
| Method | 0.24 | |
| Random error | 0.18 | |
| Victim residence (report) | Trait | 0.68 |
| Method | 0.08 | |
| Random error | 0.24 |
Declaration of Conflicting Interests
The author(s) declared no potential conflicts of interest with respect to the research, authorship, and/or publication of this article.
Funding
The author(s) disclosed receipt of the following financial support for the research, authorship, and/or publication of this article: This work is supported by the Secondary Data Analysis Initiative of the Economic and Social Research Council (Grant Ref: ES/T015667/1) and the R&D Funding Programme of the Spanish State Research Agency (Project Ref: PID2020-114012GB-100; Funding Ref: AEI/10.13039/501100011033).