
Abstract
Following the EU Victim Directive, Dutch police officers are obliged to assess a victim’s vulnerability to repeat victimization. This study explored the utility of unstructured police information for the prediction of repeat victimization, as well as its incremental value over and above structured police information. Police records over a period of 6 years were retrieved for a sample of 116,680 victims. Unstructured information was transformed into numeric features using count-vector and TF/IDF methods. Classification models were built using decision tree and random forest models. AUC values indicate that a combination of structured and unstructured police information could be used to correctly classify a majority of repeat and non-repeat victims.
In the Netherlands, almost 2 million individuals annually report being a victim of one or more types of crimes such as violent crimes (e.g., threat, assault, sexual crimes), property crimes (e.g., burglary, theft, robbery), or vandalism (Statistics Netherlands, 2020). Criminal victimization can have extensive impact on victims’ lives (Jackson & Gouseti, 2016; Lefebvre et al., 2021). From all individuals that do experience victimization, a small proportion of individuals experience repeat victimization, thereby accounting for a large percentage of the total number of victimization incidents reported (Gabor & Mata, 2004; SooHyun et al., 2017). Victims of violent crimes experience negative effects of victimization for longer periods of time compared to victims of other crimes (Jackson & Gouseti, 2016), this study, therefore, focused on repeat victimization of violent crimes.
In 2012, the EU Victim Directive was accepted by the European Parliament, thereby establishing minimum standards on the rights, support, and protection of victims of crime (European Parliament, 2012). Article 22 of this directive describes that Member States shall ensure a timely and individual assessment of victims to identify vulnerability, specific protection needs and to discuss special protection measures. Police officers play a crucial role in the support and protection of victims as they frequently encounter victims of crime. As a result of the Victim Directive, and more specifically article 22, Dutch police developed an individual assessment procedure for all victims that report a crime to the police. As part of this procedure, Dutch police officers are expected to review a victim’s police contact history and discuss a victim’s vulnerability to repeat victimization. Police officers, however, have limited time and reviewing a victim’s police contact history can be a time-consuming and laborious process. To support police officers in the individual assessment of victims, Raaijmakers et al. (2020) developed a risk assessment instrument that estimates the risk of repeat victimization for victims that report a crime to the police. This instrument, called ProVict, displays whether a victim is classified as high- or low-risk for repeat victimization and it summarizes a victim’s police contact history that contributed to the classification. The ProVict score may guide police officers in their assessment of a victim’s vulnerability to repeat victimization.
ProVict is based on structured information regarding victims’ police contact history as retrieved from the Dutch police database, as well as on victims’ age and gender. The risk score is based on the number of prior police contacts and the types of crimes the victim has previously been involved in. Although the validation study demonstrated that the predictive validity of ProVict was acceptable (Raaijmakers et al., 2020), findings suggest that there is still considerable room for improvement in the prediction of repeat victimization of violent crimes. This improvement could possibly be realized by not only using structured police information, but also using unstructured police information (e.g., verbatim reports that contain police officers’ transcription of interviews with victims, witnesses, and suspects, or their own observations) that is included in the Dutch police database. This unstructured police information may include valuable cues regarding individuals’ vulnerability for repeat victimization. The present study aimed to investigate (1) the predictive validity of unstructured police information in the prediction of victim’s risk for repeat victimization of violent crimes and (2) the incremental validity of unstructured police information over and above structured police information (ProVict).
Risk Assessment in the Police Context
Over the last decades, specialized instruments to assist in decisions about risk assessment are increasingly being used by professionals in criminal justice systems (Storey et al., 2011). Different types of risk assessments can be distinguished: unstructured professional judgments, actuarial tools, and structured professional judgments (SPJ). Whereas unstructured professional judgments rely on the professional’s clinical discretion, qualification, and experience regarding risk assessment, actuarial tools depend on characteristics that have been identified by statistical methods as predictors for a given outcome. SPJ approaches combine the actuarial approach with a clinical judgment approach (Kropp, 2004). For a long time, risk assessments have relied mainly on unstructured professional judgments. Several studies, however, demonstrated that risk assessments based on unstructured professional judgments had less predictive accuracy than actuarial tools and SPJ approaches (Petherick et al., 2021; Taxman et al., 2020). As a result, the focus in research and practice has shifted away from relying only on unstructured professional judgments toward actuarial tools and SPJ approaches. Examples of SPJ approaches that have been developed to classify high-risk victims by police officers are the Brief Spousal Assault Form for the Evaluation of Risk (B-SAFER; Kropp et al., 2005) and the Domestic Abuse, Stalking, and Honor Based Violence form (DASH; CAADA, 2012). Some studies suggest that SPJ approaches and actuarial tools achieve similar accuracy (Hanson et al., 2007), however van der Put et al. (2019) demonstrated that actuarial tools outperformed SPJ approaches when predicting domestic violence.
An example of an actuarial tool is the Ontario Domestic Assault Risk Assessment (ODARA; Hilton et al., 2004). It was developed for police officers to assess the risk of domestic violence recidivism. Like the ODARA, other actuarial instruments often focus on specific outcomes such as domestic violence (Messing & Thaller, 2013; Svalin & Levander, 2020; van der Put et al., 2019) or do not directly predict repeat victimization, as they focus on the offender. The European Victim Directive requires an individual assessment for all victims of crime, Raaijmakers et al. (2020), therefore, developed an actuarial risk assessment tool that directly focuses on victims and their risk for repeat victimization of violent crimes. This instrument, called ProVict, is a collection of algorithms that calculate the risk of repeat victimization through an automatic procedure. To calculate a risk score, ProVict uses structured information from the police database pertaining to a victim’s police contact history. Structured information is often classified as quantitative data: it fits a pre-defined data structure and is highly organized. In addition to structured information, the police database contains unstructured information in the form of police officers’ notes, transcripts of interviews with offenders or witnesses, and victims’ statements. Unstructured data, in general, consist of free-text forms and are often categorized as qualitative data, with no pre-defined structure or format.
Over 90% of all information available in official police records consists of unstructured data (Poelmans et al., 2010). Unstructured data in the form of written texts are considered to be the richest source of information for crime analysis. Extracting and collecting meaningful information from unstructured information is challenging as the process is complex and laborious when performed manually (Grimmer & Stewart, 2013). To solve this problem, text mining has been identified as a promising approach for crime analysis (Hassani et al., 2016). Text mining approaches automatically extract relevant information from unstructured information (Antons et al., 2020). To date, however, relatively few text mining approaches that use police information have been developed (Haleem et al., 2019). Examples of text mining approaches that have been applied to unstructured police information are attempts to identify domestic violence (Poelmans et al., 2010), potential jihadists (Elzinga et al., 2010), mentions of mental health disorders (Haleem et al., 2019; Karystianis et al., 2018), and abuse types conducted by offenders and injuries sustained by victims (Karystianis et al., 2019). These studies suggest that text mining techniques can be used to extract information from unstructured police information, which may subsequently be used for the prediction of victims’ risk of repeat victimization.
Repeat victimization has theoretically been explained by individual risk factors such as biological aspects (e.g., gender, physical vulnerability), risky lifestyles, (e.g., staying out late drinking), and occupation (e.g., working nightshifts) (Nagin & Paternoster, 2000). Furthermore, previous victimization experiences may lead to psychological distress, risky lifestyles, and substance use, which may increase the risk of repeat victimization (Gong, Kamboj, et al., 2019; López-Martínez et al., 2018; Rancher et al., 2019). Previous studies employing a text mining approach to police data identified individuals or incidents of interest by using custom-made dictionaries containing words related to these risk factors (Elzinga et al., 2010; Haleem et al., 2019; Karystianis et al., 2018, 2019, 2020; Poelmans et al., 2010). To our knowledge, no studies have used unstructured police information to assess a victim’s risk of repeat victimization of violent crimes in general. As the group of repeat victims is highly heterogenous (Obsuth et al., 2018), we employed an exploratory, data-driven, approach, meaning that we did not develop an a priori dictionary, but let the models reveal which words were related to repeat victimization.
Combining Structured and Unstructured Data for Risk Assessment
Research has demonstrated the incremental value of unstructured information over structured information in the prediction of a wide-range of topics. Combining unstructured and structured information improved the prediction of child abuse (Amrit et al., 2017), medication administration errors (Härkänen et al., 2020), suicide attempts (Adamou et al., 2018), use of health care services (Hatef et al., 2021), coronary artery disease (Jonnagaddala et al., 2015), and drug treatment outcomes (Laar et al., 2020). With regard to risk assessment of repeat victimization based on official police records, to the best of our knowledge, the incremental value of unstructured police information over structured police information is not yet investigated. It is argued that structured and unstructured information both contain unique information (Verma & Maiti, 2018). We, therefore, expected that unstructured police information provides incremental validity over and above structured police information in the prediction of repeat victimization.
Present Study
We proceeded in three steps. First, we investigated the validity of unstructured police information for predicting repeat victimization. Second, we assessed the incremental validity of risk scores based on unstructured police information over and above risk scores based solely on structured police information (ProVict). Third, we assessed the predictive accuracy (i.e., sensitivity and specificity) of risk scores for repeat victimization based on both unstructured and structured police information.
Method
Sample and Design
Data were retrieved from the registration system used by the Dutch police. A random sample of individuals (N = 150,000) was drawn from all individuals registered by the Dutch police as a victim between July 1st, 2016 and June 30th, 2017. The last victimization incident in this period will be referred to as the index incident. Information on all police contacts across the 4 years prior to the index incident, as well as information on violent victimization incidents across the 2 years after the index incident was collected. Information on the 4 years prior to the index incident was used to predict victimization in the 2 years after the index incident. Individuals that had died within 2 years after the index incident, whose date of birth or gender was unknown were removed from the data, as this information is needed for the ProVict predictors. Individuals who had no police contacts in the 4 years prior to the index incident were also removed from the data as they had no unstructured police information. The anonymized dataset for analysis eventually contained 116,680 individuals. Victims were aged between 0 and 100 years (M = 37.1, SD = 14.3), 46% was female and 54% was male. The total dataset was randomly split into a training set (n = 58,461) and a test set (n = 58,219). Models were developed on the training set and validated on the test set.
Measures
Repeat victimization
We distinguished two types of violent crimes: severe and less severe violent crimes. According to the definition used by the Dutch police, severe violent crimes include crimes such as sexual assault and human trafficking. Victims of these severe violent crimes are believed to have an elevated risk of repeat victimization, secondary victimization, intimidation, and retaliation. We also focused on less severe violent crimes. Examples of less severe violent crimes are threat and violent theft. Both outcome variables were operationalized as dichotomous variables indicating whether or not a victim had experienced victimization of a severe and less severe violent crime, respectively, within 2 years after the index incident.
Textual reports
Textual reports that were created across 4 years prior to the index incident were retrieved from the police system. These textual reports included, for example, investigator notes, transcripts of interviews with offenders or witnesses, and victims’ statements. When individuals who come into contact with the police do not speak Dutch, an interpreter is provided. Textual reports are, therefore, always in Dutch. Per victim, all textual reports were concatenated. In other words, for each victim all texts were added together, resulting in one overarching document per victim. To improve the efficiency of this process, stop words (commonly occurring terms that are uninformative) were removed from these documents.
Next, textual data in the overarching documents were transformed into numeric features to obtain predictor variables. For this purpose, two data processing strategies were applied: count-vector and TF/IDF (term frequency/inverse document frequency). The count-vector procedure replaced a text with a vector (list) of integer counts. Across victims, the vector elements represented the same words. Each element of the vector represented a word in the text and the number of times that word occurred in the text (term frequency). In the TF/IDF procedure, which is related to the count-vector procedure, the term frequencies were weighted by the inverse document frequency. This is a measure indicating how common a word was across documents, or across victims as each victim had one overarching document. Frequently occurring words across all victims thus received lower weights than less frequently words across all victims, as frequently occurring words are not necessarily the most relevant words. When a word appears many times in one document (e.g., one victim), while not appearing many times in other documents (victims), it is arguably more relevant for that specific victim than words that appear many times across all victims.
To restrict the length of the vector, in both procedures, only the 10,000 most commonly occurring words were vectorized. To improve efficiency of the process, the 2,000 most distinguishing words were selected as model building features. These words were selected using a chi-square selection algorithm.
Analyses
Model building
For each outcome (severe and less severe violent crimes), the objective was to use unstructured information to build a classification model which optimally allocates victims to the correct categories (high- and low-risk) based on the variables yielded from their overarching documents. Classification models can be built using several methods of analysis. Previous studies argued to replace traditional regression models with decision tree or random forest models (Berk, 2021; Berk & Sorenson, 2020; Lussier et al., 2019; Ngo et al., 2015, 2018). In this study, two analytical procedures were considered: decision tree and random forest. It is argued that decision tree and random forest models are suitable models for analyzing rare events, such as repeat victimization of severe and less severe violent crimes, since these models have no assumptions for distributions (Hegelich, 2016).
Decision tree
A decision tree model iteratively splits a dataset into a sequence of nested smaller groups based on the best distinguishing feature in relation to the target variable (i.e., repeat victimization). The first split into two groups starts with the strongest distinguishing feature, the next split selects the best distinguishing feature for each separate group (branch), and so on. This results in a reverse tree-like model representation. The main advantage of a decision tree model is its easy interpretation. Disadvantages include a lack of robustness, that is, small changes in the data may cause significant changes in the model and hence its predictions. Moreover, decision tree models may be prone to overfitting (Hegelich, 2016), implying that an excellent model fit to the training set will not generalize to the test set. In this study, a decision tree with a maximum depth of 10 nodes was developed.
Random forest
A random forest is an ensemble of decision trees. Sub-trees were constructed using a random subset of the records in the training set, as well as a random subset of the features. We used random forest with 25 trees with a maximum depth of 10 nodes. After training these sub-trees, a final risk score was calculated by averaging the predictions of the 25 individual decision trees.
Predictive validity unstructured data models
Both decision tree and random forest models resulted in a risk score (ranging from 0 to 1) that reflects the chance of repeat victimization for each victim. This risk score was based on the textual reports (unstructured information) that were transformed into numeric features using count-vector and TF/IDF procedures. In sum, four models for each outcome variable were estimated using two data processing strategies (count-vector and TF/IDF) combined with two classification procedures (decision tree and random forest). These models were evaluated with regard to the Area Under the Curve (AUC), obtained by Receiver Operator Characteristics (ROC) analysis. In the present context, AUC values reflect the probability that a randomly selected repeat victim has a higher risk score than a randomly selected non-repeat victim. The AUC value is one of the most well-known and widely used indicators to assess an model’s predictive validity (Messing & Thaller, 2013; Rice & Harris, 2005). According to rules of thumb proposed by Hosmer and Lemeshow (2000), AUC values between .60 and .70, between .70 and .80, and between .80 and .90, reflect moderate, acceptable, and excellent accuracy, respectively. According to Rice and Harris (2005), AUC values of .56, .64, and .71 correspond with small, medium, and large effect sizes, respectively. Based on the AUC, a final model based on unstructured information for severe violent crimes and a final model for less severe violent crimes was selected for subsequent analysis.
ProVict
To investigate the incremental validity of unstructured information over structured information (ProVict) in the prediction of repeat victimization, ProVict models for severe and less severe violent crimes were applied to the victims in this study. For this purpose, information regarding all predictors in ProVict was collected across the 4 years prior to the index incident. For a detailed description of ProVict, including predictors and associated weights, see Raaijmakers et al. (2020). By applying the ProVict algorithms for severe and less severe violent crimes, two risk scores that reflect the chance of repeat victimization of a severe and less severe violent crime, respectively, were calculated for the victims in this study.
Incremental validity
The incremental validity of unstructured information over structured police information in predicting repeat victimization was assessed with hierarchical logistic regression analyses. ProVict risk scores (based on structured information) and risk scores based on unstructured information were entered successively into the logistic regression model. Likelihood-ratio tests were performed to compare the successive models. Given our large dataset (test set: n = 58,219), we used a conservative approach and considered results significant when p < .001.
Model combination methods and evaluation
After examining the incremental validity of unstructured information over structured information, risk scores based on structured (ProVict), and unstructured information (final model) were combined to create a combination risk score. Following previous studies (Lehmann et al., 2013; Seto, 2005), several combination methods were used. These methods can be divided into two categories: intuitively appealing rules and statistical optimization methods. We applied three intuitively appealing rules: believe-the-negative, believe-the-positive, and averaging. The believe-the-negative approach implied that the lowest risk score was leading, whereas the believe-the-positive approach implied that the highest risk score was leading. The averaging approach implied that a new risk score was obtained by calculating the average of both risk scores. Two statistical optimization methods were used to combine the risk scores based on structured and unstructured information. First, both risk scores were entered in a logistic regression model to obtain the predicted probabilities based on both structured and unstructured information. Second, to account for the possibility that the effect of one risk score on repeat victimization depended on the other risk score, both risk scores and their interaction term were entered in a second logistic regression model in order to obtain these predicted probabilities.
The predictive validity of different combination methods was evaluated on the basis of their respective AUC values. Subsequently, the following predictive validity indicators were calculated for the best combination model: sensitivity, specificity, positive predictive value (PPV), and negative predictive value (NPV). Discrimination indicators such as sensitivity and specificity reflect to what extent high- versus low-risk groups can be separated. Sensitivity refers to the proportion of repeat victims classified as high-risk, whereas specificity refers to the proportion of non-repeat victims classified as low-risk. In other words, sensitivity reflects the percentage of true-positives, whereas specificity reflects the percentage of true-negatives the calibration indicators such as the PPV and the NPV reflect to what extent the expected classification resemble the observed classification. The PPV indicates the proportion of high-risk victims who experience repeat victimization and the NPV indicates the proportion of low-risk victims who do not experience repeat victimization (Singh, 2013).
The predictive validity indicators mentioned above rely on the chosen cut-off threshold for distinguishing high-risk victims from low-risk victims. To investigate the consequences of using different thresholds, the test set was divided into 10 equal groups (deciles) based on individuals’ risk scores. For each decile, a risk score that represents the cut-off threshold was calculated. Individuals with risk scores lower than this cut-off threshold were considered to be low-risk and individuals with risk scores higher than or equal to the cut-off threshold were considered to be high-risk. Sensitivity, specificity, PPV, and NPV were calculated for these 10 cut-off thresholds.
The PPV and NPV rely heavily on the distribution of the outcome variable, in this study, repeat victimization. Helmus and Babchishin (2017), therefore, argued that indicators such as the PPV and NPV do not adequately reflect a model’s predictive accuracy, as they provide more information on the base rate of the outcome variable than model itself. These indicators do, however, provide relevant insights on the practical implications of different cut-off thresholds for distinguishing high- from low-risk victims.
Results
Descriptive Results
Repeat victimization of a severe violent crime within 2 years after the index incident was experienced by 0.9% of the victims. Repeat Victimization of a less severe violent crime within 2 year after the index incident was experienced by 2.0% of the victims.
Evaluation Unstructured Data Models
Table 1 shows the AUC values for all models based on unstructured information for both severe and less severe violent crimes. AUC values ranged from .74 to .80 for severe violent crimes and from .70 to .76. For less severe violent crimes, indicating acceptable to excellent discrimination and medium to large effect sizes for all models. The count-vector random forest (CV-RF) models produced the highest AUC values for both outcome variables, although the AUC values differed slightly. Hence, the count-vector random forest model resulted in the best model for risk assessment of repeat victimization based on unstructured data. Therefore, this model was selected for subsequent analyses. From the 2,000 most distinguishing words that were selected as model building features, the CV-RF model for severe violent crimes resulted in 1,111 significant features (i.e., words). The CV-RF model for less severe violent crimes resulted in 1,801 significant words. As we employed a data-driven approach, not all words were clearly interpretable in relation to an elevated risk of repeat victimization. However, some words did reflect aspects of known risk factors for repeat victimization described in the literature. For instance, for both severe violent and less severe violent crimes, several words were related to substance use (e.g., alcohol, beer, addicted, weed), psychological distress (anxious, to cry, stress, angry, aggressive), or family connections (daughter, relation, child, (ex)boyfriend, spouse).
AUC Values Models Based on Unstructured Information.
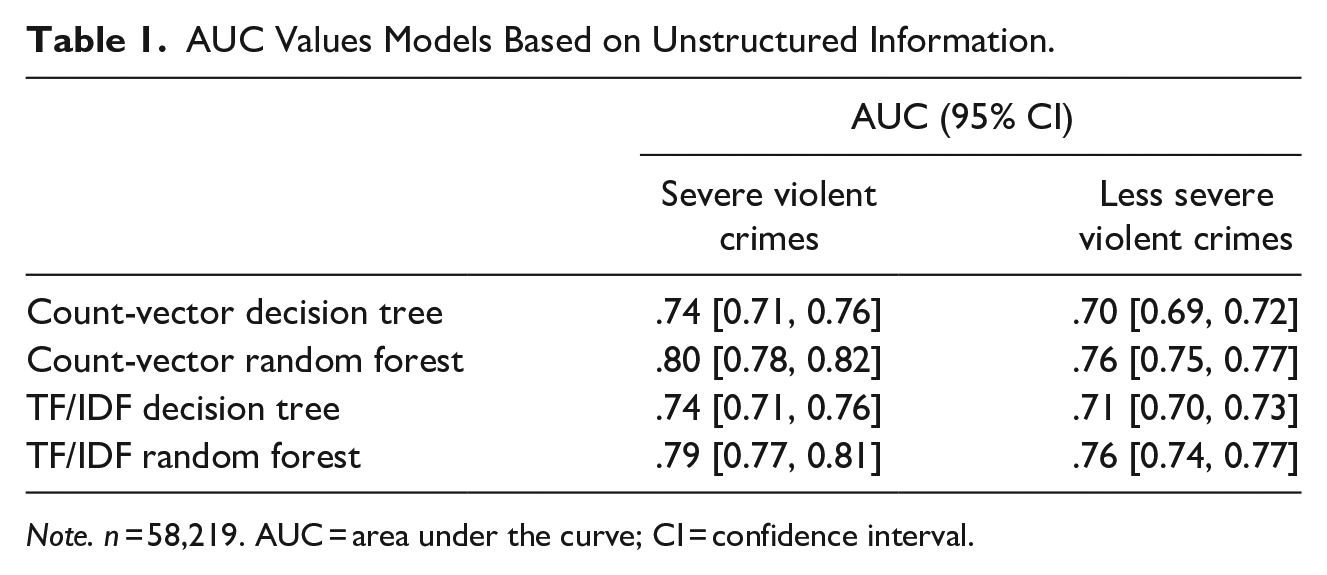
Note. n = 58,219. AUC = area under the curve; CI = confidence interval.
Incremental Validity
Correlations between CV-RF risk scores and ProVict risk scores indicated a weak and moderate association, respectively, for severe violent crimes (r[58,217] = .30, p < .001) and less severe violent crimes (r[58,217] = .42, p < .001). Table 2 shows the results of models with only ProVict risk scores as predictor (Model 1) and models with both ProVict and CV-RF risk scores as predictors (Model 2). For both severe and less severe violent crimes, ProVict and CV-RF scores were significantly associated with the likelihood of repeat victimization. Likelihood ratio tests were significant, indicating that the goodness of fit of the models improved significantly when adding the CV-RF scores.
Hierarchical Logistic Regression Models for Severe and Less Severe Violent Crimes.
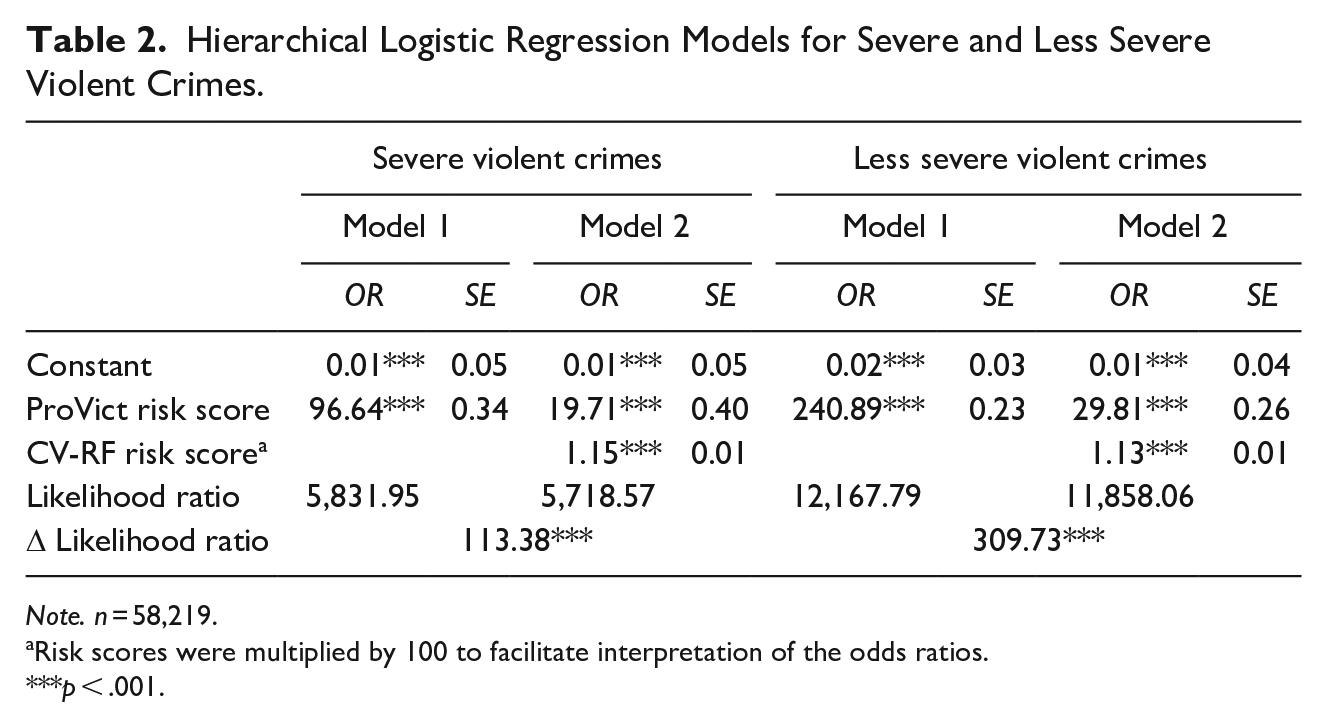
Note. n = 58,219.
Risk scores were multiplied by 100 to facilitate interpretation of the odds ratios.
p < .001.
Evaluation Combination Models
Table 3 presents the AUC values for the different methods that combined ProVict risk scores and CV-RF risk scores. These combination methods yielded accurate models (AUC > .70) for both outcomes. For both severe and less severe violent crimes, Combining two risk scores using statistical optimization methods resulted in higher AUC values than the intuitively appealing rules, although differences were small. Consequently, risk scores produced by a logistic regression analysis with both risk scores and the interaction term as independent variables showed the highest AUC values. The AUC value for severe violent crimes was higher than .80, indicating excellent discrimination and a large effect size. The AUC value for less severe violent crimes indicated acceptable discrimination and a large effect size, as the AUC value was higher than .70.
AUC Values Combinations Models Based on ProVict and CV-RF Risk Scores.
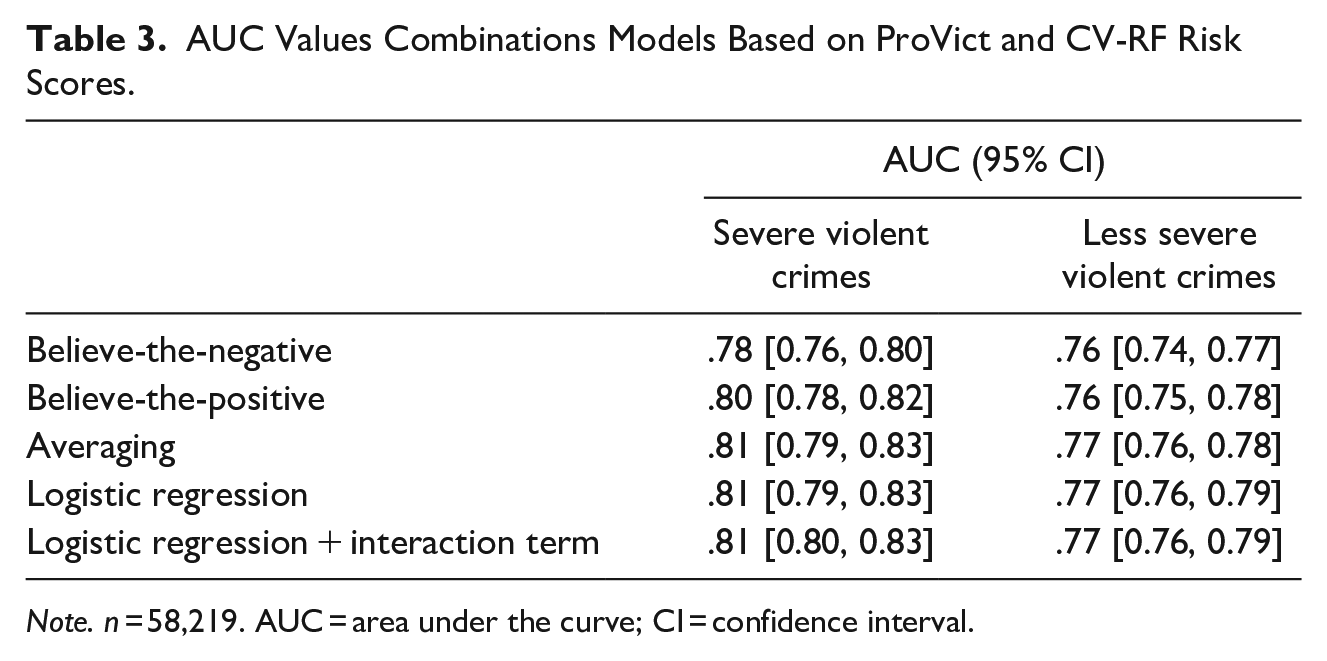
Note. n = 58,219. AUC = area under the curve; CI = confidence interval.
Additional predictive validity indicators for the best combination method (logistic regression with interaction term) for severe violent crimes are presented in Table 4. These indicators illustrate how a risk assessment instrument based on structured and unstructured information can perform in practice, when applying different thresholds to distinguish between high- and low-risk victims. Table 4 indicates the typical trade-off between sensitivity and specificity; the higher the cut-off threshold, the fewer repeat victims are classified as high-risk (lower sensitivity), the more non-repeat victims are classified as low-risk (higher specificity). The PPV indicates that only a small proportion of high-risk victims are repeat victims, while the NPV indicates that a large proportion of low-risk victims do not experience repeat victimization. Similar indicators were found for repeat victimization of less severe violent crimes.
Predictive Validity Indicators Best Combination Method Severe Violent Crimes.
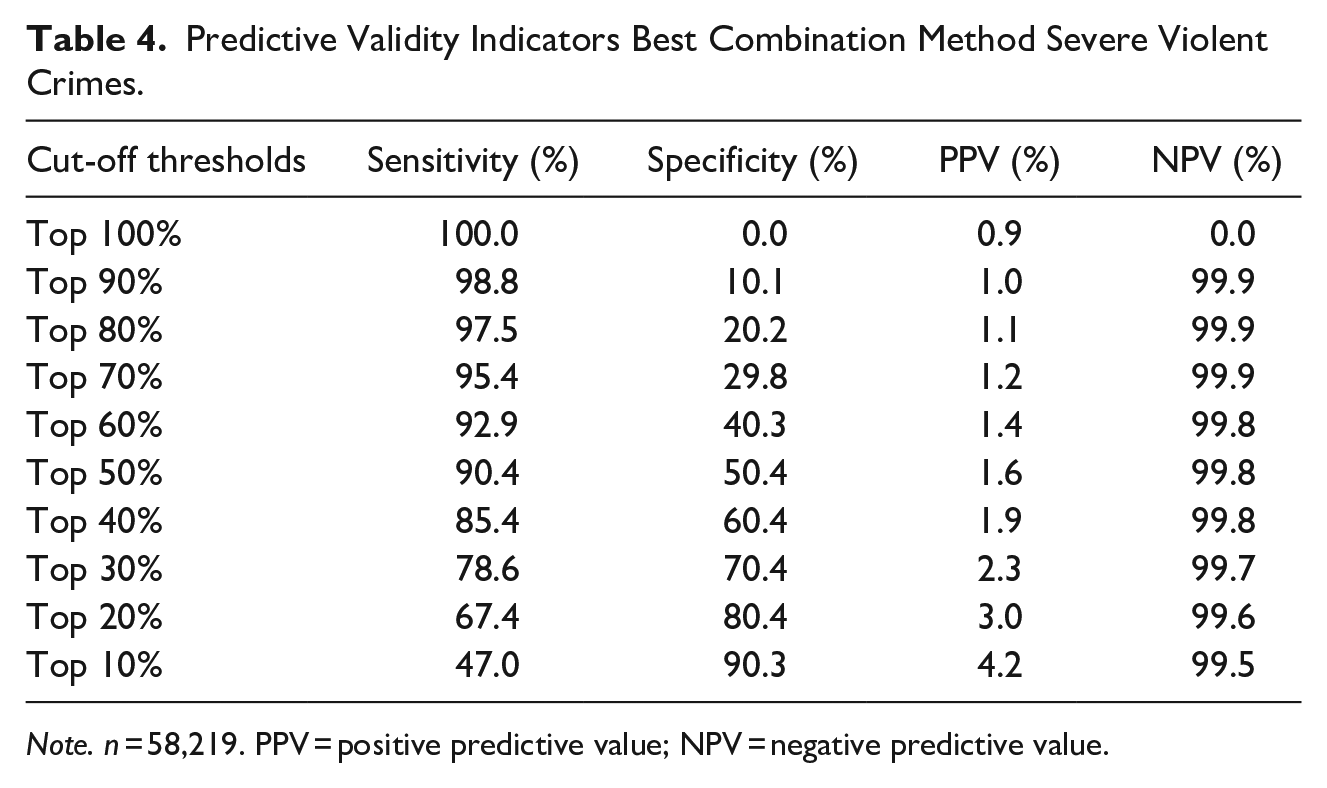
Note. n = 58,219. PPV = positive predictive value; NPV = negative predictive value.
Discussion
Following the Victim Directive, Dutch police officers are required to assess a victim’s vulnerability to repeat victimization. When victims are considered vulnerable (to repeat victimization), protection measures can be applied. Examples of protection measures are protection orders, shielding the victim’s name or address from the police report, audio-visually recording the victim’s interview, and referral to victim support services. As police officers have limited time and capacity, it is important that police officers correctly estimate the risk of repeat victimization and identify victims that are at-risk for repeat victimization. Moreover, it is important to correctly identify and protect repeat victims, as a small number of victims account for a large proportion of all victimization incidents (Gabor & Mata, 2004; SooHyun et al., 2017), and because the impact of victimization on an individual is often immense (Jackson & Gouseti, 2016). As a result, limited time and resources can be targeted at these high-risk victims. Identifying high-risk victims, however, is challenging as victims are a heterogenous group, with a great variety in frequency and severity of subsequent victimization incidents (Hope & Norris, 2013; Obsuth et al., 2018).
To guide police officers in the assessment of vulnerable victims, Raaijmakers et al. (2020) developed ProVict: an actuarial risk assessment tool that automatically calculates the risk of repeat victimization for victims that report a crime to the police. ProVict only used structured information from official police records. This study investigated the utility of unstructured police information for the prediction of repeat victimization, as well as its incremental value over and above structured police information. Finally, predictive accuracy of risk scores based on both unstructured and structured police information was assessed.
Firstly, unstructured police information showed predictive validity for the prediction of repeat victimization. For both severe and less severe violent crimes, AUC values indicated large effect sizes following Rice and Harris (2005) and acceptable and excellent discrimination following Hosmer and Lemeshow (2000). Secondly, in line with studies in other research areas (Adamou et al., 2018; Amrit et al., 2017; Härkänen et al., 2020; Hatef et al., 2021; Jonnagaddala et al., 2015; Laar et al., 2020), our findings suggest that unstructured information provides incremental validity over and above structured information in the prediction of repeat victimization. The goodness of fit improved when risk scores based on unstructured and risk scores based on structured information were included, compared to when only risk scores based on structured information were included. We conclude that structured and unstructured police information both contain unique information (Verma & Maiti, 2018) and incrementally contribute to the prediction of repeat victimization. However, the predictors of repeat victimization derived from unstructured and structured information, respectively, also showed some overlap. For example, significant ProVict predictors referred to missing person, assault, and threat cases, whereas significant words yielded from the CV-RF model were “missing person,” “assault,” “threat,” and synonyms of these words. Although we conclude that structured and unstructured police information contain unique information, some overlap is also present. Thirdly, AUC values of models based on a combination of both unstructured and structured information indicated large effect sizes (Rice & Harris, 2005) and excellent discrimination regarding severe violent crimes and acceptable discrimination regarding less severe violent crimes (Hosmer & Lemeshow, 2000). Discrimination indicators showed that models based on both unstructured and structured information were able to distinguish well between high- and low-risk victims. Across several cut-off thresholds (e.g., top 40%, top 30%, top 20%), a majority of the repeat victims and non-repeat victims was correctly classified as high- and low-risk, respectively.
A point of discussion concerns the method used for data processing of unstructured information. In the present study, two methods were used: count-vector and TF/IDF. Both methods do not capture semantic similarities between words (Qaiser & Ali, 2018). Future studies could, therefore, explore methods that do capture these semantic similarities, such as Word2Vec. Moreover, we used decision tree and random forest models as these approaches are suitable for analyzing rare events (Hegelich, 2016), such as repeat victimization. Berk and Sorenson (2020) recently applied three alternative algorithms for forecasting rare events. Future studies could investigate to what extent these alternative algorithms can successfully be applied to the prediction of repeat victimization. Future studies could also distinguish between different sources of unstructured police information (e.g., victims’ statements and police officers’ notes) and investigate whether these sources vary in their predictive validity regarding repeat victimization.
Finally, this study used official police records to facilitate the implementation of an instrument that predicts repeat victimization in Dutch police practice. The use of information that is already available by Dutch police is preferred over external information, as it simplifies the implementation of a risk assessment instrument. However, not all relevant information regarding risk factors for repeat victimization may be contained within official police records. In line with previous research, this study showed that words related to substance use, psychological distress, and family connections were associated with an increased risk of repeat victimization use (Gong, Kamboj, et al., 2019; Lawyer et al., 2006; López-Martínez et al., 2018; Rancher et al., 2019). To develop more knowledge on the risk factors of repeat victimization, future studies could focus on unstructured police information to identify other risk factors and explore whether information on these risk factors could, for example, be collected through an additional questionnaire. This study, however, focused on the development of an actuarial risk assessment instrument that can aid police officers in targeting their limited time and capacity to victims most at-risk of repeat victimization. This risk assessment instrument is based solely on structured and unstructured information from the police database, using no other data sources. This enabled an automated assessment of the risk of repeat victimization without any manual labor from police officers.
Based on our findings, we conclude that the combination of unstructured and structured police information may be a promising approach for risk assessment of repeat victimization within Dutch police. We conclude that a risk assessment instrument based on both structured and unstructured information provides more accurate predictions than a risk assessment instrument based solely on structured information (Raaijmakers et al., 2020). Such a risk assessment instrument may support police officers in their individual assessment of victims, by pointing out vulnerability to repeat victimization and indicating that for those victims further attention is needed. Such an instrument may also enable police officers to target their limited resources toward those victims that are most at-risk. Note that such an instrument is not intended to replace a police officer’s assessment, but is merely used to assist police officers.
For successful implementation, additional research is needed to explore practical possibilities or limitations of this risk assessment instrument in Dutch police practice. An investigation of the costs and benefits associated with the choice for different cut-off threshold should be part of such an investigation. As stated above, sensitivity and specificity values showed that across several cut-off threshold, a majority of repeat victims and non-repeat victims were correctly identified as high-risk and low-risk, respectively. At the same time, however, calibration indicators indicated that when applying these thresholds, a large number of high-risk victims do not experience repeat victimization (false-positives). These calibration indicators should be taken into account in cost/benefit analyses. It could be argued that correctly classifying a large number of repeat victims as high-risk outweighs the costs of classifying a certain number of non-repeat victims as high-risk. Note, that the relatively large numbers of false-positives are inevitable due to the low base rate of repeat victimization of (less) severe violent crimes. Note also, that not all false-positives in the present study may be non-repeat victims, as not all repeat victims may have reported their revictimization to the police. Previous studies showed that victims are less willing to report revictimization to the police, when previous police experiences were evaluated negatively (Colin Bolger & Walters, 2019; Koster, 2017).
To combine risk scores based on unstructured and structured information, this study removed individuals who had no police contact prior to the index incident from the data. When a risk assessment instrument for repeat victimization based on both structured and unstructured police information is considered for implementation, analyses that include persons who had no prior police contact should be executed. In practice, the instrument aimed to be used for all victims regardless of the presence of prior police contacts. Future research should address predictive validity when all victims are included.
This study demonstrated that unstructured police information may be a valuable addition to the risk assessment instrument ProVict (Raaijmakers et al., 2020). Our analyses revealed that a risk instrument using both types of data correctly classified a majority of repeat and non-repeat victims. In police practice, such an instrument may contribute to the identification of victims with an elevated risk of repeat victimization. Repeat victimization and its consequences may subsequently be prevented through applying adequate protection measures targeting these at-risk individuals.
Footnotes
Author Note
This study is part of a larger collaboration between Tilburg University, Radboud University, Praktikon, and the Dutch National Police.
Declaration of Conflicting Interests
The author(s) declared no potential conflicts of interest with respect to the research, authorship, and/or publication of this article.
Funding
The author(s) disclosed receipt of the following financial support for the research, authorship, and/or publication of this article: The study was funded by the European Union.