
Abstract
The perceived sanction risk is an essential element in the theory of deterrence to link criminal policy and criminal behavior. Previous research has not made clear how or even if individuals update their perceived sanction risk in response to changes in actual criminal policy. This study presents the first field experiment on the updating of the perceived probability of apprehension. On one location the police intensified moped traffic controls during a period of 6 months, while the control intensity on a comparable location remained unchanged. Difference-in-difference estimates reveal that the increased police activity caused an upward revision of the perceived probability of apprehension of offenses such as operating a mobile phone while driving or driving under the influence of alcohol.
Introduction
Contemporary deterrence theory of crime is based on two key assumptions. The first assumption holds that potential offenders will only engage in crime when the expected returns, discounted by the expected costs of illegal behavior, exceed the expected net returns from law-abiding alternatives such as legitimate employment (Becker, 1968). According to the second assumption, there is a positive correlation between the individuals’ perceived sanction risk and the actual risk as a result of criminal policy (Nagin, 1998). In combination, the two assumptions predict that the certainty, severity, and celerity of punishment have a negative impact on the level of crime.
A large body of research has studied the empirics of the relationship between criminal justice policy and crime; see, for instance, the reviews by Nagin (2013) and Kleck and Sever (2018). Most attention has gone to macro-studies analyzing the effect of police activity and punishment levels on measured crime rates, and to individual-level survey studies analyzing the effect of perceived sanction risks on self-reported criminal behavior.
Much less attention has been paid to the link between criminal justice policy and individual perceptions of sanction risks. Several cross-section studies in this field did not find a significant robust association between the survey respondents’ perceptions of sanction risks and the actual level of the certainty, severity, and celerity of punishment in their home area, thus raising doubts about the actual relevance of deterrence theory (Kleck & Barnes, 2013, 2014; Kleck, Sever, Li, & Gertz, 2005; Lochner, 2007). Panel studies of survey data, on the contrary, much better equipped to find out what drives the development of the individual perceptions of sanction risks over time, presented evidence that risk perceptions can change in reaction to personal and vicarious experiences with crime and punishment (Anwar & Loughran, 2011; Lochner, 2007; Matsueda, Kreager, & Huizinga, 2006; Pogarsky, Piquero, & Paternoster, 2004; Wilson, Paternoster, & Loughran, 2017). From the available results, however, “it is not clear how or even if individuals update their subjective probabilities in response to changes in objective sanction risk” (Apel, 2013, p. 86).
To establish the relevance of that kind of updating in a methodologically sound manner asks for a quite different, experimental, setup. The present study is a first attempt in that direction. We report on a field experiment in Leiden, The Netherlands, in which police traffic controls of moped drivers were intensified during a period of 6 months, while controls on a comparable location in the same region were kept at the regular interval. Throughout the period of 6 months, data on the perceived probability of apprehension (PPA) were acquired by questionnaires. This setup enables us to test whether the change in the objective sanction risk as a result of intensified police activity does indeed affect the perceived sanction risk of the moped drivers, and by how much.
In the next section, we start with a short review of the prior research on the determinants of the PPA. We then present the setup of our field experiment in more detail, followed by a description of the data and the plan of analysis. After the presentation of our results, we conclude with a discussion of their implications and limitations.
Prior Research
Following Waldo and Chiricos (1972) and more recently Nagin (1998), an important body of literature has emerged that studies the determining factors behind potential offenders’ individual perceptions of their sanction risk. This perceived punishment risk is an essential element in the theory of deterrence to link criminal policy and criminal behavior. Without this link, it is hard to see how changes in criminal policy can result in changes in the level of crime in another way than through incapacitation.
For our purpose, two broad lines of inquiry can be distinguished within this literature. The first examines the correlation between the actual sanction risk at the relevant time and place and the perceived sanction risk of individual respondents. The second discusses the process by which individuals update their perceived sanction risks in reaction to experiences with crime and punishment.
As to the first line of inquiry, the evidence points out (Apel, 2013) that the average citizen may have a reasonable knowledge of the criminal penalties that are statutorily applicable for specific offenses. But survey respondents do a poor job of estimating the probability and magnitude of the actual penalties.
This is most clearly borne out by Kleck et al. (2005), who interviewed 1,500 residents of 54 large urban counties in the United States to measure their individual perceptions of the prevailing certainty, severity, and celerity of punishment risks in their community for four serious crime types (homicide, robbery, burglary, and aggravated assault). To begin with, 15% to 20% of the respondents were not knowledgeable enough to provide the subjective estimates asked for. For the respondents who did provide estimates, they related the perceived sanction risks to actual county-level measures of punishment risks obtained from official criminal justice statistics. Only four out of 20 correlation coefficients were statistically significant. The relationship further weakened, when individual-level control variables such as age, sex, race, and education were added to the regressions. The results were corroborated by Kleck and Barnes (2013), who looked for any “collective wisdom” among the perceptions within each county and found none, and by Kleck and Barnes (2014), who found no relationship between the county-level rates of police per capita and the individual perceptions of arrest risk. In a similar vein, Lochner (2007) analyzed the correlation between the actual county arrest rate for auto theft and the PPA in a sample of young males. Initially, the relationship appeared to be positive, but it became statistically insignificant upon the inclusion of control variables. Moreover, in all these studies of perceived sanction risks explained variance was low, with an R2 generally below .05. Hence, one might be tempted to conclude that there is no detectable impact of the actual criminal policy on individual perceptions of the sanction risk.
That conclusion, however, has not gone unchallenged in the literature (Apel, 2013; Braga & Apel, 2016; Pogarsky & Loughran, 2016). First, it has been pointed out that most respondents in the samples by Kleck et al. 2005 and Kleck & Barnes (2013, 2014) were “committed law abiders” with respect to the serious criminal offenses under study. This group of citizens is in no need to obtain accurate information about the actual sanction risks. Second, as information on the true likelihood of detection is not available, the studies use official arrest rates as proxy measures. However, jurisdictions differ in the degree to which criminal offenses are reported and recorded. Moreover, the arrest rate is a consequence rather than a cause of crime. Third, the arrest rate can at best represent the average probability of apprehension in a given area, at a high level of aggregation. But individuals have private information, personal characteristics, and a specific location that make that the official arrest rate is only an indirect and imperfect measure of each individual’s actual probability of apprehension. Together, these three points are responsible for a series of measurement errors that would prevent any significant relationship, assuming that it exists, to come to the fore. The approach by Kleck et al. 2005 and Kleck & Barnes (2013, 2014) is simply inappropriate to detect any impact of actual criminal policy on individual sanction risk perceptions.
Another issue is that Kleck et al. 2005 and Kleck & Barnes (2013, 2014) look for an absolute relationship between the objective and perceived sanction risks, while for policy purposes it suffices if changes in criminal policy bring along changes in perceptions.
Both points are tackled by Hjalmarsson (2009), who studies the perceived chance of jail conditional on arrest around the age of criminal majority, using the same dataset as Lochner (2007). In a difference-in-difference approach, she looks at a change in perceived punishment severity as a result of a change in the prevailing legal rule. Moreover, this change in the prevailing legal rule can be observed without measurement error. Interestingly enough, Hjalmarsson reports a discontinuous increase in the perceived chance of jail when individuals reach the age of majority, providing evidence that actual criminal policy does affect individuals’ perceived sanction risk. At the same time, the observed change in perceptions appears to be substantially smaller than the objective change. Whether this is a result from measurement errors at the side of perceptions is open to debate.
The second line of inquiry addresses the impact on the individuals’ sanction risk perceptions that emanate from personal and vicarious experiences with crime, punishment, and punishment avoidance (Stafford & Warr, 1993). More recently, this impact has been modeled in terms of Bayesian updating (Anwar & Loughran, 2011; Lochner, 2007; Matsueda et al., 2006; Pogarsky et al., 2004; Wilson et al., 2017). In his review, Apel (2013) concludes that these recent studies provide support for the Bayesian updating model. Non-offenders generally possess unusually high subjective estimates of the probability of apprehension compared with experienced offenders. However, when they start a criminal career, they learn that the actual probability of apprehension is lower than initially expected, providing a signal to update their subjective estimate downward. Being arrested, on the contrary, leads to an upward adjustment in the individuals’ PPA. 1
It may be tempting to read these conclusions as evidence that actual policy does affect perceived sanction risks. But that would be premature. In a systematic summary of research findings, Kleck and Sever (2018) show that the evidence for downward updating as a result of crime that is not punished (punishment avoidance) is strong enough. But that does not hold for upward updating in reaction to an arrest, as a clear majority of relevant test results either found no significant association between prior punishment experience and risk perceptions or a significant negative association. And the studies that did find significant support for upward updating are subject to criticism. Most importantly, the experienced arrest ratio, which was used to correct for the differential impact between novice and experienced offenders, might have introduced a spurious positive correlation, as both the experienced arrest ratio (by definition) and the PPA (through downward updating) tend to decline at a larger number of offenses. The results are, furthermore, entirely based on self-report data with respect to crimes and arrests, which might suffer from various kinds of measurement error. The relationship with actual criminal policy is still unaddressed.
Summarizing our short review, we conclude that previous research as yet has not been able to find conclusive evidence of the crucial link between (changes in) actual criminal policy and (changes in) individuals’ perceived sanction risks. The two lines of inquiry distinguished above are subject to debate because they cope with some serious methodological and measurement problems.
First, research until now was based on cross-section differences in objective sanction risks between jurisdictions and cross-section differences in punishment experiences between individual respondents. None of these studies, however, with the single exception of Hjalmarsson (2009), directly pertained to a change in actual criminal policy. Second, individuals are likely to be most receptive to the sanction risk in their immediate surroundings. Alas, a proper and objective measure of the local risk of apprehension (Apel, 2013) is not readily available. Third, the various results give evidence that sanction risk perceptions vary largely between individuals. One important reason behind that finding is that most studies thus far referred to serious criminal offenses that are outside the scope of interest of most survey respondents. Committed law abiders, in contrast to experienced offenders, have no internal drive to stay up to date with respect to actual sanction risks. Presumably, more reliable results can be obtained from studying minor offenses for which a large(r) subset of the population is effectively on the margin (Apel, 2013). Fourth, none of the studies on the effect of actual criminal policy measures had an experimental design, making it difficult to exclude other factors that may have caused a change in the PPA.
Current Study
Our current study is an attempt to counter the four problems mentioned above. With the help of the Dutch National Police we conducted a field experiment in Leiden, The Netherlands, in which the intensity of routine traffic controls of moped drivers was increased relative to the nearby city of Zoetermeer. Through this setup, we directly changed the objective local probability of apprehension of the moped drivers on one location vis-à-vis the other. Hence, the policy change needs no further interpretation or separate measurement. Moreover, the offenses at stake are of a minor nature and well within the awareness space of any moped driver. Finally, the experimental setup allows for a difference-in-difference approach that mitigates the effects of extraneous factors. We add to previous research by further investigating the relationship between the objective and the PPA.
Setup of the Experiment
Our field experiment has been set up in collaboration with the Traffic department of the unit The Hague of the Dutch National Police. It focuses on traffic controls of mopeds and their drivers. Mopeds are two-wheeled motorized vehicles that can be operated by persons above 16 years of age with a valid driving license. Dutch traffic law distinguishes two kinds of mopeds: mopeds with a top speed of 25 km per hr that can be operated without wearing a helmet and mopeds with a top speed of 45 km per hr for which wearing a helmet is compulsory.
In the Netherlands, it is a regular routine that the National Police sets up traffic control checkpoints for mopeds where they check for a number of traffic law violations: driving a vehicle with a higher top speed than allowed, driving without a valid driving license or insurance, driving under the influence of alcohol, driving without proper lighting, using a mobile phone while driving, and driving without a helmet when required. The general interval with which moped traffic controls are carried out depends on the targets the National Police commits to in the beginning of the year. However, local units have the freedom to vary the intensity and location of the controls.
For the experiment two different locations were selected: Wassenaarseweg in Leiden and 1st Stationsstraat in Zoetermeer. The cities Leiden and Zoetermeer are part of the urban agglomeration in the western part of The Netherlands, halfway between Amsterdam and Rotterdam. The two locations were selected because of their comparable nature with regard to the population of interest (people driving mopeds), the number of moped drivers passing the location, and the average number of traffic violations per driver stopped by the police. The two locations are only 14 kilometers apart from each other. However, Leiden and Zoetermeer have their own area of coverage, are separated by an agricultural zone, and interurban traffic from both cities is mostly directed toward The Hague. Hence, given the limited range of operation of mopeds, any change in traffic control intensity is limited to the local awareness space of the potential offenders in Leiden or Zoetermeer. It is highly unlikely that drivers will be observed in both populations or that a change in the objective probability of apprehension in one location will alter the PPA in the other.
Prior to the experiment the frequency of the moped traffic controls on both locations was once every 2 months on average. To see if, and to what extent, a change in the intensity of traffic controls affects the subjective probability of apprehension, the frequency of moped traffic controls was increased to once every 2 weeks in Leiden (the experimental location), while remaining once every 2 months in Zoetermeer (the control location).
The frequency of the traffic controls on both locations was not communicated via mass and social media. Results from a study by Pickett, Loughran, and Bushway (2016) show that such information can have an impact of its own, and possibly in a counterproductive direction.
The experiment was conducted from January 19, 2017, to August 2, 2017. This period of six-and-a-half months was chosen because it was in between the major winter and summer holidays, and still potentially long enough for the increase in frequencies on one of the locations to be noticed.
During the period of the experiment, traffic control checkpoints were set up between 02:30 p.m. and 05:30 p.m. on weekdays, just like before. At each checkpoint, passing moped drivers were stopped. Each traffic control was accompanied by police officers on motorcycles who drove around the checkpoint in a radius of 2 km to bring up moped drivers trying to elude the traffic control. After being stopped or pulled over, drivers were asked for their license and insurance papers. All mopeds were checked for defects. After visual inspection, all mopeds were placed on a roller test bench to determine the top speed. In the case of detection of a traffic law violation, drivers received an ordinance.
After the above standard procedure was finished, the drivers were informed by the police that researchers of Leiden University were present at the location, inviting them to participate in a survey.
Survey Instrument
The survey covered a wide range of topics in the field of procedural justice and deterrence. The questions were derived from previous research (Gau, 2013; Sunshine & Tyler, 2003; Tyler, 1990), and related both to the traffic control that had just taken place as well as to previous encounters with the police. Most responses were measured using a 7-point Likert-type scale. The time needed to conduct an interview was 7 min on average. The survey was tested and slightly modified after two pilot traffic controls in November 2016.
For the purpose of the present article, we only use a small number of the survey data. Levels of PPA were measured by six items. Participants were asked to estimate the likelihood of being apprehended in case they would (a) drive a vehicle with a higher top speed than allowed, (b) drive without a valid license or insurance, (c) drive under the influence of alcohol, (d) drive without proper lighting, (e) operate a mobile phone while driving, and (f) drive without a helmet when required. The PPA had to be rated on a scale ranging from 1 (very low) to 7 (very high).
To check for any differences in group composition between the two locations, a series of demographic and socioeconomic characteristics were assessed: age, sex, membership of an ethnic minority group, household income, and level of education.
In the survey we further asked the participants whether, in the 12 months before, they had committed any of the six traffic law violations under scrutiny, whether they had experienced any traffic controls, and whether they were sanctioned by the police for one or other offense. That information can be relevant as prior research has shown that individual perceptions of sanction risks may vary with previous personal experiences with crime and punishment.
Description of the Data
Table 1 gives a detailed overview of the traffic controls during the experiment, with their respective date, location, and number of participants. The overall number of moped drivers stopped at the two checkpoints was 687. Of the stopped drivers, 43.5% filled out the questionnaire, yielding a total of 299 respondents, 179 in Leiden (the experimental location) and 120 in Zoetermeer (the control location).
Dates, Locations, and Number of Participants per Traffic Control.
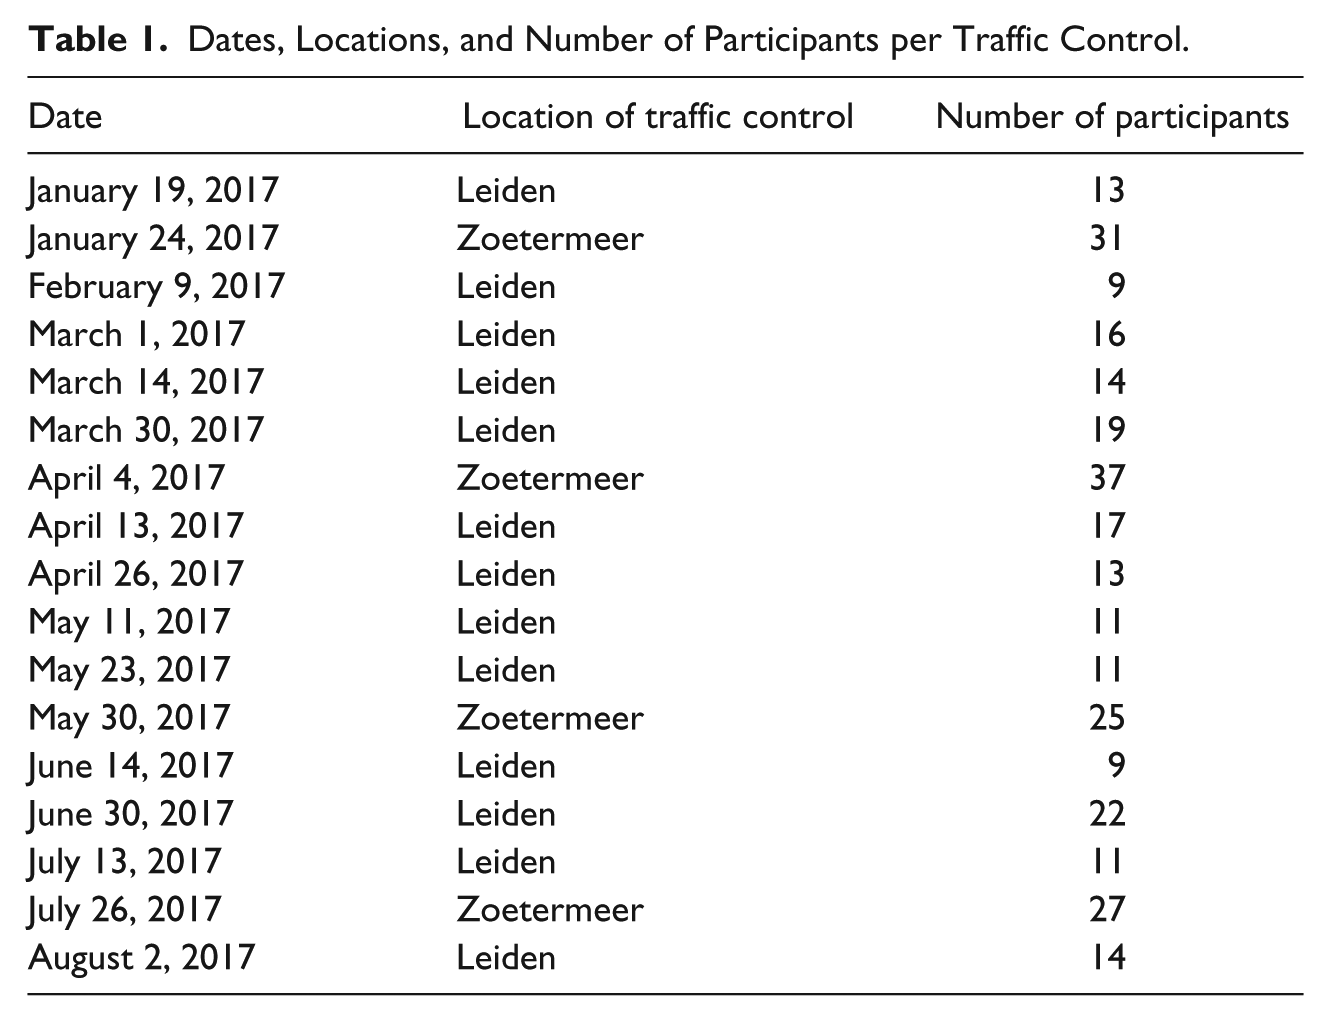
Table 2 presents descriptive statistics for the variables that were observed in the course of our experiment. As noted before, the PPA was measured on a scale ranging from 1 (very low) to 7 (very high). The results show a broad dispersion of scores, in line with previous studies on the accuracy of people’s perceptions of the probability of apprehension. Averages vary between the six traffic law violations and between the two locations, from 3.50 to 5.11. They are generally centered in the middle of the 1 to 7 scale and never (very) low nor (very) high. The items that cover the more visible violations (driving under the influence of alcohol, driving without proper lighting, operating a mobile phone while driving, and driving without a helmet when required) score higher than the less directly visible violations (driving with a higher top speed than allowed and driving without a valid license or insurance). The two locations were selected because they were comparable a priori with regard to the population of interest and the intensity of traffic violations. Due to the nature of the field experiment, however, the participants are not chosen at random, so there is no ex ante guarantee that the experimental and control groups are equal in all relevant aspects. Hence, we tested for differences in the group composition between the experimental and the control location. There appears to be a significant difference in the mean age, t(295) = 4.116, p = .000, in the share of males,
Descriptive Statistics of the Variables.
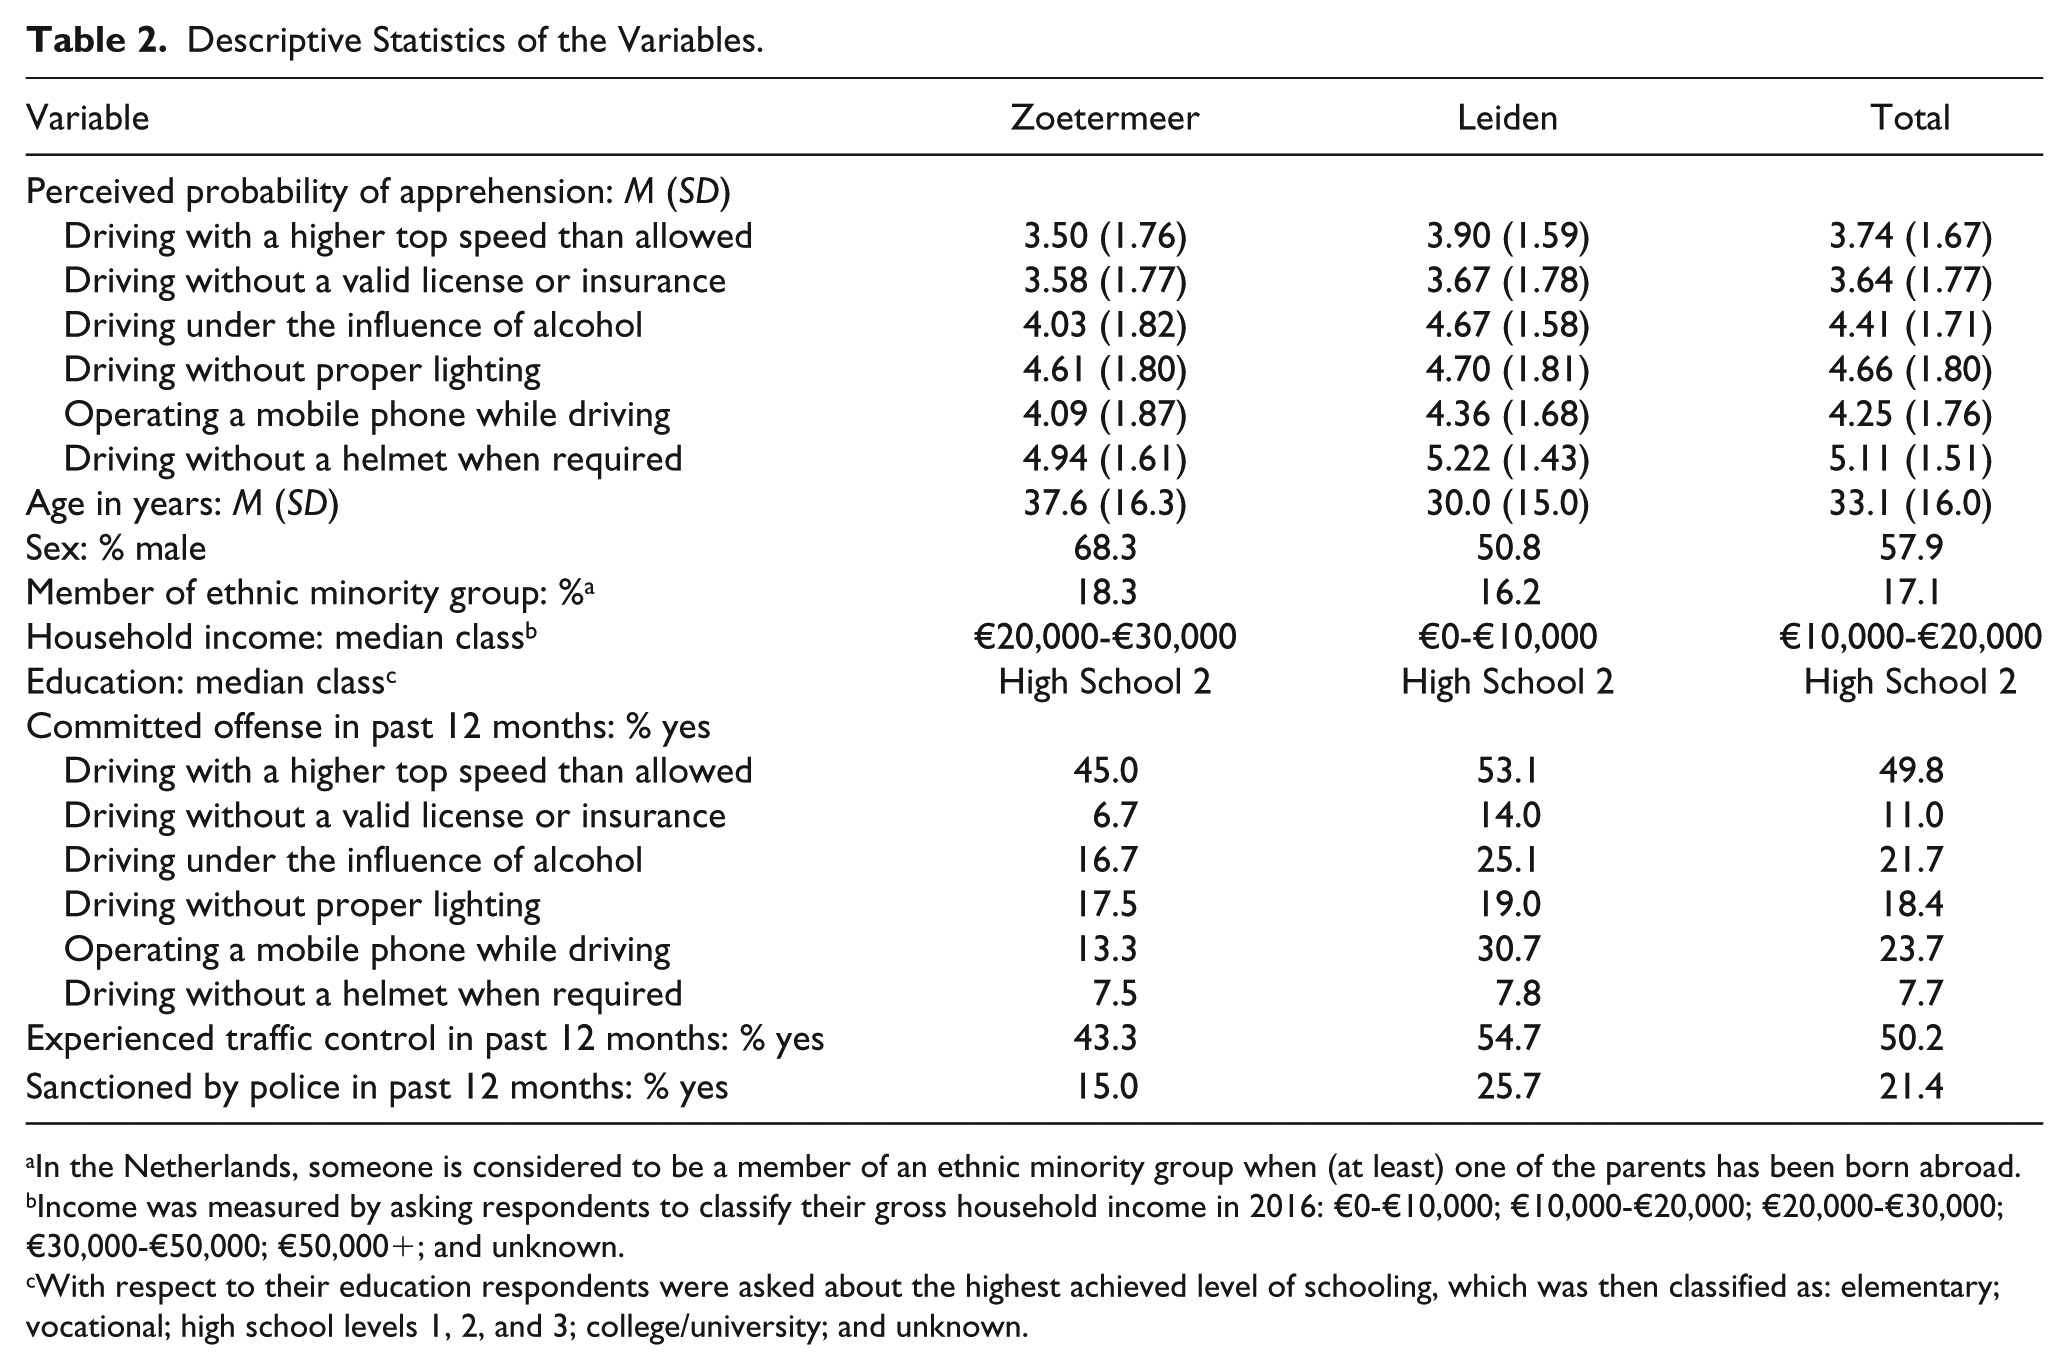
In the Netherlands, someone is considered to be a member of an ethnic minority group when (at least) one of the parents has been born abroad.
Income was measured by asking respondents to classify their gross household income in 2016: €0-€10,000; €10,000-€20,000; €20,000-€30,000; €30,000-€50,000; €50,000+; and unknown.
With respect to their education respondents were asked about the highest achieved level of schooling, which was then classified as: elementary; vocational; high school levels 1, 2, and 3; college/university; and unknown.
No less than 211 out of the 299 respondents, that is, 70.6%, admitted to have offended at least once in the previous 12 months against any one of the six traffic rules that were surveyed. This confirms that the offenses at stake are well within the awareness space of our moped drivers. Most common among the offenses was speeding (49.8%), followed by driving while making a telephone call (23.7%), driving under the influence (21.7%), and driving without proper lighting (18.4%).
It was further found that 50.2% of the participants had been stopped for one or more traffic controls in the 12 months before, which shows that traffic controls are a regular and well-known aspect of Dutch policing. Indeed, 21.4% of the respondents stated that they were apprehended for some violation or other and received a police sanction over that period.
A comparison between Leiden and Zoetermeer shows that the respondents at the experimental location on average committed somewhat more offenses, experienced somewhat more traffic controls, and were sanctioned somewhat more frequently than the respondents at the control location. Most of these differences are significant at the 5% level. Possibly, the differences can be explained by a more frequent moped use by our participants in Leiden.
Plan of Analysis
We want to test whether the increase in the objective sanction risk has affected the PPA. As the change in traffic control intensity in our experiment was not announced through mass and social media, moped drivers will not have picked up the increased intensity right from the start. In the course of time, they will have gradually found out about the intensified controls at the experimental location, either by personal experience or through their social network. As a consequence, adaptation of the PPA, if any, will have been a gradual process.
To analyze that process, we divide the experimental period of 6 months into three subperiods of (roughly) 2 months: from January 19 to March 14 (Subperiod 1), from March 30 to May 23 (Subperiod 2), and from May 30 to August 2 (Subperiod 3). The number of observations for these three subperiods is respectively 52, 71, and 56 at the experimental location and 31, 37, and 52 at the control location (cf. Table 1).
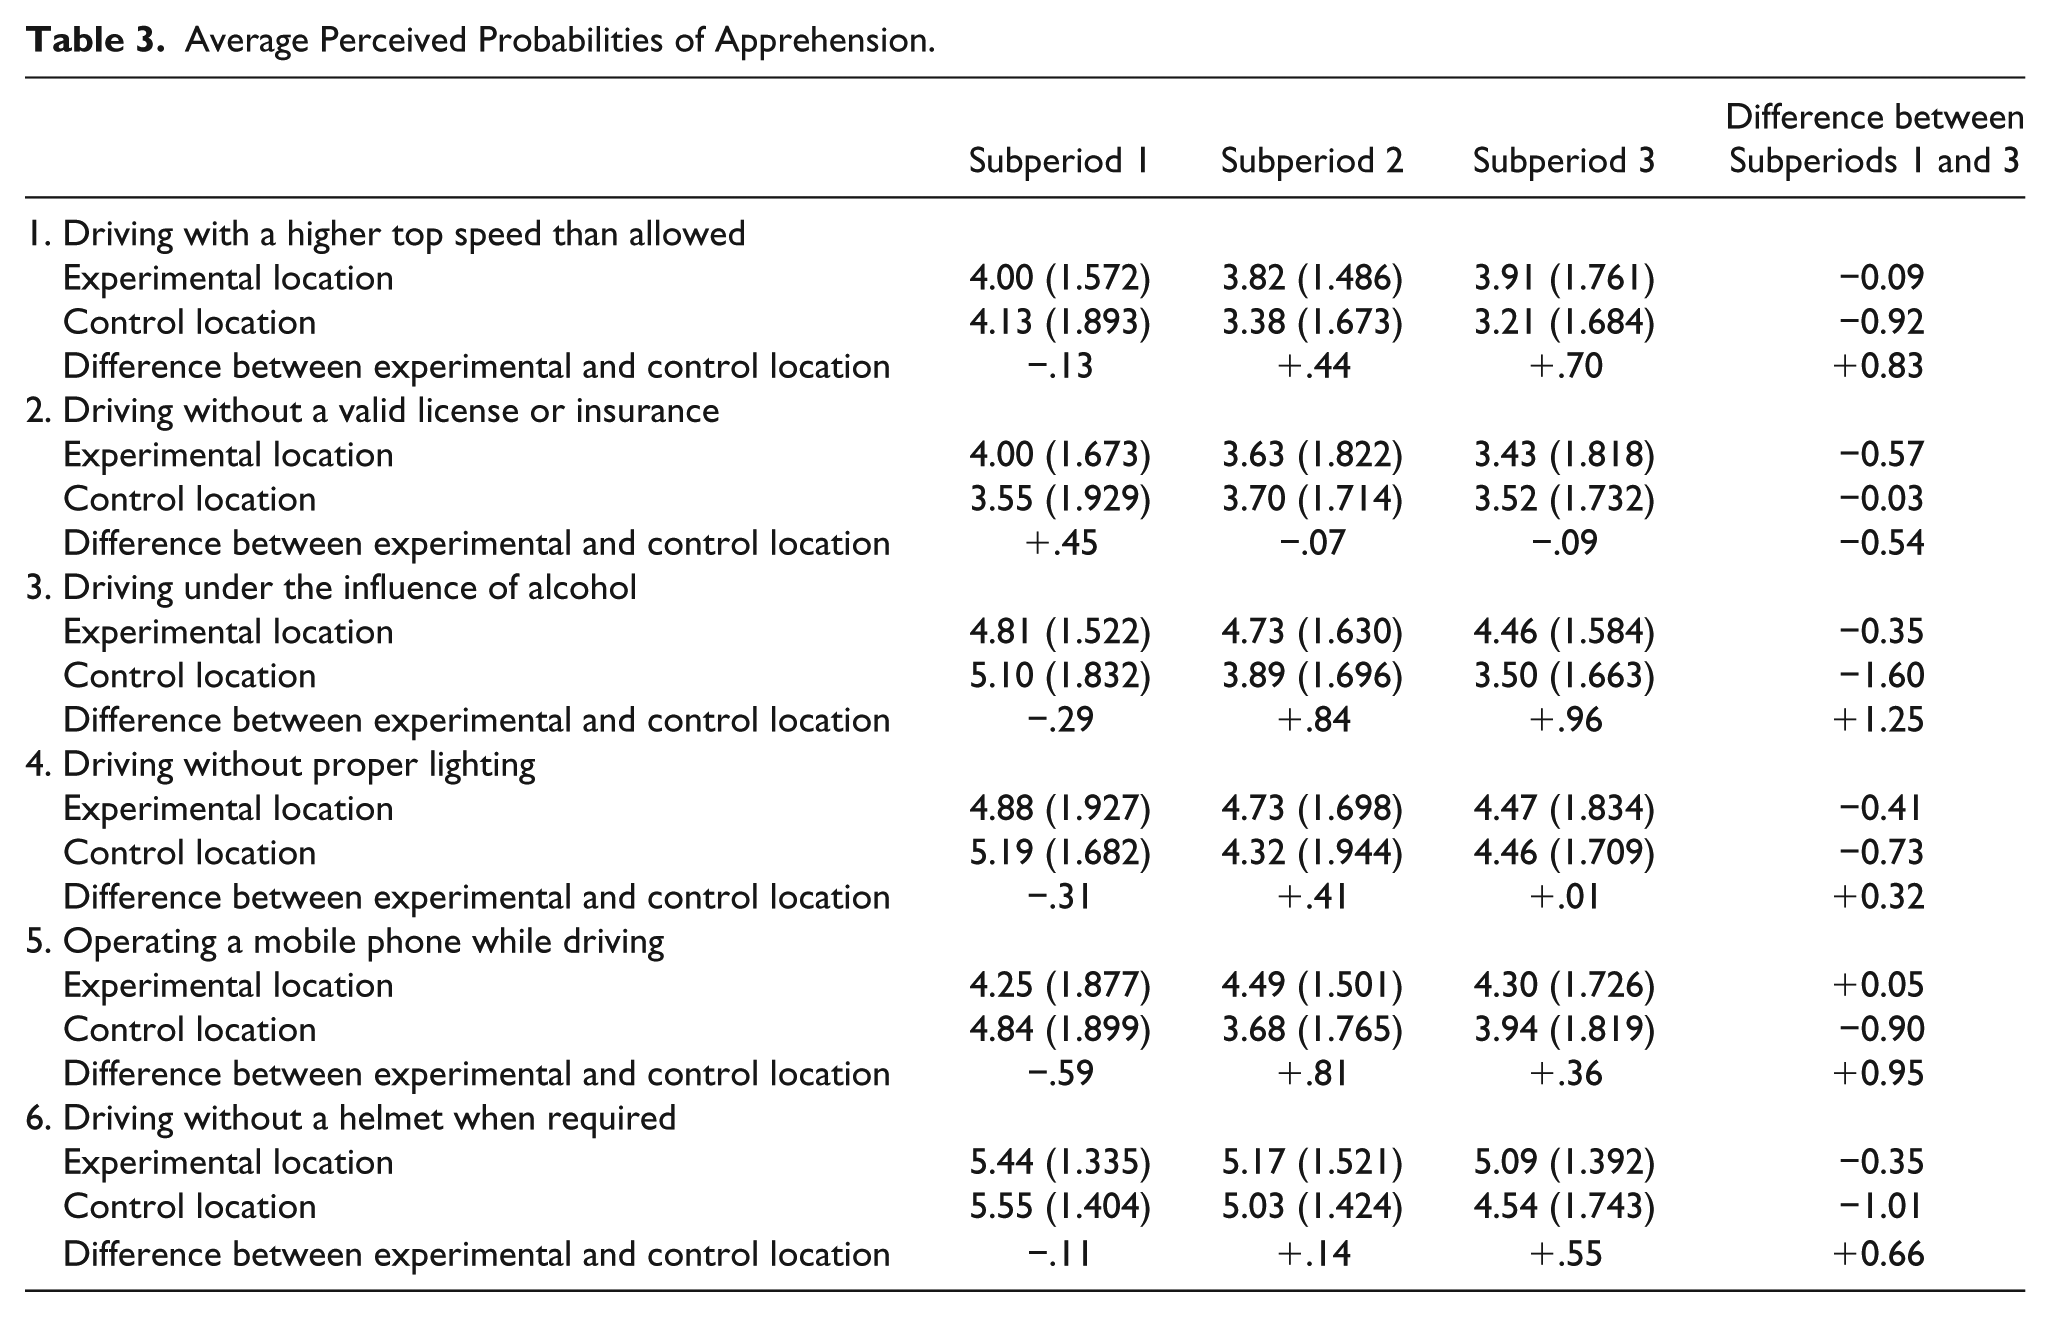
Table 3 presents, for the six types of moped traffic offenses separately, the average PPA’s in these three subperiods at the two locations. We notice, first of all, that the average PPA values at the start of the experiment, in Subperiod 1, are not significantly different between Leiden and Zoetermeer. Apparently, the observed differences in the composition of the two groups of respondents are, for our purpose, inconsequential. Over time, the average PPA’s follow, in general, a downward trend at the control location, for reasons that are not entirely clear. A possible reason is the shift from winter to summer conditions, which could have made moped drivers more cheerful and optimistic, or have changed the composition of the group of drivers. There also may have been a downward shift in the overall confidence in the efficiency of police activities, as a result from public discussions at the time on the substandard performance of the newly formed National Police in the Netherlands. We did not further investigate these possible reasons, as they are likely to have affected the average PPA’s at the experimental location in a similar manner. For our purpose, it suffices to focus on the difference-in-difference effect as a result of the change in the traffic control intensity. By how much did the development of the average PPA’s at the experimental location between the beginning and end of our experiment differ from the development at the control location? Here, Table 3 shows that in five out of the six offense types the difference-in-difference effect is positive, and quite substantially so for driving under the influence of alcohol (+1.25), operating a mobile phone while driving (+.95), driving with a higher top speed than allowed (+.83), and driving without a helmet when required (+.66). We might interpret these findings as a preliminary indication that an increase in police activity can affect PPA’s in the direction that the policy change is aimed at.
Average Perceived Probabilities of Apprehension.
However, to produce statistically sound results, we have to take account of two important factors that may have biased the findings in Table 3. First, our total group of participants is not a true panel, but consists of sets of moped drivers that vary from traffic control to traffic control. Second, the composition of the experimental and control groups is not uniform in all potentially relevant aspects (cf. Table 2). At the experimental location, participants, on average, were found to be somewhat younger, from lower income families, and the proportion of females was slightly higher. They also had, on average, committed somewhat more offenses, experienced somewhat more traffic controls, and were sanctioned somewhat more frequently in the previous 12 months. Regression analysis can help to control for these differences.
More specifically, we estimate the following equation:
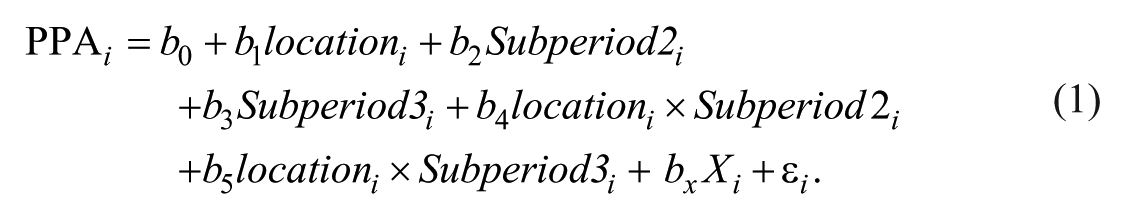
Here, the dummy variable Location distinguishes the experimental from the control condition, while the dummies Subperiod2 and Subperiod3 distinguish the second and third subperiod from the first. The next two variables Location × Subperiod2 and Location × Subperiod3 are interaction terms, X stands for the set of control variables, and ε is the error term. The parameter b0 is a constant, while b1 through b5 are coefficients that express how the average PPA differs from that in the control condition in Subperiod 1. Notice that parameters b4 and b5 are key to answering our central question (Lechner, 2011). If either or both turn out to be significantly positive, we have evidence that the PPA in the experimental condition has increased relative to that in the control condition. 2
In the next section, we discuss the results of the regressions for the six offense types. After that, we perform a robustness check to see what happens if we change our somewhat arbitrary partitioning of the experimental period.
Results
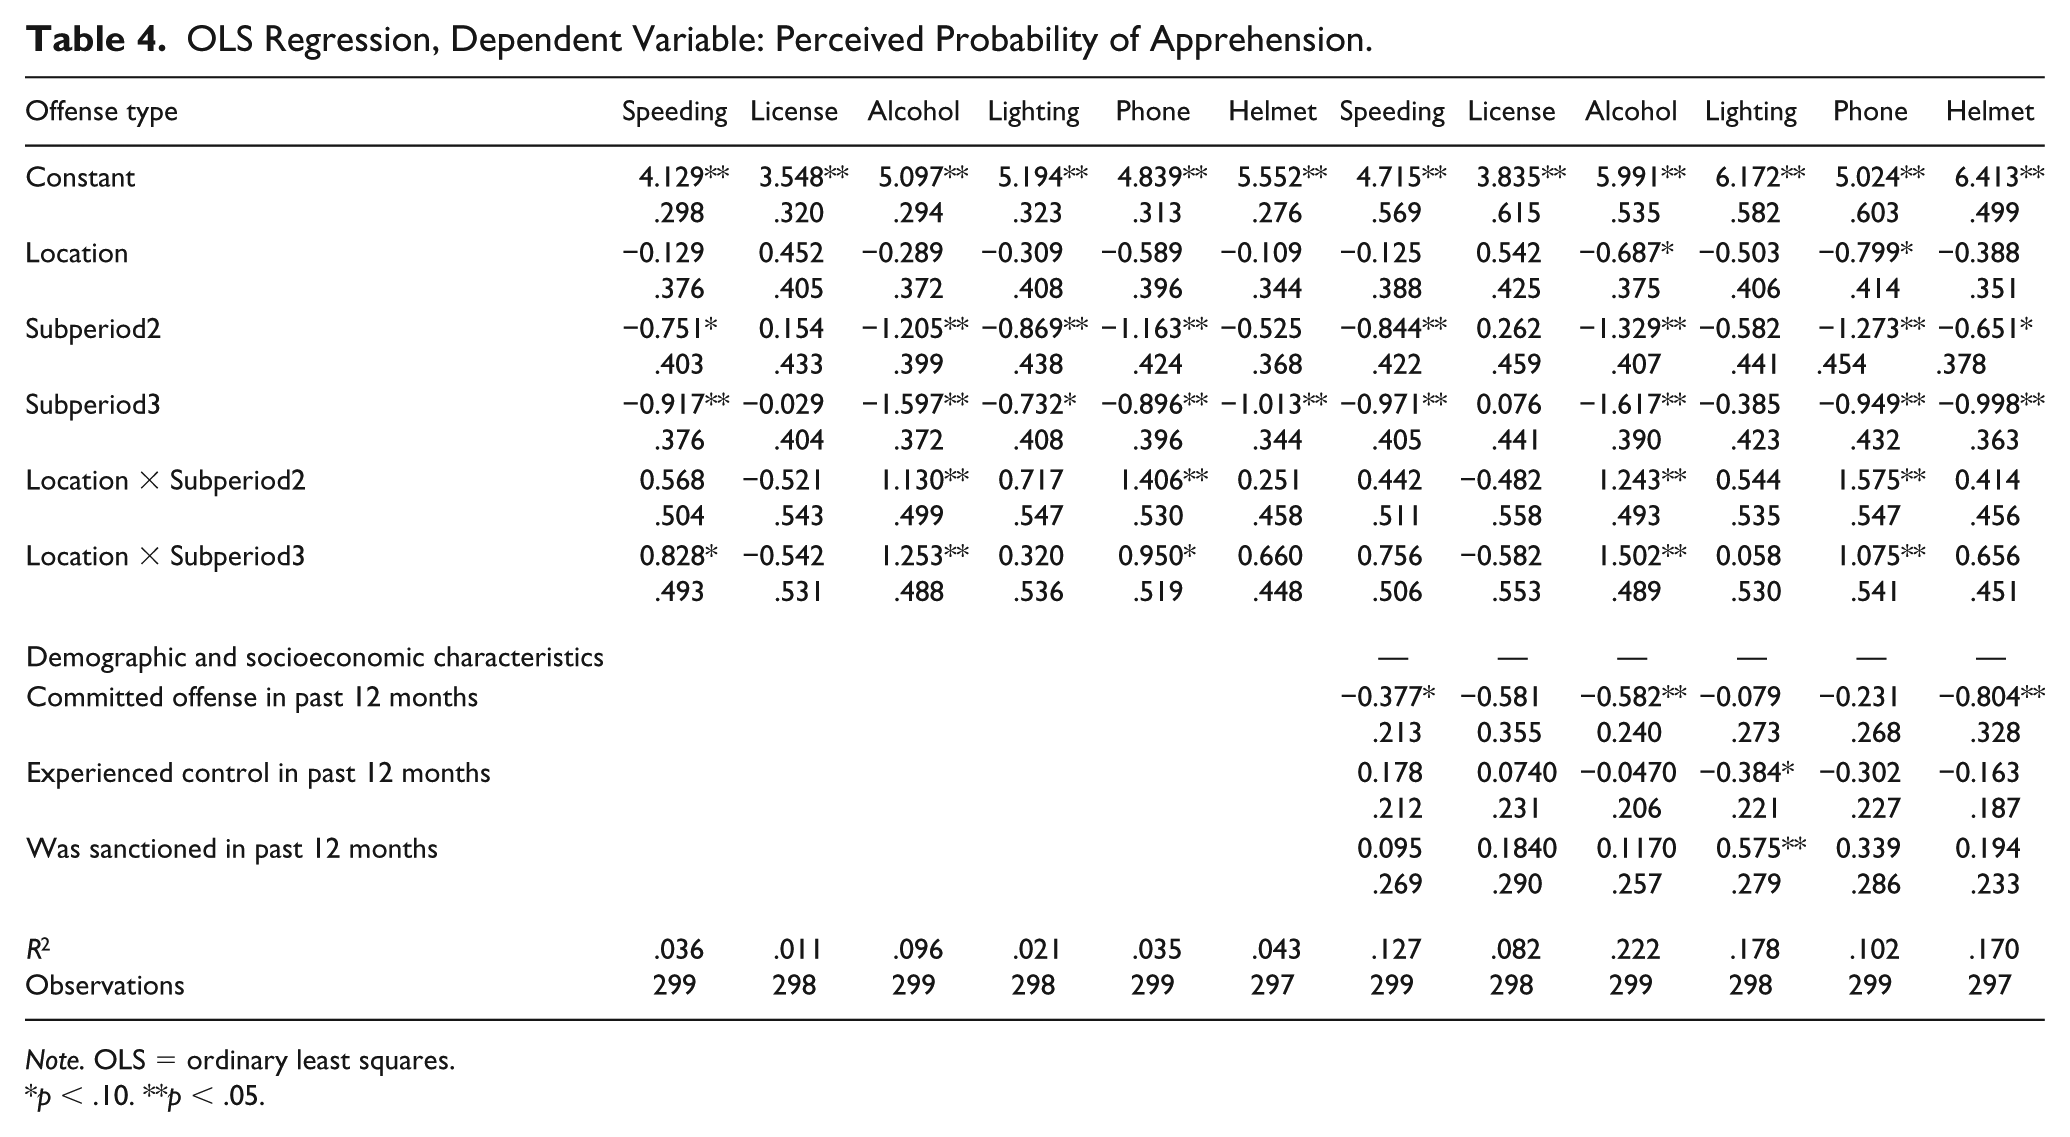
The first six columns of Table 4 present the results of the regressions without control variables. 3 Significant coefficients are denoted by two asterisks on a 5% level and by one asterisk on a 10% level. Focusing on the interaction terms, we note that the results of the difference-in-difference effects are in line with deterrence theory; they are positive for five out of six offense types and statistically significant for driving under the influence and for operating a mobile phone while driving.
OLS Regression, Dependent Variable: Perceived Probability of Apprehension.
Note. OLS = ordinary least squares.
p < .10. **p < .05.
The next six columns of Table 4 present the results of the regressions with the full set of control variables. 4 Adding the control variables considerably enlarges the explained variance, but does not in any relevant manner affect the estimates of the difference-in-difference effect. The coefficients of the interaction terms are, once again, positive for five out of six offense types, and statistically significant for driving under the influence and for operating a mobile phone while driving.
Even so, notice that the estimates for the control variables in Table 4 are of interest in their own right, as they are fully in line with prior findings on the updating of perceived sanction risks. Having committed a particular type of offense in the previous 12 months starts off downward updating (all coefficients are negative, three of them are significant), as offenders apparently learn that the apprehension risk for that type of offense is lower than initially expected. Actually being sanctioned, on the contrary, leads to upward updating, but less convincingly (all coefficients are positive, but only one is significant).
Overall, our difference-in-difference estimates support the idea that intensified police activity can help to increase PPA among potential offenders.
However, the estimates deserve closer scrutiny as they are not uniform across all offense types. Most convincing are the results for driving under the influence of alcohol, for operating a mobile phone while driving and, albeit to a lesser degree, for driving with a higher top speed than allowed. Notice that these are the three offense types that are most common among our respondents, which makes the sanction risk more salient for them. This salience is reinforced by the relatively high official fines for these types of offenses. Moreover, these types are the main focus of the traffic controls and can be easily detected, making it less likely that violations will go undetected.
The other offense types apparently gave respondents relatively less cause for concern. As to driving without proper lighting it should be noted that all traffic controls were performed in daylight. Improper functioning of the moped lighting was not always checked; and if the traffic law violation was detected most respondents got away with a warning. This will have weakened the impact of the intensified traffic controls as, for many drivers, the actual probability of apprehension for driving without proper lighting had not increased.
For driving without a helmet when required we also found an upward effect of the policy change that was not statistically significant. Of course, not wearing a helmet is most easily detectable by the police. But it should be noted that many of our respondents drove a moped with a top speed of only 25 km per hr that does not necessitate wearing a helmet. Hence, for these respondents it was difficult to relate to the question.
Finally, as to driving without a valid license or insurance, most people obey the rule, which is moreover of an administrative nature and of minor relevance. For these reasons it is quite understandable that moped drivers are not really interested in having an up-to-date estimate of their individual sanction risk. Indeed, for this traffic rule the difference-in-difference effect is quite different from the other offense types.
Robustness Check
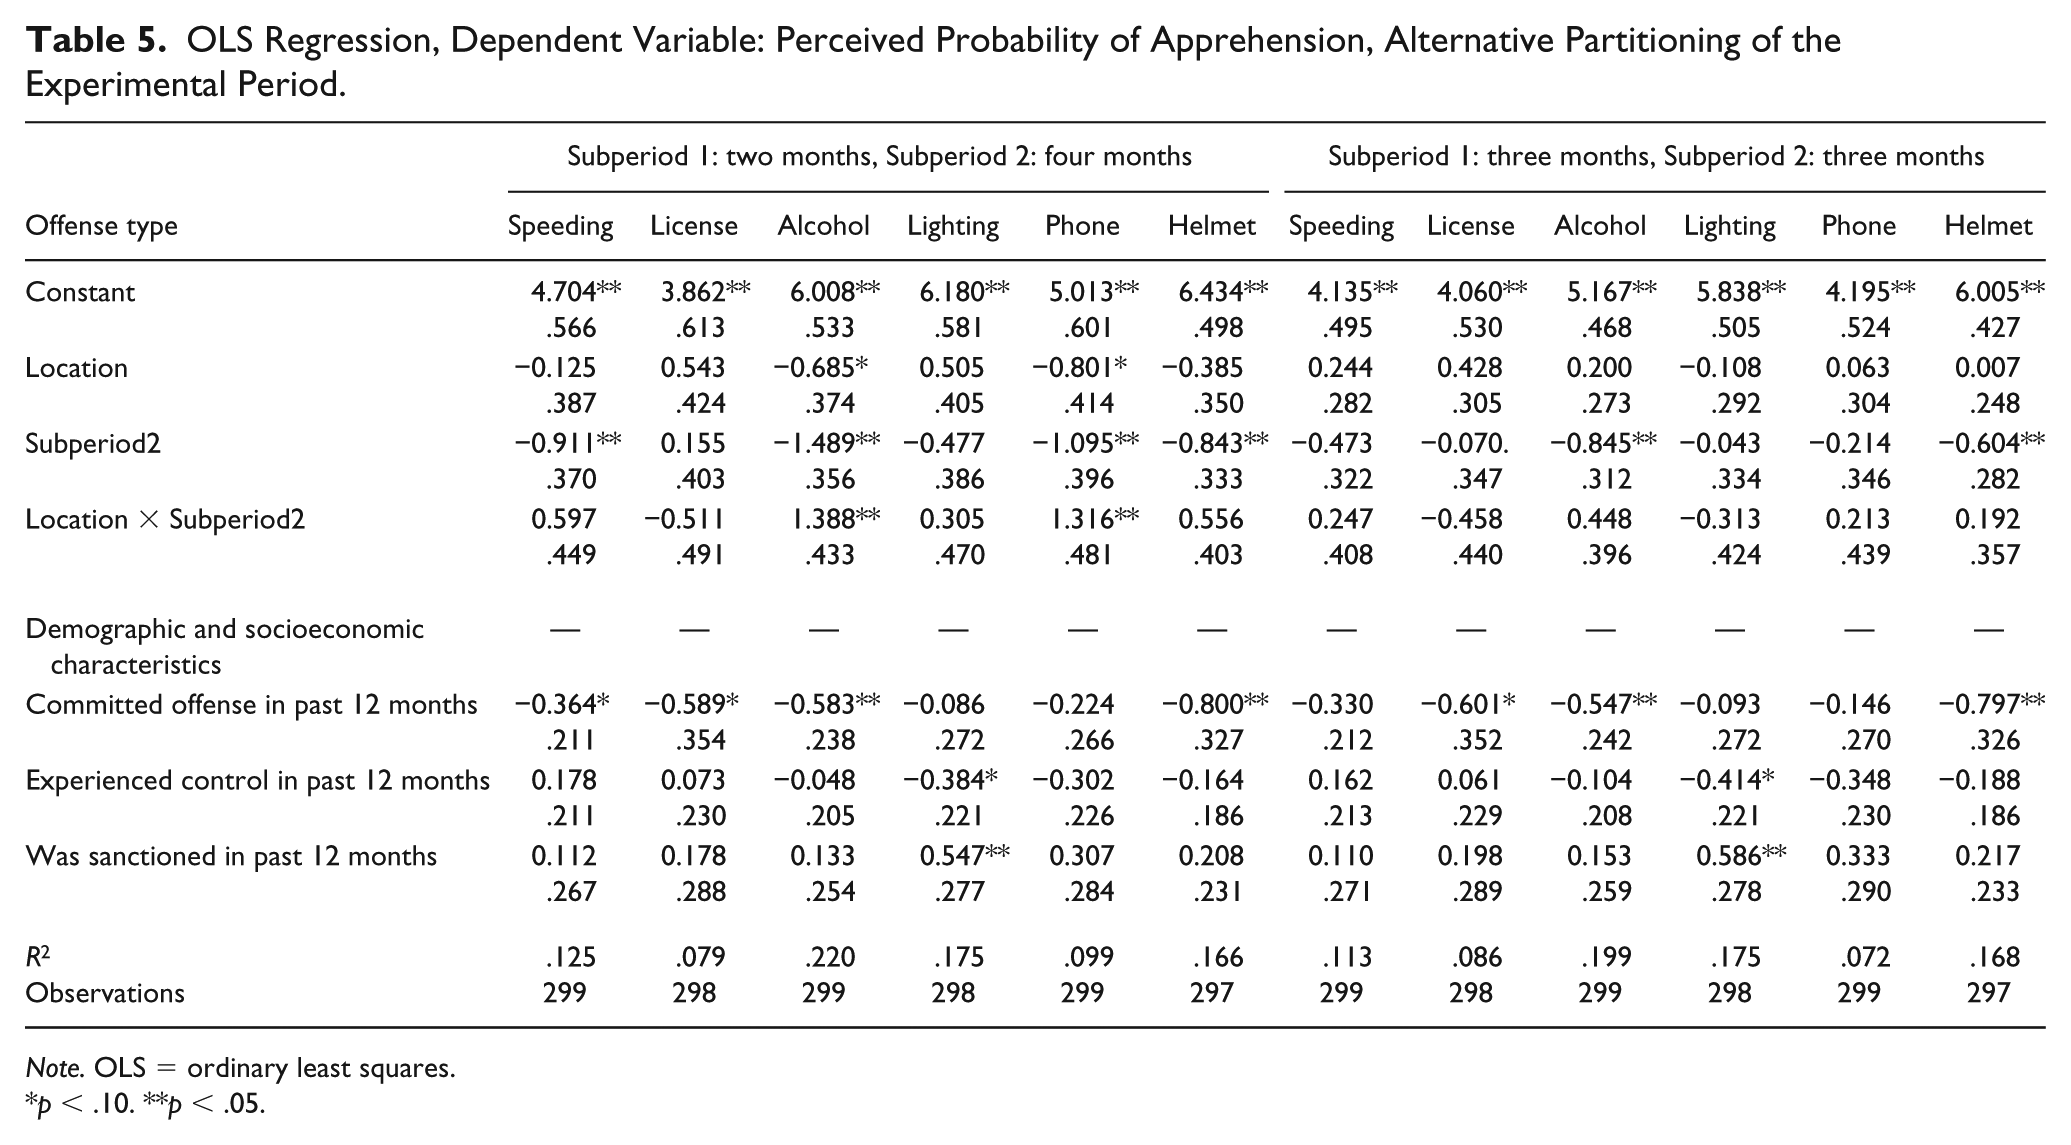
We performed a robustness check to determine whether the results change if we alter the basic assumption of our test to partition the experimental period into three subperiods of 2 months. See Table 5 for the results.
OLS Regression, Dependent Variable: Perceived Probability of Apprehension, Alternative Partitioning of the Experimental Period.
Note. OLS = ordinary least squares.
p < .10. **p < .05.
In the first additional regression, we merged the last 4 months of the experimental period, because the regression results in Table 4 suggested that the difference-in-difference effect between the second and third subperiod of 2 months did not differ much after all. Indeed, the results generally carry over, and the explained variance declines only marginally (with F-test values ranging from .3 to .7, indicating an insignificant difference). This suggests that the first period of 2 months has been long enough for the moped drivers in Leiden to find out, either by personal experience or from hearsay, that the traffic controls were intensified and to adapt their PPA accordingly.
To test this tentative conclusion, we ran a second additional regression where the experimental period was partitioned in two equal subperiods of 3 months. The results in the second part of Table 5 make clear that this alternative partitioning does not fit the data nearly as well as the partitioning in the first part of the table. The difference-in-difference effects lose their statistical significance, and the explained variance decreases. A very similar finding is obtained if the discontinuous partitioning of the experimental period is replaced by a continuous variable representing the duration of time since the start of the policy change. 5
Apparently, the updating of the PPA’s is a gradual process that is centered within the first 2 months, and does not prolong afterward. Hence, we conclude from our data that a 2-month period has been sufficient for the policy change to become common knowledge and to affect the PPA.
Discussion and Conclusion
The current study used a field experiment to test whether intensified police control positively affects the PPA. Our experimental setup has a number of merits. First, through the cooperation of the police we were able to study an actual change in enforcement policy. Second, the intensity of traffic controls was varied in a structured way so that the objective local probability of apprehension increased on one location vis-à-vis the other. There were no measurement problems and ambiguities involved as with the concept of the arrest risk used in other studies. Third, the offenses at stake were shown to be well within the awareness space of our moped drivers. Finally, by using two comparable locations, we were able to study the difference in the development of the subjective probability of apprehension over time as a result of the difference in the intensity of the moped traffic controls. This difference-in-difference approach has the merit that it automatically controls for biases that may result from permanent and stable differences between the experimental and control groups as well as from trends over time that are due to other factors. Indeed, adding a series of control variables to our regression equations did not materially affect the difference-in-difference estimates.
Our findings indicate that intensified police control, as expected, has a positive influence on the PPA for certain types of offenses. For frequently committed and easily detectable offenses that are regularly checked, the increase in control intensity caused an upward revision of the PPA. This refers to driving under the influence of alcohol, operating a mobile phone while driving and, albeit to a lesser degree, driving with a higher top speed than allowed. For offenses that only few drivers commit such as driving without a valid license or insurance or driving without a helmet (as for a large group of drivers this requirement does not apply), the results show no significant effect of the increase in intensity. For driving without proper lighting, an offense for which the control intensity was not actually increased (as all controls took place in daylight), the results also show no effect.
Our results are relevant, as prior research did not find conclusive evidence of a relationship between police control and the PPA. In our case, the findings testify to the existence of such a link. The effect, moreover, is quite substantial as the PPA for speeding, operating a mobile phone and alcohol abuse while driving a moped increases by 0.8 till 1.5 point on a 7-point scale, within a period of 2 months after the onset of the increase of the enforcement efforts.
The fact that we, in contrast to previous studies, find a positive relation between policy control and the PPA may be explained by a number of factors. First, our field experiment may have enabled us to more specifically determine cause and effect in the relationship between objective and perceived sanction risks by excluding other possible influences. Second, as potential offenders are likely to be most receptive to police activities in their immediate surroundings, this study focused on the local probability of apprehension. Third, as the large majority of moped drivers is susceptible to minor violations of the traffic rules, it is in their personal interest to update their perceived sanction risk upon signals of changes in police enforcement efforts.
Although our approach yields relevant insights, our study has some limitations. First of all, our study regards minor offenses. The findings cannot be directly transferred to more serious crimes. Setting up the field experiment required substantial deliberation and coordination, both on the part of the police and the researchers, to get the field work underway. It is not easily imagined how a comparable field experiment could be organized around more serious crime. Another limitation of our approach that deserves attention is the fact that our set of participants is not a true panel. As a consequence, it is not possible to follow the perception updating of each individual moped driver over time. Hence, we also cannot study in some depth what sets the updating process in motion: personal experience or hearsay from friends or digital media. Follow-up research with the use of a true panel would be an interesting next step to gain insight in this process.
Footnotes
Declaration of Conflicting Interests
The author(s) declared no potential conflicts of interest with respect to the research, authorship, and/or publication of this article.
Funding
The author(s) received no financial support for the research, authorship, and/or publication of this article.