
Abstract
This study examined the extent to which the Negative Context of Reception Scale generates valid and reliable scores with Puerto Rican Hurricane Maria survivors. A sample of 319 adult Hurricane Maria survivors completed measures of the negative context of reception, discrimination, language stress, depressive and anxiety symptoms, optimism, and life satisfaction. Confirmatory factor analyses (CFAs) indicated that the previously validated one-factor solution fit the data adequately, and multigroup invariance tests indicated that this solution fit largely equivalently across gender, age groups, year of arrival in the United States, and self-reported English proficiency. Negative context of reception was correlated positively with discrimination and language stress, positively with symptoms of depression and anxiety, and negatively with optimism and life satisfaction. It may be important to adjust item order to reduce intercorrelations among some item responses. This study offers an instrument that counselors can use with Hurricane Maria survivor clients.
The present study provides validation information for the Negative Context of Reception Scale with a highly unique population—Puerto Rican Hurricane Maria survivors living on the U.S. mainland. In the years after the hurricane, many thousands of survivors migrated to the mainland in search of housing, work, and higher quality of life. The Negative Context of Reception Scale provides a tool for assessing feelings of exclusion and marginalization from “mainstream” U.S. culture.Significance of the Scholarship
Introduction
Puerto Rico has maintained an ambiguous relationship with the United States since being acquired from Spain following the Spanish-American War in 1898. The Jones Act of 1917 granted U.S. citizenship to anyone born in Puerto Rico, and this citizenship allows Puerto Ricans to travel and relocate freely from the island to the U.S. mainland and vice versa (Acosta-Belén & Santiago, 2018). Indeed, in contrast with others born elsewhere in Latin America, island-born Puerto Ricans who move to the mainland are deemed citizen migrants (people who migrate within a nation) rather than immigrants (people who migrate from one nation to another), as their relocation occurs entirely outside the U.S. Citizenship and Services System.
However, the ambiguity regarding Puerto Rico’s status also creates considerable difficulty for Puerto Ricans who migrate to the U.S. mainland (Pantojas-García, 2005). Puerto Rico maintains a culture that is more similar to Latin American countries than to the U.S. mainland, and the vast majority of Puerto Ricans speak Spanish as a first language. Many Puerto Ricans, especially those residing outside the San Juan metropolitan area, do not speak English well or at all (Puerto Rico Report, 2021). Further, the poverty rate in Puerto Rico (43.1% in 2018) is far greater than that on the U.S. mainland (13.1% during that same year; Glassman, 2019).
Context of Reception in the Context of U.S. Citizen Migration
Within the context of international migration, newcomers often experience culturally stressful events such as being discriminated against, feeling shut out of or marginalized from opportunities, and difficulties communicating with (and being understood by) destination-society individuals (Schwartz et al., 2015). These events are often more common and severe in the context of large-scale migration, in which individuals in the destination society are likely to feel threatened by the influx of newcomers (Coenders et al., 2008). Perceived threats to the employment, housing, cultural continuity, and identity of the destination society may lead members of that society to support or implement defensive policies and attitudes to counter the perceived threats posed by the migrant group (Atwell Seate et al., 2018). In turn, these defensive policies and attitudes create a negative context of reception for migrants (Schwartz, Waterman et al., 2022). Sociologists (e.g., Portes & Rumbaut, 2014) define context of reception as the opportunity structure and “welcome” available to a given immigrant group within a given country or region.
The construct of context of reception was proposed for international migrant groups— and, as a result, it is not known whether it could be applicable to U.S. citizen migrants relocating from Puerto Rico to the mainland United States. There is some reason to believe that Puerto Ricans might encounter a fairly negative context of reception upon their arrival in the U.S. mainland. As some writers (e.g., Llórens, 2018) have noted, Puerto Ricans may be treated as “second-class citizens” in the eyes of the U.S. government and of many mainland U.S. residents. For example, Puerto Ricans are often treated as foreigners when they relocate to the U.S. mainland, and many people on the mainland do not even know that Puerto Ricans are U.S. citizens at birth (Dropp & Nyhan, 2017). Indeed, recent scholarship suggests that many mainland U.S. residents view Puerto Ricans as “lazy” and “uneducated” people who migrate to the mainland primarily to receive government benefits (Dhuman Giron & Vargas, 2020). The result may be a negative context of reception, as defined by Portes and Rumbaut (2014)—namely stigmatization and lack of opportunities for Puerto Ricans migrating to the U.S. mainland.
Although negative context of reception often emerges as a result of defensive reactions on the part of receiving-society individuals (Chavez, 2013), such a context can exert negative effects on immigrants’ well-being. Such negative effects can include symptoms of depression and anxiety, impaired life satisfaction, and pessimism (Lorenzo-Blanco et al., 2019; Schwartz et al., 2015).
Measuring Perceived Context of Reception
Although sociologists have discussed the context of reception in an abstract and theoretical way, Schwartz et al. (2014) were the first to develop a scale to assess perceived context of reception among Hispanic immigrants. Their Negative Context of Reception Scale contains six items and assesses the extent to which immigrants perceive their context of reception as negative or unfavorable. This measure has been validated for use with Hispanic immigrants in general (Forster et al., 2021), as well as with Venezuelan immigrants specifically (Salas-Wright et al., 2021). The negative context of reception measure has been shown to generate scores with high internal consistency reliability and with incremental validity in terms of predicting outcomes beyond the predictive effects of perceived discrimination (Schwartz et al., 2014), and negative context of reception scores have been shown to predict a range of outcomes, including depressive and anxiety symptoms (Schwartz et al., 2018), substance use (Salas-Wright, Goings et al., 2021), low optimism and life satisfaction (Schwartz et al., 2015), and aggression (Forster et al., 2015).
Negative context of reception is one of the three components that Salas-Wright and Schwartz (2019) included within their cultural stress theory—along with discrimination and bicultural and language stress. This cluster of stressors, taken together as a latent construct, have emerged as longitudinal predictors of depressive and anxiety symptoms (Schwartz, Waterman et al., 2022), compromised family functioning (Lorenzo-Blanco et al., 2016), and substance use (Schwartz et al., 2015). Reliable and valid measurement of negative context of reception has therefore been essential to the advancement of cultural stress theory and research.
Thus far, however, all of the work on cultural stress theory generally, and on negative context of reception specifically, has been conducted on international migrant groups. The applicability of negative context of reception vis-à-vis Puerto Ricans—as U.S. citizen migrants—has not been empirically examined. However, as noted earlier, the “cold shoulder” reception that many Puerto Ricans have received on the U.S. mainland suggests that Puerto Ricans, as a group, experience a negative context of reception when relocating to the mainland. This poor reception may be especially pronounced for Hurricane Maria survivors, who tended to have low socioeconomic status and arrive in large numbers (thereby potentially activating threat and defense dynamics among individuals living in the communities where the hurricane survivors were settling).
Defensive dynamics among non-Hispanic White host nationals in Central Florida began during the early 2000s and continued after the hurricane migrants arrived. Non-Hispanic Whites attempted to block the provision of Spanish-language services for new arrivals from Puerto Rico (Silver, 2020), as well as to keep Puerto Rican migrants from moving into largely White neighborhoods (Delerme, 2020). Further, following the hurricane, the Federal Emergency Management Agency placed many hurricane survivor families into motels in the U.S. mainland without kitchens or ovens, and encouraged these families to return to Puerto Rico even though much of the island was still without power and running water (Sutter, 2018). In short, many Hurricane Maria migrants were offered little or no support, and the message that was communicated to them was that they were not wanted or welcome in the U.S. mainland.
It should be noted that the Hurricane Maria migration occurred in waves, with many individuals arriving shortly after the hurricane (Fall 2017), with additional migrants continuing to arrive in 2018, 2019, and 2020. It is not known whether these different waves of migrants experienced a similar context of reception upon arrival in the U.S. mainland nor whether the psychometric properties of scores generated by the Negative Context of Reception Scale are equivalent across these years of arrival (where nonequivalence would contraindicate being able to compare across years). It is also important to compare the factor structure of scores generated by the instrument between men and women, so that gender differences can be examined. Indeed, although negative context of reception across gender among Hurricane Maria survivors has been found to have no mean differences (Schwartz et al., in press), the factor structure of negative context of reception scores has yet to be examined between men and women within this population. Araujo-Dawson (2015) has examined gender differences in discrimination among Puerto Ricans, but similar work on context of reception, including in-depth psychometric analyses, has yet to be conducted. Further, Cano et al. (2017) found that other cultural stressors, such as immigration-related stress, may relate to outcome variables (e.g., alcohol use) differently among men than among women. Understanding of the consistency of the factor structure of negative context of reception scores across year of arrival, self-reported English proficiency, and gender would be informative as to the extent to which the Negative Context of Reception Scale might serve as a useful tool for counselors and other practitioners working with diverse groups of Hurricane Maria survivors, as well as with other Puerto Ricans migrating to the U.S. mainland.
Although Hurricane Maria occurred several years ago and its related migration to the mainland has largely ended, scholars (e.g., Schwerdtle et al., 2018) have predicted that climate-based migration is likely to increase in the coming years. Because Puerto Rico is located in a part of the Caribbean Sea where hurricanes often form and track, it is inevitable that the island will be struck again by a major storm at some point. Whenever such a strike occurs, another wave of Puerto Ricans are likely to migrate to the U.S. mainland and an assessment tool will therefore be necessary to measure the extent to which these individuals feel that they are subjected to a negative context of reception.
The Present Study
The present study was conducted to examine the psychometric properties of scores generated by the Negative Context of Reception Scale within a sample of Puerto Rican Hurricane Maria survivors. We posited three research questions to guide the study. Because the factor structure of scores generated by this measure has been established across several immigrant groups, our first research question was whether this same factor structure would emerge in the present sample of Hurricane Maria survivors. We hypothesized that the six negative context of reception items would load onto a unifactorial construct. To test this hypothesis, we conducted a confirmatory factor analysis (CFA) using responses to the six negative context of reception items.
Our second research question involved the consistency of the factor structure of scores generated by the Negative Context of Reception Scale across age group (young adult, established adult, or midlife and older), gender, year of arrival (2017 vs. 2018–2020), and self-reported English proficiency (Poor or Very Poor vs. Good or Very Good). Such consistency, or lack thereof, is critical to examine so that counselors know whether the instrument is equally appropriate for Hurricane Maria survivor clients from different backgrounds. We hypothesized that the factor structure of scores generated by the Negative Context of Reception Scale would be consistent between men and women, across year of arrival, and between individuals with greater versus lower self-reported English proficiency. To test this hypothesis, we conducted multigroup invariance tests on the factor structure of scores generated by the instrument across these variations.
Assuming that the CFA model provided an acceptable fit to the data, and that the factor structure of negative context of reception scores was consistent across age group, gender, and year of arrival, our second research question entailed examining the associations of the negative context of reception factor with perceived discrimination, depressive symptoms, and anxiety. We hypothesized that negative context of reception would be associated positively with perceived discrimination, depressive symptoms, and anxiety symptoms. To test this hypothesis, we estimated a structural model where the negative context of reception factor was allowed to correlate with observed indicators for perceived discrimination, depressive symptoms, and anxiety symptoms.
Method
Sample
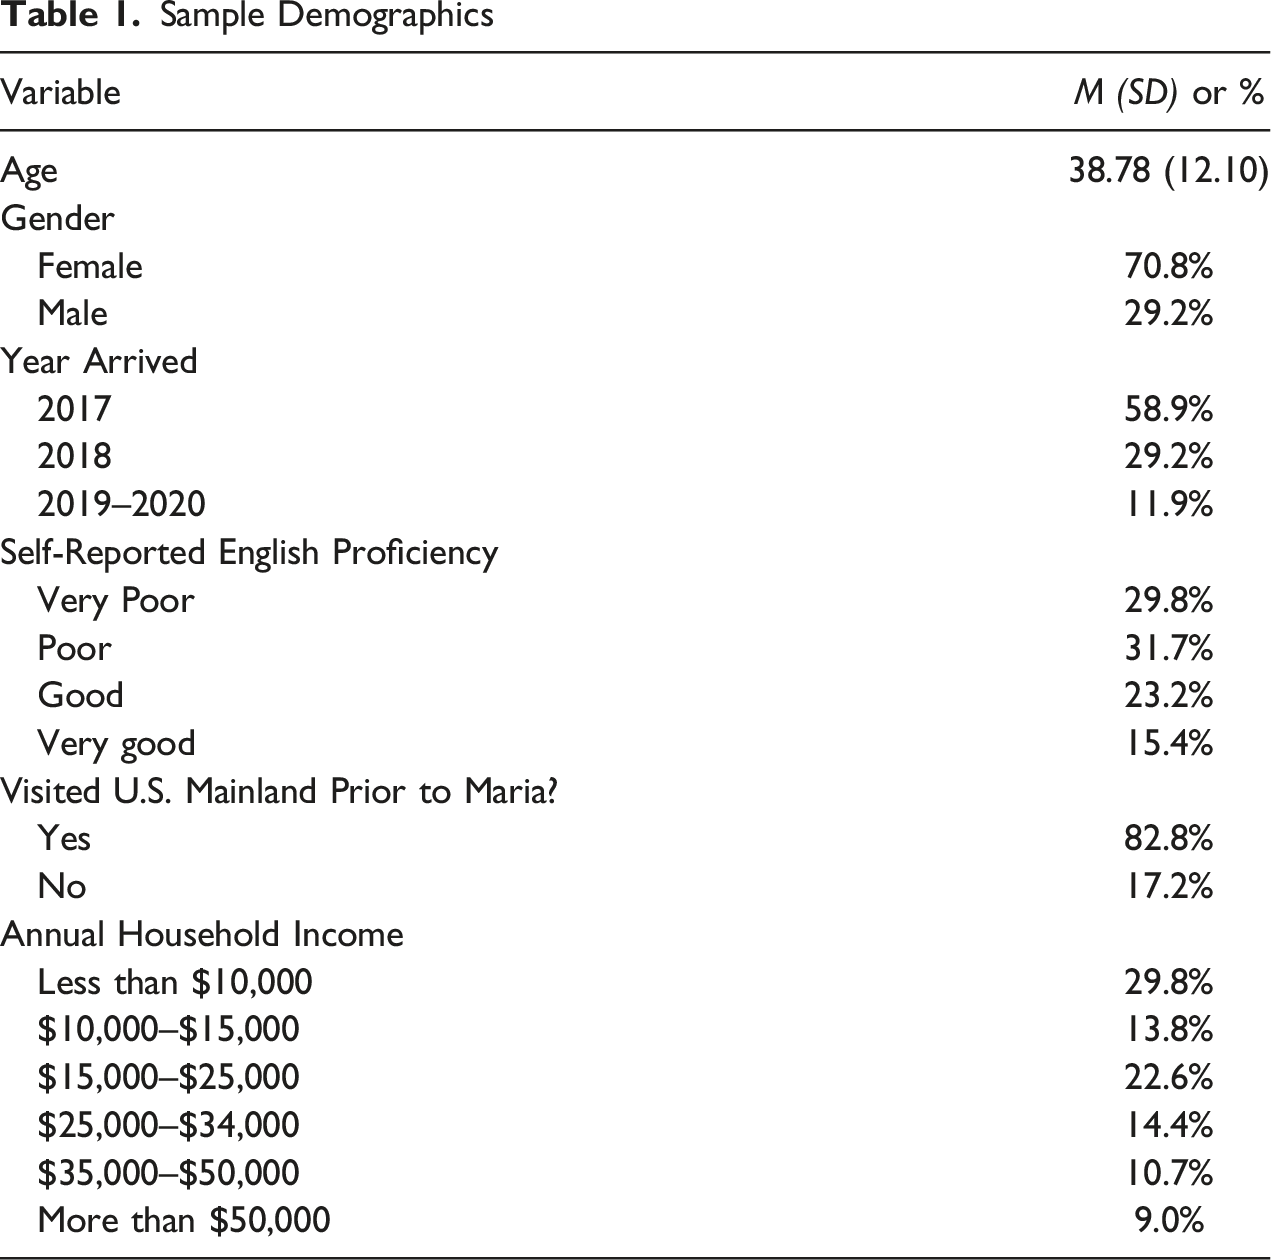
The present study was supported by a grant from the National Institute on Minority Health and Health Disparities. Participants in the present study were 319 adult Hurricane Maria survivors (92 men, 227 women; mean age 38.7 years, range 18–77) residing on the U.S. mainland. Across standard age groupings, 25% of participants, ages 18–29 years, were emerging adults (Arnett, 2000), 48% of participants, ages 30–45 years, were established adults (Mehta et al., 2020), and 27% of participants, ages 46 years and older, were midlife and older adults. In terms of year of arrival, 59.3% of participants arrived on the U.S. mainland in 2017, 29.2% in 2018, 6.3% in 2019, and 3.8% in 2020. Participants were recruited using respondent-driven sampling strategies, where initial seed participants are referred through community partners, and participants refer other participants to the study in exchange for additional compensation (Heckathorn, 2002). Participants were compensated $100 for completing the study measures, and an additional $30 per successful referral (i.e., referred participant who joined the study). Each participant was allowed to refer up to five additional participants. Although the incentives provided may appear high, this amount was determined in consultation with our community partner José Rodriguez, with individuals from the Hurricane Maria survivor community in Central Florida and elsewhere on the U.S. mainland, and with our Community Advisory Board, which includes several Puerto Ricans residing on the U.S. mainland.
The majority of participants (75.3%) were living in Central Florida, primarily Orlando (41.9%) and Kissimmee (20.8%), at the time of data collection. Participants also were referred or recruited from Texas (6.3%), the New England states (3.8%), Illinois (3.2%), Delaware (1.9%), South Carolina (1.9%), and other U.S. locations (7.6%).
We used completion times to identify participants who may have responded carelessly. The average completion time for the full assessment battery was 40 minutes, but eight respondents completed the battery in under 10 minutes. We used Cronbach’s alpha across item responses on each measure to check for inconsistent responding. Cronbach’s alphas were above .95 for those participants who completed the battery in under 10 minutes, but were below .90 for all other participants. These eight participants were therefore removed from the sample and were not included in the analyses reported here. Model fit was essentially the same with versus without data from these participants.
Procedures
Data were collected between August 2020 and October 2021. Because data collection took place during the COVID-19 pandemic, all data collection activities occurred virtually. Participants were recruited in partnership with our community partner organization in Central Florida, and via peer referrals from existing participants. Research team members, along with assessors working in the local community, distributed flyers and recruited eligible participants to enroll in the study. Anyone who was a Hurricane Maria survivor and was 18 or older was eligible to take part in the study. Individuals who agreed to participate were consented and enrolled to receive their surveys via email. If requested, study staff members were available to troubleshoot technical difficulties with the online survey. The survey was available in both English and Spanish, however, all participants completed it in Spanish. The Spanish version has been validated in our prior work with this measure (Salas-Wright, Oh et al., 2021; Schwartz et al., 2014).
Participants were asked where in Puerto Rico they came from and for their month and year of arrival on the United States mainland. They also were asked about property damage and physical dangers during the storm, as well as frequency of contact with friends and family on the island. Although non-Puerto Ricans could conceivably have completed these items as well, they would likely not have found these questions to be relevant or interesting.
Measures
Self-Reported Spoken English Proficiency
Self-reported spoken English proficiency was assessed using the question “How well do you think your spoken English is?” on a 4-point Likert-type scale, ranging from 1 (very poor) to 4 (very good). In response to this question, 29.8% characterized their spoken English as very poor, 31.7% as poor, 23.2% as good, and 15.4% as very good. For the purposes of invariance testing across English fluency, we dichotomized participants’ self-reported spoken English into poor or very poor (61.5% of the sample) versus good or very good (38.6% of the sample).
Negative Context of Reception
Sample Demographics
Discrimination
Discrimination was measured using Phinney, Madden, and Santos’s (1998) seven-item instrument. This measure asks about the frequency of experiences such as being called hurtful names, being followed around a store, and being treated unfairly by employers or other authority figures. Participants were asked how often the event indexed by each item occurred in their lives, on a 5-point Likert-type scale ranging from 1 (not at all) to 5 (almost every day). Items were summed to create a total score. The Cronbach’s alpha coefficient in the present sample was .95.
Language-Related Stress
Language-related stress was assessed using the corresponding 7-item subscale from the Hispanic Stress Inventory (Cervantes et al., 1991). Items referred to feelings and experiences such as being embarrassed about one’s accent when speaking English, having difficulty understanding English speakers, and feeling uncomfortable around people who speak only English. Participants responded to each item using a 5-point Likert-type scale ranging from 1 (strongly disagree) to 5 (strongly agree). Items were summed to create a total score. Cronbach’s alpha in the present sample was .88.
Internalizing Symptoms
We assessed internalizing symptoms in terms of depression and anxiety.
Depressive Symptoms
Depressive symptoms were assessed using the 10-item Boston Form of the Centers for Epidemiologic Studies Depression Scale (Grzywacz et al., 2006). This instrument tapped into symptoms such as listlessness, anhedonia, and lack of interest in activities during the week prior to assessment. Sample items included “I felt like everything I did required a lot of effort.” A 4-point Likert-type response scale was used, ranging from 1 (never/almost never) to 4 (almost always). Item responses were summed to create a total score. Cronbach’s alpha was .83 in the present sample.
Anxiety Symptoms
Anxiety symptoms were assessed using the 7-item Generalized Anxiety Disorder scale (Spitzer et al., 2006). This measure assessed symptoms of anxiety, such as excessive worrying, tension, irritability, and difficulty sleeping during the two weeks prior to assessment. A 4-point Likert-type response scale was used, ranging from 1 (never) to 4 (almost every day). Item responses were summed to create a total score. Cronbach’s alpha was .94 in the present sample.
Optimism
The Revised Life Orientation Test (Scheier et al., 1994) was used to assess optimism. It contains 10-items (3 items worded positively, 3 items worded negatively [reversed items], and 4 items serve as fillers). Sample items included “In uncertain times, I usually expect the best.” Respondents rated each item on a 5-point Likert-type scale ranging from 1 (strongly disagree) to 5 (strongly agree). Items were summed to create a total score. Cronbach’s alpha was .83 in the present sample.
Satisfaction With Life
We used the Satisfaction with Life Scale (Diener et al., 1985) to measure global cognitive judgments of participant’s life satisfaction (e.g., “If I could live my life over, I would change almost nothing”). Participants indicated how much they agreed or disagreed with each of the 5 items using a 7-point Likert-type scale that ranged from 1 (strongly disagree) to 7 (strongly agree). Items were summed to create a total score. Cronbach’s alpha was .88.
Plan of Analysis
The present analyses were conducted in three primary steps. First, we estimated a CFA model with the six negative context of reception items attached to a single factor. Second, we tested the equivalence of this factor across gender, across year of arrival (2017 vs. later), and across self-reported spoken English proficiency (poor or very poor vs. good or very good). Third, using structural equation modeling, we examined the associations of negative context of reception (as a latent variable) with discrimination, language-related stress, internalizing symptoms, optimism, and satisfaction with life. All of these analyses were conducted using a structural equation modeling framework in Mplus release 8 (Muthén & Muthén, 2017). Robust maximum likelihood estimation was used to include all cases in analysis (regardless of whether data were complete or missing) and to adjust for nonnormality. We set the scale of the latent factor by constraining the unstandardized loading for the first indicator to 1.
Results
Descriptive Statistics
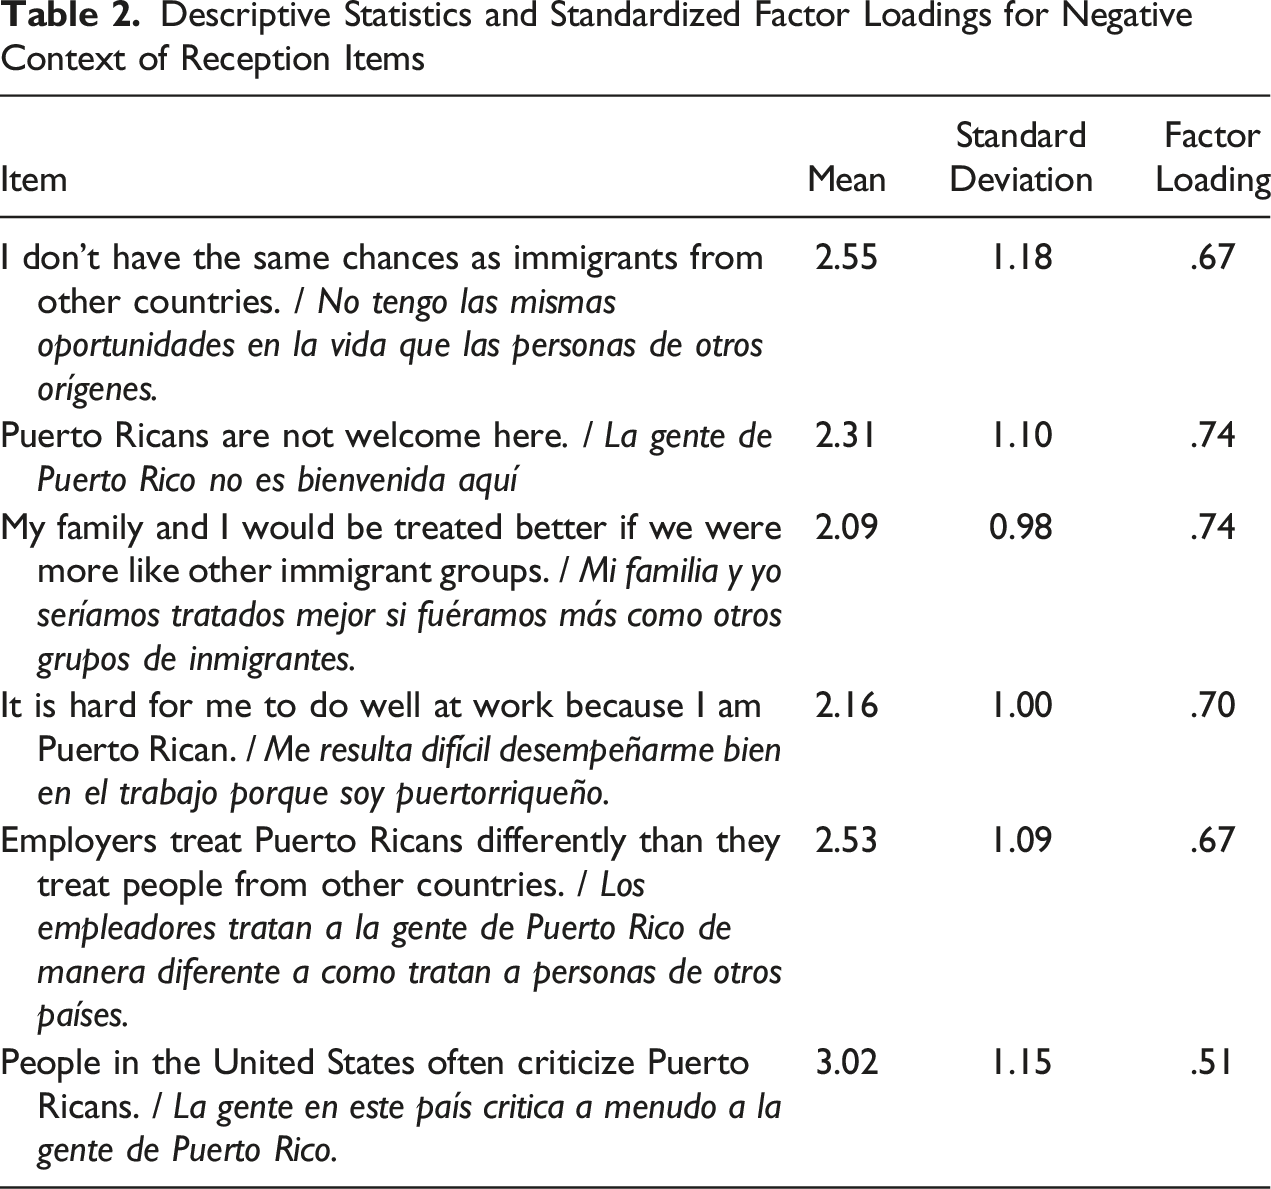
Descriptive Statistics and Standardized Factor Loadings for Negative Context of Reception Items
Invariance Test Results
Confirmatory Factor Analysis
The fit of the CFA model to the data was estimated using two standard fit indices (Kline, 2015)—the comparative fit index (CFI), which reflects the extent to which the fit of the specified model exceeds that of a null model with no paths or latent variables; and the root mean square error of approximation (RMSEA), which represents the extent to which the covariance structure implied by the model deviates from the covariance structure observed in the data. The RMSEA also provides a 90% confidence interval and a probability that the population value is below .05 (Hancock & Freeman, 2001). Generally, excellent model fit is characterized as CFI ≥ .95 and RMSEA ≤ .05, and adequate fit is characterized as CFI ≥ .90 and RMSEA ≤ .08 (Brown, 2014). The chi-square value is reported, but is not used in interpretation because it tests the null hypothesis of perfect model fit, which is generally not tenable (Steiger, 2007). Instead, we used the robust maximum likelihood estimator, which adjusts for the effects of nonnormality (Satorra & Bentler, 2001).
We included one correlation between residual error terms as per model modification indices (an item referring to employers treating people differently because they are Puerto Rican with an item referring to U.S. residents criticizing Puerto Ricans). Both of these items involved explicit, verbal criticism of Puerto Ricans, and therefore a correlation might be expected between responses to these items. The resulting model fit the data adequately, χ2(8) = 18.44, p = .018; CFI = .975; RMSEA = .064 (90% CI = .025 to .103, close fit probability = .234). Without this error correlation, the model fit was not adequate, χ2(9) = 51.46, p < .001; CFI = .899; RMSEA = .122; and the model fit improved significantly when this error correlation was added, Δχ2(1) = 51.46, p < .001; ΔCFI = .076; ΔRMSEA = .058. As reported in Table 1, standardized factor loadings ranged from .51 to .74 (M = .67), all ps < .001. Removing the item referring to people in the United States criticizing Puerto Ricans results in improved model fit, χ2(5) = 3.74, p = .59; CFI = 1.00; RMSEA < .001. However, because the Negative Context of Reception Scale has been validated and used with other populations, we do not necessarily recommend removing this item.
Invariance Testing
As a next step of analysis, we examined the extent to which the factor structure of scores generated by the Negative Context of Reception Scale would be consistent across gender, age group, year of arrival (2017 vs. 2018–2020), and self-reported English proficiency (good or very good vs. poor or very poor). We classified participants into the three age groups noted earlier—emerging adults (ages 18–29 years), established adults (ages 30–45 years), and midlife and older adults (ages 46 years and above). We examined the consistency of the factor structure across these groupings using invariance analyses, which ascertained the extent to which (a) factor loadings and (b) item intercepts are equivalent across groups. Generally, factor loadings (metric invariance) are examined first, followed by item intercepts (scalar invariance), and latent mean comparisons.
To conduct these invariance analyses, we followed three steps (Putnick & Bornstein, 2016), using the invariance testing macro in Mplus. First, to test the assumption of configural invariance, which signifies that the same factor structure fits the data across groups, we estimated a multigroup model with no constraints applied between groups. If this model met criteria for acceptable fit, then configural invariance was assumed. Second, to evaluate the assumption of metric invariance (equal factor loadings across groups), we compared the configural invariance model to a metric invariance model, with each loading constrained equally across groups. Loadings that were significantly different across groups were allowed to vary between groups within subsequent stages of invariance testing. Provided that the majority of factor loadings were equivalent across groups, we then proceeded to test for scalar invariance, which assumed that both factor loadings and item intercepts were equivalent between groups. Testing for scalar invariance requires comparing the metric invariance model (with nonequivalent loadings allowed to vary between groups) to a more restrictive scalar invariance model (with item intercepts, as well as factor loadings, constrained equally across groups). As with factor loadings, item intercepts found to be noninvariant across groups were allowed to vary across groups in subsequent invariance testing stages.
The final step of invariance testing involved comparing latent means across groups. Latent mean comparisons are more powerful and accurate than methods that use observed scores (such as t tests and analyses of variance) because latent mean comparisons allow for noninvariant factor loadings and intercepts to be freed across groups, and because latent variable modeling removes measurement error from the mean comparison (Hancock et al., 2000). Within latent mean comparisons, one group was designated as the reference category, and the mean for that group was fixed to zero. The mean for each additional group was then compared against the reference group mean, using Cohen’s d as an effect size (Cohen, 1988).
To calculate power for these invariance tests, we used the semPower package in R (Moshagen & Erdfelder, 2016). We conducted both a priori (sample size needed) and post hoc (observed power) power analyses using our observed factor loadings, means, and residual variances as population estimates. The semPower package uses the noncentral chi-square distribution to determine the amount of power present given a specific sample size and effect size or to determine the sample size necessary to detect a given sample size with a specified level of Type I and Type II error risk. Our posthoc power calculations indicated that, given the group sizes available in our sample, we had greater than 99% power to detect noninvariance if it were to be present in our data. A priori power analyses indicated that, to obtain 80% power to detect lack of invariance, we would need 24 men and 58 women (for invariance across gender); 16 emerging adults, 29 established adults, and 16 midlife and older adults (for invariance across age group); 52 individuals arriving in 2017 and 38 arriving in 2018–2020 (for invariance across year of arrival); and 44 poor or very poor and 29 good or very good English speakers (for invariance across self-reported English proficiency). Our observed sample sizes all exceeded these values.
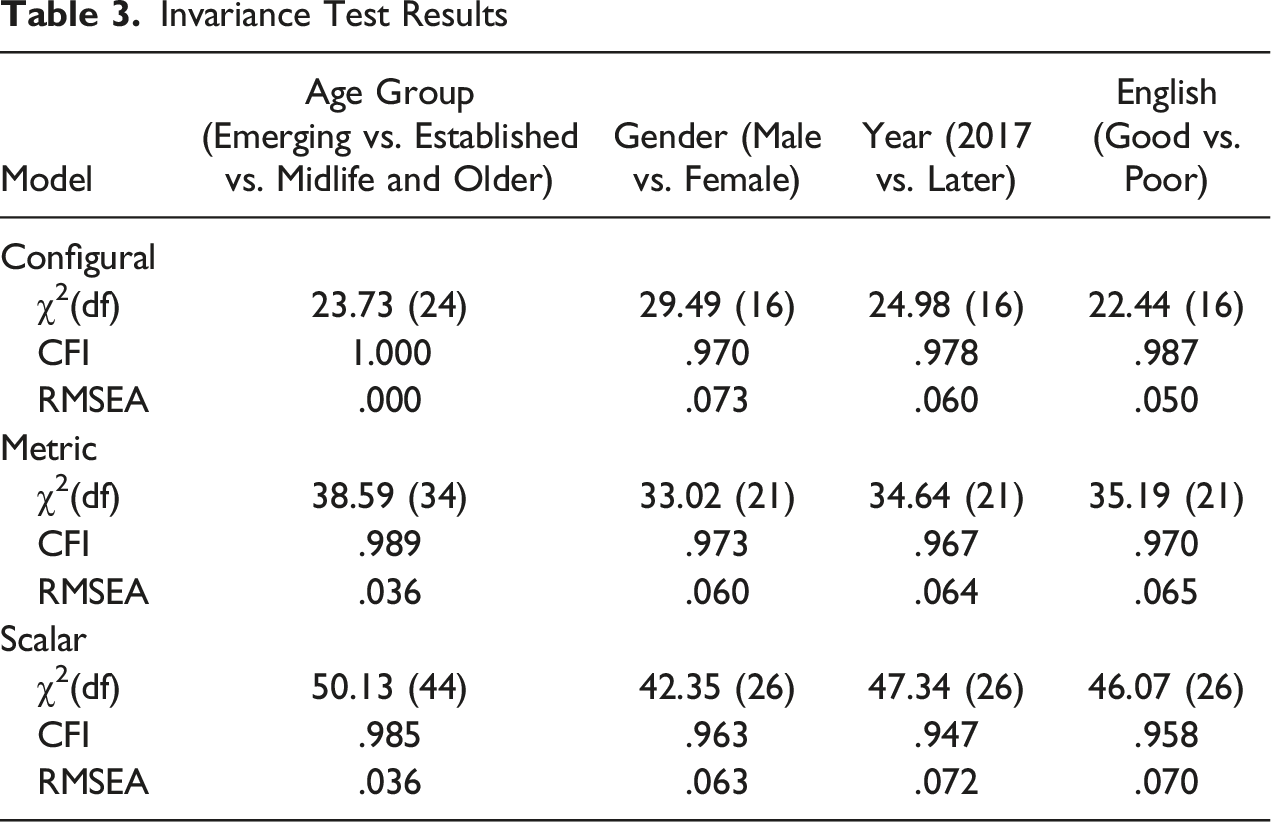
To test the hypotheses of both metric and scalar invariance, we compared the fit of the unconstrained model with all factor loadings or item intercepts that were free to vary across groups to the fit of a constrained model, with each factor loading set equal across groups. Model comparisons were conducted using the chi-square difference test (Δχ2), the difference in CFI values between models (ΔCFI), and the difference in RMSEA values between models (ΔRMSEA). A significant chi-square difference value, coupled with a difference of at least .01 between the CFI and/or RMSEA values for the constrained and unconstrained models, signaled the presence of noninvariance in factor loadings or item intercepts across groups (Putnick & Bornstein, 2016). The next step was then to return to the fully unconstrained model and constrain one loading or intercept at a time. Specific loadings or intercepts identified as significantly different (using the same criteria used to test for invariance in the model as a whole) were then flagged and left unconstrained in subsequent analyses. See Table 4 for a summary of the invariance test results.
Metric invariance analyses indicated that factor loadings were equivalent across gender, Δχ2(5) = 5.97, p = .30; ΔCFI = .003; ΔRMSEA < .001. However, there appeared to be some noninvariance in factor loadings across age group, Δχ2(10) = 16.10, p = .10; ΔCFI = .011; ΔRMSEA = .036, across year of arrival, Δχ2(5) = 13.64, p = .018; ΔCFI = .011; ΔRMSEA = .004, and across English proficiency, Δχ2(5) = 14.21, p = .014; ΔCFI = .017; ΔRMSEA = .015. Follow-up analyses indicated Item 1 (“I don’t have the same chances as immigrants from other countries”) as the source of the noninvariance across both age group and year of arrival. The factor loading for this item was λ = .57 for emerging adults, but λ = .76 for established adults and λ = .71 for midlife and older adults. For individuals who arrived in 2018–2020, this item loaded less strongly (λ = .62) than it did for individuals arriving in 2017 (λ = .72). For English proficiency, follow-up analyses indicated Item 3 (“My family and I would be treated better if we were more like other immigrant groups”) as the source of the noninvariance. The loading for this item was .69 for participants who identified their English proficiency as good or very good, but .82 for participants who identified their English proficiency as poor or very poor. Nonetheless, both of these loadings were high across years of arrival and across levels of self-reported English proficiency.
In terms of scalar invariance, significant chi-square difference values, and nontrivial differences in CFI values, between the metric and scalar invariance models indicated that item intercepts were significantly different across gender, Δχ2(5) = 13.41, p = .02; ΔCFI = .010; ΔRMSEA = .003; year of arrival, Δχ2(5) = 26.26, p < .001; ΔCFI = .026; ΔRMSEA = .006; and self-reported English proficiency, Δχ2(5) = 11.45, p = .043; ΔCFI = .012; ΔRMSEA = .005. The assumption of scalar invariance was retained for comparisons across age group, Δχ2(10) = 11.60, p = .31; ΔCFI = .004; ΔRMSEA < .001. No one intercept appeared to be responsible for the lack of invariance for either gender or year of arrival. For self-reported language proficiency, the intercept for the item referring to “not being able to get a good job because of where one is from” was significantly higher in the low proficiency group (ν = 2.32) than in the high proficiency group (ν = 0.87). As a result, we concluded that our results suggested partial metric and scalar invariance across gender, year of arrival, and self-reported English proficiency.
We then conducted latent mean comparisons across gender and year of arrival. Within latent mean comparisons, the final partial metric and scalar invariance model was retained, and latent means and variances were estimated for each group (Hancock et al., 2000). These latent means and variances were then used to compute t values and Cohen’s d effect sizes for each potential group comparison. Results indicated no significant differences in mean negative context of reception scores across year of arrival, t(317) = 0.09, p = .92, d = .01. Similarly, men and women did not differ significantly on negative context of reception, t(314) = 0.19, p = .85, d = .02. Emerging adults did not differ from either established adults, t(222) = 0.30, p = .76, d = .05, or midlife and older adults, t(162) = 0.64, p = .54, d = .13, on negative context of reception. However, the latent mean for negative context of reception was significantly greater among the low-proficiency individuals than among the high-proficiency individuals, t(317) = 2.85, p = .004, d = .46.
Associations With Other Cultural Stressors and Mental Health Indicators
As a final step in the analysis, we estimated a model correlating the negative context of reception factor with observed scores for perceived discrimination, language-related stress, depressive symptoms, anxiety, optimism, and life satisfaction. In this model, negative context of reception was operationalized as a latent variable with each item specified as a separate indicator. Supplemental Tables S1 through S6 present the correlations among the variables in this model (the six negative context of reception item responses as well as observed scores for perceived discrimination, language-related stress, depressive symptoms, anxiety, optimism, and life satisfaction). These correlations represent the input matrix for the model.
The resulting model fit the data adequately, χ2(43) = 130.45, p < .001; CFI = .930; RMSEA = .080 (90% CI = .064 to .096). In terms of other cultural stressors, the negative context of reception factor was significantly and positively related to perceived discrimination (r = .67, p < .001) and language stress (r = .47, p < .001). In terms of psychosocial outcomes, the negative context of reception factor was positively related to depressive symptoms (r = .31, p < .001) and anxiety (r = .28, p < .001), and negatively related to optimism (r = −.33, p < .001) and life satisfaction (r = −.20, p = .002). The full set of correlations is provided in Table 4.
Discussion
Correlations Among Study Variables
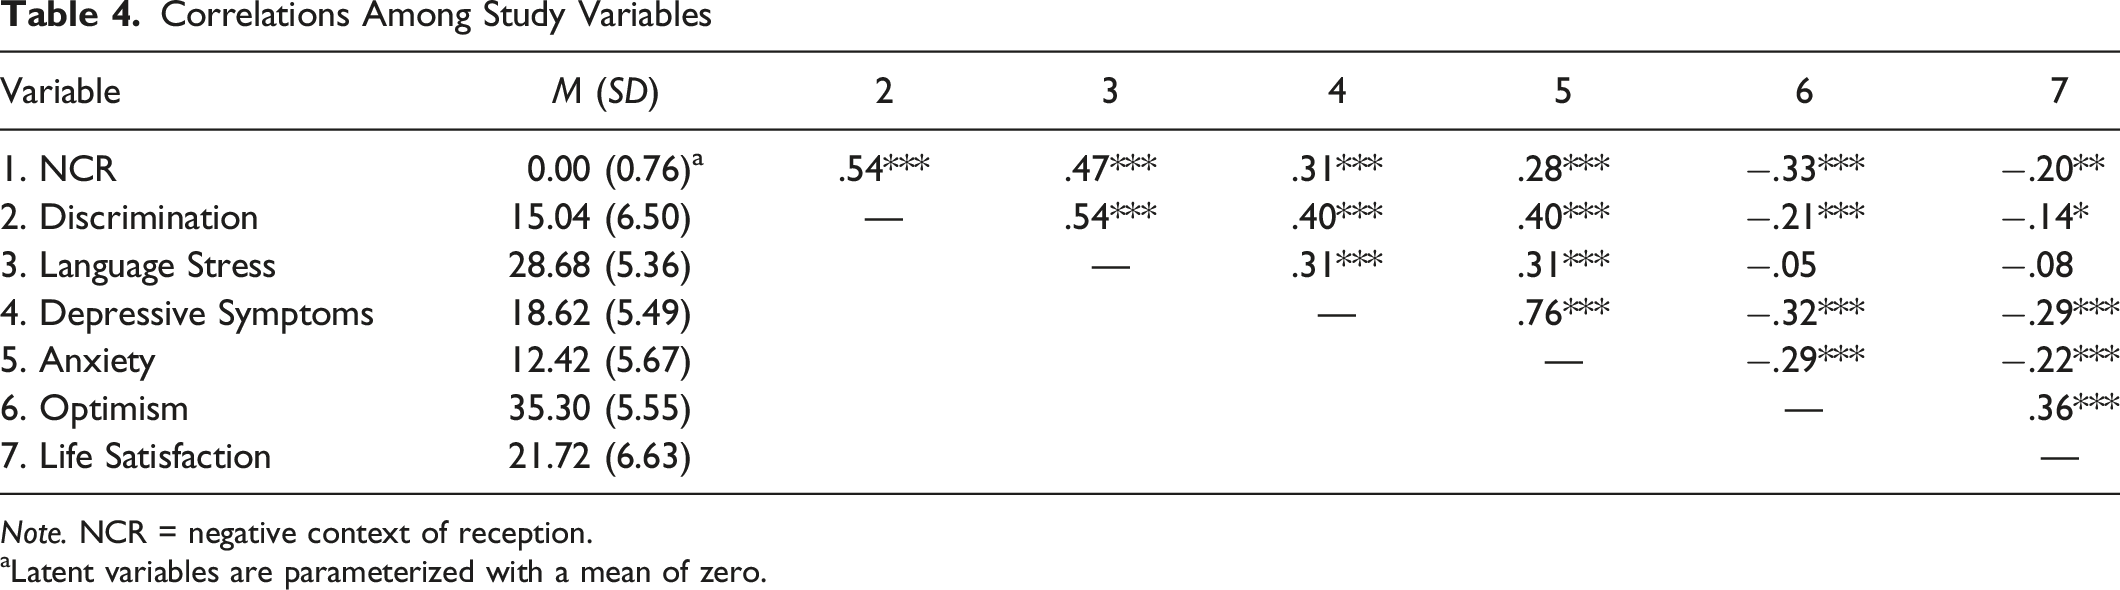
Note. NCR = negative context of reception.
aLatent variables are parameterized with a mean of zero.
For the most part, within our sample, negative context of reception appears to carry the same meaning, and to be endorsed to a similar extent between men and women, across year of arrival, and across levels of self-reported English proficiency. As expected, negative context of reception was closely related to perceptions of discrimination and to language-related stressors—these three variables (among others) have been classified under the heading of cultural stressors (Salas-Wright, Oh et al., 2021; Salas-Wright & Schwartz, 2019). Accordingly, negative context of reception was positively linked with depressive symptoms and anxiety, and negatively related to optimism and life satisfaction. These associations suggest that Puerto Rican Hurricane Maria survivors perceiving a more negative context of reception would be likely to report greater degrees of distress and lower levels of well-being.
On average, our sample endorsed most of the negative context of reception items, with mean scores between 2 and 3 on a 1–5 scale, suggesting somewhat mild perceptions of a negative context of reception. Indeed, only 9.2% of the sample provided item means above 3.5. However, participants more strongly endorsed the item asking whether people in the U.S. criticize Puerto Ricans, suggesting that exposure to negative comments about Puerto Ricans may be somewhat common in the communities where our participants resided. Further, the items on our scale imply that the negative context of reception that one experiences is created by native-born U.S. residents, and do not assess the extent to which other migrants (including Puerto Ricans who settled in participants’ communities prior to the hurricane) might serve as the source of the negative context. Qualitative evidence (Clark-Ginsberg et al., 2023) suggests that Puerto Ricans who established ethnic communities in Orlando and Kissimmee during the 1990s, and during the “brain drain” from the island beginning in 2006, may have been somewhat unwelcoming to the hurricane survivors. It is therefore important to develop measures of context of reception that focus specifically on ostracism from other Hispanic groups, and from other members of one’s own group.
Our finding that context of reception can be assessed among Puerto Ricans implies that U.S. citizenship likely does not protect this group from ostracism following their arrival on the U.S. mainland. Indeed, a number of scholars (e.g., Llórens, 2018; Pantojas-García, 2005; Villanueva, 2019) have observed that Puerto Ricans on the U.S. mainland are often treated poorly. Hurricane Maria survivors may have been treated especially poorly—for example, the Federal Emergency Management Agency (FEMA) placed a number of hurricane survivors into motels for nearly a year after their arrival in Central Florida, and dealings with FEMA created a great deal of stress for these hurricane survivors (Clark-Ginsberg et al., 2021). Given this contextual information about the federal and local response to the hurricane survivor migration, it is surprising—and heartening—that, on average, the individuals in our sample viewed their context of reception as only mildly negative. The fact that our study was conducted three to four years after the storm may have therefore allowed participants’ views of their contexts of reception to improve.
In terms of counseling practice, the present results suggest that the Negative Context of Reception Scale is appropriate for use with Puerto Ricans and may serve as a valid and reliable screening tool for practitioners working with migrants from the island. Our sample of Hurricane Maria survivors, as well as the links we found between context of reception and psychosocial functioning (depressive and anxiety symptoms, optimism, and life satisfaction) further suggest that the scale may be useful in working with Puerto Ricans who have experienced traumatic events such as major hurricanes. Further, in accordance with cultural stress theory and with our present findings, elevated scores on negative context of reception may also indicate experiences of discrimination and difficulties learning English. Counselors may therefore address a range of culturally stressful experiences based on individuals’ negative context of reception scores.
Limitations
The present results should be interpreted in light of at least six important limitations. First, the cross-sectional design that we used does not permit us to draw directional conclusions regarding the associations between negative context of reception and psychosocial functioning. We also do not know whether perceptions of a negative context of reception would increase or decrease as more time passed since the hurricane. Longitudinal designs are needed to answer these types of questions.
Second, although the goal of the present study was to validate a self-report measure, qualitative data would have helped us to understand participants’ responses in context. For example, we do not know how participants would have responded had we asked them about the extent to which they perceived a negative context of reception from other Puerto Ricans, other Hispanic nationalities, or other ethnic minority groups (e.g., African Americans). A tacit assumption in cultural stress research—and in the measures used in such research—is that ethnic-majority host nationals serve as the source of cultural stress. As more and more communities become increasingly diverse and “majority–minority” (van Oudenhoven & Ward, 2013), migrants are likely to interact with other migrant groups, and with other ethnic minority groups in general, as well as with majority-group members. Cultural stress measures should therefore be adapted to reflect this reality.
Third, the fact that our data were collected three to four years after the hurricane is both a strength and a limitation. The lagged data collection was a strength in that participants had sufficient time to adjust to their new communities and to appraise their contexts of reception on a long-term basis. We also were able to sample hurricane survivors who arrived between 2017 and 2020, which would not have been possible had we conducted our study immediately after the storm. However, the lagged data collection may also be a weakness because the initial reception that participants experienced upon arrival had likely faded by the time they completed our measures, and as a result, we do not know whether participants were assessing their current context of reception or recalling the context of reception they encountered upon arrival. Again, qualitative data would have helped to clarify the specific referent and time period for participants’ context of reception ratings.
Fourth, we used self-reported English proficiency rather than assessing English ability directly (such as attempting to hold an English-language conversation with each participant). There is evidence that self-reports of spoken language proficiency are highly accurate in most situations (Rosenthal et al., 2011). Nonetheless, given that we sought to examine the equivalence of psychometric properties of scores generated by our negative context of reception measure across levels of English proficiency, assessing such proficiency directly would have represented a more rigorous approach.
Fifth, the overrepresentation of women and of individuals arriving in 2017 and early 2018 may have introduced some bias into our results. Although Hurricane Maria migrants as a whole were fairly balanced by gender (Alexander et al., 2019), the participants referred to us through our community partners, and through referrals from other participants, were primarily women. In terms of year of arrival, Alexander et al. (2019) found that the majority of the migration occurred in the first few months following the storm, with migrants beginning to return to the island in early 2018. As a result, the distribution of years of arrival in our sample likely reflects the distribution in the population. It is important to note, however, that because Puerto Rican migrants are U.S. citizens and can migrate freely between the island and the mainland, there is no official documentation regarding who has migrated and where they are residing. As a result, recruiting a population-based sample of Hurricane Maria survivors on the U.S. mainland is likely extremely difficult, if not impossible. Nonetheless, the imbalance between women and men within our sample is clearly a limitation.
Finally, the need for a residual correlation between responses to two of the six scale items may, to some extent, complicate the scoring of the Negative Context of Reception Scale with Hurricane Maria survivors. Bandalos (2021) notes that correlated residuals may result both from similarities in meaning between and among items, as well as from items similar in wording or meaning appearing close together on the scale. In the version we administered, the items requiring a residual correlation appeared directly next to one another. It may therefore behoove researchers and practitioners using this scale with Hurricane Maria survivors to separate these items from each other.
Implications for Practice, Advocacy, Education and Training, and Research
Despite these and other limitations, the present findings have important implications for practice, advocacy, education and training, and research. For practice, it may be important for counselors to screen Hurricane Maria survivors (as well as survivors of other natural disasters who then migrated to the U.S. mainland) for negative context of reception. Evidence from other Hispanic groups, including Venezuelans (Salas-Wright, Oh et al., 2021), as well as Mexicans and Cubans (Schwartz et al., 2015), suggest that migrants who perceive their receiving context as negative are also likely to report elevated symptoms of depression and anxiety. Among Hurricane Maria survivors specifically, such perceptions also may be likely to exacerbate the association between hurricane trauma and internalizing symptoms (Schwartz, Montero-Zamora, et al., 2022). Identifying perceptions of a negative context of reception, then, may be helpful in guiding counselors toward a potential trigger for depression and anxiety symptoms. It also may be possible to use the Negative Context of Reception Scale to examine the extent to which specific experiences (such as being fired from a job, treated with suspicion by neighbors, or ignored in restaurants or stores) may trigger feelings of being marginalized or dismissed—with the assumption that such feelings may be linked with psychological symptoms. Further, given the potential for negative context of reception—along with other cultural stressors—to compromise parenting (Lorenzo-Blanco et al., 2016), clients with children should be screened for negative context of reception so that its potential effects on parenting can be addressed as part of treatment.
For advocacy, it may be essential to work at the structural level to decrease host-national responses to Puerto Rican migration which may then lead migrants to feel unwelcome or shut out. The second-class status of Puerto Ricans on the U.S. mainland may be rooted, at least to some extent, in perceived realistic (e.g., seeing migrants as competition for jobs and housing) and symbolic (e.g., seeing migrants and their cultural customs as overtaking “American” culture and the English language; see Stephan & Stephan, 2000, for a review of these threat types) threats on the part of U.S. host nationals (Acosta-Belén & Santiago, 2018). Silver (2020), in her ethnographic study of the growth of Puerto Rican enclaves in the Orlando and Kissimmee areas of Central Florida, detailed ways in which some White American residents of these areas lobbied local governments to restrict opportunities for Puerto Rican newcomers as a method of limiting these newcomers’ ability to transform the area’s linguistic and cultural landscape. Programs to limit the extent of the threat perceived by host nationals may represent an important way to decrease the degree to which migrants will perceive their receiving context as negative and unwelcoming.
For education and training, the present results might provide a vehicle for supervisors and professors to teach aspiring therapists what negative context of reception is and how to recognize and explore it as part of treatment. When working with Puerto Rican Hurricane Maria survivors who present for mental health services, trainees should be encouraged to screen for negative context of reception and to examine the extent to which such perceptions may be exacerbating the links between hurricane trauma and an individual’s current symptoms. Therapists might also be guided to encourage Hurricane Maria survivor clients (as well as clients who survived other natural and human disasters) to respectfully approach and dialogue with the people who appear to be manifesting the negative context (such as employers, neighbors, and coworkers).
For research, the Negative Context of Reception Scale represents a tool for assessing a key cultural stressor that, along with experiences of discrimination, can marginalize and emotionally harm individuals who have already been traumatized by a natural disaster and subsequent relocation. Indeed, a growing body of work has begun examining discrimination and negative context of reception together (e.g., Salas-Wright, Goings et al., 2021; Schwartz, Montero-Zamora, et al., 2022)—and these variables often both account for significant variability in symptoms of depression and anxiety.
Conclusion
In conclusion, the current results suggest that the Negative Context of Reception Scale provides valid and reliable scores with Puerto Rican Hurricane Maria survivors. Negative context of reception scores were related closely to scores for other cultural stressors and were associated with psychosocial functioning variables in theoretically consistent ways. The scale can be used to examine research questions, and facilitate clinical work related to the intersection of cultural stressors and premigration trauma—and may therefore represent an important tool for use with future climate-driven migrant populations, including those fleeing natural disaster events in Puerto Rico and other U.S. territories. We hope that the present scale validation study will inspire further work in this direction.
Supplemental Material
Supplemental Material - Validating the Negative Context of Reception Scale for Mainland Puerto Ricans
Supplemental Material for Validating the Negative Context of Reception Scale for Mainland Puerto Ricans by Seth J. Schwartz, Mildred M. Maldonado-Molina, Melissa M. Bates, Ivonne Calderón, Maria Fernanda Garcia, Pablo Montero-Zamora, Maria Duque, María Pineros-Leano, Carolina Scaramutti, Eric C. Brown, José E. Rodríguez, and Christopher P. Salas-Wright in The Counseling Psychologist
Footnotes
Funding
The author(s) disclosed receipt of the following financial support for the research, authorship, and/or publication of this article: This work was supported by the Grants MD014694 and MD014694-01S1 from the National Institute on Minority Health and Health Disparities.
Supplemental Material
Supplemental material for this article is available online.
Author Biographies
References
Supplementary Material
Please find the following supplemental material available below.
For Open Access articles published under a Creative Commons License, all supplemental material carries the same license as the article it is associated with.
For non-Open Access articles published, all supplemental material carries a non-exclusive license, and permission requests for re-use of supplemental material or any part of supplemental material shall be sent directly to the copyright owner as specified in the copyright notice associated with the article.