
Abstract
The estimation of wave pressure on structures is complex during tsunami due to its unpredictable velocity and direction which depends on various ocean parameters. In this context, some tsunami mitigation strategy can be adopted, so that damage to structures during tsunami may be minimized. The effectiveness of different opening sizes in buildings to reduce wave pressure is investigated numerically in the present study. These results may also be applicable to simulate the tsunami impact on breakaway wall of a building. The effectiveness in tsunami force reduction is quantified in terms of pressure reduction throughout the building height. Computational fluid dynamics technique is used to analyze the wave impact on buildings. Solitary wave is generated in numerical platform by controlling discharge in a channel inlet. Three-dimensional Reynolds Averaged Navier–Stokes model is used to solve the governing equitation of fluid flow. Realizable k–ɛ turbulence model is applied for turbulence modeling. Multiphase volume of fluid modeling technique is adopted to track the free surface movement and air–water interaction. The tsunami wave characteristics are validated against the internationally reported results. Two types of wave conditions are considered in the study to evaluate the dependence between wave height and pressure on building.
Introduction
Tsunami has a long history of causing devastation throughout coastal regions of many countries. It has drawn the attention from last few years when it showed its strength in some of the worst natural disaster of all times, the 26th Dec. 2004 Great Indian Ocean Tsunami and also damage due to recent 2011 Tohoku Tsunami. Mainly long gravity waves are generated during tsunami by a rapid displacement of a large water body. In most cases, multiple waves are generated and propagate towards the shoreline by either a depression wave or by a wave crest. As the topography near shoreline is different for all the sea, hence it is very difficult to predict the characteristics of a Tsunami. This wave normally breaks into offshore and comes towards land as a broken bore. These bores can pass the shoreline and continue to onshore as destructive wave surges. Estimation of tsunami wave pressure on building is complex because of several unpredictable ocean parameters, however, researchers have tried to calculate and predict wave pressure on different structures1 through experimentation and numerical modeling. Lindt et al.2 calculated the tsunami bore forces on a residential building model. Lukkunaprasit et al.3 studied the effect of tsunami loading on buildings with openings experimentally. The interaction between tsunami bore with cylindrical structure is numerically investigated by Wijatmiko and Murakami.4 Three-dimensional (3D) numerical analysis on deformation of run-up and tsunami force acting on square structures is carried out by Nakamura et al.5 Nistor et al.6 performed experimental and numerical modeling of tsunami loading on structures. The experiment is carried out on vertical cylindrical and rectangular structure and numerical study were reported on cylindrical structures. Rossetto et al.7 and Charvet8 explained the physical modeling of tsunami using an innovative pneumatic wave generator. Smoothed Particle Hydrodynamics method is used by St-germain et al.9 to simulate the tsunami impact on building. Tsunami impact on bridge structures are also investigated by some researchers. Sadia et al.10 carried out experimental study on stability analysis of bridge. Bricker et al.11 analyzed the failure of bridges due to tsunami using CFD. Therefore, there are different developments on tsunami impact on infrastructures.
Multiphase CFD modeling is used to in the present study to calculate the loading on building numerically. A solitary wave is generated in numerical platform by controlling discharge in an inlet of a tsunami channel and wave impact on building model is simulated. Four types of building configuration are considered 1) building without any opening; 2) building with 25% opening; 3) building with 50% opening; and 4) Building with open ground storey. In this study two types of solitary wave are used.
Wave type 1 Wave height (0.135 m or 0.45 H) which is less than the building height (300 mm or H)
Wave type 2 Wave height (0.380 m or 1.27 H) which is more than the building height (300 mm or H) ‘H' is the height of the building.
Numerical modeling
3D Reynolds Averaged Navier–Stokes equations are solved to describe the flow. Realizable k–ɛ turbulence model is employed for the turbulence modeling. In order to simulate two-phase (air and water) flow, volume of fluid (VOF) technique is used. The free surface of wave (air water interface) is detected using this. The pressure-implicit with splitting of operators algorithm is used for pressure velocity coupling. Courant Number is kept below 0.25 to enhance model stability and accuracy. The fluids in both phases are Newtonian, viscous, and isothermal.
Governing equations
VOF modeling
VOF is a surface tracking technique applied to a fixed Eulerian mesh which is generally used for two or more immiscible fluids where the position of the interface between the fluids is of interest.
12
The VOF formulation of the model depends on the fact that air and water are not interpenetrating. A variable is introduced (the volume fraction of the phase in the computational cell) for each air and water. A single set of momentum equations is shared by two fluids, and the volume fraction of each of the fluids in each computational cell is tracked throughout the domain. Since, time-accurate transient behavior of the VOF solution is required to track the free surface motion of water, time dependent with the geometric reconstruction interpolation scheme is used. The VOF formulation depends on the fact that fluids (or phases) are not interpenetrating and in a control volume, the sum of volume fractions of all phases equals to unity. The fields for all variables and properties are shared by the phases and represent volume-averaged values corresponding to the volume fraction of each of the phases at each cell location. Thus, the variables and properties in any given cell are representative of any of the phases or representative of a mixture of the phases, depending upon the volume fraction values. Therefore, if qth fluid’s volume fraction in the cell is denoted as
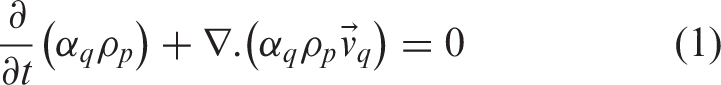
Continuity equation
The continuity equation is solved for the volume fraction of one of the phases to track the interface between the phases. For the qth phase, this equation has the following form

The properties appearing in the transport equations are determined by the presence of the component phases in each control volume. The density in each cell is given by

And the viscosity of each cell is given by

Volumes of fraction equations are evaluated using explicit time discretization scheme. The volume fractions of each phase are interpolated using geometric reconstruction scheme (an interface reconstruction scheme).
The explicit scheme
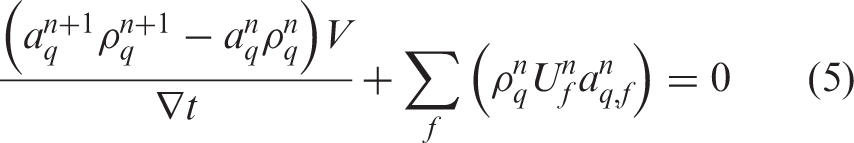
The geometric reconstruction scheme represents the interface between water and air using a piecewise-linear approach where it is assumed that the interface between two fluids has a linear slope within each cell. It uses this linear shape for calculation of the advection of fluid through the cell faces. The first step (reconstruction scheme) is calculation of position of the linear interface relative to the center of each partially filled cell, based on information about the volume fraction and its derivatives in the cell. The second step is calculation of advecting amount of fluid through each face using the computed linear interface representation and information about the normal and tangential velocity distribution on the face. The third step is calculation of volume fraction in each cell using the balance of fluxes calculated in the previous step.
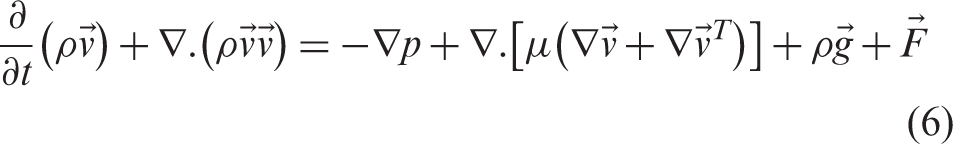
Momentum equation
A single momentum equation is solved throughout the domain, and the resulting velocity field is shared among the phases. The momentum equation is dependent on the volume fractions of all phases through the properties ρ and μ as shown below
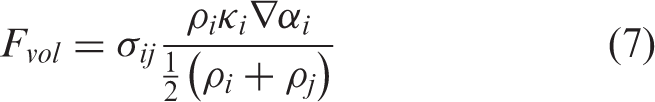
Surface tension
The continuum surface force model proposed by Brackbill et al.
13
has been implemented such that the addition of surface tension to the VOF calculation results in a source term in the momentum equation. Surface tension is expressed as pressure jump across the surface. The force at the surface can be expressed as a volume force using the divergence theorem. The volume force acts as source term in the momentum equation. It has the following form for air and water phase
Turbulence modeling12
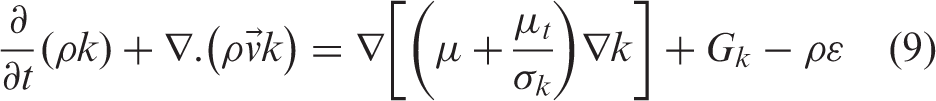
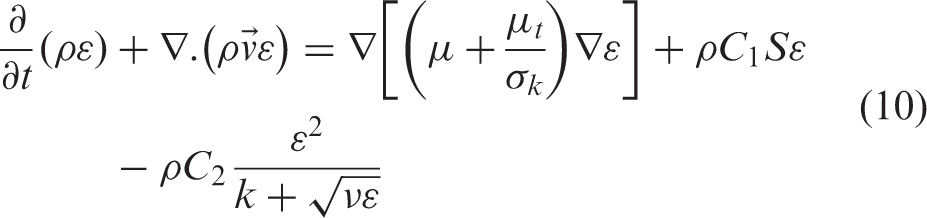
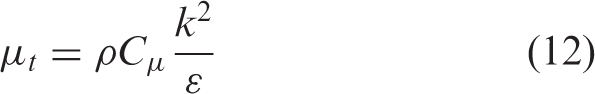
During free surface flows, a high velocity gradient at the interface between the two fluid surface results in high turbulence. Therefore, accurate modeling of turbulence is required. Realizable
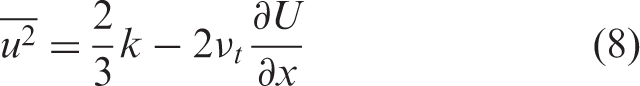
Turbulence kinetic energy
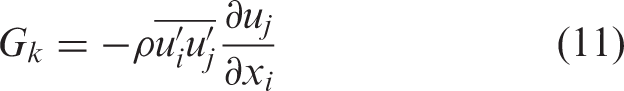
The eddy viscosity is computed from
The model constants are
Geometry
Model and prototype dimensions.
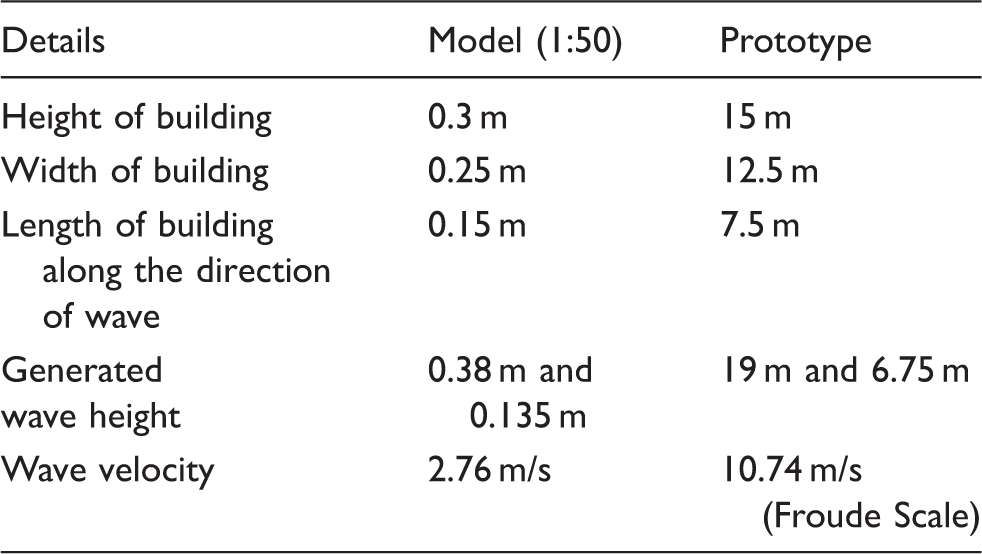
The dimensions of the numerical domain are fixed according to the experimental facility of HR Wallingford, presented by Rossetto et al.
7
The domain size is also optimized for numerical domain requirement. The dimensions of various portion of tank, channel, and building are shown in Figure 1.
Details of numerical domain and its different part name.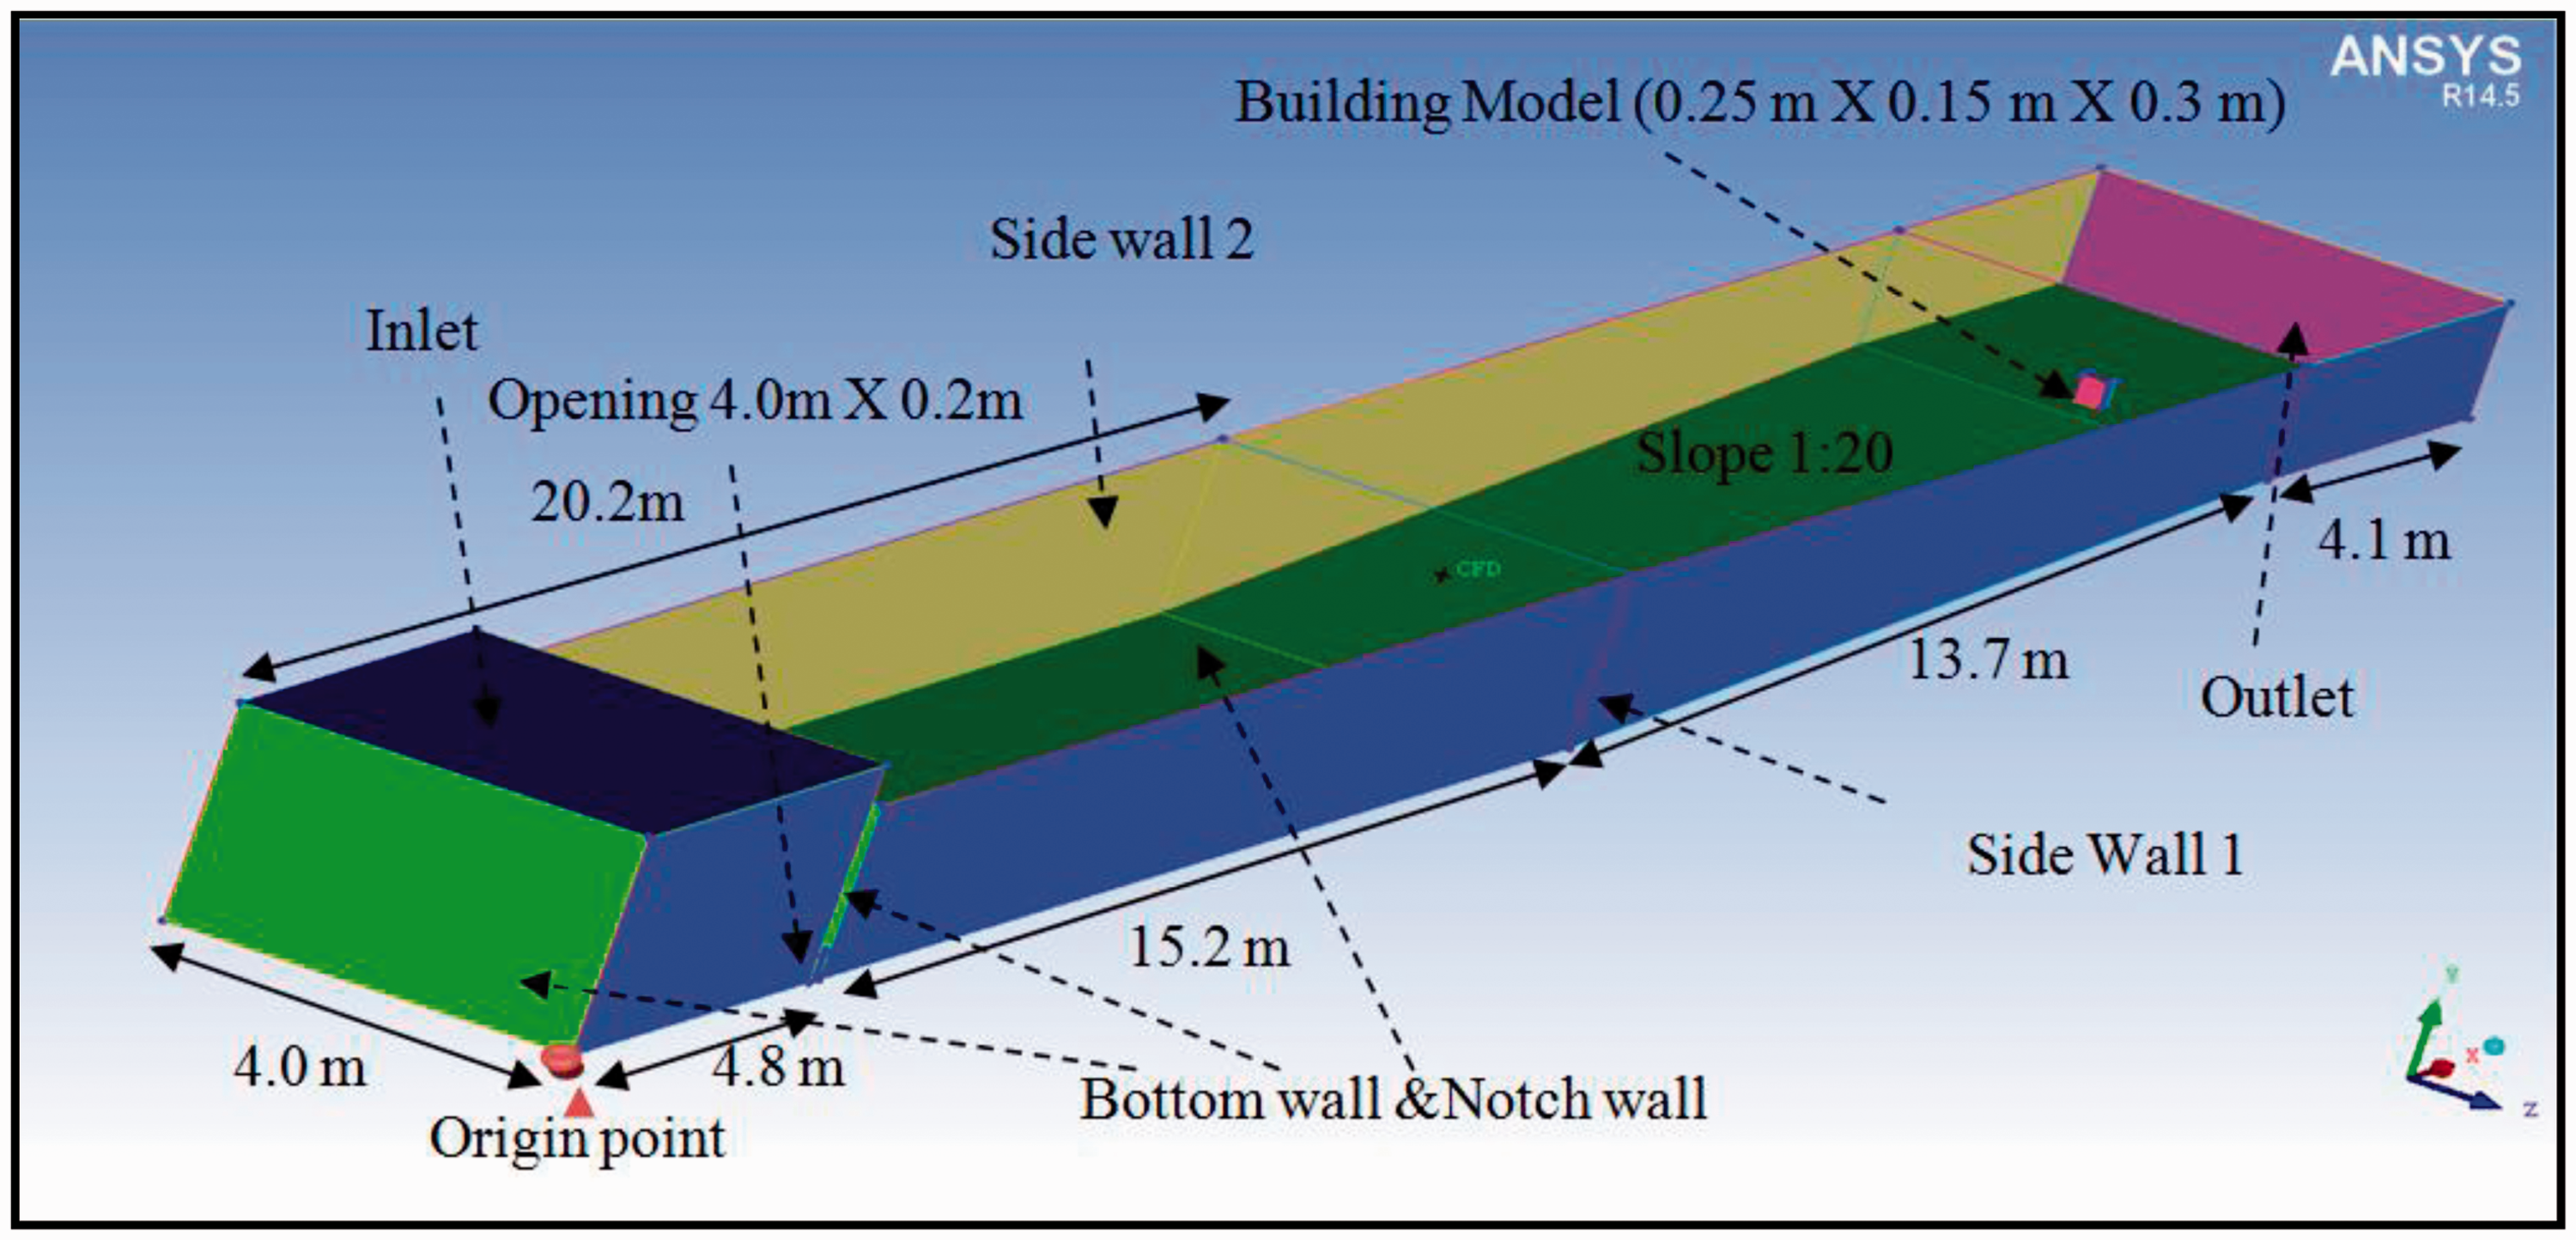
Hexahedral type of mesh of variable sizes is used in entire numerical domain and near wall treatment is provided around all the wall boundaries. The mesh sensitivity study is performed for building without any openings case. The wave profile across 10 m cross-section of the channel is compared for different numbers of cells. Variable sizes of cells are provided in different areas of the domain. Cell sizes near the boundaries are smaller due to near wall requirement. Convergence study provides optimum numbers of cell sizes at different location of the computational domain. Wave height variation of 1% is observed for numbers of cells beyond 12 × 106. The effect of finer mesh is not observed significantly. Therefore, approximately 12 × 106 numbers of cells are employed for the creation of each numerical domain. The building opening configuration, employed in the present study is shown in Figure 2. Mesh refinement near the building walls can be observed in the figure.
(a) Building without any opening, (b) building with 25% opening, (c) building with 50% opening, and (d) building with open ground storey.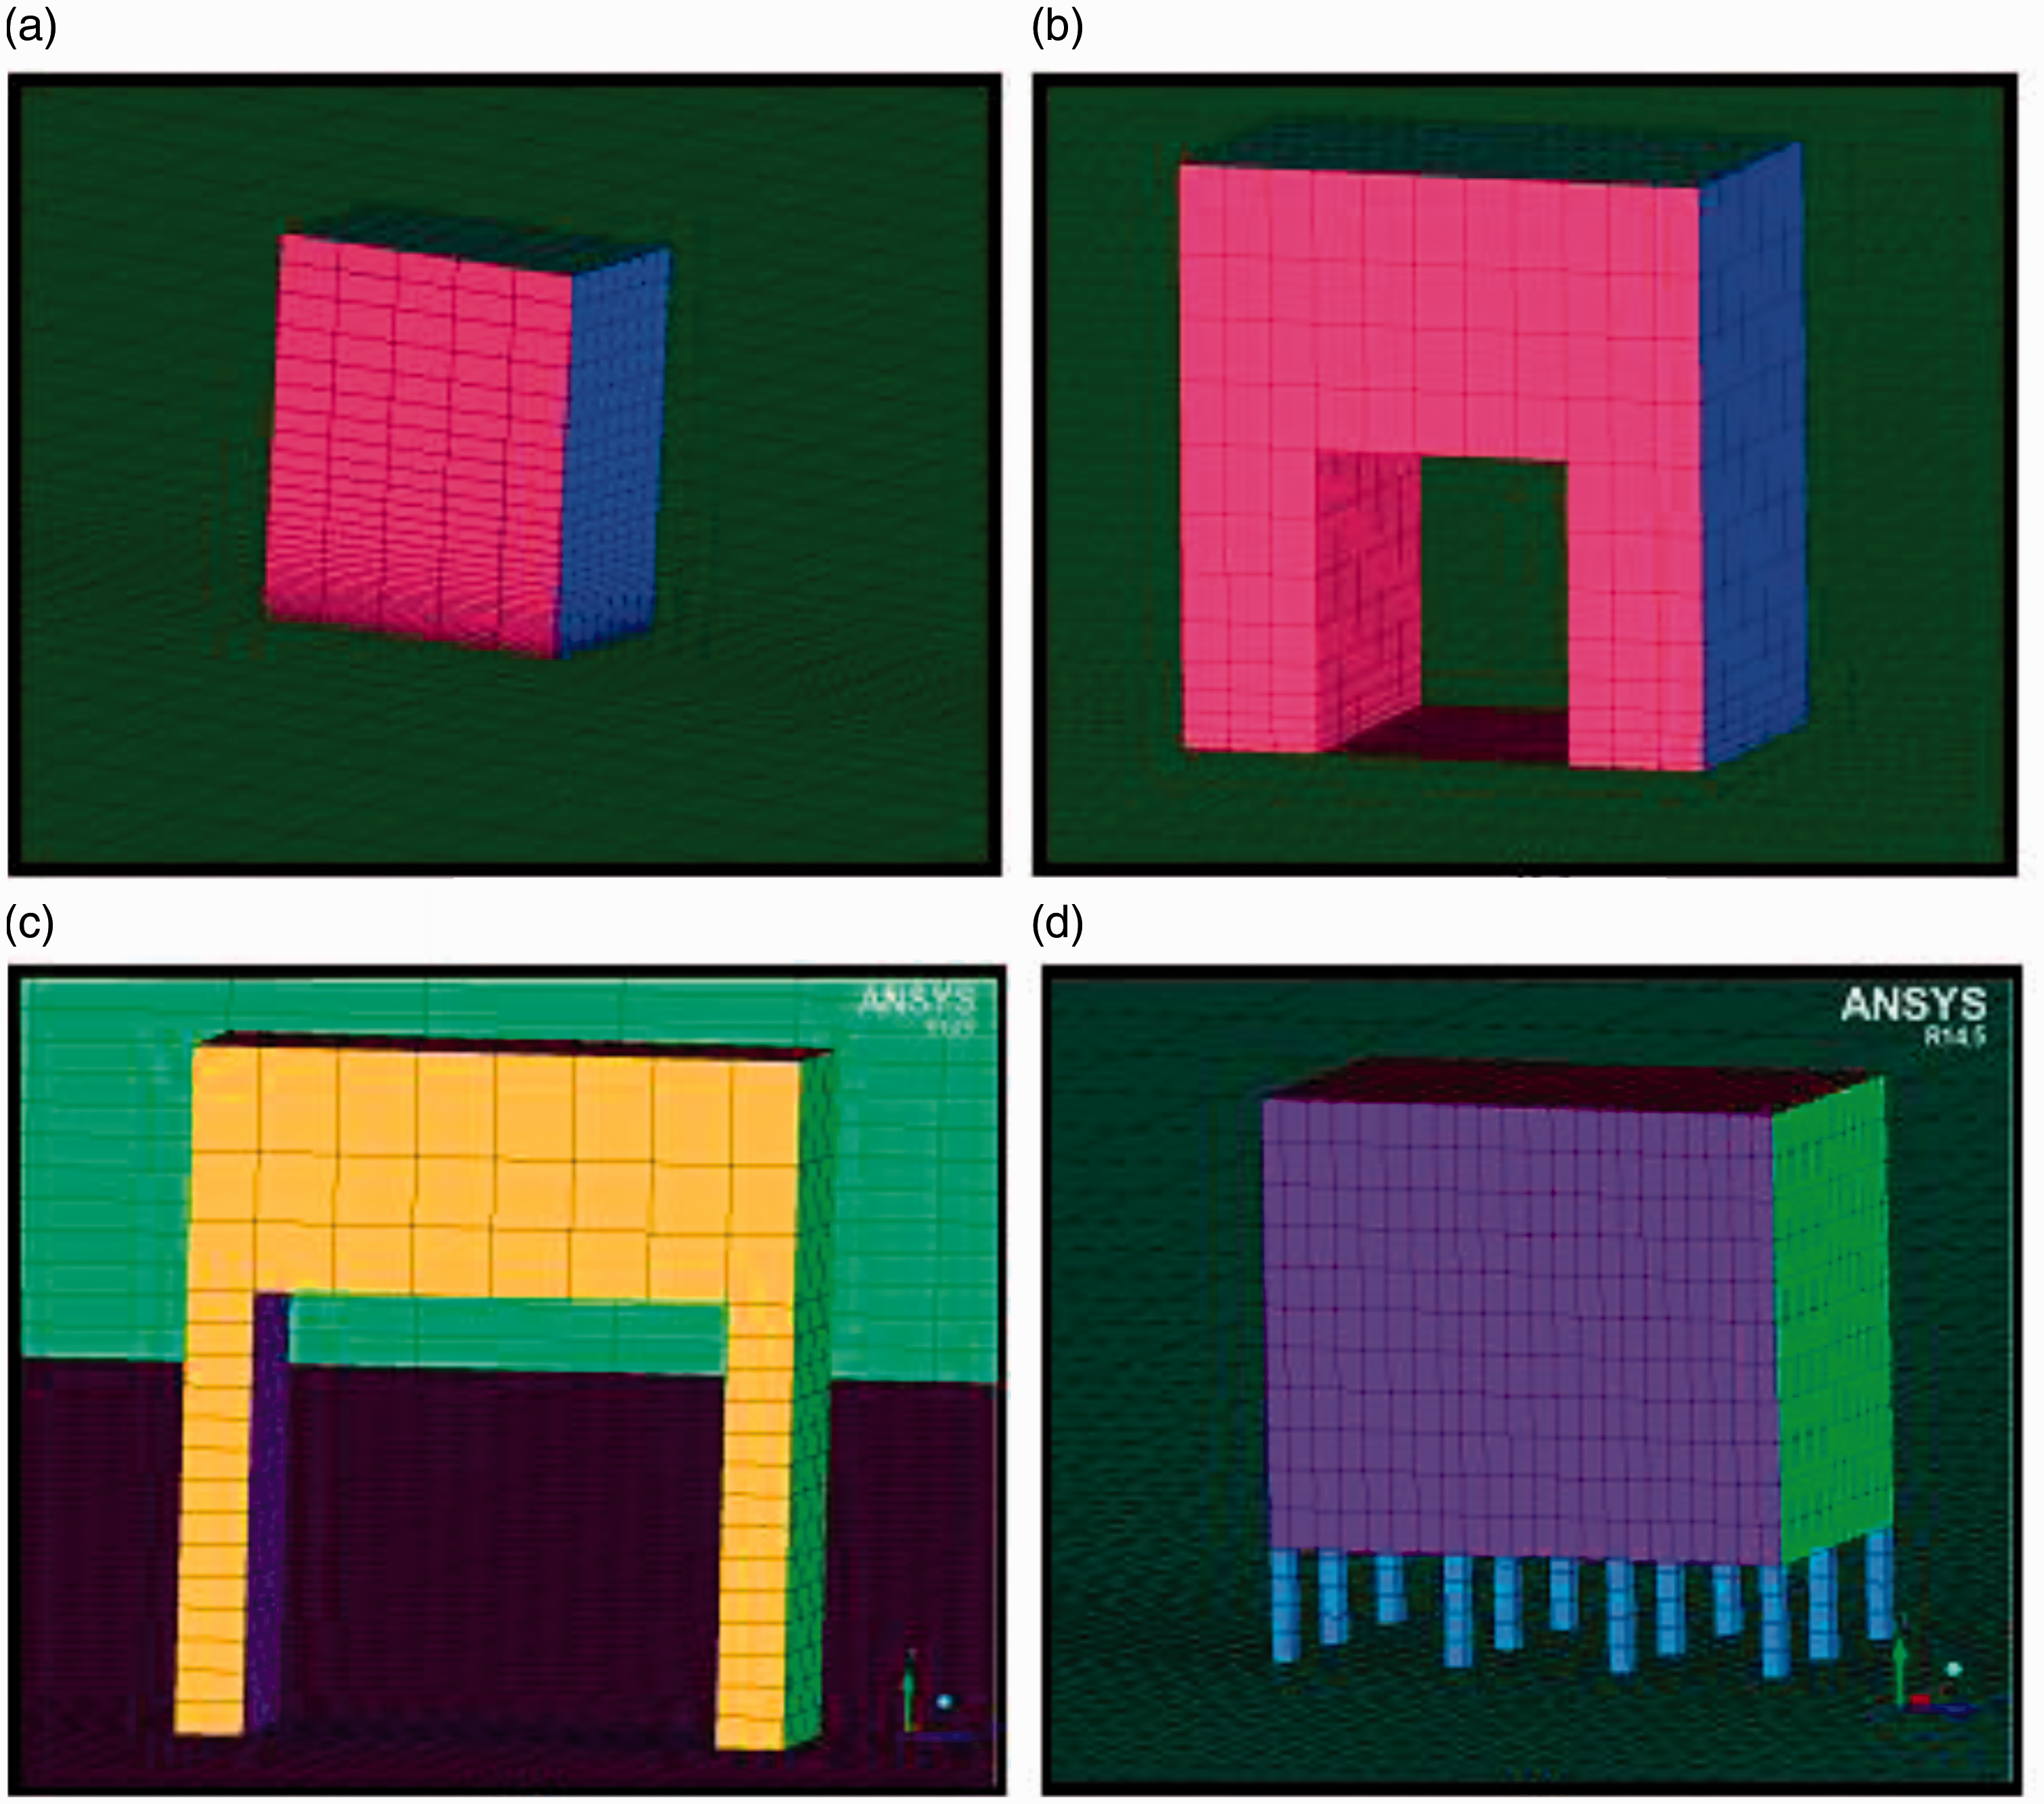
Boundary conditions
Inlet is considered as a mass flow inlet where a certain amount of water discharge (1300, 3000 kg/s, etc.) is applied (see Figure 1). Outlet and top of the channel is considered as pressure outlet and hydraulic diameter is mentioned. Side walls, bottom wall, notch wall, and building walls are considered as no-slip wall; nonpenetrating (Figure 1) and wall functions are employed for the turbulent quantities. Initially the tank and certain height of the channel (0.66 m) are kept filled with water as an initial condition. The wave is generated by application of sudden discharge in the inlet of the tank which is controlled through a user-defined command. The schematic representation of wave generation in the numerical channel is shown in Figure 3. Therefore, wave characteristics become a function of discharge at inlet. A range waveform can be generated using this discharge control mechanism. However, a waveform similar to a tsunami wave (a solitary wave) is considered in the present study. The mechanism of wave generation is similar to the experimental facility of HR Wallingford discussed in Rossetto et al.
7
Schematic diagram of tsunami wave generation mechanism Rossetto et al.7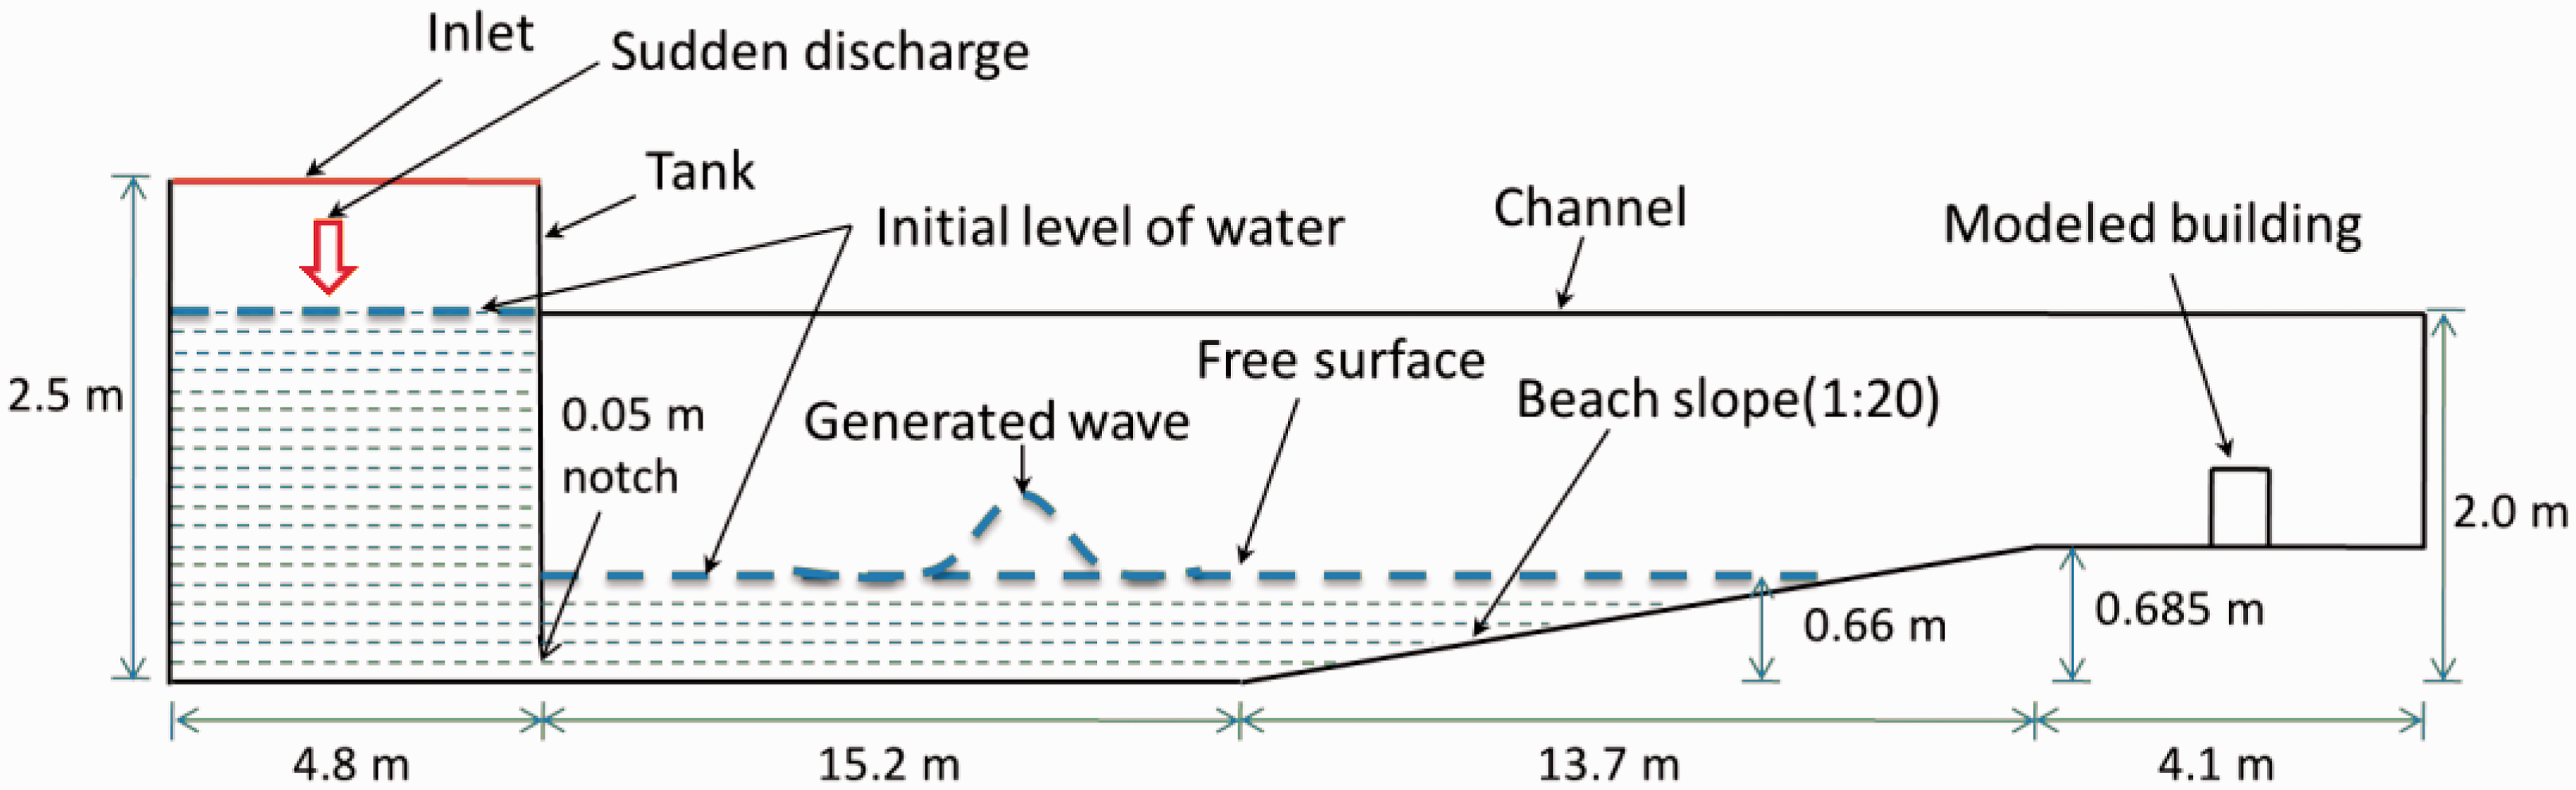
Results
Suddenly applied water discharge in the inlet increases the water pressure in the tank. When pressurized water passes through the small notch of the tank, it generates waves in the initially stored water in the channel. The movement of generated water wave in the numerical wave channel is shown in Figure 4. It is evident from the volume of fraction contour plots that at fourth second a small wave is generated, which replicates the tsunami wave in modeled scale. Wave propagation is observed in subsequent time instances. At 12th second, wave is in the verge of impacting the modeled building and the wave is shaped like water bore. Wave impacts the building at 13th second and sudden blockage of wave results to rises of water in front of building. Accumulation of water in front of building is noted at 14th second and gradual rise of water is noticed. The generated wave characteristics are similar to the tsunami wave characteristics.
Movement of wave at different time instances in a particular wave condition (volume fraction contours) (a) T = 4 s, (b) T = 9 s, (c) T = 11 s, (d) T = 12 s, (e) T = 13 s, and (f) T = 14 s.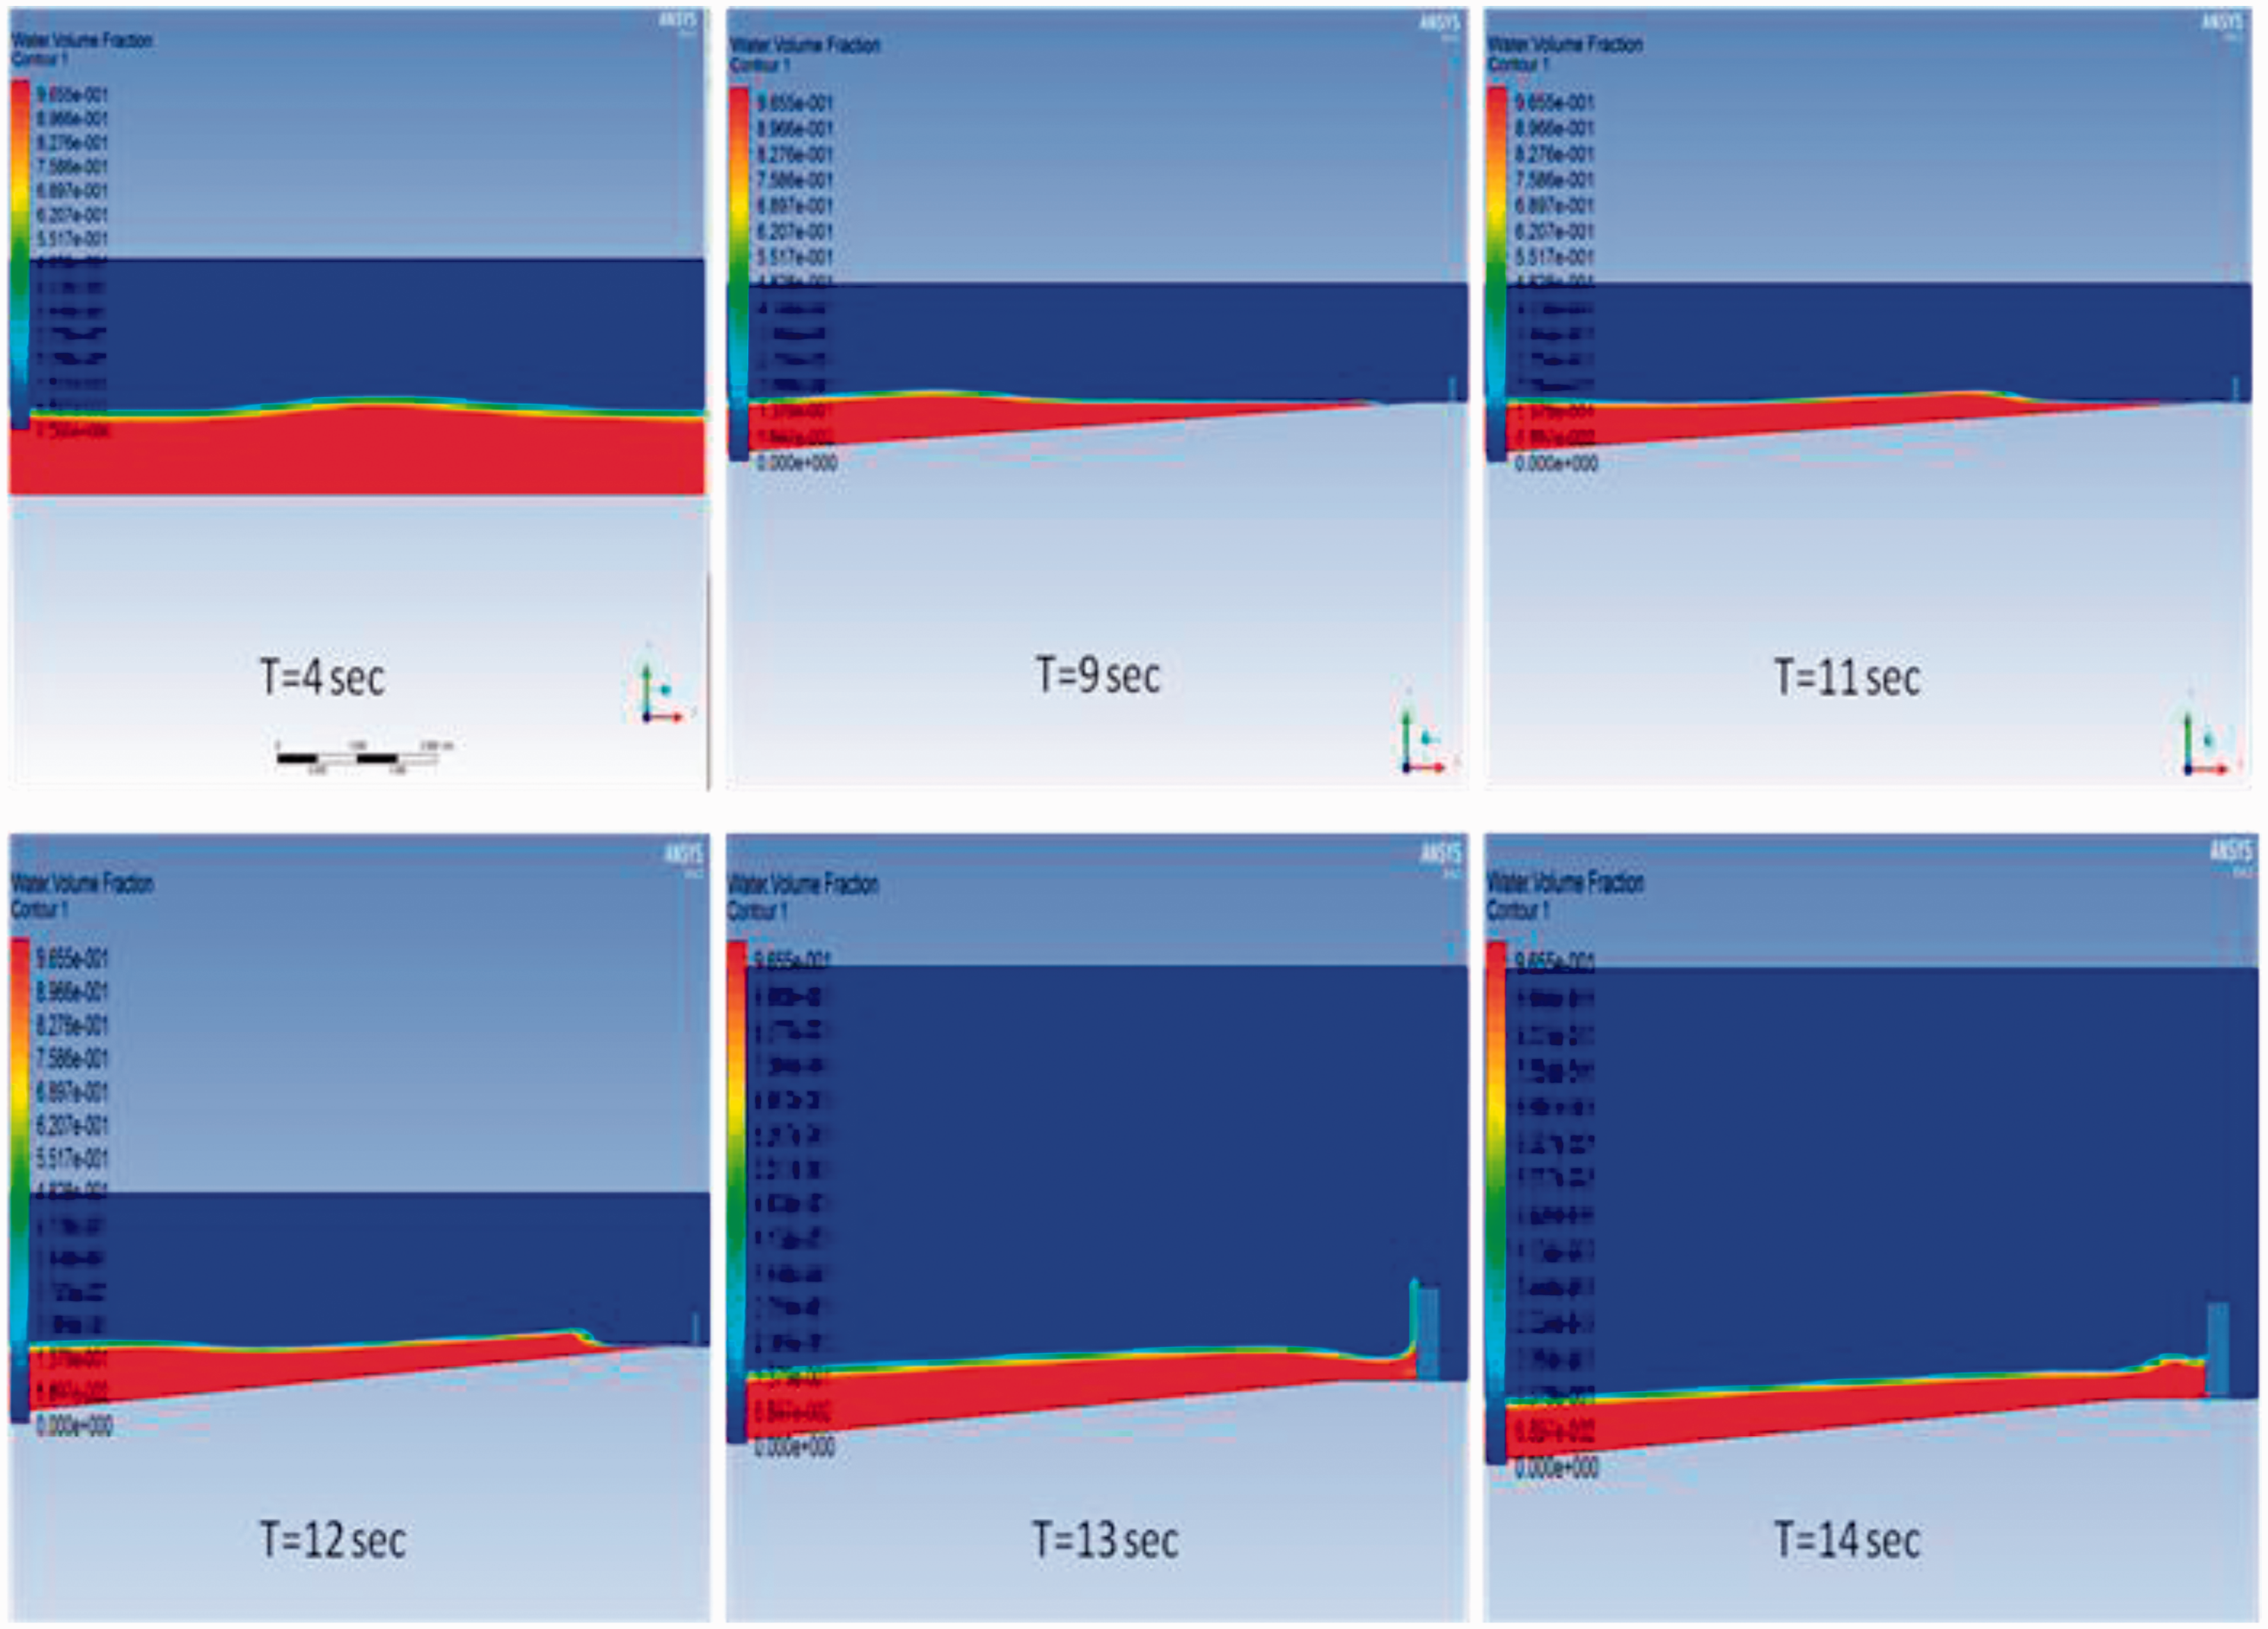
Validation of numerical model is carried out for a particular wave height. The average velocity of a wave at any particular instant is validated with shallow water wave velocity. The average velocity of a wave at any particular instance is measured by dividing distance travelled by the wave from starting point to reaching point and time taken by the wave to cross that distance. The average wave velocity = 34.375/13 = 2.644 m/s, which has 3.89% error as compared to shallow wave velocity computed using Validation of wave profile.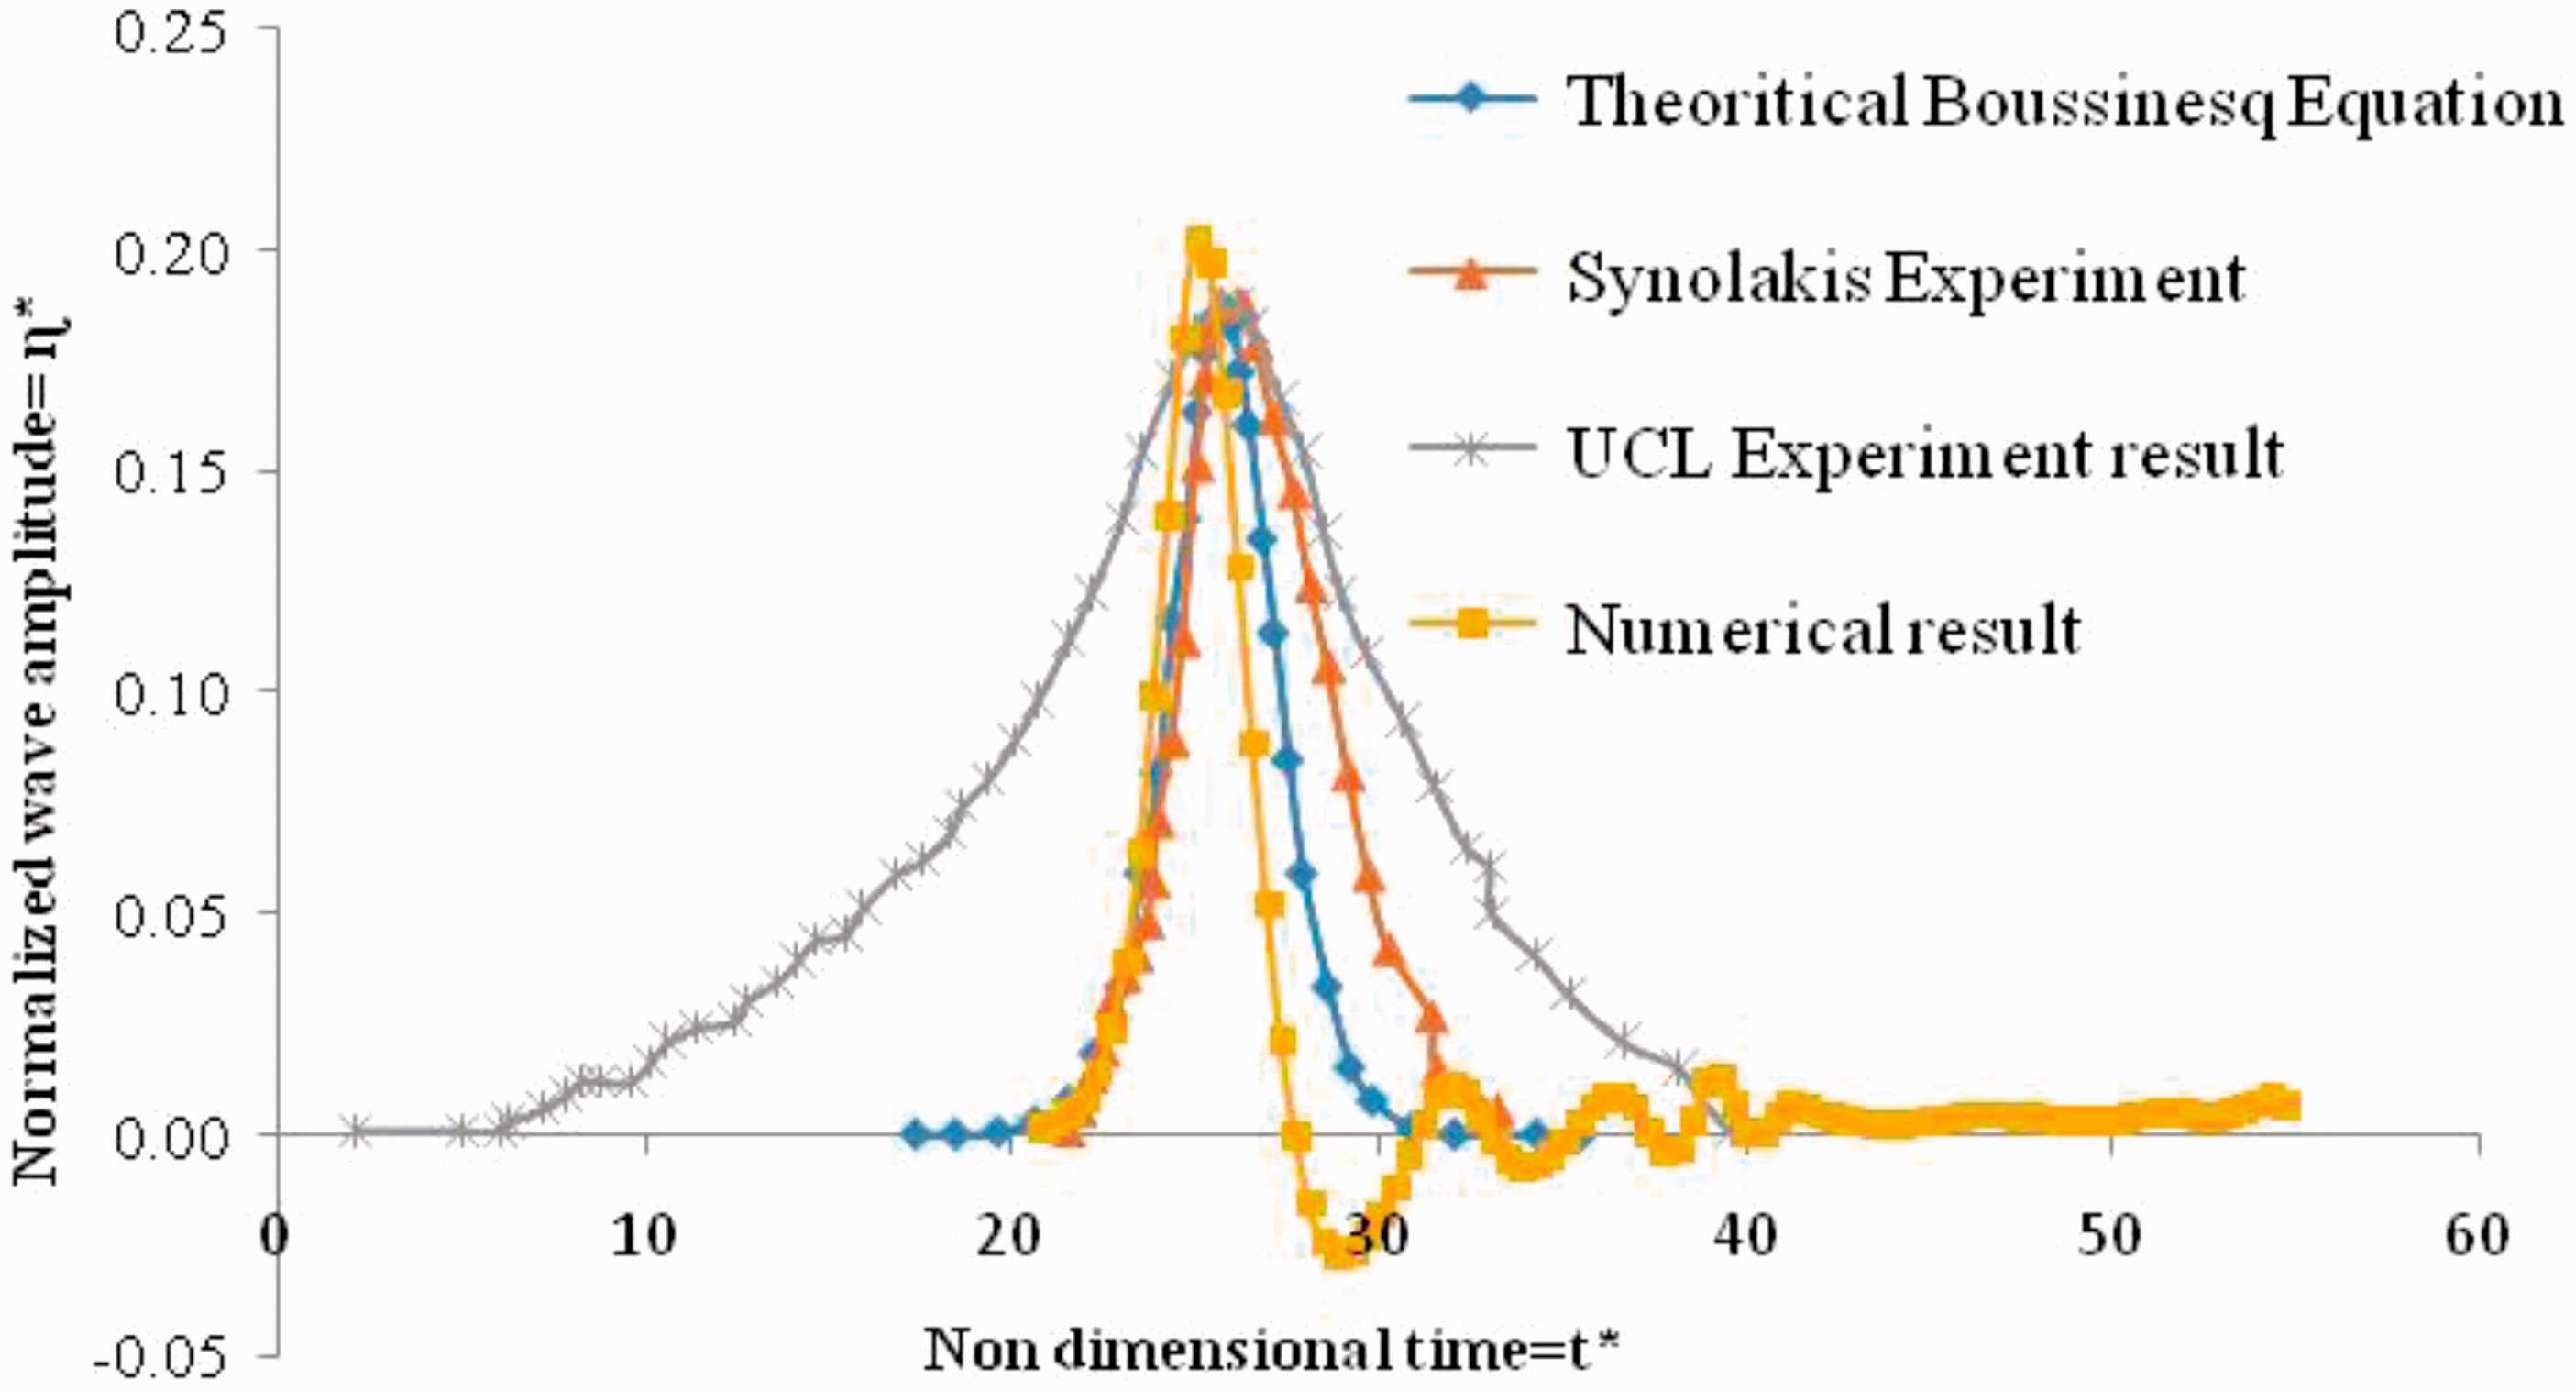
The nondimensional wave amplitude and nondimensional time can be represented by the following equations


Near shore characteristics of tsunami wave (shoaling effect) are demonstrated using the numerical model. When tsunami originates in open sea, it has smaller amplitude but as it moves toward the sea shore, amplitude increases, which is known as shoaling effect. This phenomenon of wave propagation is shown in Figure 6. Vertical axis denotes normalized surface elevation and horizontal axis represents nondimensional time. It shows that initial water level in channel is at 0th level, but as wave generates and propagates toward the sea shore, wave amplitude increases. This is the reason for generation of bore shape wave near the building.
Wave shoaling effect demonstration.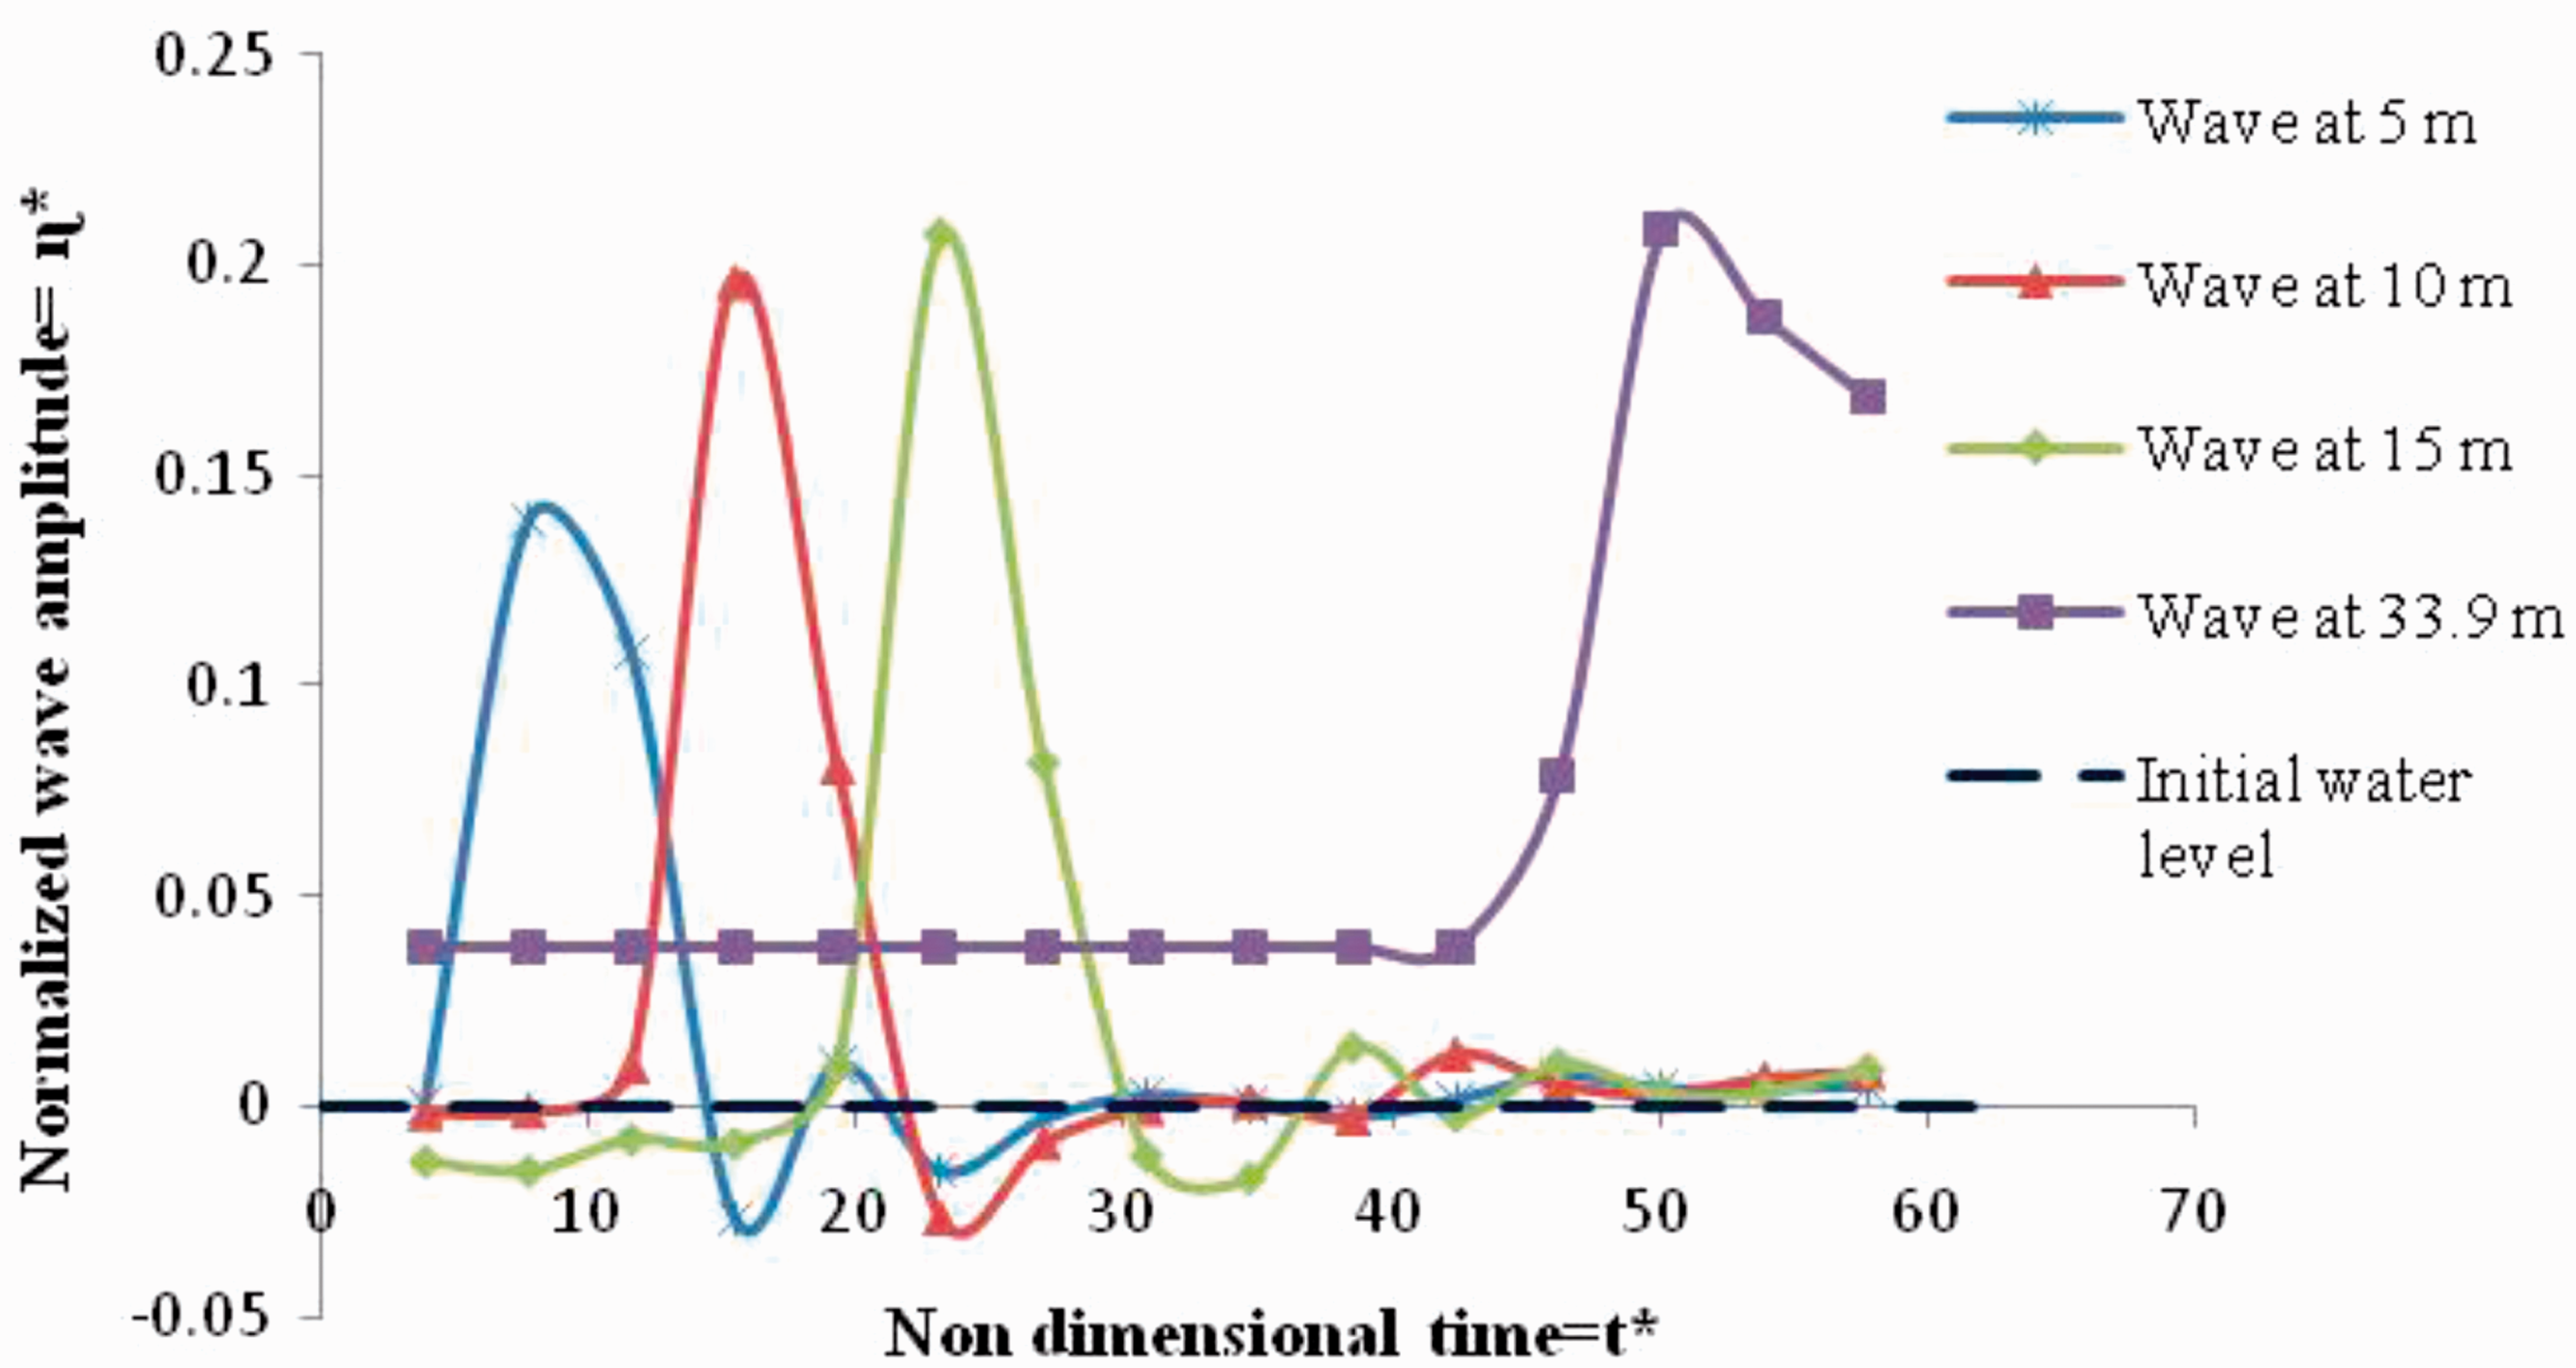
Pressure contours of different building configurations, for wave type 2, at a particular instant of time are shown in Figure 7. Maximum pressure on building surface is generated at 13th second, the time when wave impacts the building. It is evident from the figures that pressure on building can be reduced significantly by introducing different types and sizes of opening. Building without any opening is subjected to maximum wave pressure at height 0.3H and relatively less pressure is also observed in lower part of the building (Figure 7(a)). It happens because bore-shaped wave strikes the building at 0.3H of the building. Therefore, when openings are provided in that maximum pressure zone of the building, the wave passes through the building and pressure exerted on building reduced. The wave pressure for building with 50% opening reduced significantly than the building with 25% opening (Figure 7(b) and (c)). The top of the opening (roof area) in case of building with open ground storey is subjected to high pressure. At a particular height of this building model (0.25H) pressure is maximum, but in the other area pressure is not significant (Figure 7(d)). These building strategies can be compared with buildings with breakaway walls, where wave pressure is reduced by breakage of walls during tsunami impact.
Pressure contour of (a) building without any opening, (b) building with 25% opening, (c) building with 50% opening and (d) building with open ground storey.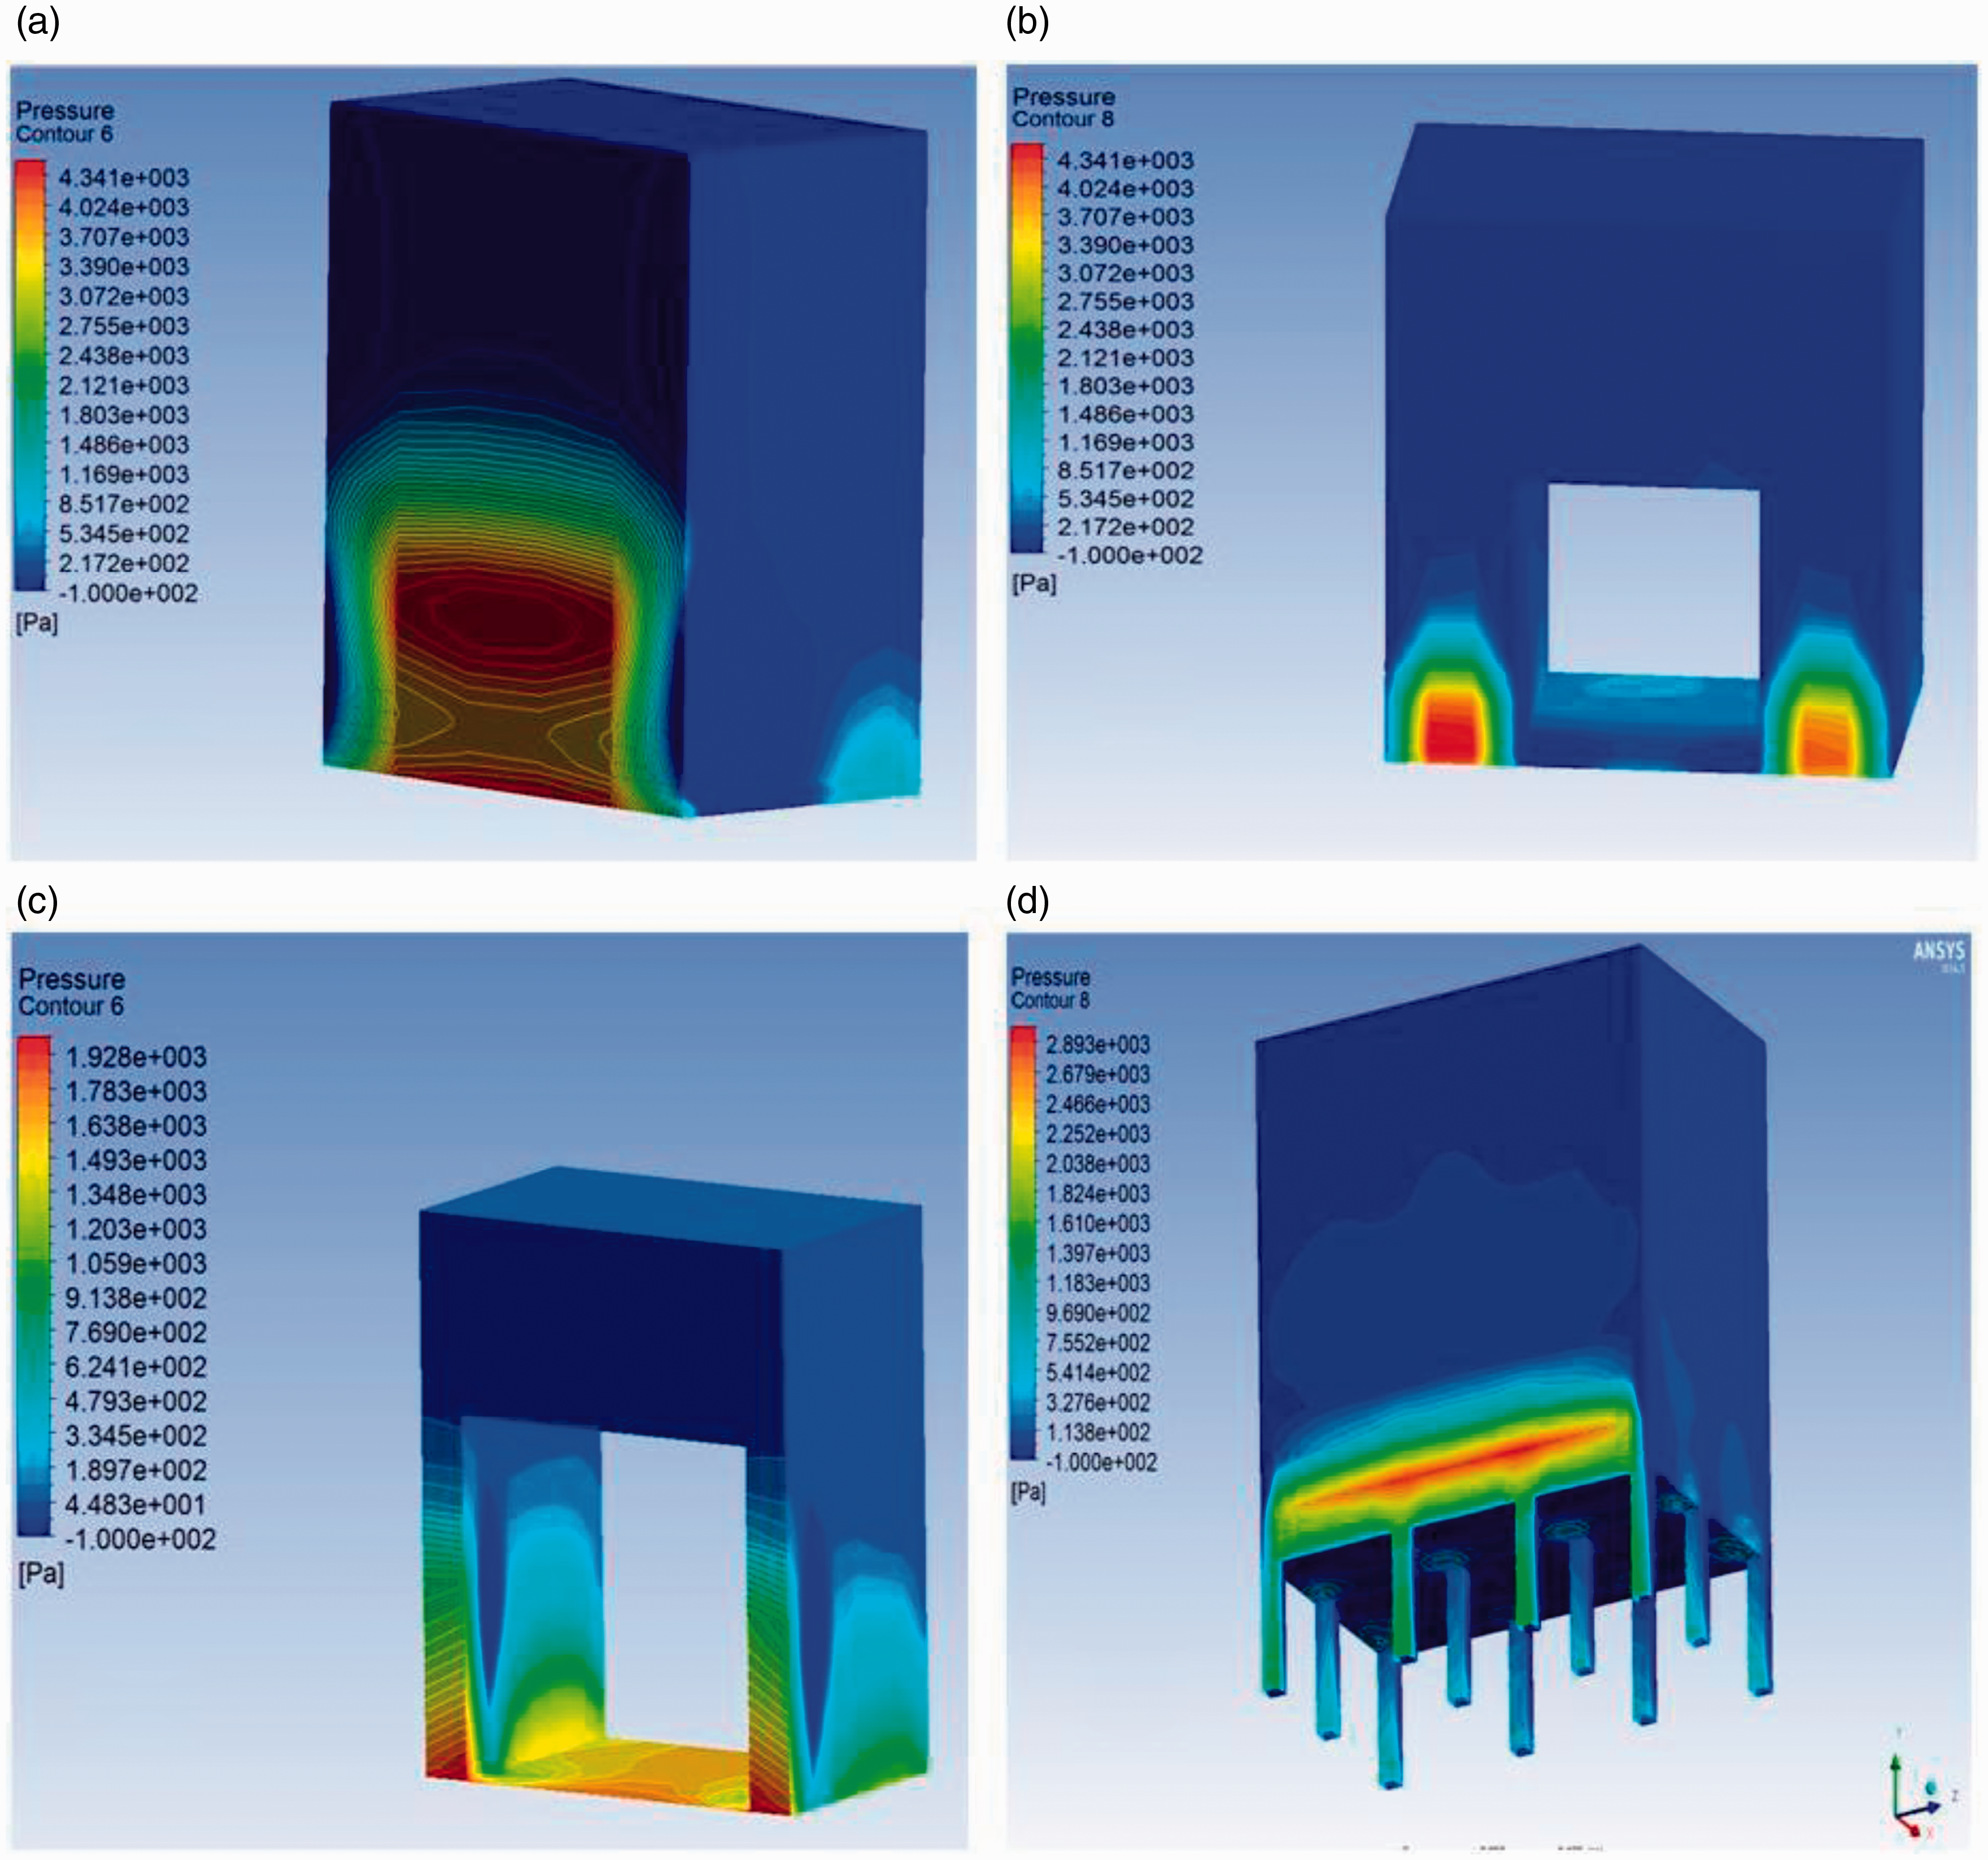
Pressure distributions along height of building for each case are plotted in Figures 8 and 9. Pressure distribution along the height of the building is plotted in the figures.
Pressure distribution for wave type 1. Pressure distribution for wave type 2.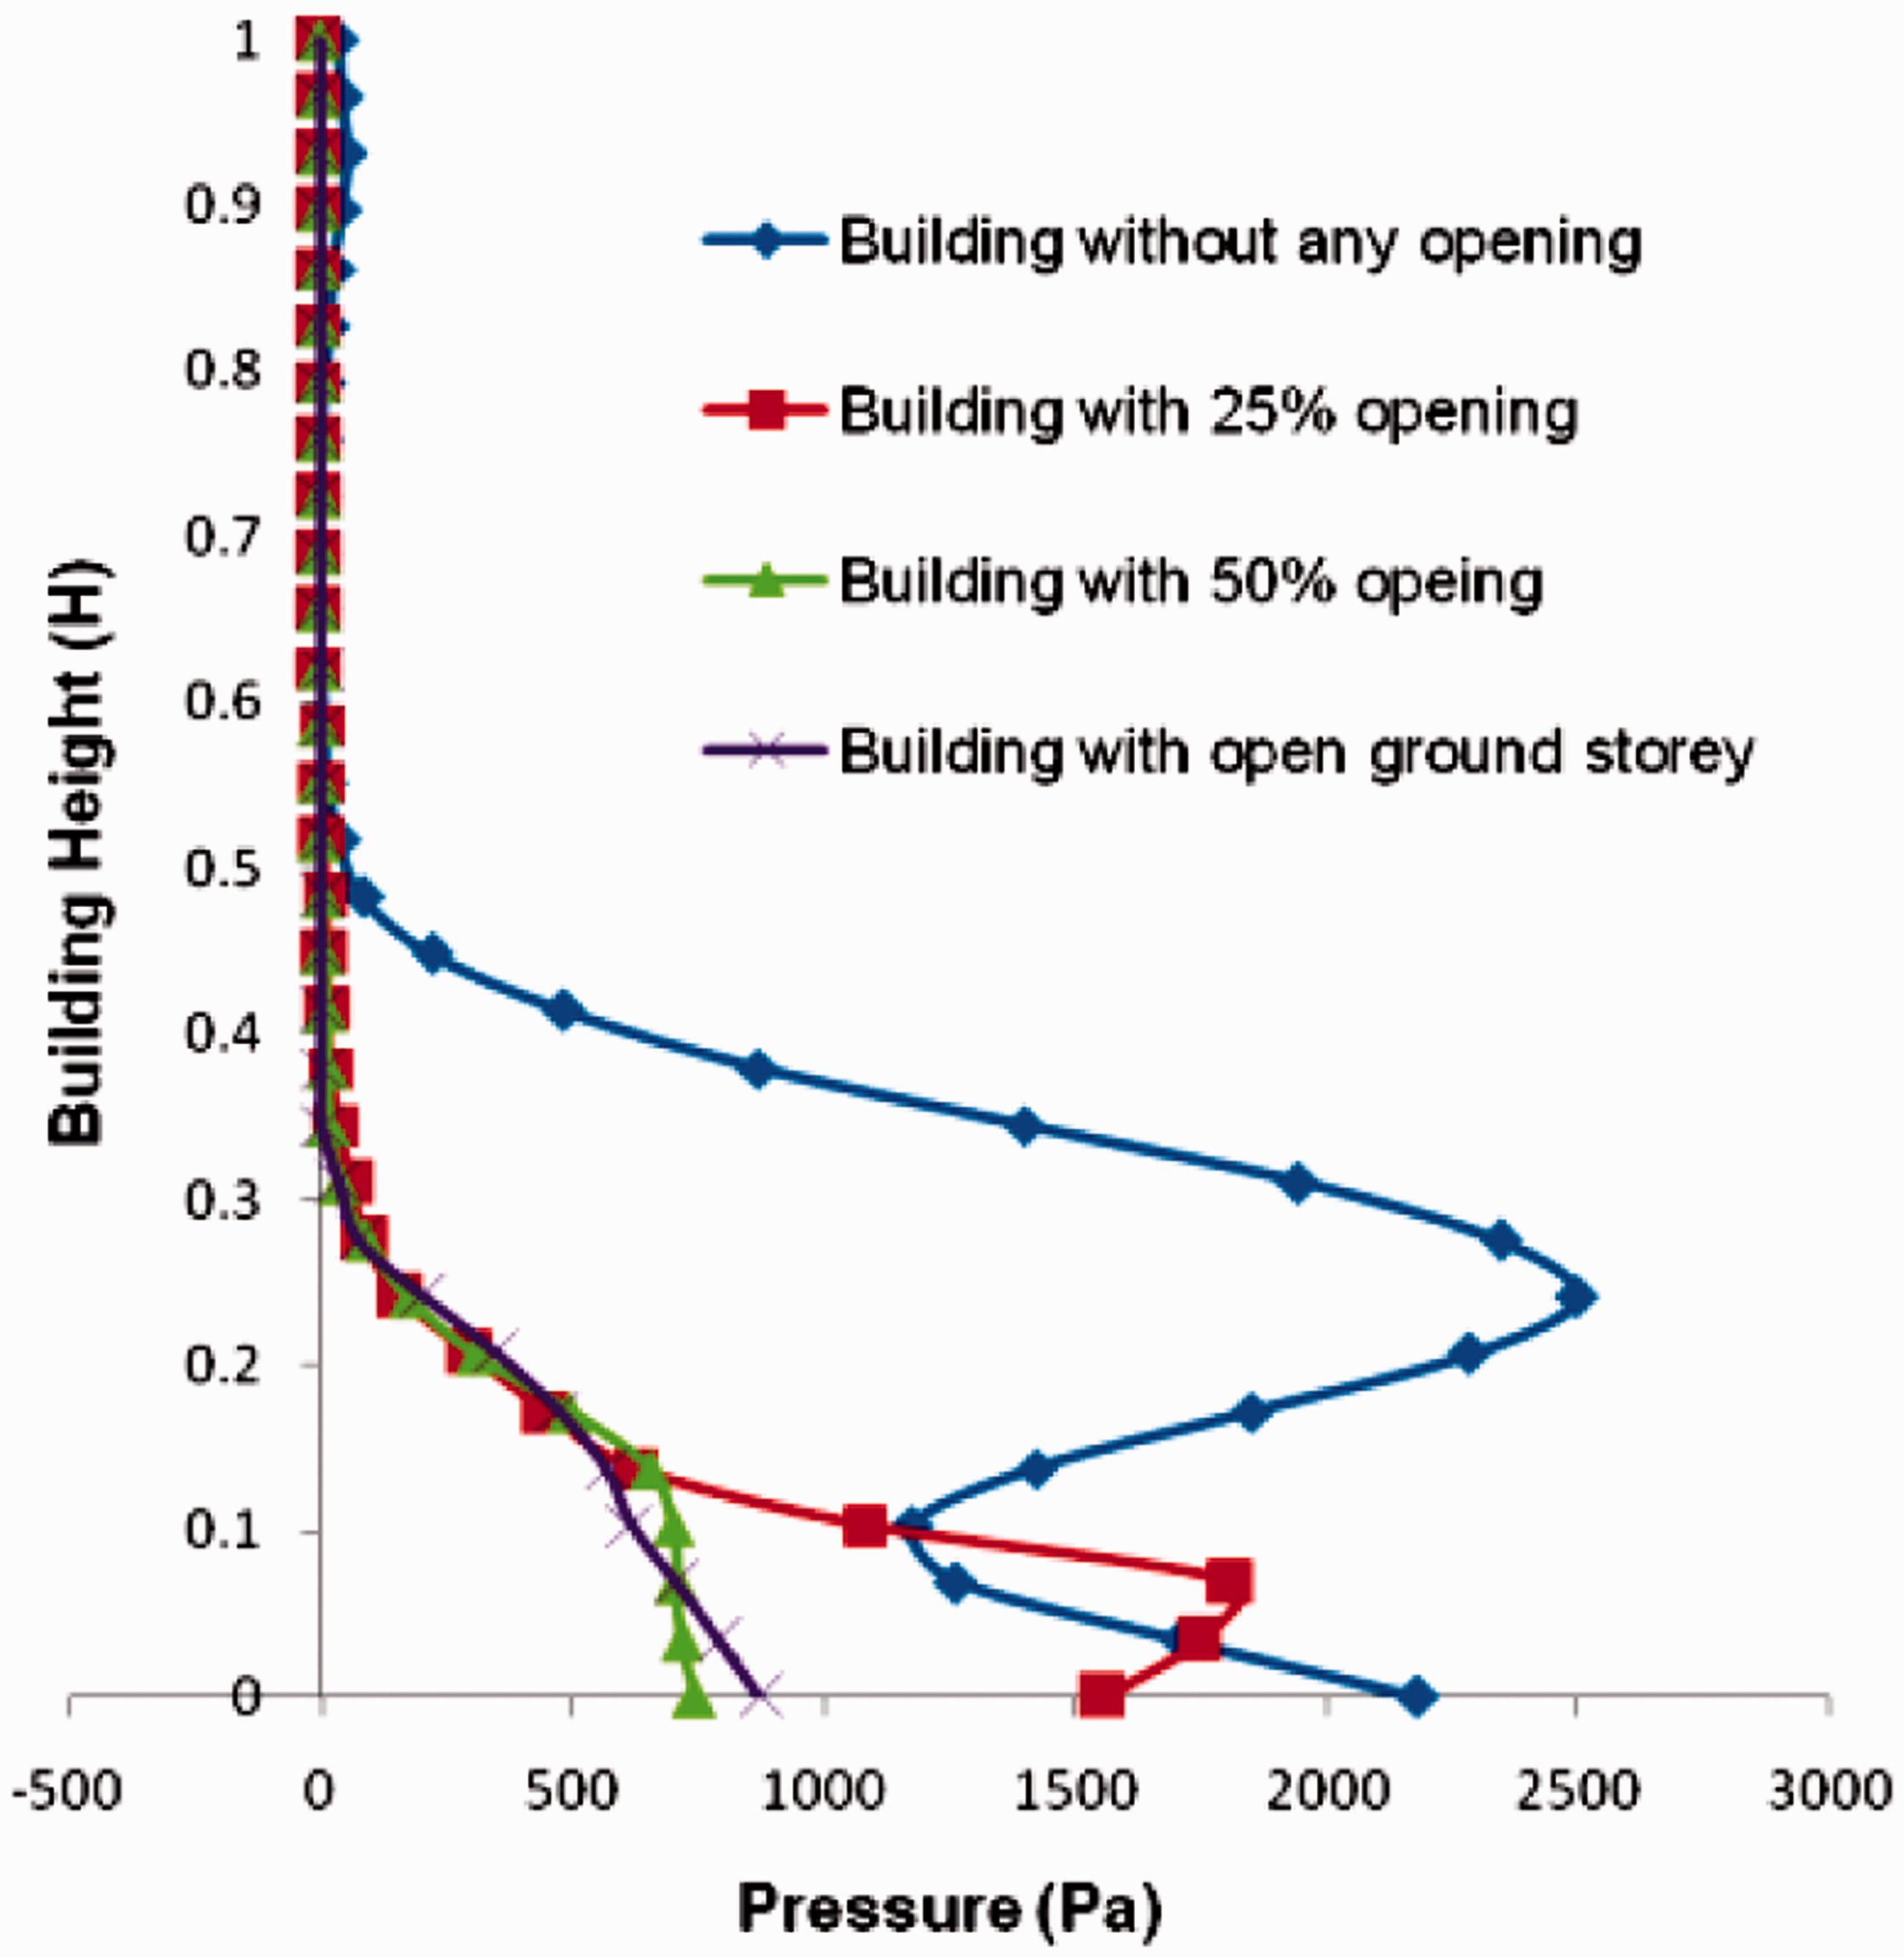
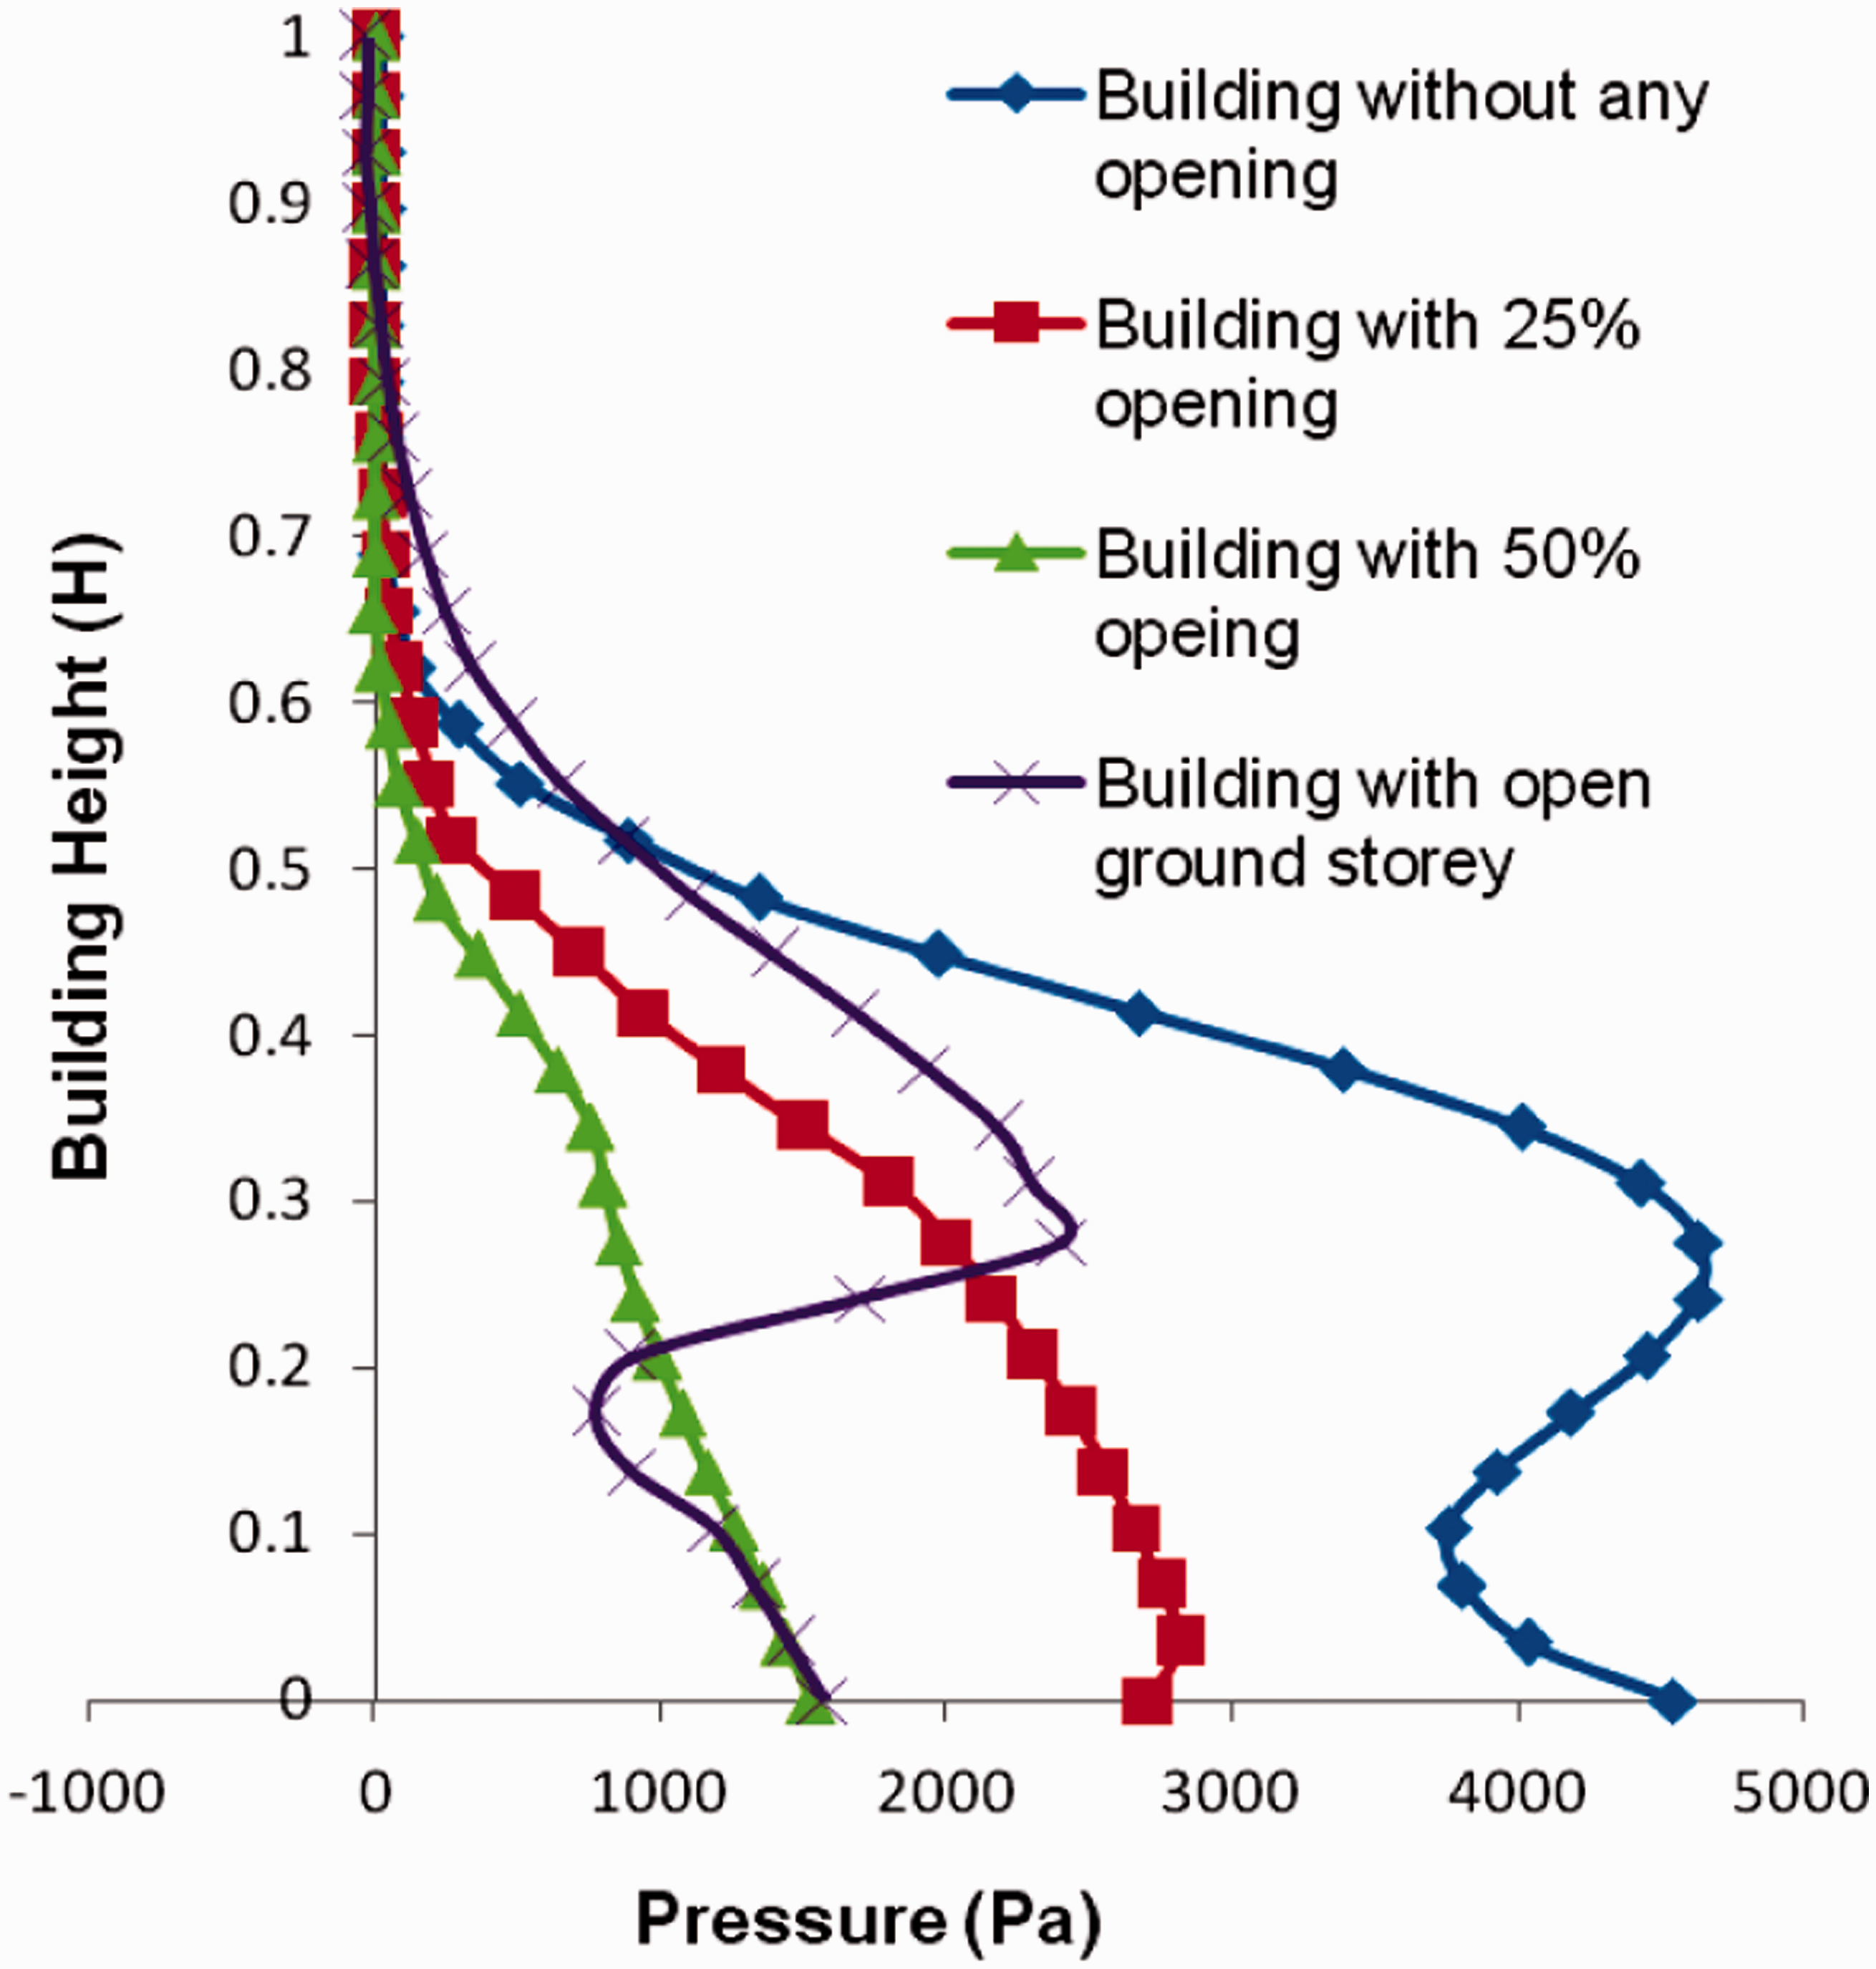
Wave near the shoreline shaped like a bore and it contains maximum energy. Therefore as it smashes the building, it imparts most of the energy where it strikes first. It imparts most of the energy where it strikes first. Therefore, at a height of 0.3H of the building, maximum pressure is observed. However, adopting different building opening strategies this pressure can be reduced significantly as shown in Figures 8 and 9.
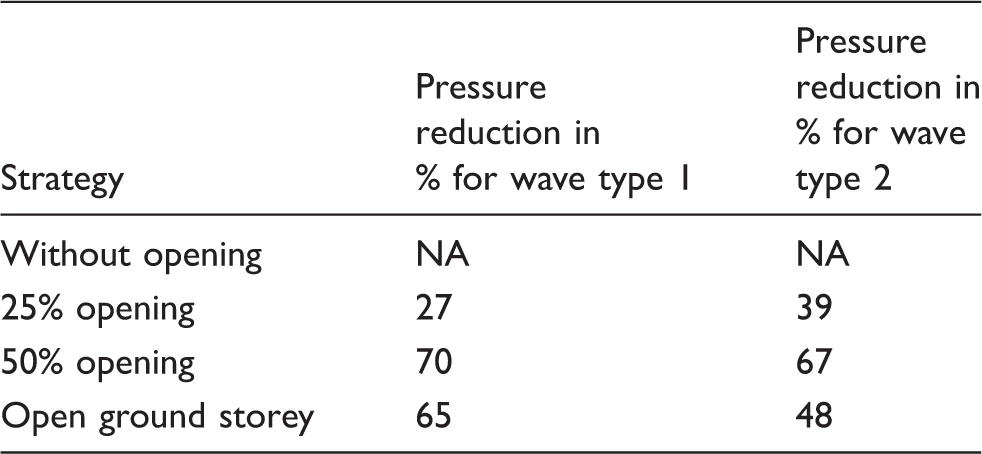
Maximum pressure reduction for various strategies.
Conclusions
This paper investigates the effectiveness of openings in buildings for reducing wave pressure during tsunami. The impact of tsunami wave on building is modeled numerically. The results show that total pressure can be reduced significantly by adopting suitable opening sizes in building. Present study reveals that 25% opening, 50% opening, and building with open ground storey can reduce pressure subsequently to the tune of 34, 69, and 56%. Therefore, the building with breakaway walls and open ground storey can be a very effective solution depending upon various tsunami wave characteristics.
Footnotes
Declaration of conflicting interests
The author(s) declared no potential conflicts of interest with respect to the research, authorship, and/or publication of this article.
Funding
The author(s) received no financial support for the research, authorship, and/or publication of this article.