
Abstract
We introduce a global dataset on education policies and systems across modern history (EPSM), which includes measures on compulsory education, ideological guidance and content of education, governmental intervention and level of education centralization, and teacher training. EPSM covers 157 countries with populations exceeding 1 million people, and time series extend from 1789 to the present. The new dataset opens up for studying several questions concerning political control and the politicized nature of education systems. In addition to describing the measures, we detail how the data were collected and discuss validity and reliability issues. Thereafter, we describe historical trends in various education system characteristics. Finally, we illustrate how our data can be used to address key questions about education and politics, replicating and extending recent analyses on the (reciprocal) relationship between education and democratization, the impact of education on political attitudes, and how rural inequality interacts with regime type in influencing education systems.
Introduction
We introduce a new cross-national dataset titled Education Policies and Systems across Modern History (EPSM). 1 By doing so, we hope to improve the possibilities of researchers to study the historical development of education systems as well as the causes and effects of various education system attributes and policies. There is widespread agreement that education plays fundamental roles in shaping the lives of citizens and societies worldwide. For instance, scholars concerned with “human development” typically point to education, alongside health, as a key factor in shaping the capabilities, autonomy, and life prospects of individuals (Sen, 1999). Economists highlight how “human capital” – a function of the workforce’s education level – is an important determinant of both medium- (Mankiw et al., 1992) and long-term (Romer, 1990) economic growth. Further, social scientists address how education shapes core values and beliefs (Gingrich, 2019) as well as peaceful and conflictual interactions between individuals and various social groups (e.g., Ansell & Lindvall, 2013; Lipset, 1959). Finally, education may influence wider political processes and developments such as prospects for revolutions (Dahlum, 2019), civil wars (Thyne, 2006), democratization (Murtin & Wacziarg, 2014), and nation- and state-building (Paglayan, 2022).
While education most certainly matters for important individual and societal outcomes, the exact shape and strength of such effects often remain unclear or contested. This, we surmise, relates in part to the lack of more detailed data on education policies with extensive cross-country coverage and long-time series. By providing detailed measures that cover 157 polities with current populations exceeding one million inhabitants, and time series extending back to the late 18th century for several countries, we hope that our new EPSM dataset will alleviate this situation.
Granted, it is inherently difficulty to draw inferences about the causes and effects of many education policies and outcomes, as researchers often must rely on observational data. While EPSM cannot resolve all relevant causal inference issues, 2 its detailed information and extensive scope can help limit some such problems. The education policy measures that have been available to researchers, so far, typically have limited spatial and temporal coverage, or they are proxy measures. For example, popular but fairly distal proxies of (different) education policies and system characteristics are education outcomes such as average years of schooling or gross enrollment rates. Education Policies and Systems across Modern History includes more specific measures closer to many concepts of theoretical interest in debates on how education policies relate to, e.g., democratization, societal polarization, nation-building, state-building, inequality, or economic growth. Hence, our new data will hopefully enable researchers to arrive at better-founded empirical answers to various research questions of substantive interest.
To concretize our data contribution, EPSM’s 21 variables pertain to the (a) existence and nature of compulsory education, (b) ideological guidance and content of education, (c) governmental intervention and level of education centralization, and (d) training of teachers. The dataset thus centers on several aspects, grouped into these four dimensions, of the potential for exercising political control over the education system. EPSM predominantly, albeit not exclusively, contains variables that capture de jure characteristics of education policies and systems. The coding, which has extended over several years, has been done by four Research Assistants and one co-author (del Río), relying on both primary- (e.g., education laws and decrees) and secondary sources (e.g., scholarly works, education reports, and newspapers). We showcase the validity of the data and some of its many potential uses in this paper. Importantly, the geographical and temporal scope of EPSM is unprecedented among datasets on education systems and policies, enabling the study of education developments across different time periods and world regions.
In the following section, we briefly describe existing cross-national education datasets and selected empirical studies using these data. Next, we describe the coverage and contents of EPSM. In extension, we discuss how the data were collected, the sources used, and reliability and validity characteristics. After validation exercises using three existing datasets, we present a series of descriptive statistics and discuss several noteworthy global trends across modern history. Thereafter, we present various applications, using different EPSM measures as outcomes or explanatory variables when replicating and then extending recent studies on how education characteristics relate to, for example, democratization, political values, and rural inequality. In doing so, we corroborate some recent findings on larger samples and identify more nuanced relationships for others. In the concluding section, we sum up EPSM’s main features and key empirical findings from this paper, before discussing several avenues of future research that EPSM opens up.
Existing Education Datasets and Studies Using Them
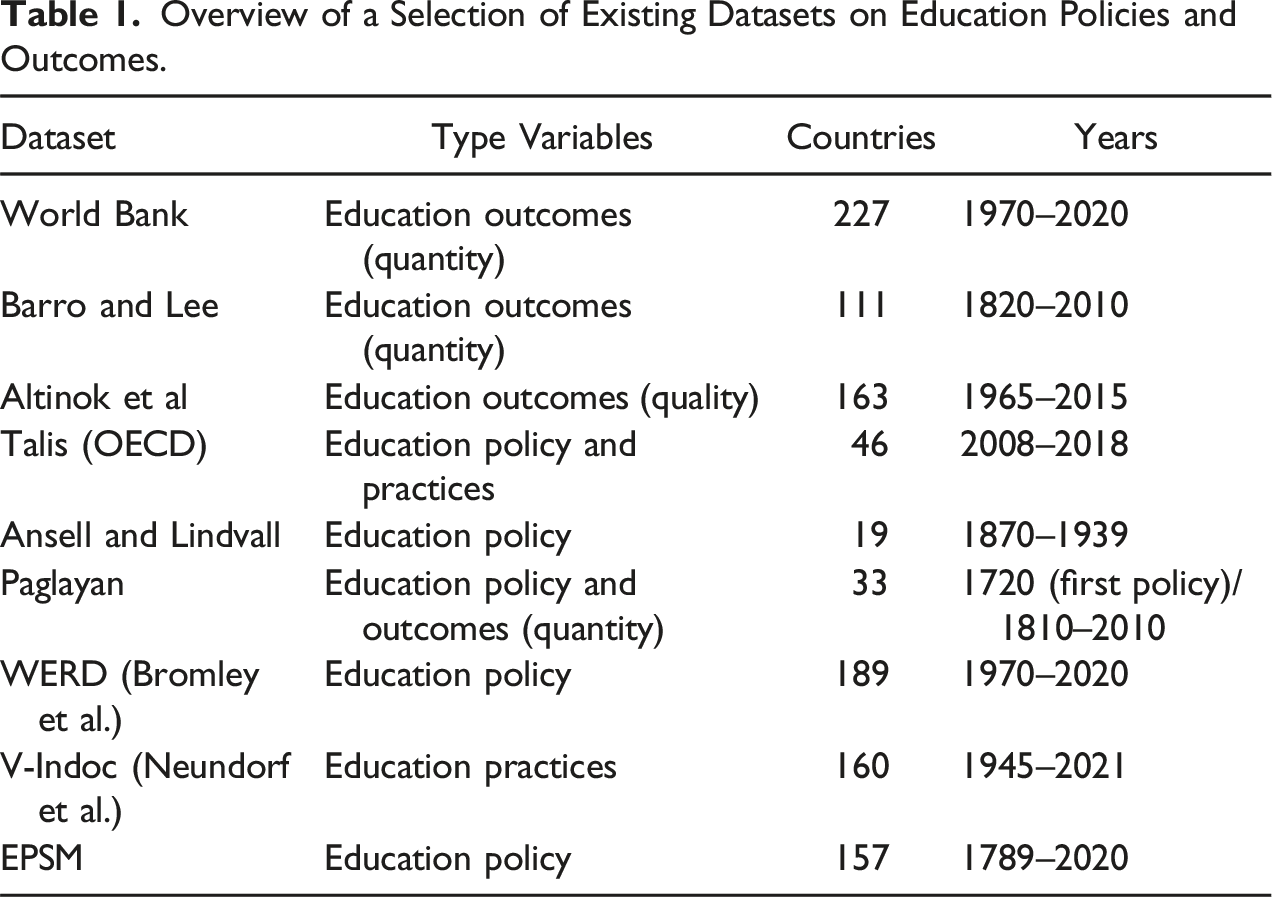
Most cross-national studies on the political-institutional or economic-developmental correlates of education have relied on fairly aggregated measures that capture population-wide educational outcomes. 3 These measures typically pertain to the “quantity” of education provided (see Dahlum, 2017). Examples include the World Bank’s measures of school enrollment rates for 227 countries across 1970–2020. Another example, which is used in many panel analyses of the causes or effects of education, is the enrollment rate and average years of schooling measures in the Barro and Lee dataset (Barro & Lee, 2013; Lee & Lee, 2016). The long time-series version of this dataset extends across 1820–2010, with measurements every fifth year, and it covers 111 countries. Yet, the vast majority of these historical time series are extrapolated, and only nine countries have non-extrapolated data from before 1870 (Paglayan, 2021, p. 186).
Numerous cross-country studies have used these measures to gain empirical insights into the various determinants and effects of education outcomes. To exemplify, the vast majority of large-n studies on how democracy affects education rely on “education quantity” outcome measures, especially enrollment rates and average years of education, mostly finding positive (and some null) effects (for an overview of global-sample studies published after 2000, see Gerring et al., 2022). Moreover, most studies assessing the reverse relationship – how education affects democracy – have also used similar education measures, typically showing a positive though not necessarily very sizeable relationship (for a recent meta-study, see Ahmadov & Holstege, 2023).
Cross-country studies drawing on outcomes that indicate the “quality” or other more specific characteristics of the education provided are fewer, reflecting the limited number of measures of such characteristics with good cross-country and temporal coverage. One exception is the education quality dataset by Altinok et al. (2018), which covers 163 countries and includes measurements from 1965–2015 in five-year increments. These data are constructed from students’ scores on different international tests and – given the paucity of such tests and lack of tests taken in all countries – involve several non-trivial assumptions for calculating and imputing scores. Using these data, economists have found a tighter fit with economic growth for (improvements in) education quality- than education quantity measures (e.g., Angrist et al., 2021; Hanushek & Woessmann, 2010, 2012), perhaps unsurprisingly as the former measures better approximate “human capital”. In contrast, democracy is much more closely related to measures of education quantity than these education quality measures (Dahlum, 2017).
Other datasets contain narrower proxies of education quality, or more direct measures of education policies (de jure) or practices, but are more limited in temporal coverage. One example is Talis (Ainley & Carstens, 2018), the OECD’s survey on teaching and learning. The survey is answered by teachers in different countries and even measures elements beyond de jure policies, capturing how policies are implemented in practice across the country. Talis contains measures of factors pertaining to, for example, teaching, school climate, and professional development, and the data have been used to document, for instance, how using monitoring mechanisms and student performance data increase stress levels among teachers and principals (Jerrim & Sims, 2022) or how principals’ leadership style affect teachers’ beliefs in their own ability to influence student learning (Fackler & Malmberg, 2016). Talis was conducted in 2008, 2013, and 2018 and covered 46 countries in the latter year. The OECD is, more generally, a major provider of recent education statistics, and in their Education at a Glance report, it compares and contrasts countries on numerous education policies and systems characteristics such as teacher salaries, student-per-teacher ratios, and characteristics of principals. Yet, the OECD’s data cover only the most recent years and comprise OECD countries alongside a few selected “partner countries.” While providing rich sources of information about cross-national variation in current education systems and policies, these data can unfortunately not be used to answer questions pertaining to the historical development of education systems or – given the short time series – leverage the time dimension in panel analysis on correlates of education policies.
There are, however, some data collection efforts that have produced more specific measures and extend back to the 19th century. Notably, Ansell and Lindvall (2013, 2020) code primary education policies back to 1800. Their time series end in 1939, and 19 primarily Western countries are included. Using these data, Ansell and Lindvall illustrate two pathways towards state control of education – either through the policies of liberal or socialist parties in democracies or through nation-building by (right-wing) authoritarians. Ansell and Lindvall also show, for example, how education policies, such as public subsidies for private schools, can be used to manage religious conflict. Another notable example is Paglayan (2021), who – in addition to enrollment rates – codes different variables pertaining to the timing of the first state interventions in education systems across 33 European and Latin American countries. These variables concern “the year when central governments began to (i) fund primary schools, (ii) manage them, (iii) establish a mandatory curriculum for all primary schools, (iv) establish certification requirements for primary school teachers, (v) train prospective teachers, (vi) mandate local authorities to provide universal access to schooling, (vii) mandate free provision for the poor, and (viii) establish compulsory primary education” (p. 186). Drawing on these data, Paglayan (2021) emphasizes the non-democratic roots of mass education in Europe and Latin America and discusses the various incentives that authoritarian regimes may have to establish comprehensive primary education systems.
Finally, several recently published or ongoing education data collection efforts are complementary to ours. We will highlight two recently published, major initiatives with global coverage that provide quite different measures. 4 First, the World Education Reform Database (WERD) by Bromley, Kijima, et al. (2023) has education reforms as units, covering 10,253 reforms of different kinds that have been implemented after 1970 in 189 countries. In contrast to narrower and more structured coding efforts on specific education system aspects (as in EPSM), the main informational content in WERD is an open text (from public reports/sources) variable describing the reform and reform year and title. Using these data, Bromley, Furuta, et al. (2023) report several interesting trends in reform activity in recent decades, but also in the international-political correlates of reform. For instance, they find that “World Bank lending is less associated with education reform over time, whereas the influence of international nongovernmental organizations has grown” (p. 149).
Neundorf et al. (2023) provide another impressive education dataset, V-Indoc, which covers 160 countries and extends from 1945–2021. V-Indoc is also complementary to EPSM, although in a different manner than WERD. Indeed, V-Indoc contains several similarly-sounding variables to those in EPSM centering, e.g., on the education system’s indoctrination potential and content, centralized control over the system, and politicization of the curriculum. 5 The several corresponding variables reflect intentional coordination between the teams behind V-Indoc and EPSM, which, in combination, enable analyses of de jure versus de facto correspondences or gaps in education systems. Whereas EPSM mainly, though not exclusively, registers education laws, V-Indoc mainly aims at capturing practices on the ground (e.g., in the classroom). V-Indoc therefore uses country experts to gauge how indoctrination and political control over the education system operate in practice. These differences in content and data collection methods also imply that V-Indoc and EPSM have different validity and reliability characteristics (cf. the discussions in Neundorf et al.’s section 5 with those in our “Validation” section). And, given the difficulty of assessing classroom practices back in time (relative to education laws), V-Indoc has a shorter time series than EPSM.
Overview of a Selection of Existing Datasets on Education Policies and Outcomes.
Data Collection Process, Coverage, and Contents
Questions Contained in the EPSM Codebook.
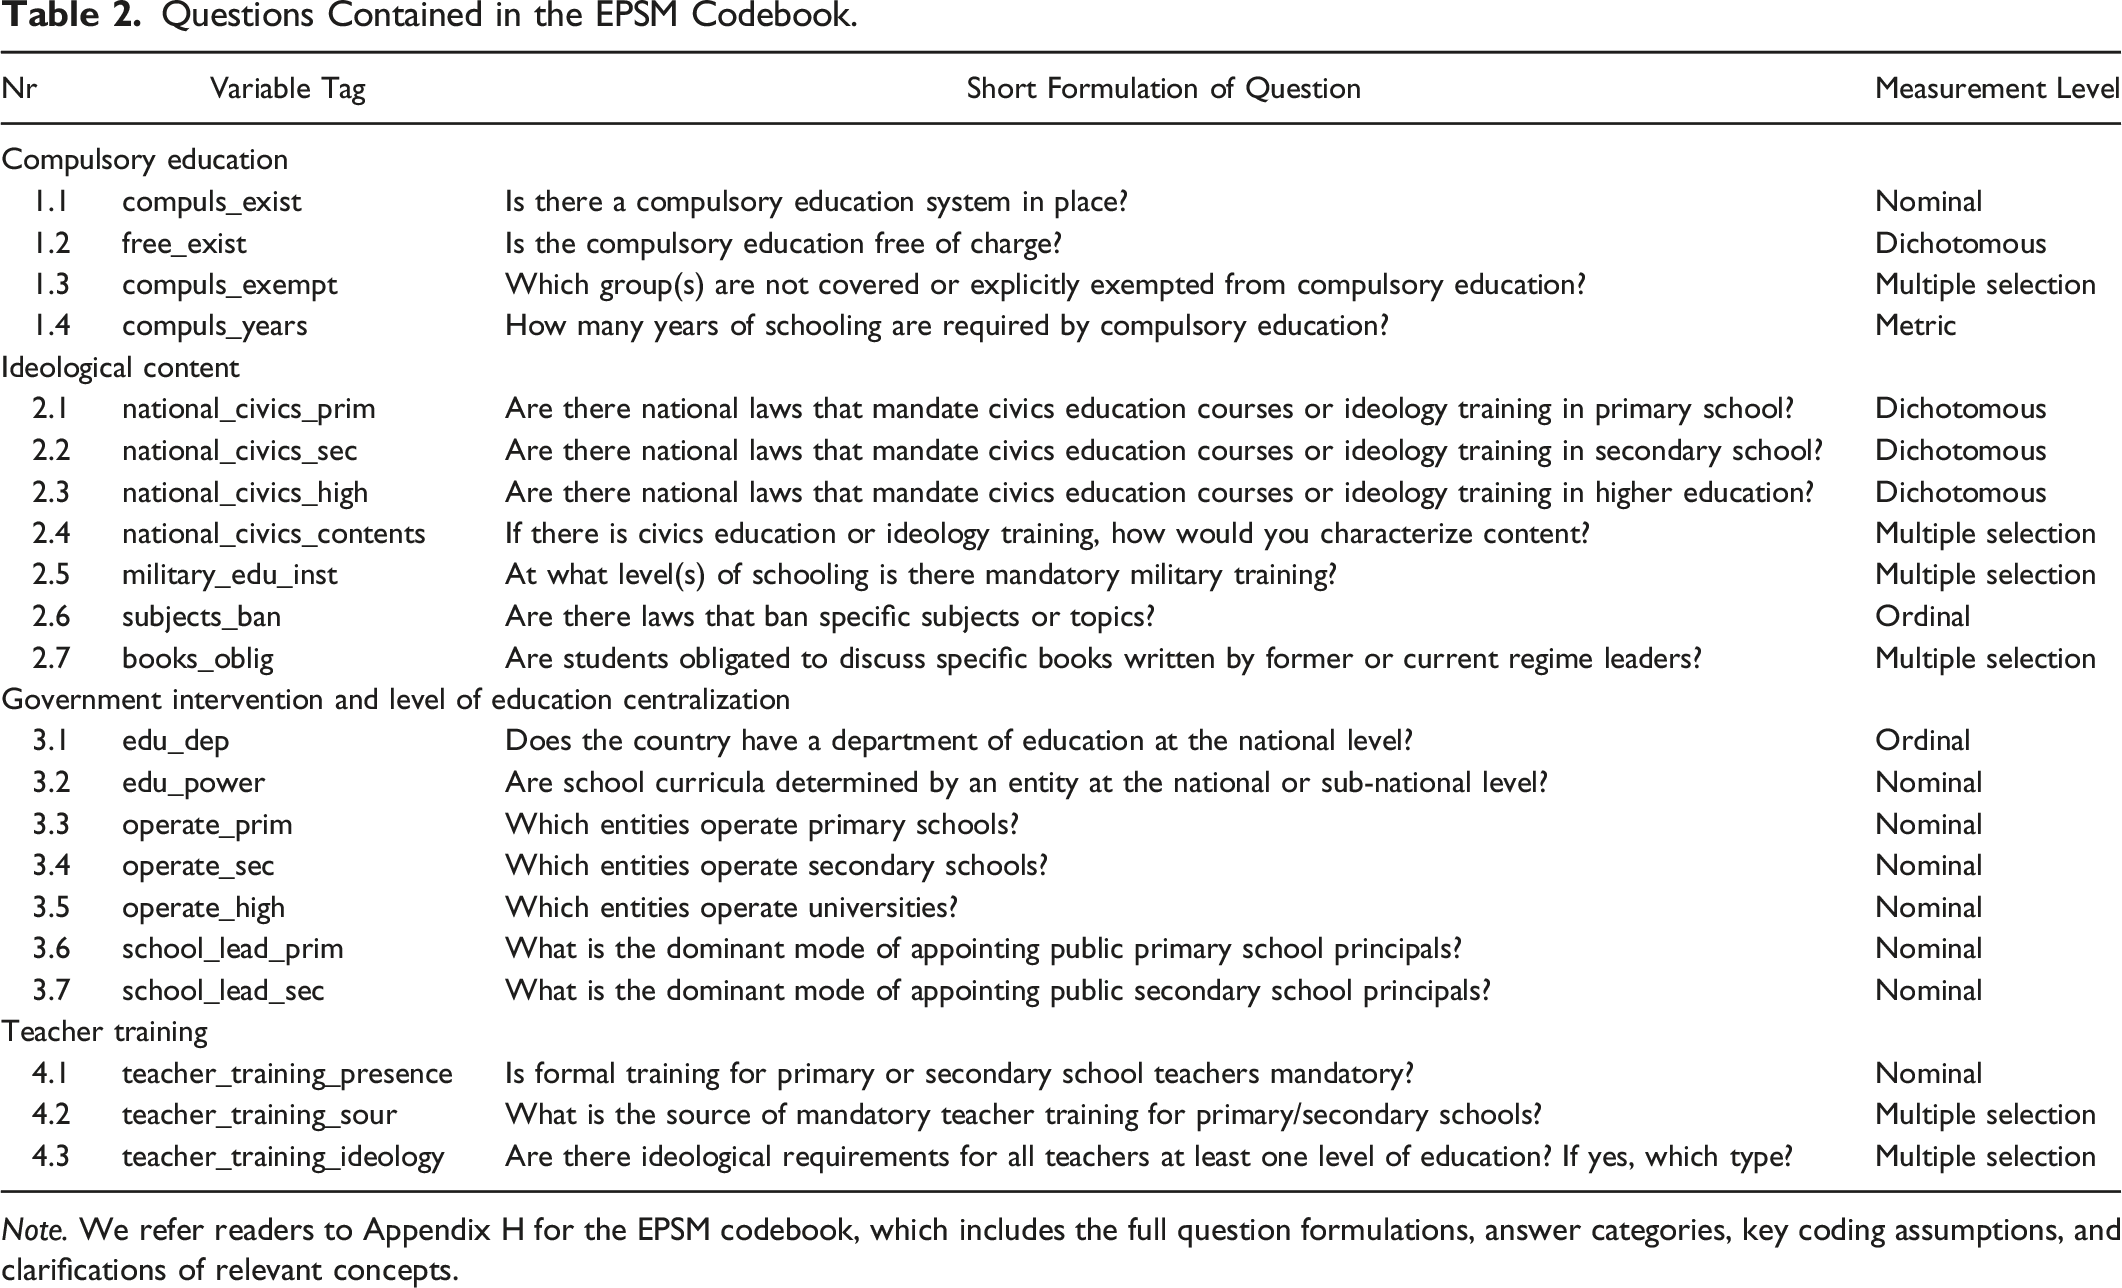
Note. We refer readers to Appendix H for the EPSM codebook, which includes the full question formulations, answer categories, key coding assumptions, and clarifications of relevant concepts.
The first set of variables identifies whether compulsory education exists, whether compulsory education is free, years of compulsory education, and groups (e.g., based on gender, ethnicity, region, or occupation) exempted or excluded – EPSM does not separate exemptions from exclusions – from compulsory education, if any. The second set pertains to the ideological profile of standalone civics courses for primary, secondary, and higher education. 8 The measures include laws mandating civics- or ideological training at each level, the ideological profile of such training (e.g., nationalist or regime-specific ideology), mandatory military training in schools, laws that ban particular subjects or topics, and mandated books in school curricula written by former or current leaders. Regarding the third dimension – government intervention and level of education centralization – seven items capture whether government departments of education exist, the entities determining curricula, and the entities operating and funding primary and secondary schools and universities. We also coded which entity has central authority over appointments of principals for primary and secondary schools. Finally, we coded formal teacher training, focusing on teacher training presence and type, the entity operating this training, and ideological requirements to become a teacher.
To code these 21 items, we draw heavily on country-specific laws and mandates as well as government reports. We also draw on books, articles, and PhD dissertations, especially from the history of education, sociology, and development studies, whenever such sources are available and published in Spanish, English, Portuguese, Russian, Italian, French, Norwegian, Danish, or Swedish. Moreover, we used comparative education reports such as OECD’s Education at a Glance and UNESCO Yearbooks to contextualize and gather education laws. Appendix A.2 includes descriptive analyses of the data sources, showing, for example, that more populous countries, on average, have more sources and that Latin American countries have higher shares of primary (over total) sources than countries in other regions. Neither income, democracy, nor state capacity is systematically correlated with the number of sources or share of primary sources. Justification of coding decisions and uncertainty assessments are recorded for each indicator to enhance reliability and replicability.
Concerning the coding process, Del Rio, who coded 71 countries himself, trained four research assistants (RAs) to, for example, identify relevant data sources, indicate uncertainty, and differentiate between de jure and de facto aspects of education policies. As a result of this training and accumulated coding experiences, we produced an extensive “Rules-of-thumb (ROT) for coding” document (see Appendix H). This document proved helpful for effective decision-making – especially when education laws were unavailable or data sources unclear – and for ensuring that all coders operated by the same explicit heuristics rather than different implicit ones. Appendix A.3 details how ROTs were used to guide hard coding decisions, including in about 20% of EPSM’s country-year-question observations that we have recorded as “uncertain”. This Appendix also discusses how users can identify our reliance on ROTs and interpret coding uncertainty for individual cells in the dataset.
Coders were assigned to countries primarily based on language expertise. They first collected and examined studies on the history of education to obtain a general overview of key laws and mandates, their background, and the country’s history. Subsequently, they collected and systematized all the education laws mentioned through government websites or law repositories and recorded the 21 variables. Especially before 1900, these data sources were, unfortunately, often unavailable, and we thus relied mainly on scholarly studies. Information on the sources, alongside specific references, is recorded to enhance transparency. On average, we have about 27.7 (SD = 14.5) sources (e.g., studies, laws, and links with complementary information) per country. We consulted, on average, 8.8 (SD = 9.1) primary and 18.9 (SD = 9.8) secondary sources per country. As Appendix Table SM.3 shows, the countries with the most sources (>65) are Kenya, Nicaragua, Ivory Coast, Chile, and Egypt. The countries with the fewest sources (8–10) are Gambia, Senegal, Moldova, Bosnia-Herzegovina, Slovenia, and Hungary, many of which have short time series.
We adopted four general procedures for assessing sources and to improve coding accuracy (see Appendix A.1 for details). First, we do not base coding decisions on studies that make statements about a government’s indoctrination efforts without explicitly mentioning through which courses or specific mandates indoctrination takes place. Similarly, we do not base coding decisions on studies making imprecise statements, for instance, about the timing and duration of education laws or policies (e.g., “law X came about in the mid-19th century and exists to the present day”). In such cases, we used clues provided by these studies to look for further and more specific documentation. 9 Second, all data sources were cross-checked, with coders aiming to check at least two independent studies per education law. The evidence guiding our coding decision was subsequently documented in the accompanying coding notes. Third, all countries were double-checked upon finalized coding by another coder and once again by the first author after the entire dataset was done to ensure within- and cross-coder consistency. When notable divergences in coding decisions existed or laws were unclear, coders met to discuss these cases, make collective coding decisions, and develop new ROTs to handle future similar cases (see Appendix A.2 for examples). Fourth, we consulted with country experts when the precision or quality of sources was insufficiently high in order to ensure reliable and valid coding decisions.
Altogether, EPSM took more than 3150 hours to code, typically 19–22 hours per country. Despite these efforts, we still had insufficient information for coding some country-year-question cells. And, information was typically scarcer for some education-system characteristics; thus, while generally low, missingness varies across variables (see Appendix A.4 for details). Across all country-year-variables 4.8% of observations are missing (SD = 7.5%), and missingness is higher for the military education in curricula and the higher education questions. For the latter, most missingness comes from higher education being nonexistent or temporarily shut down. Data users can identify explanations for missingness in the note columns.
Education Policies and Systems across Modern History covers 157 polities with current populations exceeding one million inhabitants. The coded polities are mainly independent states, but for many polities, we also cover long periods when they were semi-independent states (e.g., pre-1905 Norway) or colonies (e.g., pre-1960 Senegal). Although we collected information from 1789, time series coverage varies as we only code country-year observations included in the Varieties of Democracy (V-Dem) project (Coppedge, Gerring, et al., 2022). There were three main reasons why we opted for following V-Dem’s definitions of country units and related time series: saving resources by using an existing template; V-Dem’s template being well-defined and transparent; measuring education policies for country-years where (V-Dem) covariates are accessible. Figure 1 shows the number of polities coded by year. Roughly 50 countries have time series from the late 18th century and ten additional countries from about 1830 until the turn of the century. Following the V-Dem time series (for details, see Coppedge et al., 2022), the majority of the remaining countries are coded from 1900 onwards. Most of the countries with time series starting in 1900 are former African and Asian colonies. Other countries’ time series, mostly new states emerging around 1990 with the breakdown of Yugoslavia and the Soviet Union, started even later. Data coverage, by year, for our measure on compulsory education. Note. The vertical dashed line for 1900 highlights that the sample expands notably this year. Following V-Dem’s time series, EPSM codes several (former) African and Asian colonies from 1900 onwards.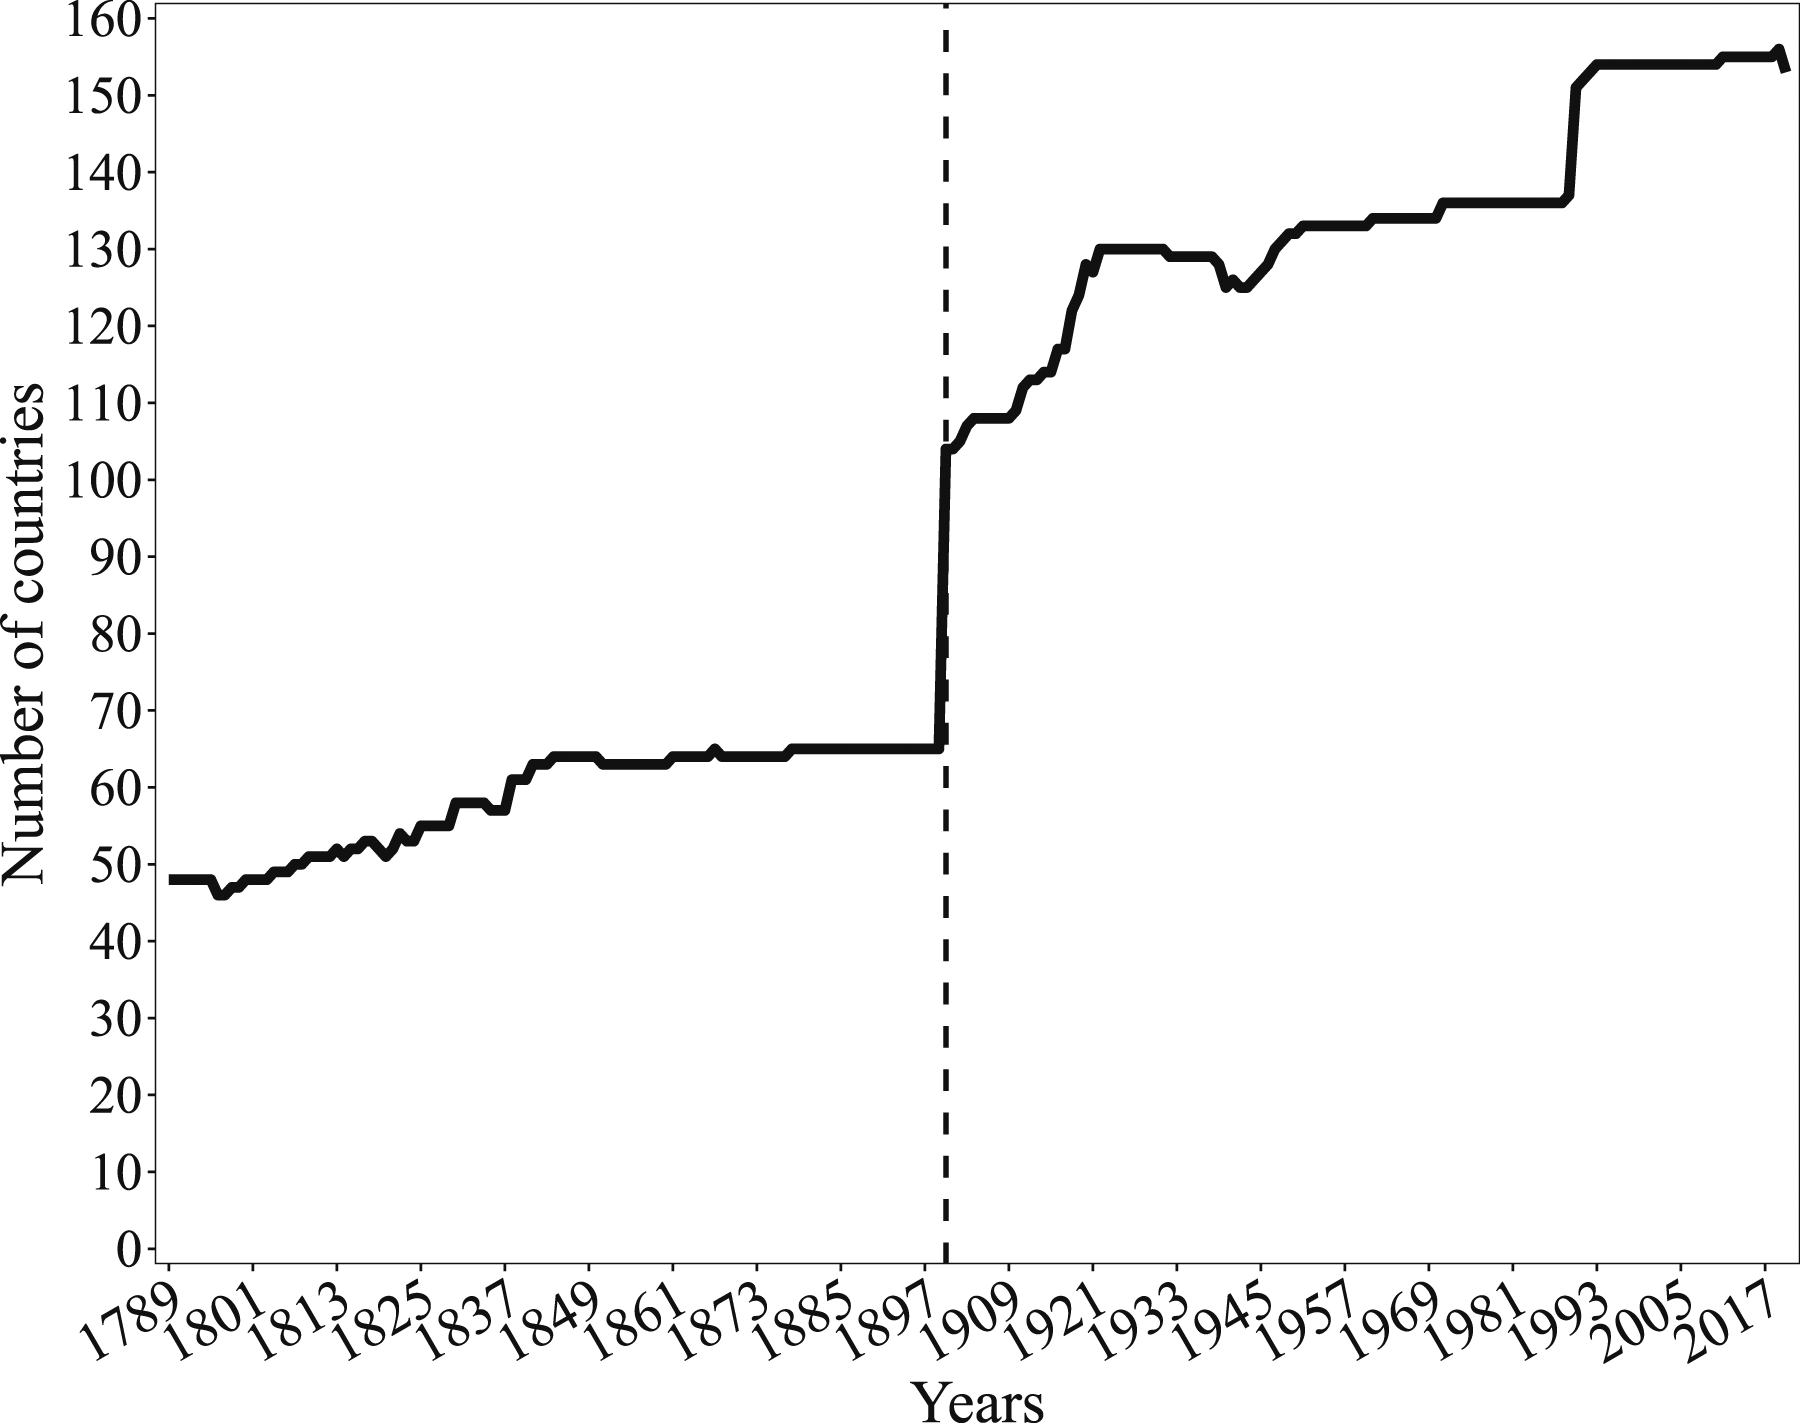
Validation
Despite the above-described measures taken to ensure high reliability and validity, coding efforts such as ours inevitably face challenges, for instance, because having multiple sources leaves room for interpretation. To further address such concerns, we start by cross-validating the most comparable items from EPSM against similar measures from Paglayan’s (2021) recent dataset on initial state interventions in primary education for 33 European and Latin American countries.
The four charts in Figure 2 compare the coded years for when central governments began to, respectively, (1) establish mandatory education for all primary schools, (2) provide mandatory curriculum, (3) mandate free education, and (4) train prospective teachers. The dots represent when EPSM identifies a state intervention in primary education and the circles depict Paglayan’s data points. When circles surround dots, the two datasets converge. This is the norm; the upper-left panel of Figure 2 shows that both datasets identify similar first years for governments implementing compulsory primary education in 31 of 33 countries. Comparing indicators of education from EPSM and Paglayan (2021). Notes. Measures are indicating the first year the different characteristics are registered for a particular country.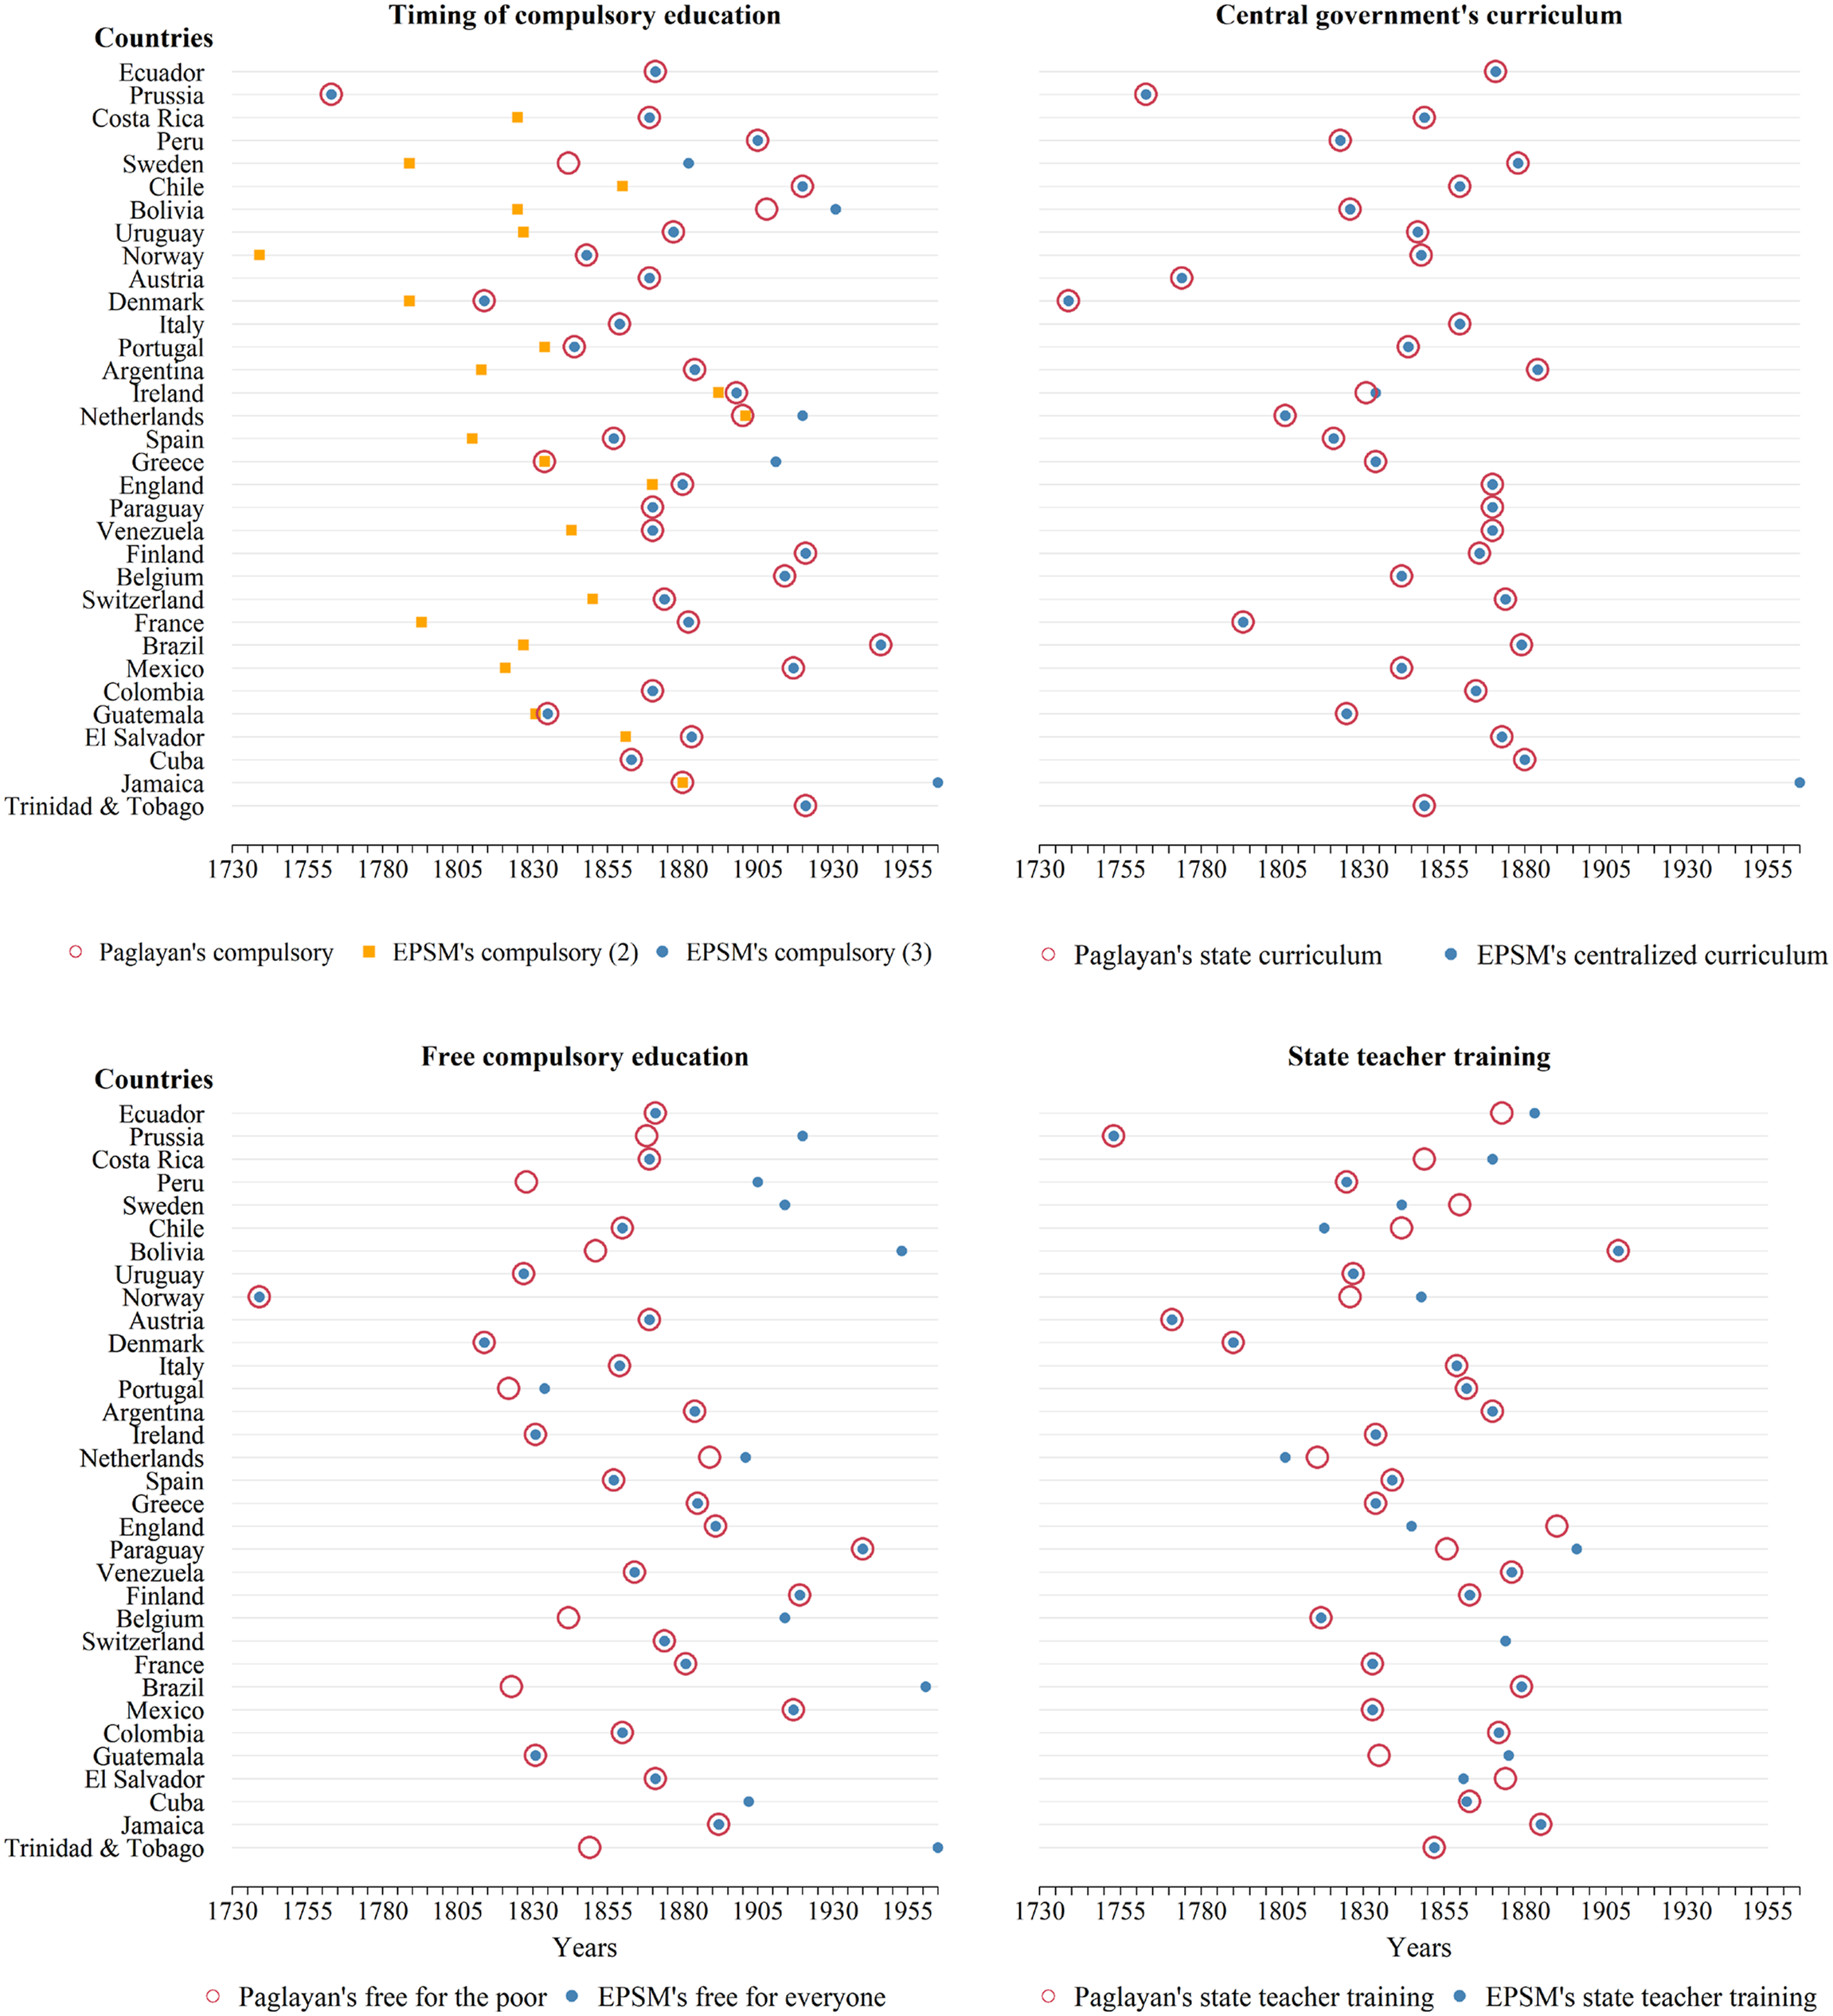
The orange squares in Figure 2’s upper-left panel highlight another innovative aspect of EPSM: it measures when some groups are exempted from compulsory primary education, explicitly by law or due to the demanding requirements of establishing schools (which is one example of how EPSM also takes certain, but key, de facto considerations into account). The relative locations of orange squares and blue dots show that such compulsory education with exemptions for at least one group consistently precedes compulsory primary education for everyone. This new information on (early) compulsory education laws with exemptions may add nuance to descriptive analyses of the introduction of compulsory education globally. It also opens up for investigating the causes and consequences of different types of compulsory education and historical group-based discrimination.
The two cases where the datasets diverge, Sweden – coded in 1842/1882 by Paglayan/EPSM – and Bolivia – coded in 1908/1931 by Paglayan/EPSM – are instructive. They illustrate how divergences typically reflect small differences in coding rules and assumptions rather than measurement errors in any of the two datasets. In both cases, Paglayan registers the year of a law that made it mandatory to establish at least one school in medium- and highly-populated towns and that contained financial requirements. According to our coding rules, however, the specific requirements contained in these laws are sufficient for registering that some groups are exempt from compulsory education for geographical reasons (i.e., compulsory education for all does not apply). We also find no explicit mention of mandatory schooling or reinforcing practices (e.g., if children are not sent to school, parents must pay a fee or be prosecuted) in these laws. For Bolivia, we note that the native population was included in the education system for the first time only in 1931 (this was reverted again in 1940). In Sweden, children were exempt from primary compulsory education (Folkskola or ambulatory teachers) if their parents decided to educate them at home or they could not attend school due to the absence of routes or related geographical reasons (Petterson, 1991; Westberg, 2017). Accounting for these exemptions, de jure compulsory education for everyone first occurred in Sweden in 1882.
A similar high degree of coding convergence appears when comparing scores for whether and when national governments established a centralized curriculum (upper-right panel Figure 2). There are very few diverging cases between our centralized curriculum (“national government only;” i.e., variable score of 4) coding and Paglayan’s coding. An exception is Jamaica, where only EPSM identifies that the national government regulates the school curriculum (via Paragraph 43(1) of the 1965 Education Act).
We observe more divergent cases in the two bottom panels, although convergence remains the norm. Specifically, the first year of free education is coded differently in nine cases (bottom-left), and there are eleven cases of disagreement for state-led teacher training (bottom-right). These differences mainly stem from two assumptions that differ between the two data collection efforts. First, EPSM codes whether free education exists for everyone, while Paglayan codes whether the state provides grants for the poor to enroll in primary schools. Note that EPSM does not register the existence of free education when we find evidence (from legal text) of school fees to be paid for one or more groups of students or that grants are provided after state-led competence examination. Second, EPSM explicitly assumes that teacher training questions refer to compulsory education at all levels (not just primary schooling). EPSM also codes mandatory state-led teacher training (or any other source of training) as absent when there is evidence that more than 50% of teachers do not need a formal degree or training to obtain a job. 10 For example, Costa Rica followed the so-called Lancaster method for acquiring new teachers, 11 and the state did not create schools for training teachers until 1869 (with Decreto Ejecutivo n.◦69, Reglamento de Instrucción Pública).
In sum, there is a high degree of convergence between Paglayan’s (2021) and our coding of the initiation of four specific education policies across European and Latin American countries. And, when coding does diverge, we have tracked down the source of divergence. Divergences typically reflect minor differences in concepts (e.g., teacher training for primary school vs. all levels) or in particular assumptions (e.g., our added assumption that education is not free if legal texts mention that categories of students pay school fees or receive grants after examinations). Hence, divergences are substantively interesting and seemingly not indicative of low reliability or validity in any dataset (but rather of complementary information).
Indeed, we reach similar conclusions when comparing EPSM with another recent dataset, V-Indoc (Neundorf et al., 2023). We assessed whether the two datasets show similar trends for selected, resembling variables. Specifically, Figure 3 compares trends in average scores of EPSM’s and V-Indoc’s curriculum centralization measures for different world regions. Both datasets capture de jure levels of curriculum centralization, but EPSM uses in-house coding and V-Indoc uses several country experts (and subsequently aggregates their scores using V-Dem’s measurement model). There are also nuances in the question categories and differences in thresholds between categories, meaning that the two indicators are not readily comparable. To increase comparability, we thus harmonized the ordinal scales of both indicators to distinguish whether curriculum content is set by national authorities (value 2), national and sub-national authorities (value 1), or (various) sub-national units (value 0). We also follow V-Indoc’s recommendation of only including observations coded by three or more experts (see Appendix B for additional analysis and discussions). Comparing curriculum centralization indicators from EPSM and V-Indoc. Notes. Regional means surrounded by 95% confidence intervals. We re-coded and harmonized both indicators to have similar scaling (see text). We follow V-Indoc’s (2023) recommendation and only include observations coded by 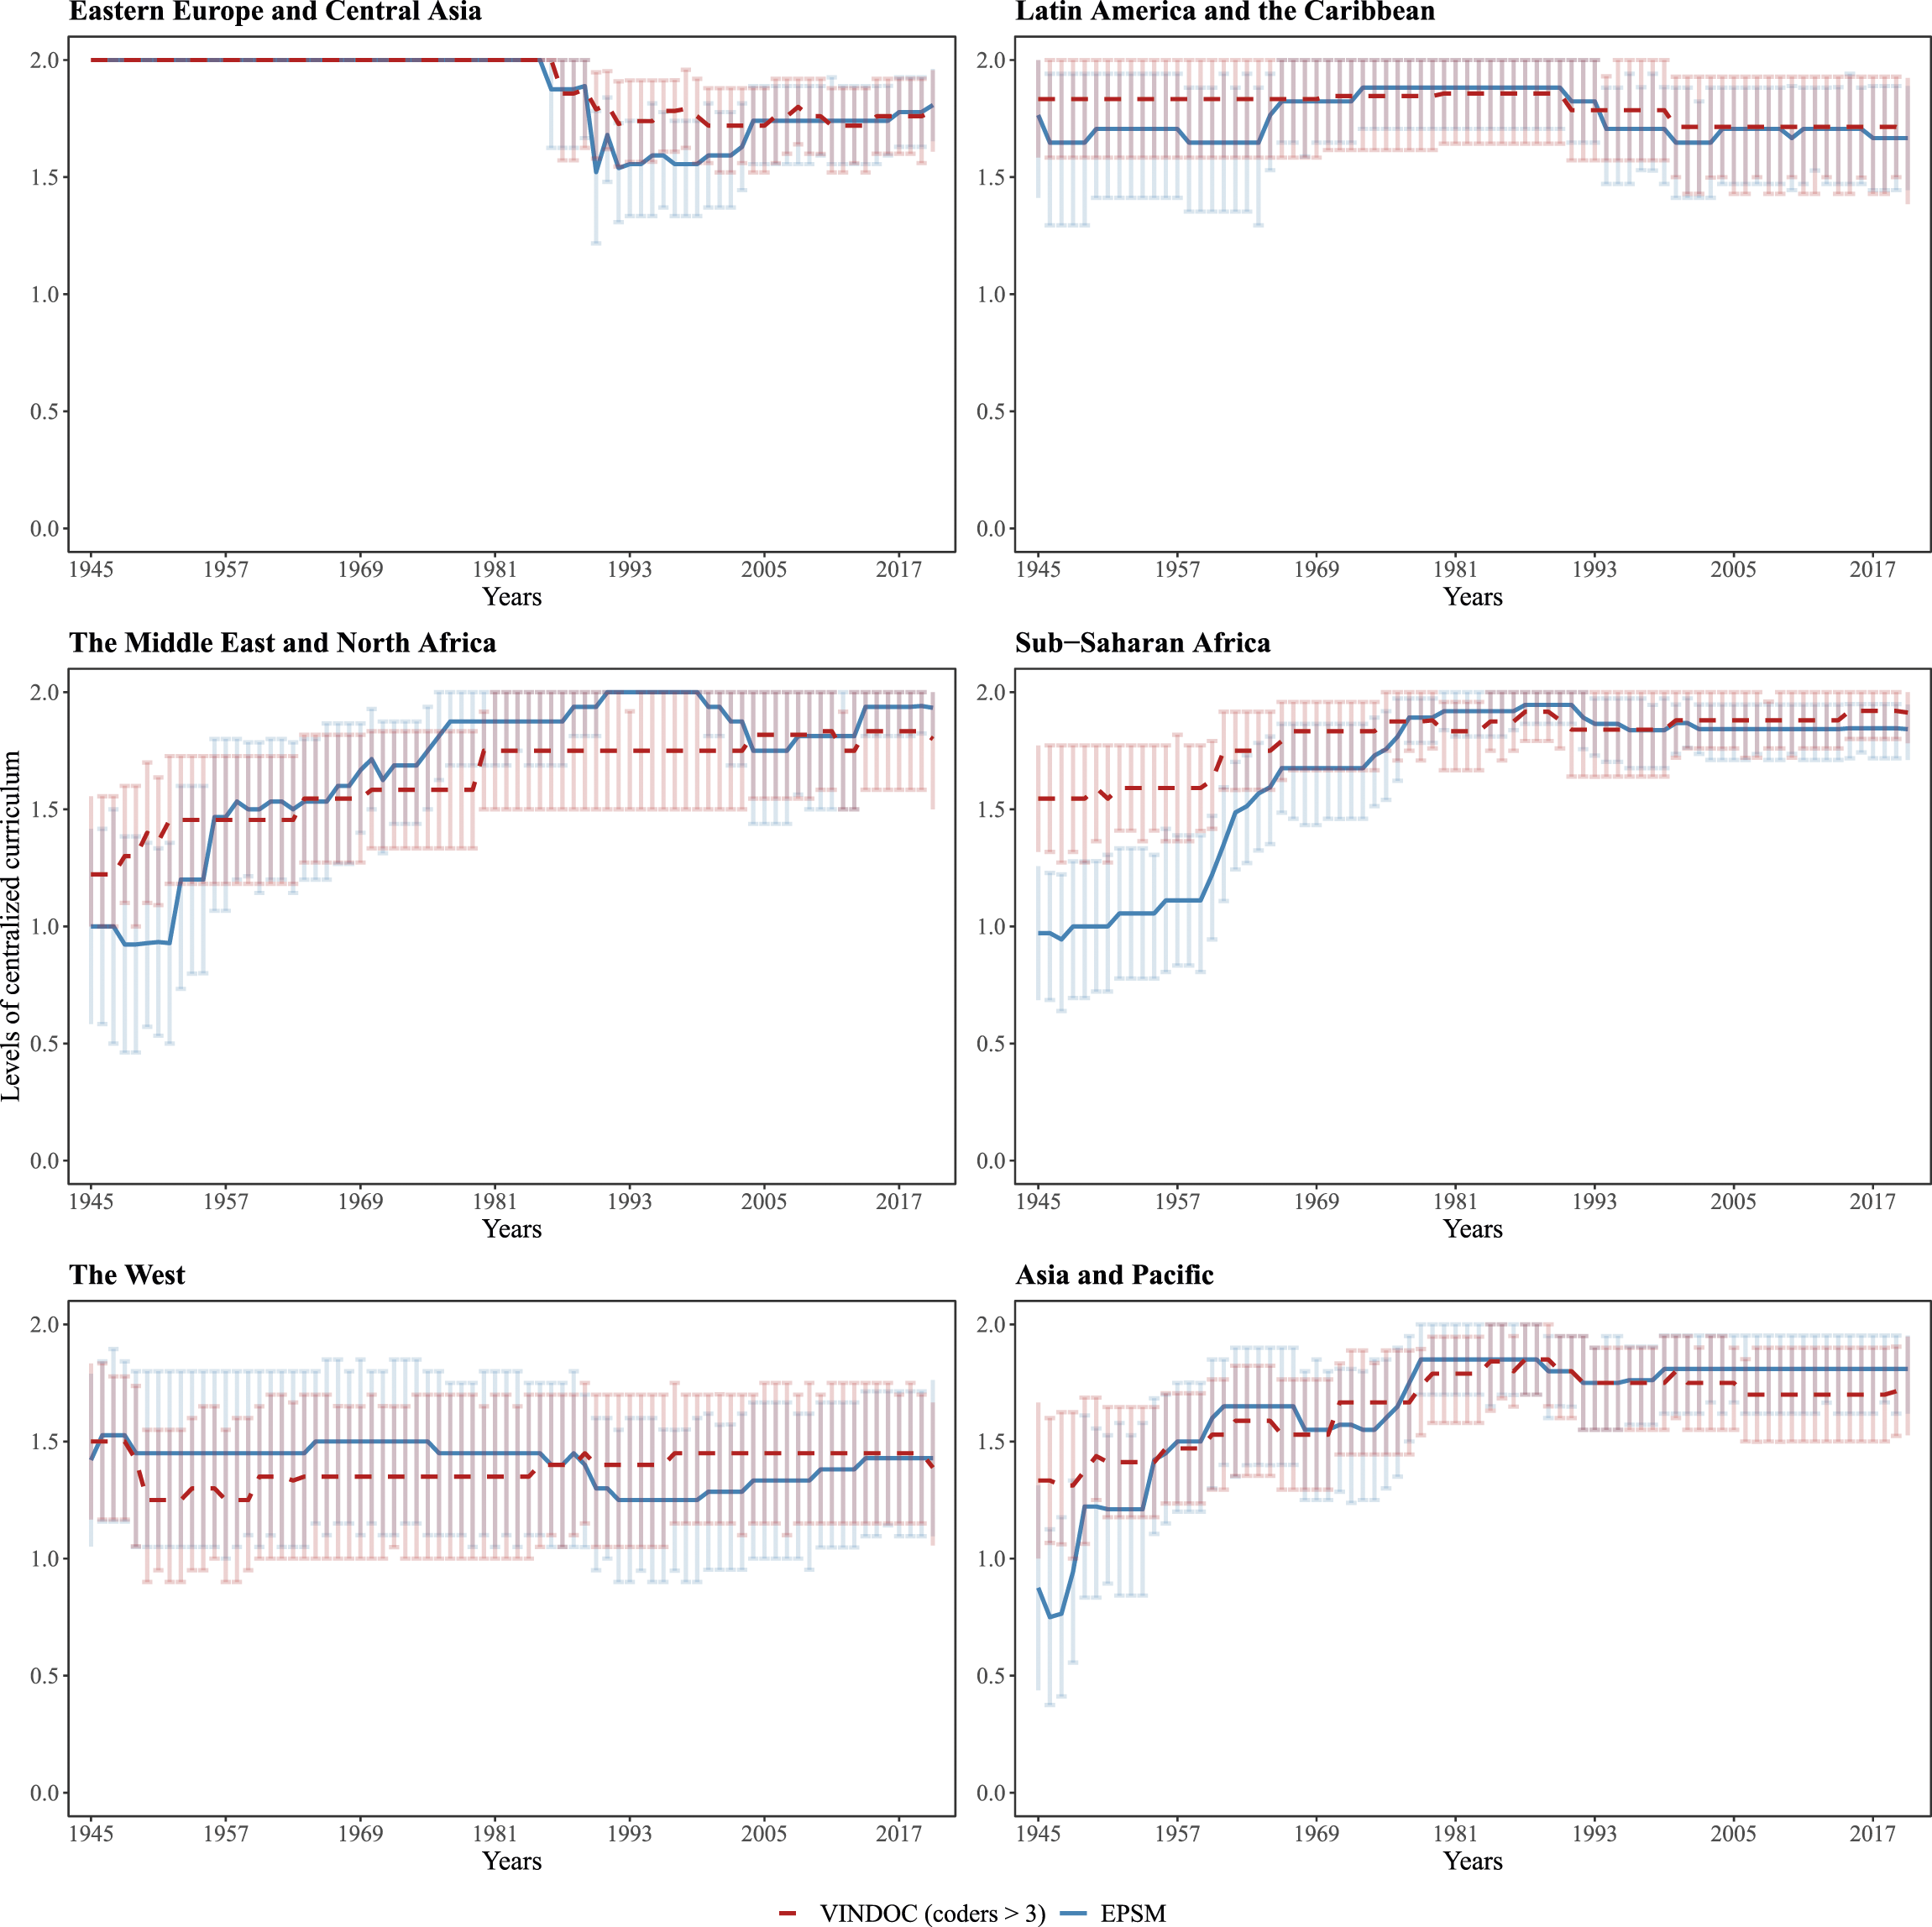
Despite the different category formulations, data collection approaches, and measurement and aggregation methods, there is substantial overlap between the measures across different world regions. One exception, however, is Sub-Saharan Africa, and further inspection suggests that a major source of divergence concerns assumptions about coding non-independent states. Indeed, the sample-wide raw correlation (Pearson’s r) improves from .68 to .75 when we only include independent states. Specifically, much of the difference for non-independent entities stems from differing assumptions about the concept of “national authority” in colonies. Since EPSM focuses on the polity-unit’s government (and not the metropole’s), it considers the colonial government’s legislation on education, with or without input from the metropole government. Hence, we do not code that a “national authority” fully sets the curriculum when (1) it is directly imposed by a colonial power or foreign government so that the colonial government’s involvement in establishing the curriculum is null (e.g., French West Africa), or (2) when dual-education systems exist. In both cases, V-Indoc’s country experts typically consider that “a national authority” established the content of education. Note that given V-Indoc’s restricted focus on public education (ref. EPSM’s condition (2) on dual systems) and specific question wording, this makes sense insofar as colonial powers can be considered a form of national authority. 12
Finally, we compare data from EPSM with Ansell and Lindvall (2020), covering 19 primarily Western countries historically. More specifically, we compare measures of “education centralization” from the two datasets for the pre-WWII period. For Ansell and Lindvall’s measure, a highly centralized national education system – coded as 2 – is registered when teachers in primary education are state employees, or local and regional institutions have little influence over hiring decisions, promotions, salaries, and employment conditions. When sub-national government units have such an influence, they code 1, and they code 0 otherwise.
Yet, education centralization can be considered a multidimensional concept. This is reflected by EPSM asking questions pertaining to government intervention and centralization for different education system features, namely education curriculum (edu_power), system-level political administration (edu_dep), and the management and funding of schools (for primary education: operate_prim). 13
To enhance comparability, we first aggregate the three EPSM indicators into a composite centralization index. We do this by constructing a dichotomous measure scored ‘1’ if (a) there is a ministry or department of education (edu_dep
The trends in sample-wide averages in Figure 4 (panel a) indicate good correspondence between the two measures. Still, the country-year level correspondence (Pearson’s r = .74) is far from perfect – we present and discuss selected country-specific patterns in Appendix B – and a closer look at the individual EPSM indicators gives us a clue why: the timing and level of education system centralization depends on what dimensions we consider. Figure 4 (panel b) plots averages (for 19 countries with data on all measures) of centralized education systems concerning teachers (Ansell and Lindvall’s (2020) measure), funding and management of schools (recoded version of EPSM’s opera_prim),
14
determining curricula (edu_power), and system-level political administration (edu_dep). Comparing these measures suggests that, historically, the state’s involvement in teacher recruitment and regulations came later in many countries than other aspects of education centralization. For example, the 1860s marks the beginning of (national or subnational) governments’ efforts to centralize education systems if we follow Ansell and Lindvall’s (2020) teacher-centered measure. However, in several countries, government-led efforts at centralizing other aspects of the education system preceded these developments. Several governments focused on centralizing control over the curriculum first, and this practice, as well as the creation of a ministry of education, was present in around half of the countries with data already in the late 1840s. Second, and related, the EPSM data indicate that more countries have a centralized education system. From the 1870s, all centralization measures increase, but once again, the increase started earlier and leveled off at higher scores (suggesting prevalence in more countries) for aspects other than teacher recruitment and regulation. Comparing education centralization measures from EPSM and Ansell and Lindvall (2020): Averages across 19 countries with data on all measures. In panel (a), we use re-coded, dichotomized measures (see text). In panel (b), measures are normalized to 0–1: “teachers” refers to Ansell and Lindvall (2020)’s centralization measure, whereas the other measures are from EPSM. Appendix B includes plots showing variation across and within countries. 95% confidence intervals included in panel (a) but not in panel (b) (to provide a clearer plot).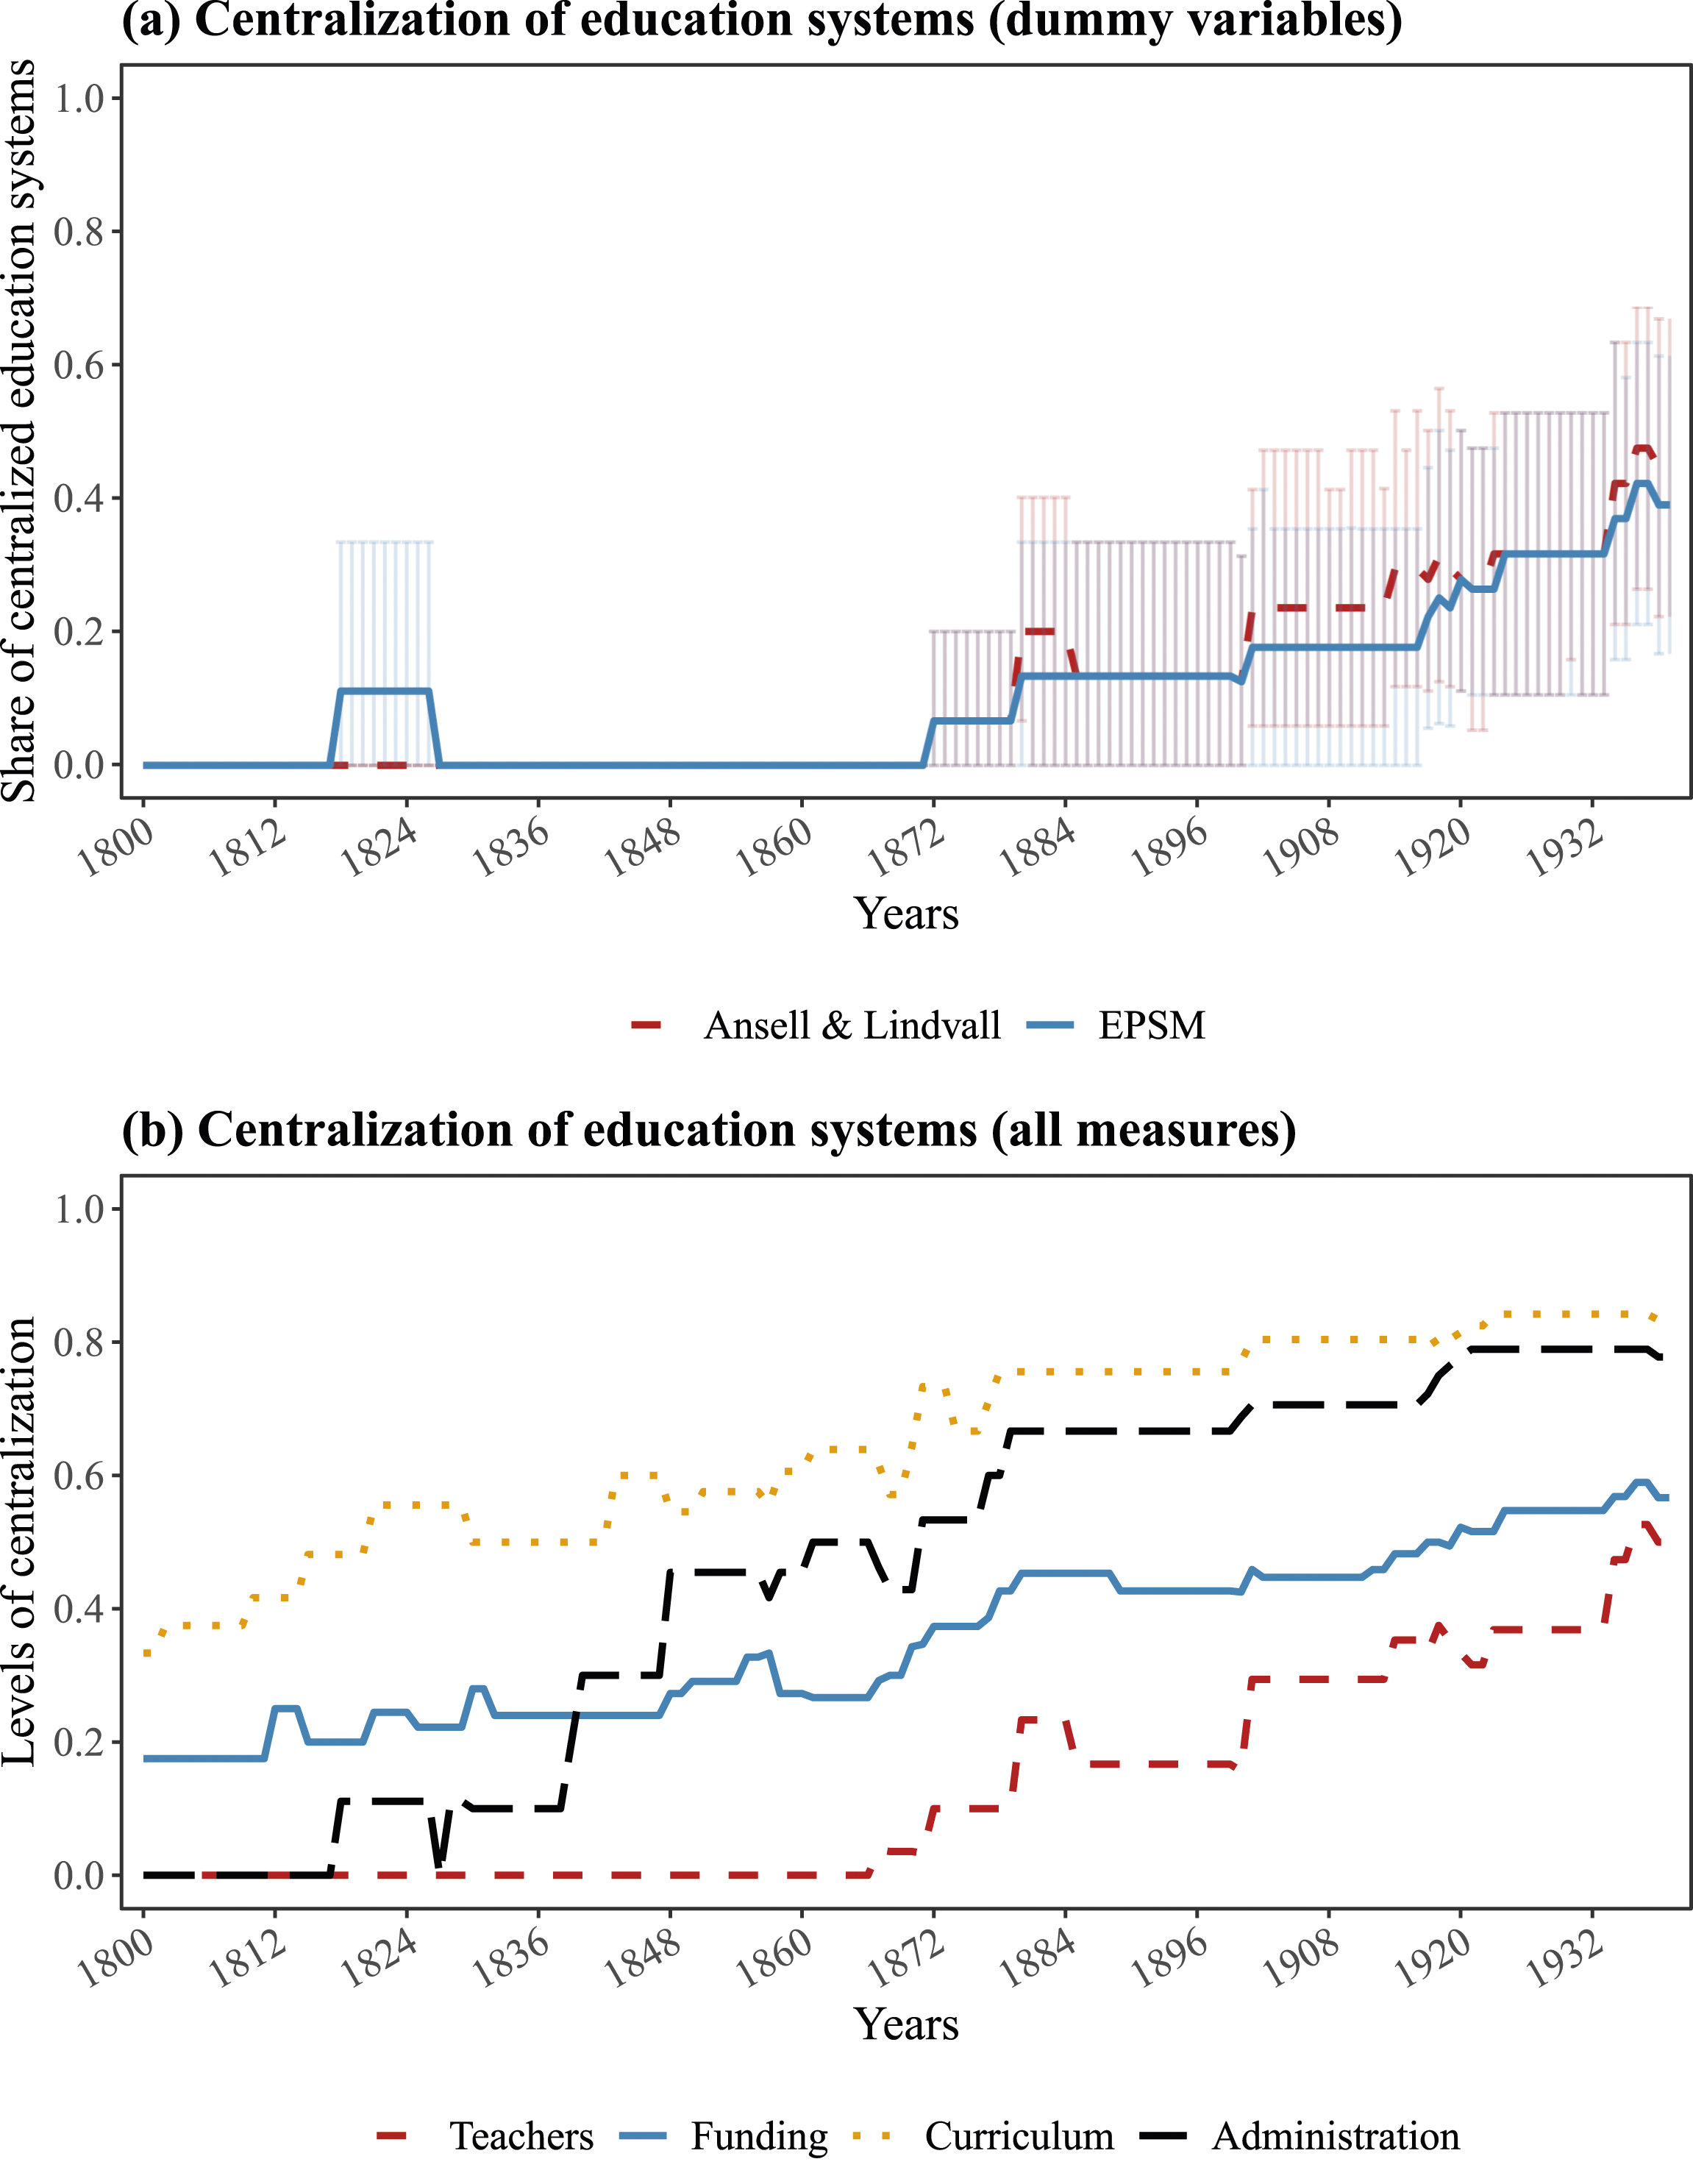
The latter exercise showcased two of EPSM’s strengths, namely long historical time series and multiple measures that enable describing nuanced developments across different areas. Furthermore, since EPSM covers 157 countries worldwide, it can be used to describe patterns also outside the largely Western, currently industrialized countries measured by Ansell and Lindvall (2020) and contained within Figure 4. We illustrate this point in the next section.
Describing Historical Global Trends in Education Systems
This section illustrates the many intriguing real-world patterns that can be identified by using the wealth of information contained within EPSM. Our goal is not to offer detailed discussions and interpretations of particular cross-country patterns or historical trends. Instead, we display and briefly describe several global trends across the four dimensions of education policies and systems that we measure in order to showcase EPSM’s contents.
We start by considering global trends in compulsory education after 1789. Figure 5 contains three plots displaying, by year, the shares of countries with compulsory education and with free compulsory education, alongside average years of free compulsory education. The two former plots show a gradual but dramatic expansion – starting from around 1855 and continuing to today – in compulsory education for all (i.e., without exceptions based on gender, class, ethnicity, etc.) as well as free such education globally. While not perfectly correlated, the two plots indicate that, historically, the spread of compulsory education went closely together with the spread of free education for everyone. Compulsory education trends. Notes. The vertical lines for 1900 are included to highlight that the sample expands notably this year, adding several African and Asian colonies. This expansion explains most of the global average change this year. The shaded area in panel C represents the 95% confidence interval around the average.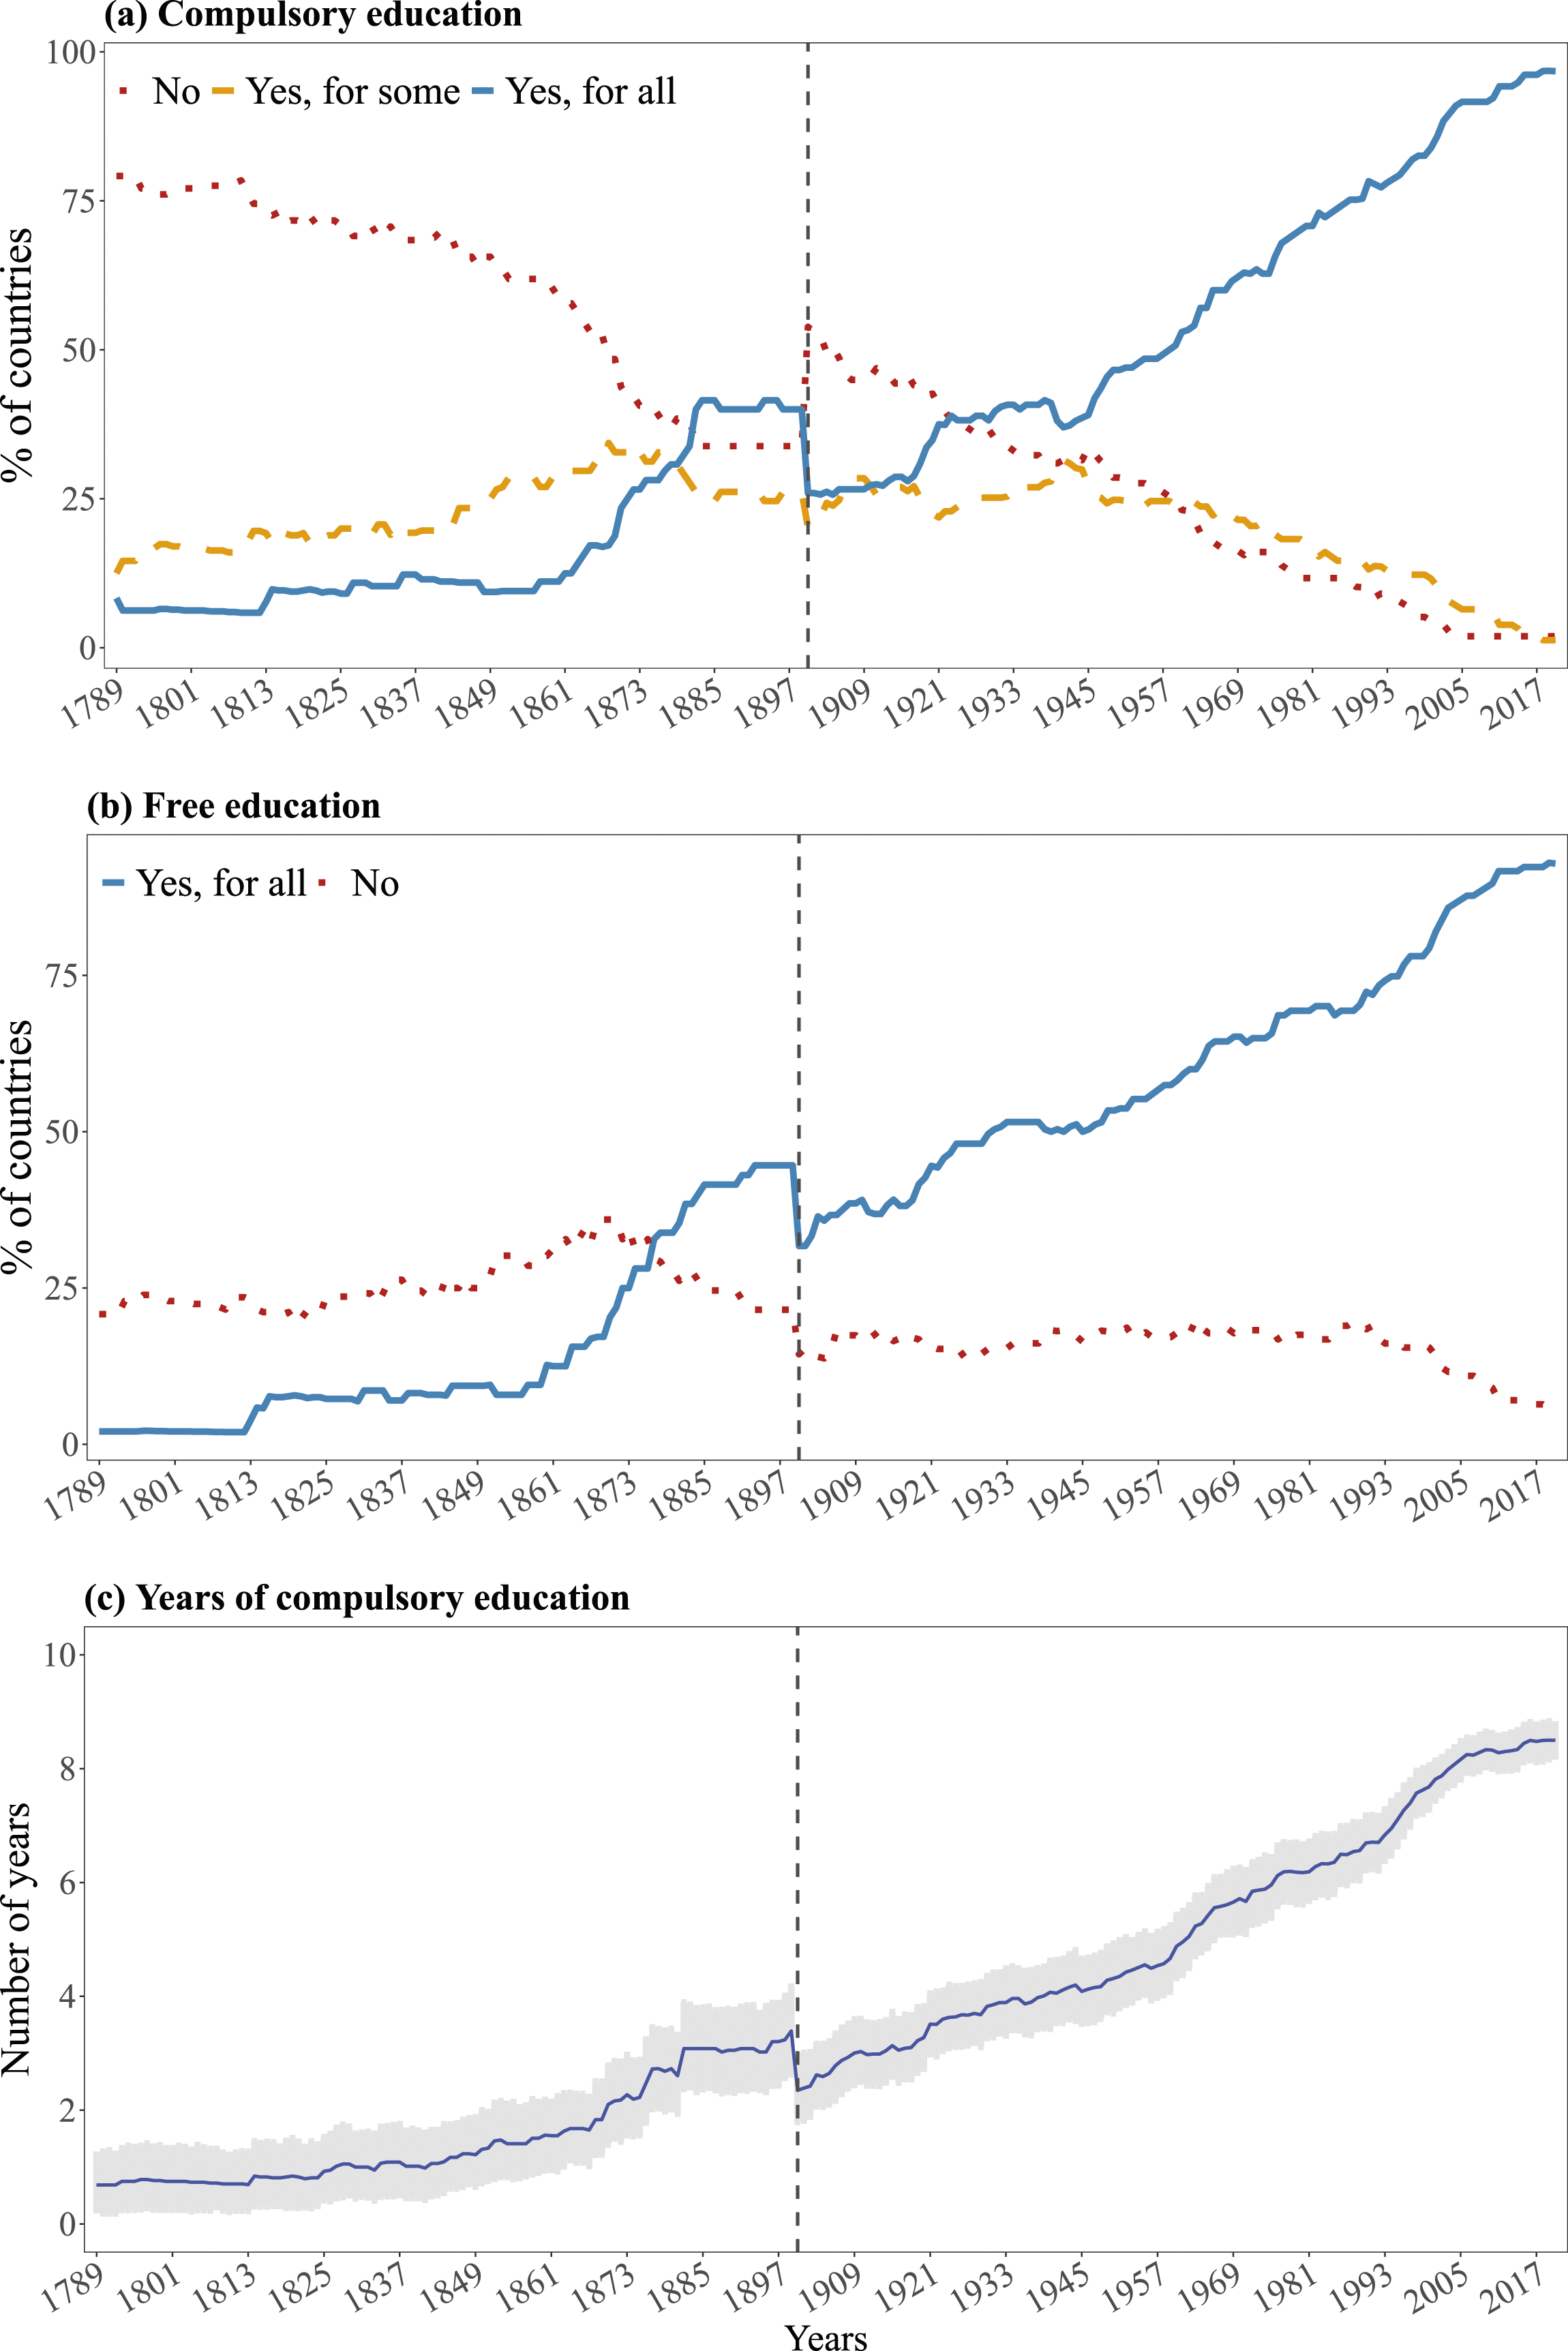
There are almost no countries without compulsory education today. And, as of 2020, only nine countries in our sample still lack free compulsory education. Moreover, only three countries combine compulsory education with exceptions for particular categories of students. Such cases were much more common historically. Until 1870, more countries had compulsory education combined with exceptions (often for girls and remote rural areas) than without exceptions. The former number remained high (around 25% of countries) until World War II, after which it declined gradually.
Regarding average years of compulsory education, we observe a fairly steady increase from less than two years around 1855 to more than eight years in 2010. 15 The dip around 1900 reflects a sample expansion and, specifically, the inclusion of about 50 former Asian and African colonies, which had comparatively few years of compulsory education at the time. In Appendix C.1, we plot the compulsory education histories of all countries; one observation is that education systems across the world were relatively homogeneous in the decades right after the French Revolution (few countries with compulsory education) and have turned homogeneous again (almost all countries have compulsory education for all) after the 1990s. The intermediate period is characterized by a mix of systems.
Let us turn now to education content and, more specifically, the presence of mandated standalone civics education courses or ideological training. Figure 6, panel (a), shows that most countries had mandated standalone civics courses during the late 19th century, either at the primary, secondary, or tertiary level. This share remained quite stable before increasing fast after WWII. As of 2020, 60% of countries mandated standalone civics education courses or ideological training in primary and secondary education. Ideological training trends. Notes. For panel (a), shares do not always sum to 100% due to missing values. For panel (b), we plot the five most frequent categories. The categories excluded are civic courses with ethnic ideology profiles, leader-specific ideology, and “other ideologies” (e.g., environmentalism, yoga). Courses may be registered with multiple ideological profiles (e.g., nationalism and religion), and shares can thus sum to 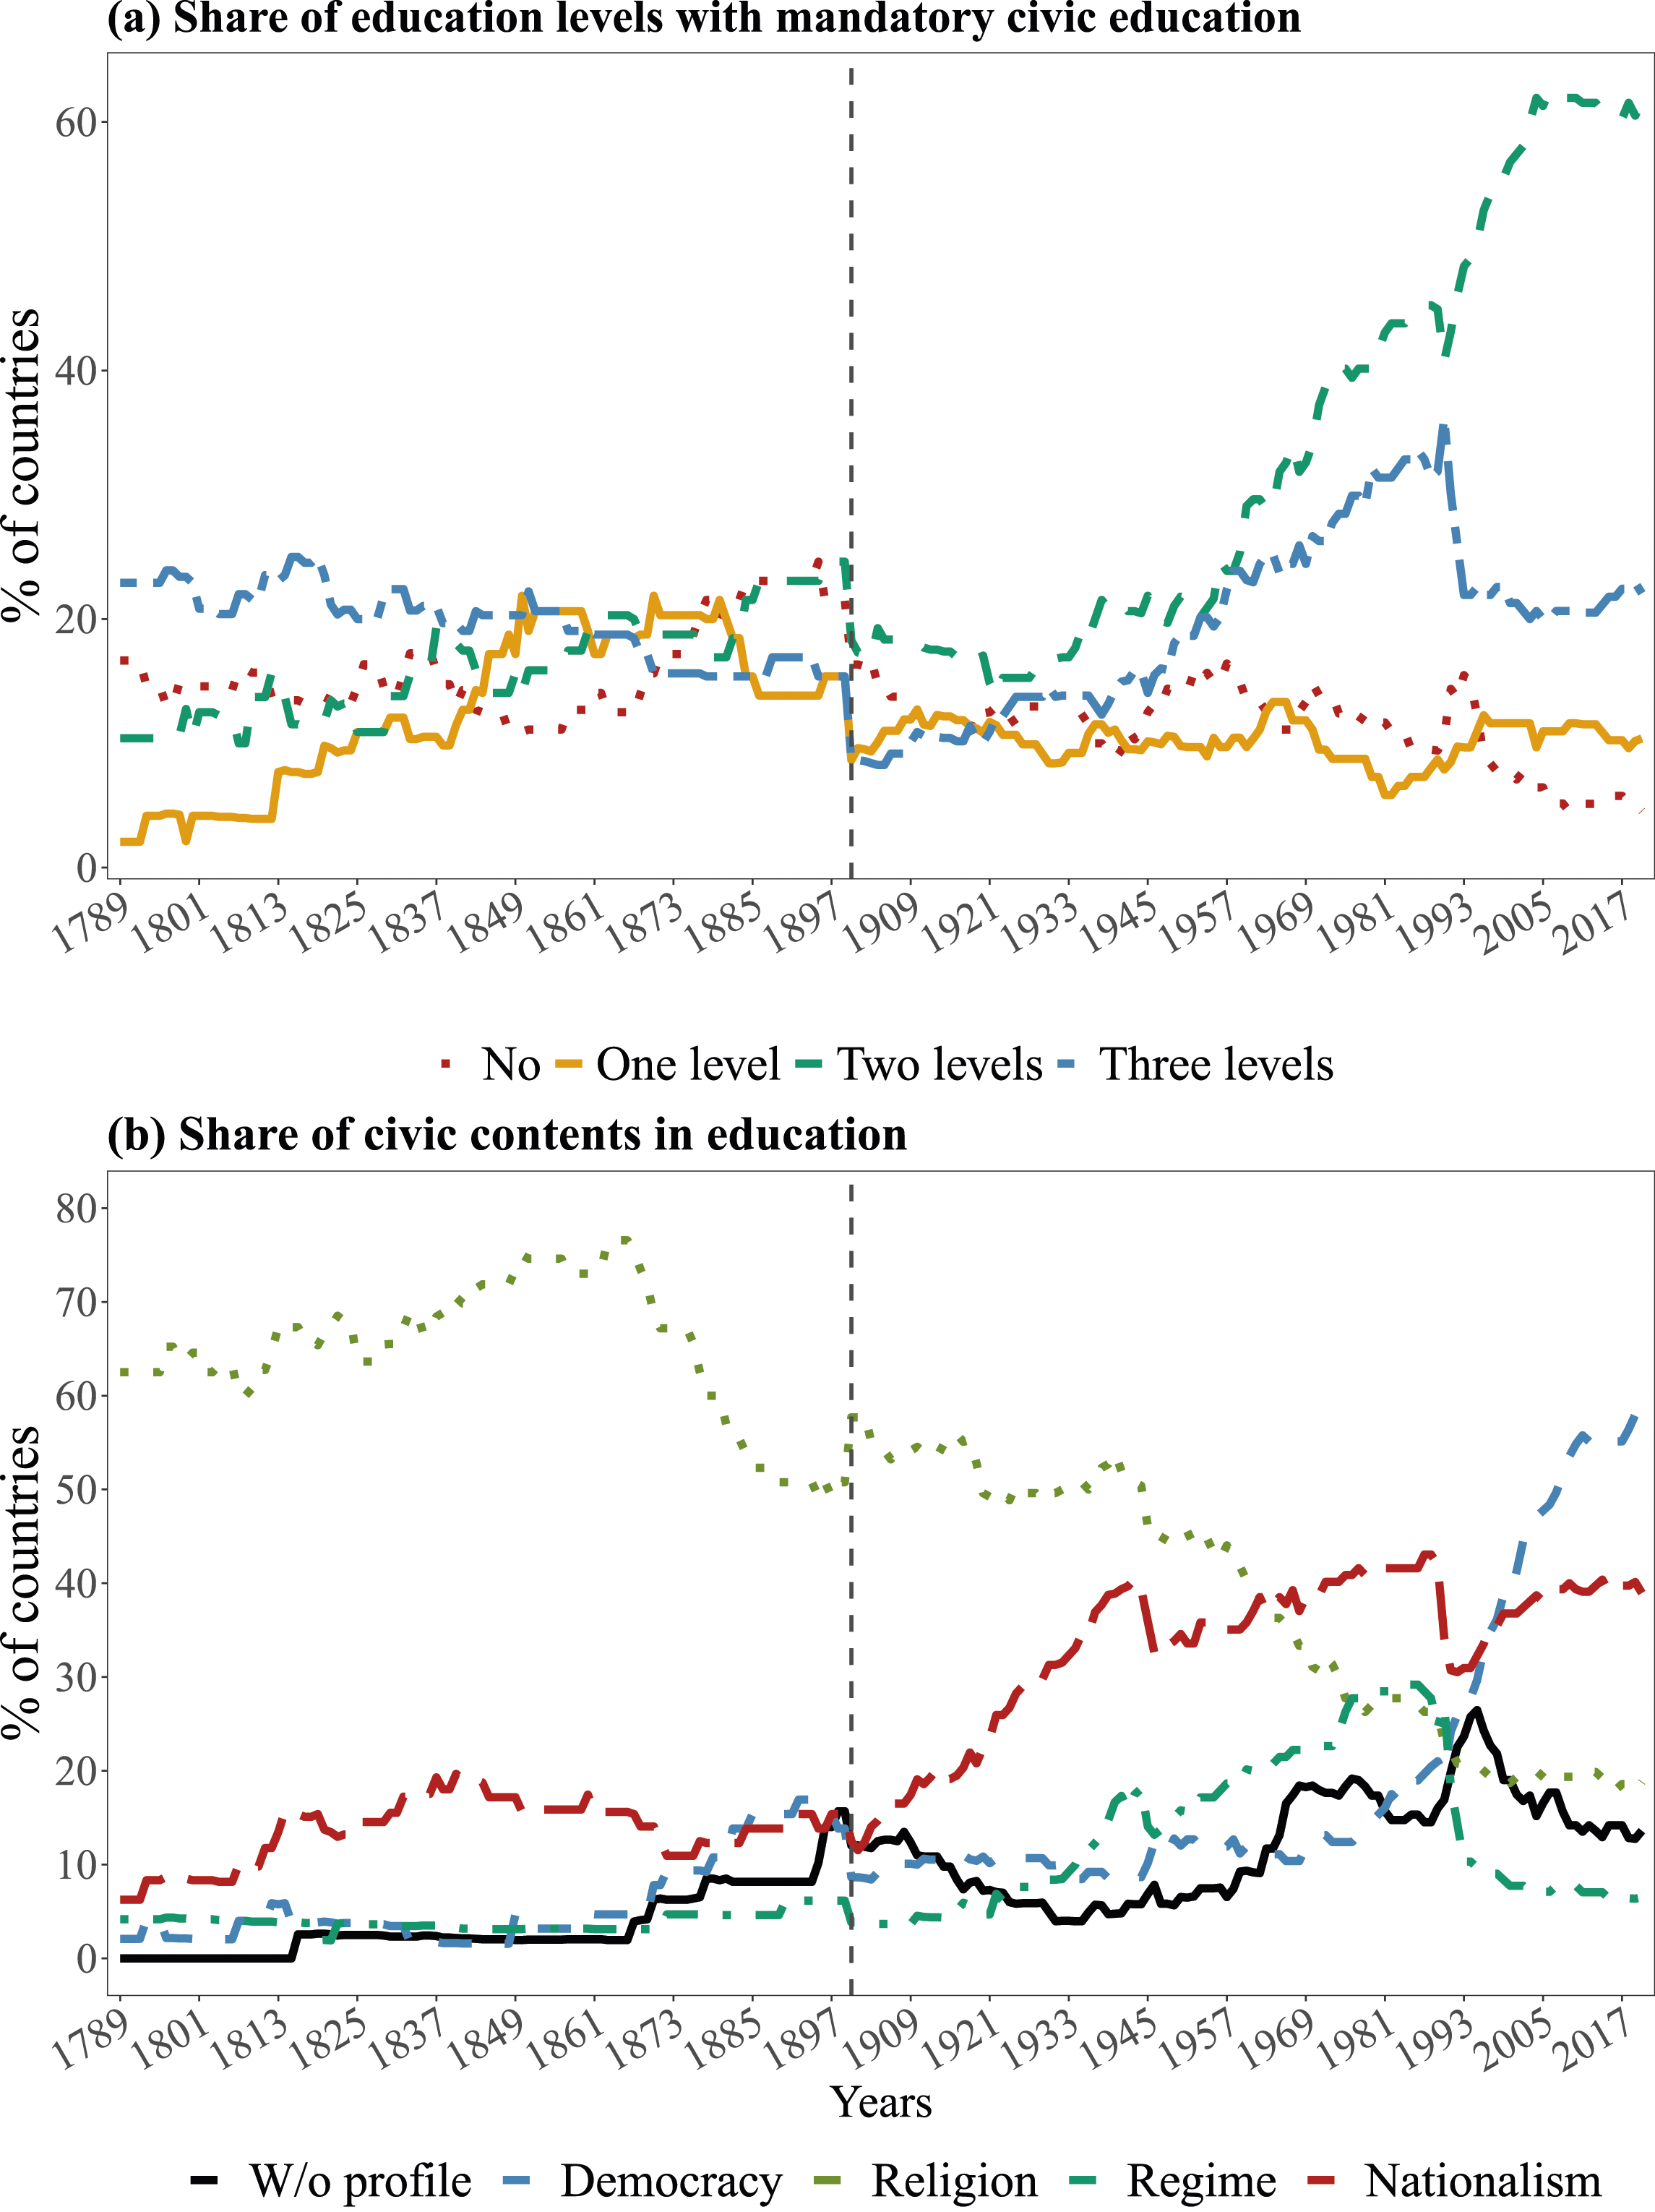
Regarding the courses’ ideological content, our data reveal rich cross-country and over-time variation. Figure 6, panel (b), plots the five most frequent categories registered in EPSM: civic education without a clear ideological profile plus civic education centered on, respectively, democracy, religion, nationalism, and regime-specific ideologies (e.g., communism, fascism). We remark that civics courses may be coded as having multiple ideologies – nationalism and religion is the most prevalent combination in our data, and nationalism and democracy is the second-most.
One notable pattern is the gradual decline of courses with religious profiles. In contrast, courses centered on nationalist values have been on the rise, especially after the 19th century. Historically, neither civics courses centered on democratic values nor courses centered on more regime-specific ideologies were especially prevalent. Indeed, only around 10% of countries had democracy-centered courses before World War I, and the number was even lower for regime-specific ideology courses. From the interwar period, however, we observe a gradual increase in regime-specific education until 1990, when 30% of states included this type of civics training. After the fall of the Soviet Union, this type of education experienced a sharp decrease. At present, the majority of countries – including several autocracies (see Appendix Figures 38–40) – have civics courses with democracy profiles. Thus, democracy not only became a more prominent regime type after the 1980s, but so did the teaching of its functioning and values in civics classes around the world.
The EPSM data also show a gradual but significant expansion of public education since the early 19th century globally. Figure 7 (panel a) shows that national or sub-national governments have increasingly funded and managed primary and secondary schools. Private actors, especially the church, played a key role in operating schools before 1848. After observing a reduced role in many states during the 19th century, private actors were once again prominent in the early 20th century. Yet, the relatively high frequency of privately funded and operated systems in this era relates to the expanded sample, with several African and Asian colonies being included after 1900. In many colonies, education services were mainly provided by religious actors or a mix of public and private actors. Government intervention and level education centralization. Notes. Panel (a) focuses on compulsory education and counts primary and secondary education as the two levels of education.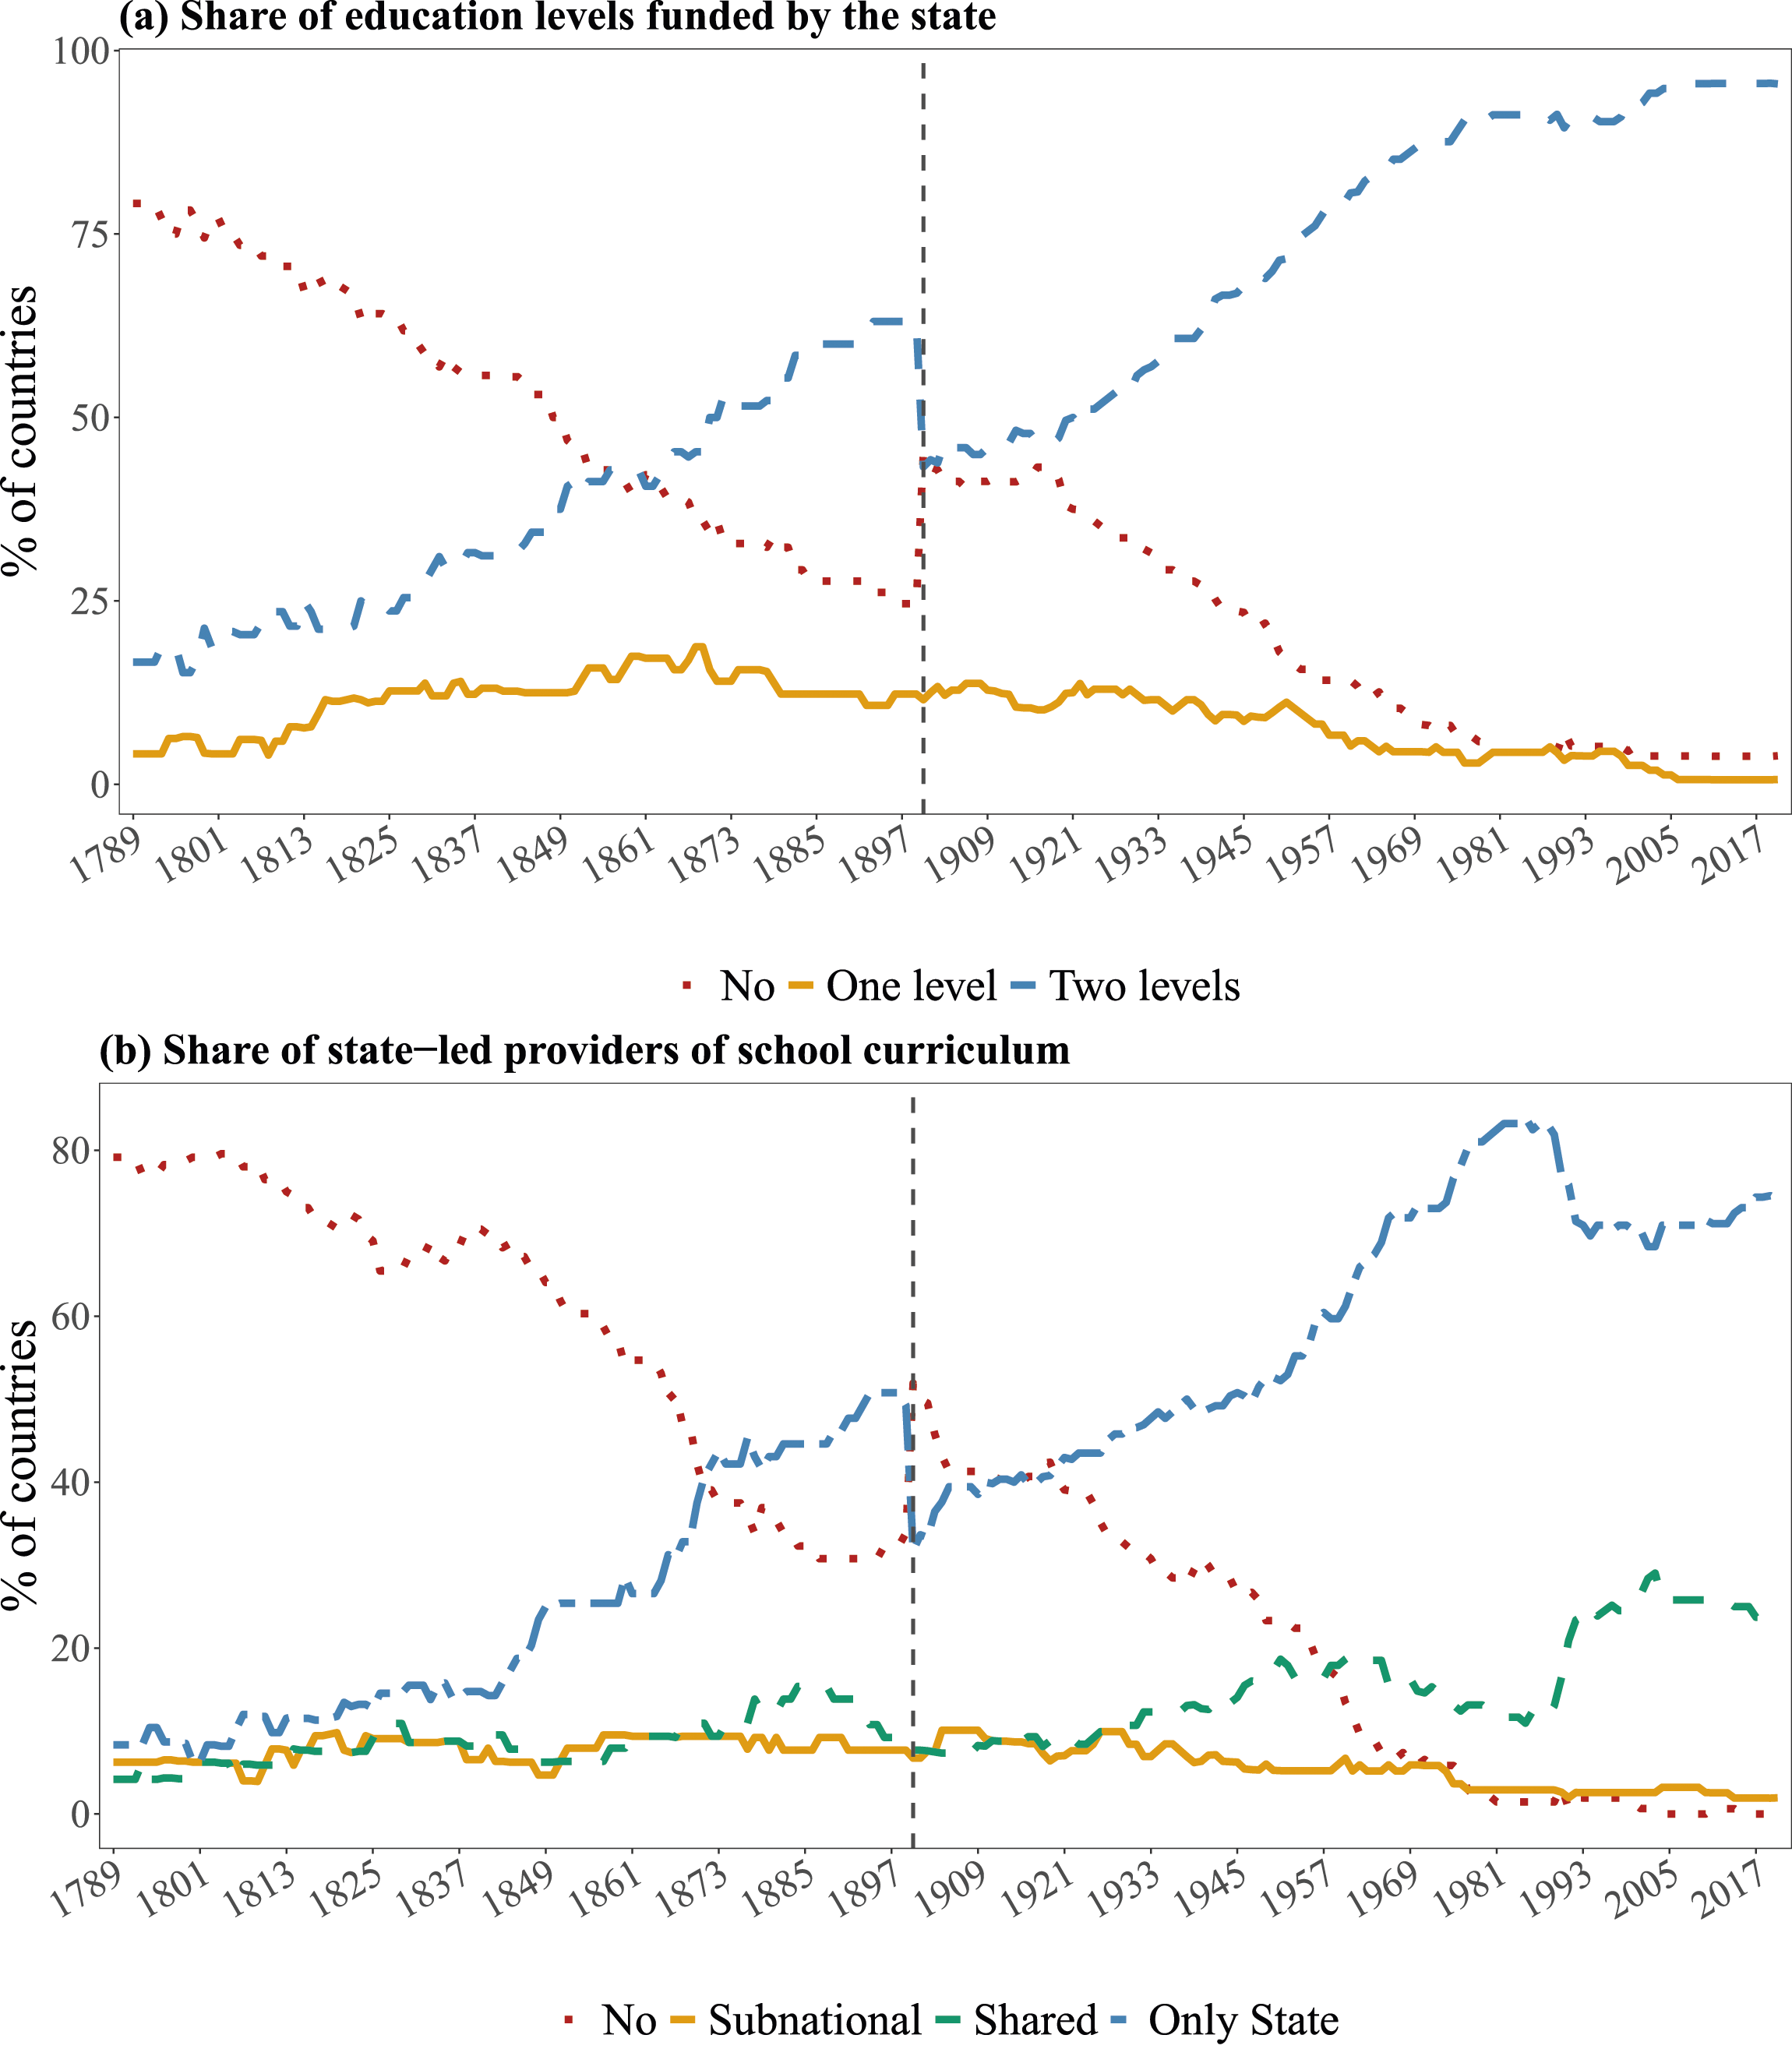
Furthermore, we can observe the expansion of state-determined curricula from Figure 7. Before the mid-19th century, states typically did not intervene in the design and implementation of school curricula. The 1850–1945 period shows substantial cross-country heterogeneity in terms of who determined curricula. However, we observe a gradual increase in the share of countries with a national government curriculum, and after WWII, it became the dominant practice. Sometimes, national governments also collaborate (or at least share responsibilities) with sub-national state actors in determining curricula. This practice became more popular after the Cold War, characterizing roughly 25% of today’s countries.
Next, Figure 8, panel (a) indicates that, after the 1880s, the most common provider of teacher training was the state (either at the national or subnational level). Yet, throughout history, and especially before 1930, many countries had their teachers trained by non-state actors such as religious groups, international organizations, or foreign countries. Currently, this pertains to almost one-fourth of countries. Panel (b) shows trends in teacher training, focusing on the requirements for becoming a teacher. Up until around 1850, most countries either did not require any degree to take on the teacher role or they had very specific requirements, typically requiring priesthood or some other theological training. This was the case, for example, in the United Kingdom. In the following years, and until the 1960s, our data display an about equal split between countries with specific requirements (master’s degree in pedagogical training became increasingly common) and general requirements (e.g., teachers must hold some university degree). Since the 1960s, more countries have demanded specific requirements for candidate teachers, and fewer countries have had (only) general requirements. Teacher training. Notes. By “mix” we mean training provided by both private and state actors. “Specific requirements” refer, for example, to a particular degree or type of education, such as a master degree in pedagogical training “General requirements” means that teachers must hold some university degree.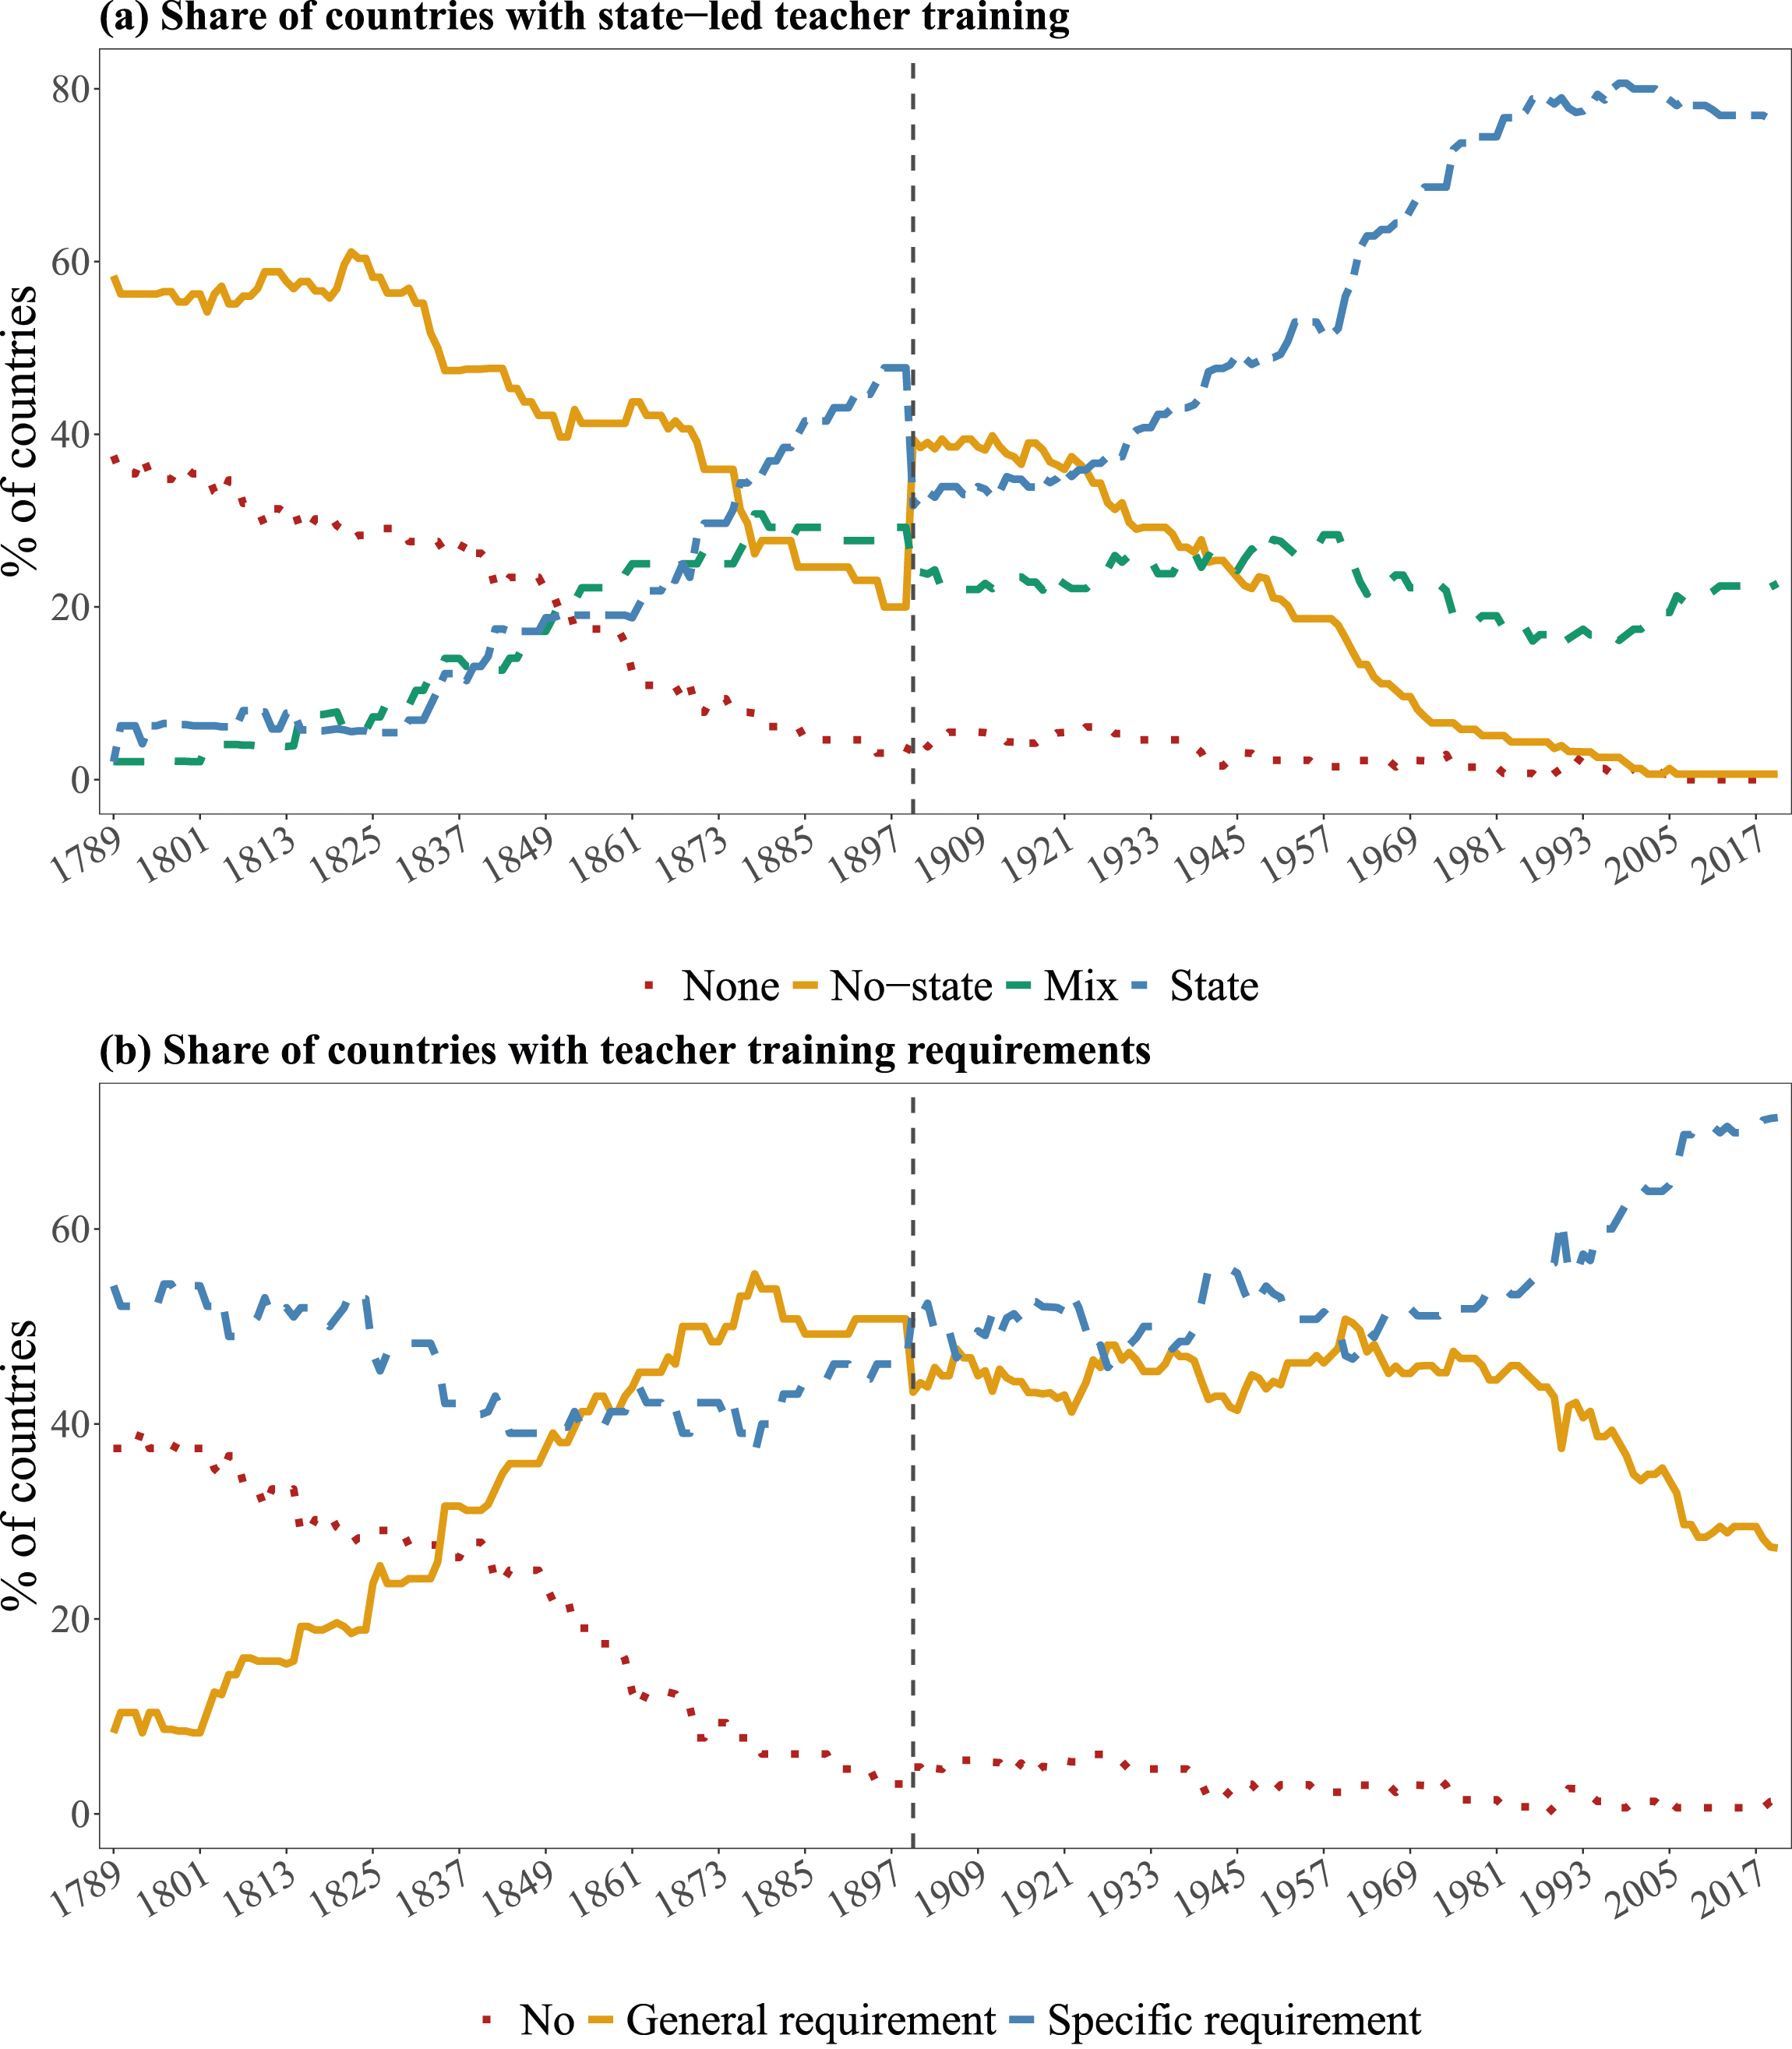
Applications
In this section, we showcase the potential of the EPSM dataset to advance research on questions concerning potential causes or effects of education system characteristics by replicating and extending several recent studies. More specifically, we consider three important themes from the literature: (a) the (complex and reciprocal) relationship between education and democracy (e.g., Ahmadov & Holstege, 2023; Alemán & Kim, 2015; Paglayan, 2021); (b) the impact of education on political attitudes (e.g., Cavaille & Marshall, 2019; Finkel, Neundorf and Rascon Ramirez, 2023; Lee, 2023); (c) how structural factors such as inequality shape investments in, and the designing of, education systems (e.g., Samuels & Vargas, 2023).
Education and Democracy
Studying 33 countries from Europe and Latin America, Paglayan (2021) shows that being a democracy is not a prerequisite for extending compulsory education; instead, the roots of mass education can be found in non-democratic regimes. Education Policies and Systems across Modern allows us to assess this argument on a more extensive and geographically diverse sample of countries. This, in turn, enables us to examine whether similar patterns exist in countries on continents other than Europe and Latin America, which often democratized later or have yet to democratize. Figure 9 illustrates our results, but we refer to Appendix F for further illustrations and more specific numbers on country-specific heterogeneity and typical education–democratization sequences by region. Extension of Paglayan (2021): The Non-Democratic Roots of Mass Education: Evidence from 200 Years. Notes. EPSM allows distinguishing between compulsory education for all (triangle) and subsets of population (cross). Date of first democratization operationalized when Polity2 score 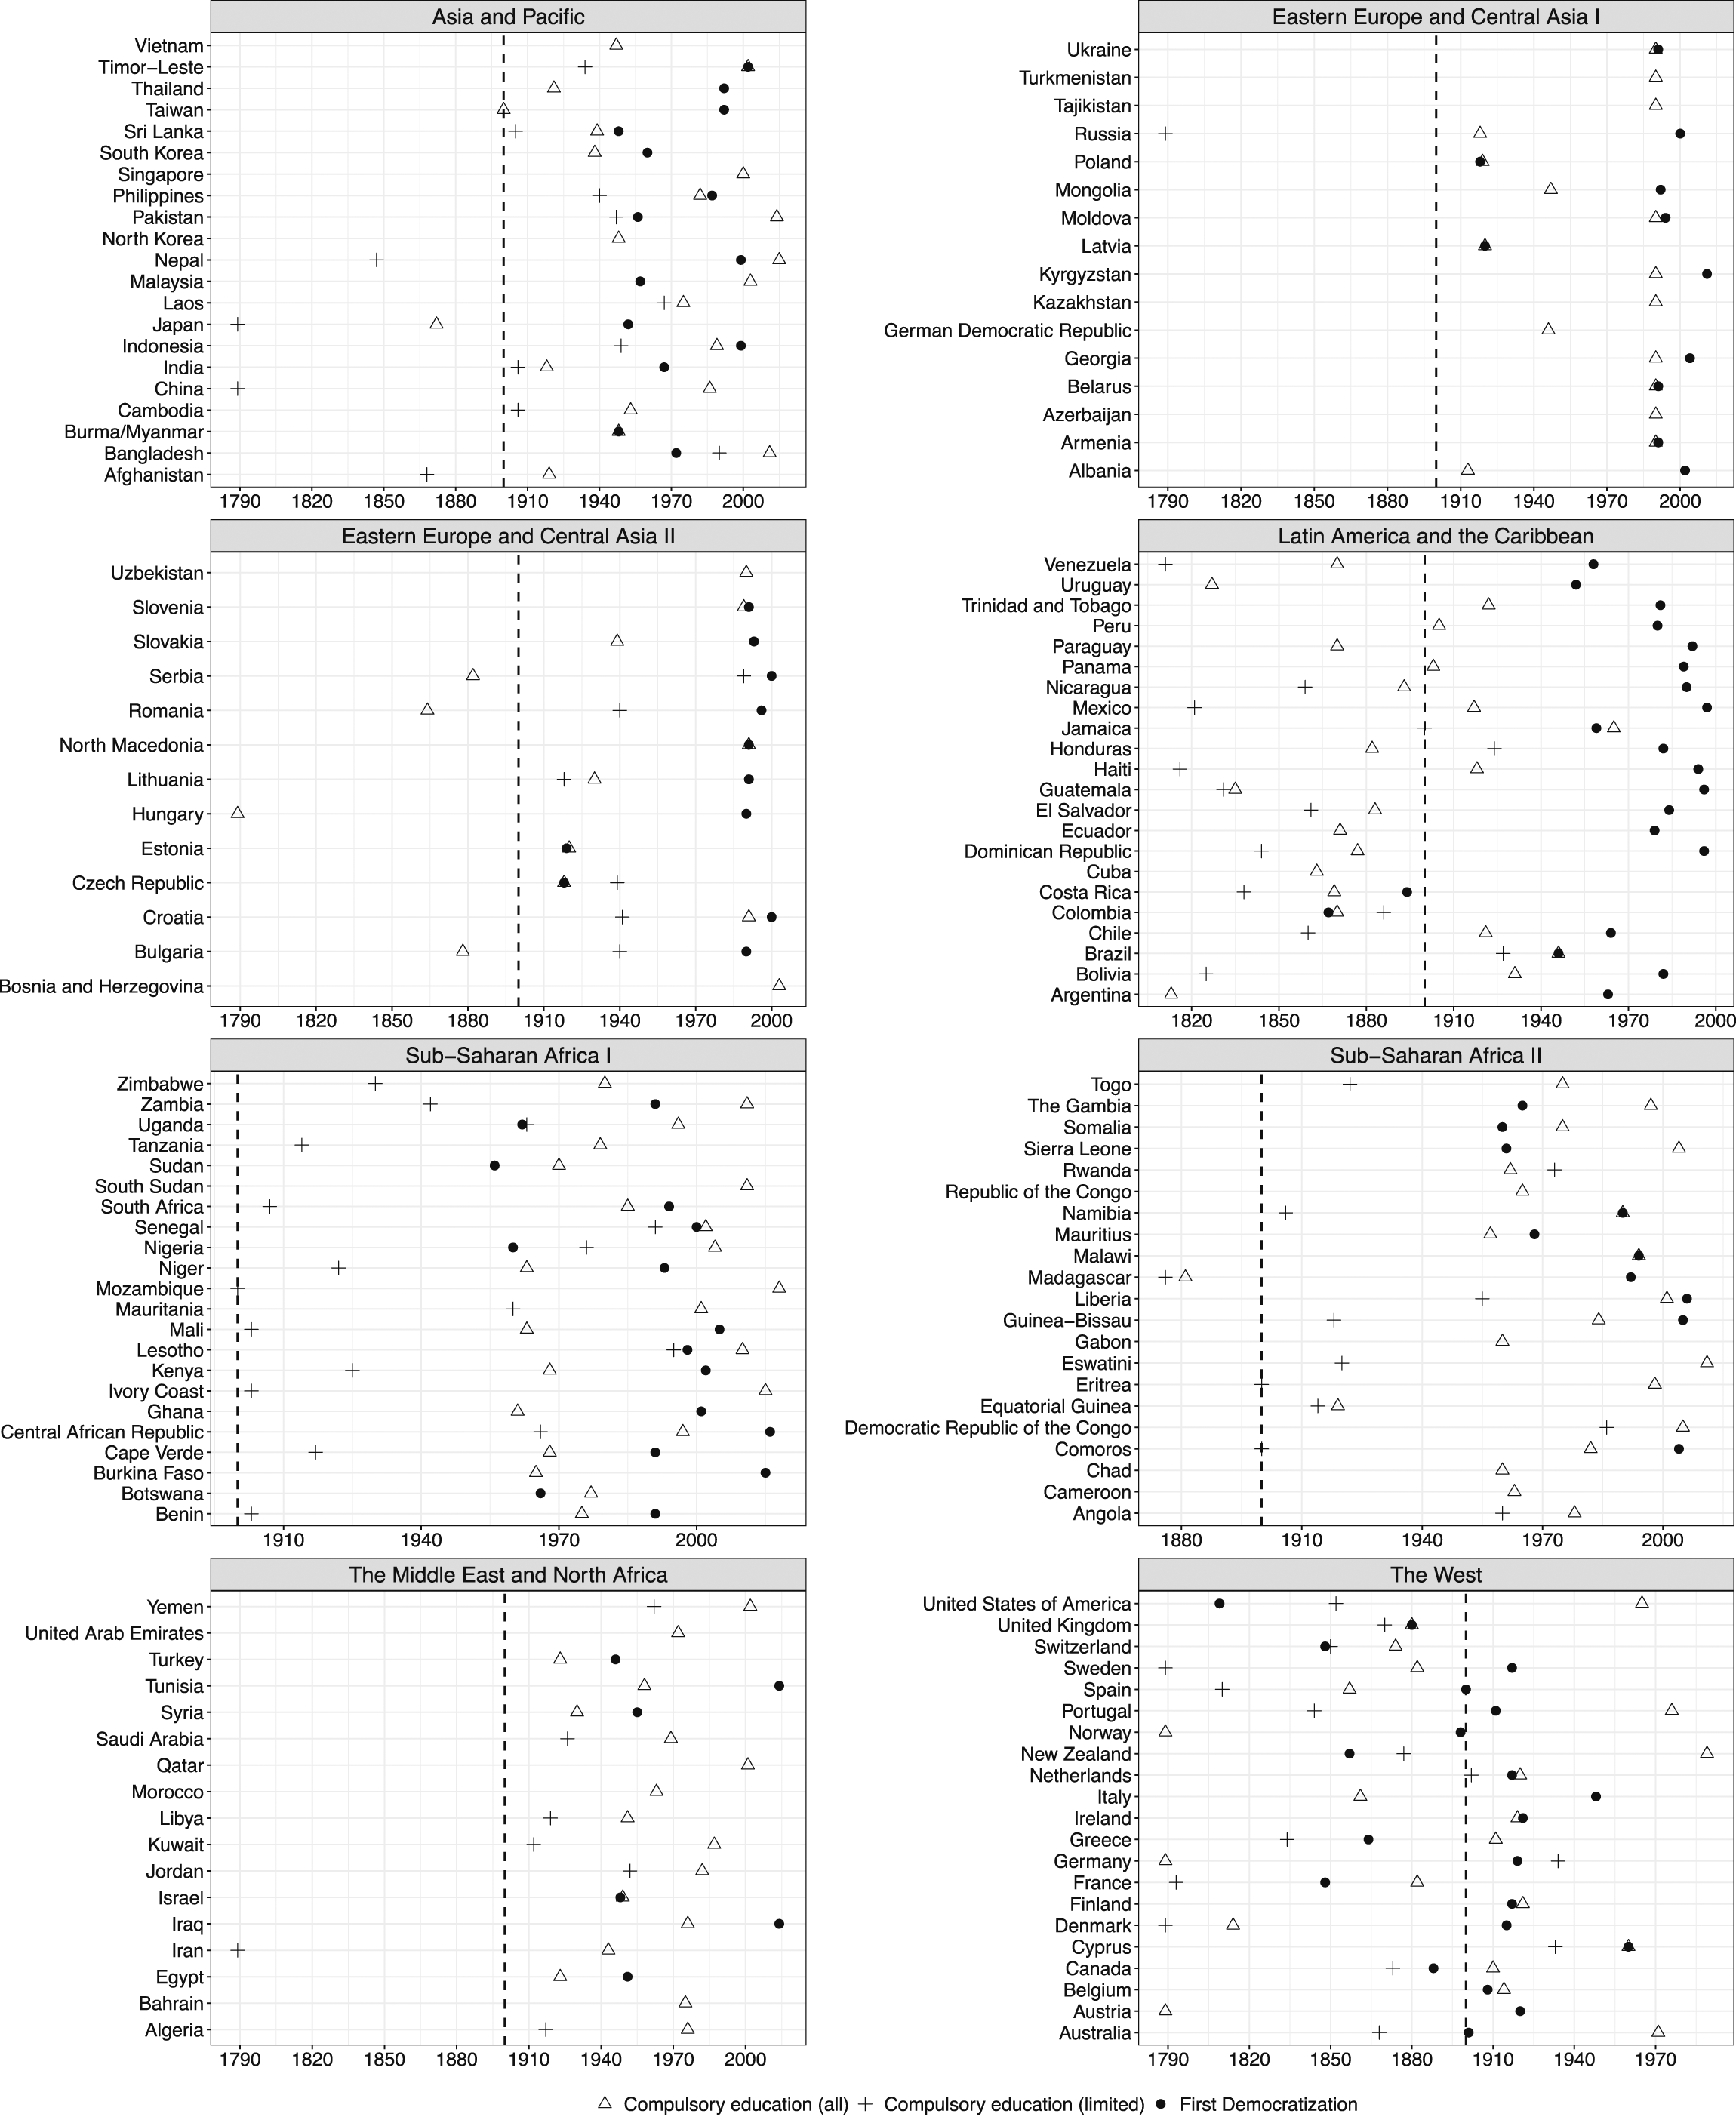
Corroborating Paglayan (2021), we find that, also globally, the modal pattern is that compulsory education preceded the first democratization episode. Following Paglayan (2021), we here use a cut-off of 6 on the Polity2 index to mark democratization. Yet, while we corroborate the main result on a larger sample, our data also show several exceptions to the general pattern. Many of the cases where democracy precedes compulsory education are located in Sub-Saharan Africa (e.g., Botswana, Gambia, Uganda) and there are several examples of the two appearing in tandem in Eastern Europe (e.g., Czechoslovakia, Estonia, Poland), pointing to potential regional heterogeneity in the relationship. As we discuss in Appendix F, Latin America stands out as being the region where the predominant pattern is that compulsory education arrived several decades before democratization (86 years for the median observation). In the median country of most regions, compulsory education arrived prior to democratization, as operationalized here, but only by a few years (e.g., 3 years in Asia-Pacific and 7 years in Sub-Saharan Africa).
However, the EPSM data also enable us to show that the absence of a (robust, global) relationship between the timing of the first democratization episode and compulsory education does not imply that democratization is irrelevant to how education systems evolve, more generally, or to what education policies are implemented. Neither do the results imply that democracies and autocracies – which are typically poorer and differ systematically from democracies in other relevant regards – are similar even regarding compulsory education. This is highlighted in Figure 10, which displays yearly mean scores surrounded by 95% confidence intervals for each regime category for four EPSM variables.
16
Education system developments by regime type. Notes. “Ideological civics courses” include all EPSM’s categories, except courses without ideological profile. “Centralized education systems” here refer to 1-score on the dichotomous composite national government control index used in Figure 4. Democracies are operationalized as Polyarchy 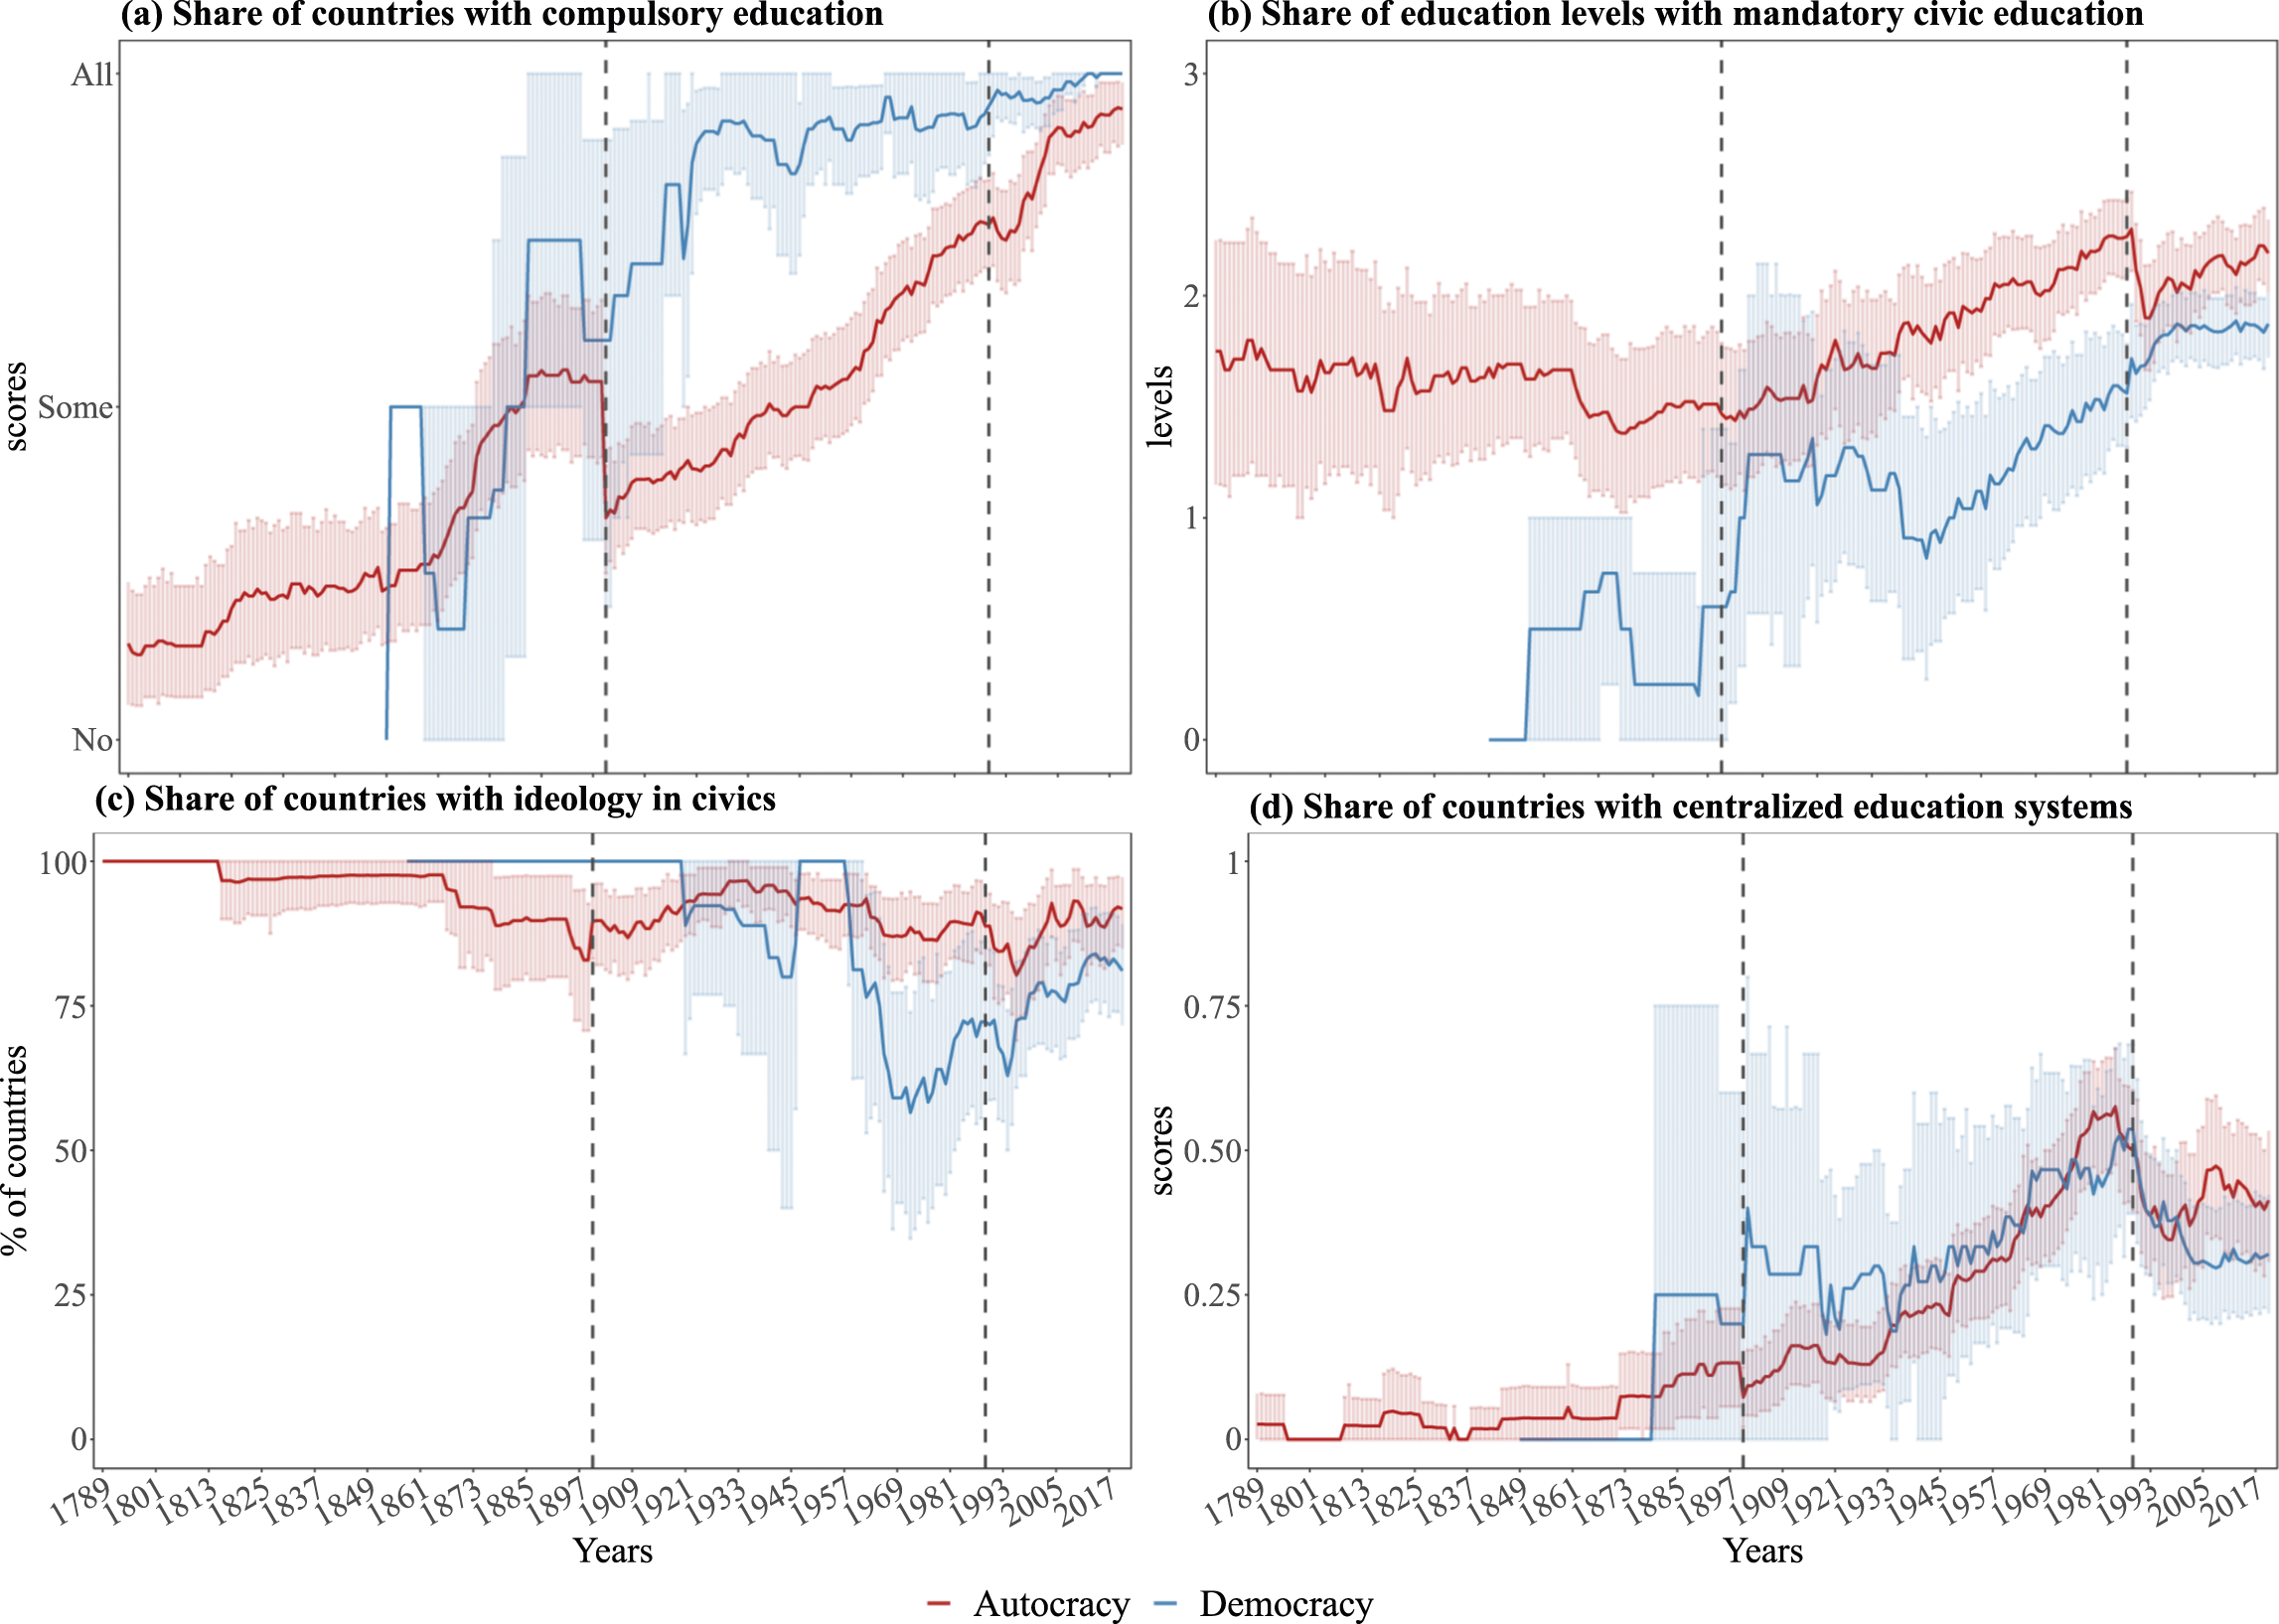
Figure 10 shows that the resemblance between the “typical” autocratic- and democratic education systems depends on what system feature we consider and the period under consideration. For the scope of civic education in panel (b), measured by the number of education levels with mandated civics courses, democracies and autocracies resemble each other from the end of the 19th century to the interwar period. Yet, autocracies clearly surpassed democracies in the scope of civics training during the Cold War. After 1990, the gap narrowed markedly. In panel (d), we also observe similarities concerning national government control over primary education. On average, democracies scored somewhat higher during 1880–1930, but the regime averages later converged.
For other EPSM measures, there are clear regime differences. Almost all democracies provide compulsory education for everyone, at least after the mid-1920s (panel (a)). In contrast, autocracies have gradually increased the scope of compulsory education throughout the century, and only after 1989 have 70% autocracies provided compulsory education for everyone. Another clear difference emerges in the ideological content of civics courses (panel (c)). Historically, almost all autocracies
Another wrinkle to the complicated relationship between education and regime type is that the former may enhance the probability of democratization (see, e.g., Lipset, 1959). Indeed, Ahmadov and Holstege (2023) find a small, yet robust, positive association between education and democratization in a meta-analysis of 27 studies. However, previous studies have mainly relied on education outcome measures pertaining to spending or years of education, and different education system features might well affect the chances of democratization differently. To assess this notion, we replicate and extend one of them, namely Alemán and Kim (2015).
Extension of Alemán and Kim (2015): The Democratizing Effect of Education.
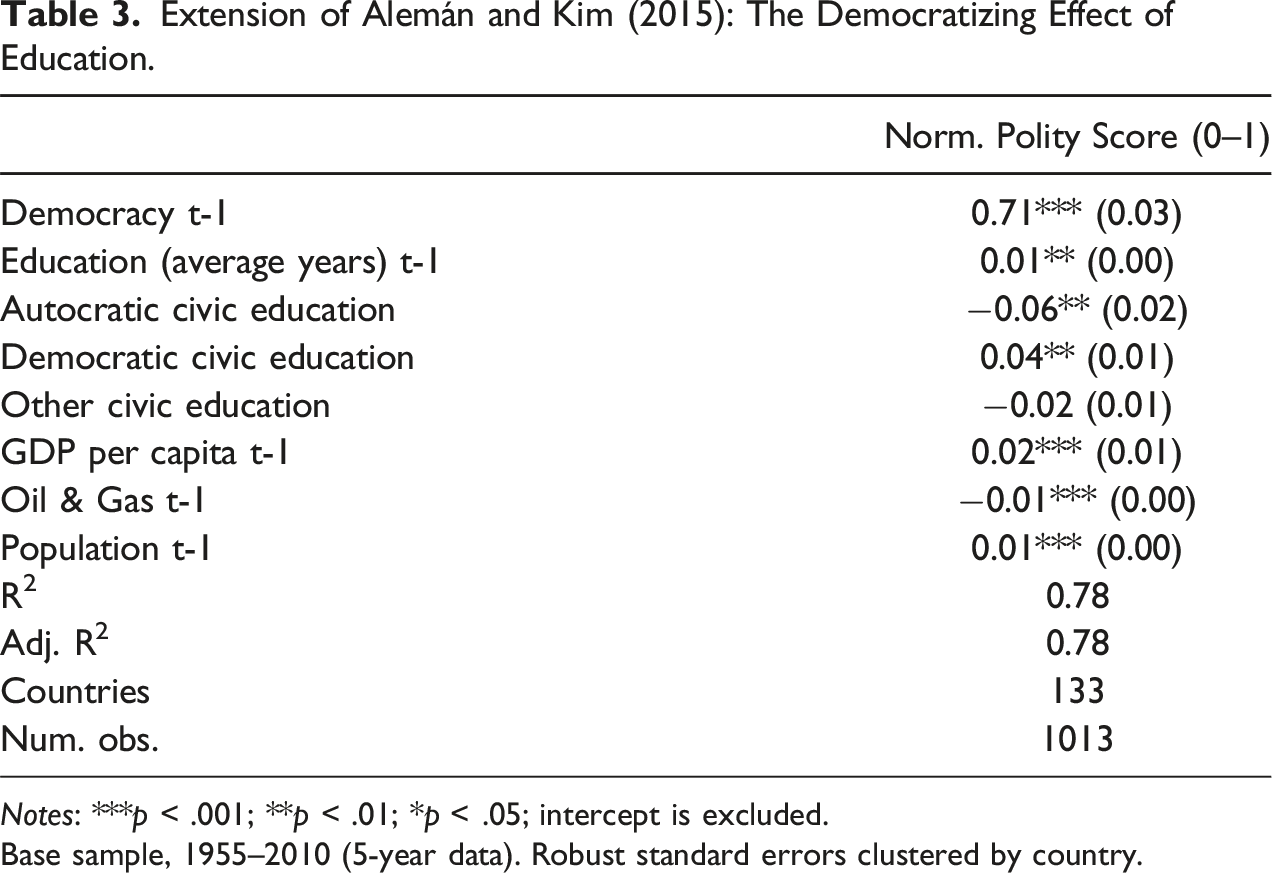
Notes: ***p < .001; **p < .01; *p < .05; intercept is excluded.
Base sample, 1955–2010 (5-year data). Robust standard errors clustered by country.
Education and Political Attitudes
Several studies find that education may influence political attitudes (e.g., Finkel, Neundorf and Rascon Ramirez, 2023; Lee, 2023; Margaryan et al., 2021). For example, using a regression discontinuity design and survey data from the European Social Survey, Cavaille and Marshall (2019) show that additional years of education decrease anti-immigration attitudes in several Western European countries that implemented reforms prolonging compulsory education in the 1960s and 70s. Despite these findings from Western European countries, education may not serve as an “antidote” to anti-immigrant attitudes in all contexts. We build on Cavaille and Marshall (2019) to assess further the conditions under which compulsory education reforms relate to reduced anti-immigrant attitudes. Since our dataset includes information on years of compulsory education for countries worldwide, we can explore such effects in a wider variety of countries. Hence, we merge World Value Survey (WVS) data (Waves 4–7) with EPSM for countries where we identified increases in years of compulsory education throughout 1950–1989. To measure anti-immigration attitudes, we use the following WVS question: “When jobs are scarce, employers should give priority to [respective nationality] people over immigrants,” with agree (1), neither agree nor disagree (2), and disagree (3) as answers.
We first use WVS respondents’ self-reported years of education to explore whether de jure reforms identified by EPSM increased the average years of education among respondents in the respective countries. Descriptive figures in Appendix G suggest an average post-reform increase of approximately 1.5 (self-reported) years across all countries and reforms. Since we expect larger (potential) effects on anti-immigration attitudes for more years of education, we focus on countries reporting post-reform increases of more than two years of education. Figure 11 displays the results. Average changes in job preference for own national citizens as a proxy for anti-immigration attitudes by country and reform. Notes. Survey data from WVS waves 4–7, restricting the sample to respondents 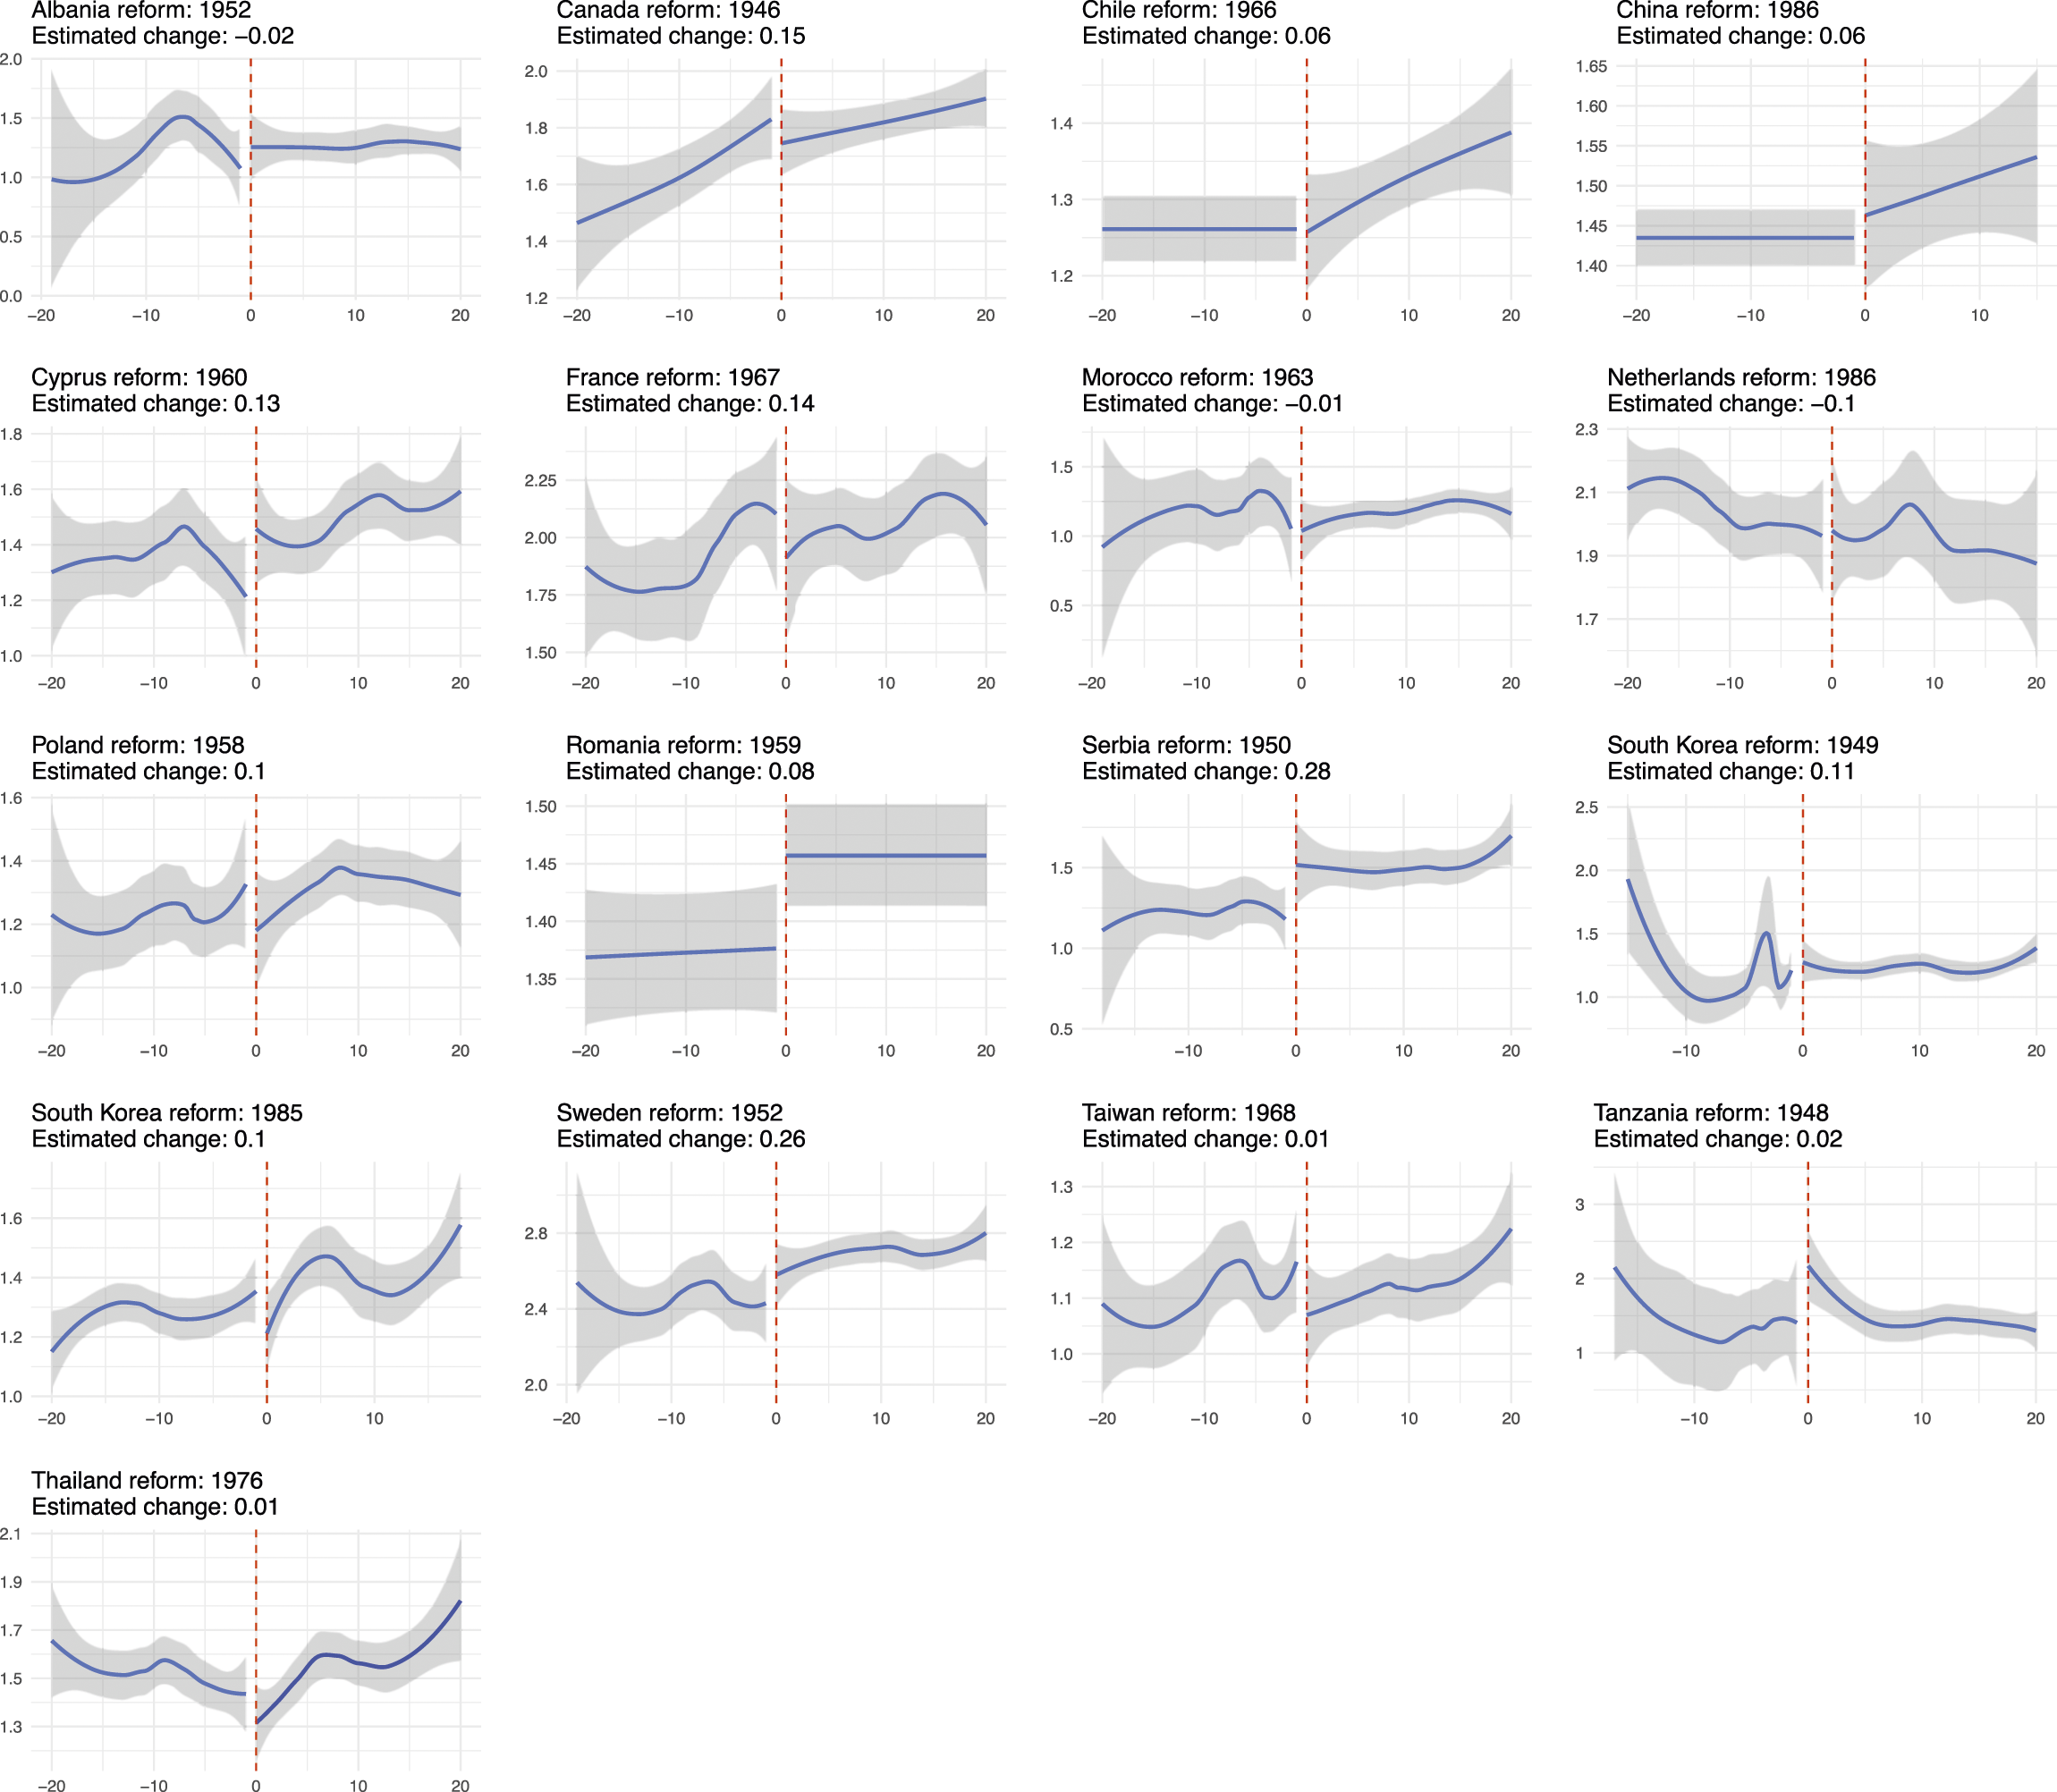
Fourteen of seventeen relevant education reforms display a post-reform decrease in anti-immigrant attitudes. Yet, changes are generally close to zero and come with high levels of uncertainty (enhanced by few respondents in relevant age groups). Stronger positive patterns (pre-/post-changes > 0.10) are detectable for some countries, mainly “Western” ones such as Canada, Cyprus, France, and Sweden, yet also in South Korea and Serbia. This suggests that the results in Cavaille and Marshall (2019) might not travel to all (especially non-Western) countries; additional years of education do not seem to automatically translate into more liberal values regardless of country context and education system. This analysis is, however, only a simple and suggestive one; future studies could use EPSM data to explore these patterns in greater detail and, for example, incorporate information on the content of civic education classes or education system centralization. Moreover, WVS surveys have relatively few relevant variables and respondents per country. Using country-specific survey data would allow for more fine-grained and high-powered tests (see, e.g., Lee, 2023; Margaryan et al., 2021).
Inequality and Education
For our final application, we build on Samuels and Vargas (2023). They highlight the role of powerful agrarian elites in mitigating education spending in democracies and show that the democracy–education spending relationship is moderated by rural inequality (high such inequality proxies for strong agrarian elites). Using EPSM data, we can explore whether similar interaction patterns exist for other education system characteristics, including centralization of education system control, 17 compulsory education years, and presence of civics classes in primary or secondary education. Insofar as more centralized education systems might mean less local control over spending, rural elites are – following Samuels and Vargas (2023) – incentivized to restrict centralization whenever they have the clout to do so. Hence, we expect a similar interaction pattern as for spending. Likewise, more years of compulsory education, ceteris paribus, means a more expensive education system, and we expect a similar interaction pattern here. For civic education, it is less clear to us that agrarian elites should have systematic incentives to promote or hinder such courses.
Extension of Samuels and Vargas (2023): Democracy, Rural Inequality, and Education Spending.
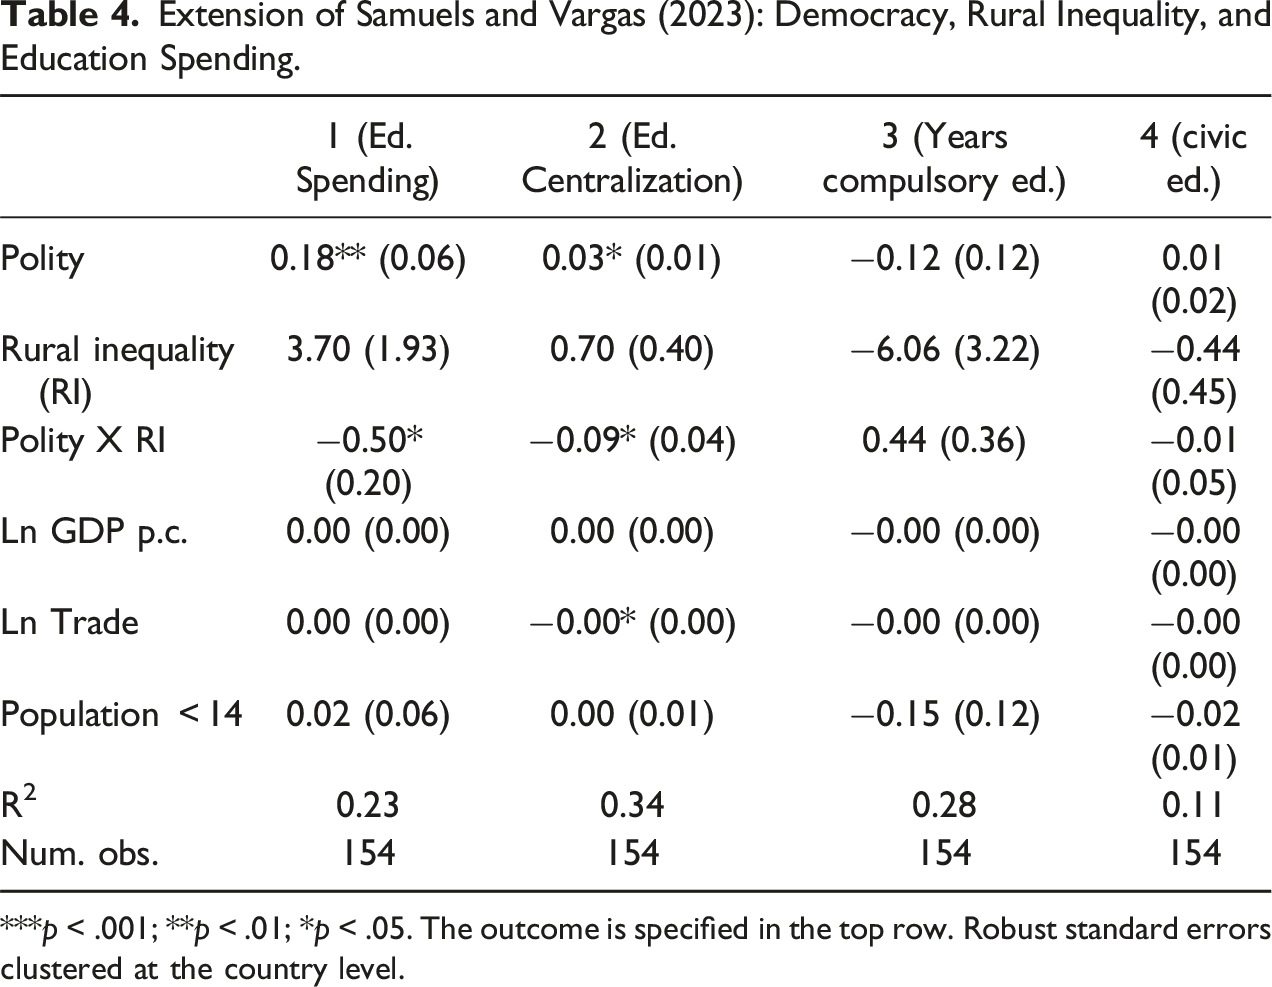
***p < .001; **p < .01; *p < .05. The outcome is specified in the top row. Robust standard errors clustered at the country level.
Conclusion
We have introduced our new dataset, Education Policies and Systems across Modern History (EPSM). EPSM incorporates 21 variables on compulsory education, the ideological content of education, governmental intervention and level of education centralization, as well as the training of teachers. EPSM covers 157 countries, and some time series extend from 1789 to the present. This unprecedented empirical coverage will hopefully enable researchers to arrive at better-founded descriptions of the historical development of education systems and policies globally. We also believe that this dataset can be used to address several important questions pertaining to education and its roles in shaping (and being shaped by) various social, economic, and political developments. In particular, the many variables concerning the ideological content and political control over education systems means the dataset is especially useful for addressing, for example, questions of indoctrination and how different regimes may use education systems to achieve political goals.
In this paper, we discussed how the EPSM data were collected, before discussing and assessing its reliability and validity characteristics. We also discussed several descriptive patterns, such as the almost two centuries-long and gradual rise to global dominance of the free, compulsory education model and the sharp post-Cold War increase in mandated civics courses espousing democratic norms. We also used the data to replicate and extend analyses on, inter alia, the (lack of any clear) relationship between countries experiencing their first democratization episodes and the introduction of compulsory education. Among other findings from these applications, we used EPSM data to nuance previously reported effects (from Western countries) of reforms expanding compulsory education reducing anti-immigrant attitudes.
Numerous other important questions can be (re-)addressed in future research by using these new data. To take one example, the exact nature and strength of the relationship between education and economic growth remain unsettled empirical questions, despite the centrality of human capital accumulation for economic growth in several theoretical growth models (see, e.g., Lucas, 1988; Mankiw et al., 1992; Romer, 1990). Previous studies have highlighted the importance of education measurement for this relationship, for instance suggesting that proxies tapping into the quality of education and what kids actually learn in school are far better predictors of growth than education quantity measures, such as average years of schooling (Hanushek & Woessmann, 2010, 2012). Using data on the ideological content of education or the system for training teachers, panel analyses using our data could help shed further light on what aspects of education policies matter for growth and what types of education are (and are not) productivity-enhancing.
Another example pertains to the historical legacies of colonialism. Several studies have proposed, and to varying extents documented empirically, how political institutions (e.g., Acemoglu et al., 2001) or even social policies (Grünewald, 2021) adopted during European colonization persisted and have had longer-term ramifications for the nature of institutions and policies in many Latin American, Asian, and African countries. Similarly, the type of education systems and policies adopted during the colonial era might have had lasting effects, and existing studies have indicated that this is certainly the case for colonial-era education of elites in Sub-Saharan African countries (Ricart-Huguet, 2021). Our data could allow researchers to assess hypotheses on historical persistence due to colonial legacies in more countries and assess the extent of persistence or change for different aspects of education systems.
More generally, EPSM’s global scope and long historical time series make it well suited for studying region-specific patterns in the historical development of education systems and for assessing hypotheses on regional differences, for example, regarding how education may differentially impact phenomena such as economic development or democratization. Moreover, given the nuanced nature of many EPSM variables and with some otherwise identical variables pertaining to different levels of education, researchers could use the data to study, for example, differences in indoctrination strategies (and their effects) across primary, secondary, and higher education.
The above-mentioned examples are still only a small subset of the topics that may be addressed by using our new data. Hence, we hope and believe that EPSM will allow scholars – with different research interests and from different disciplines – to arrive at better-founded empirical answers to old but unsettled questions pertaining to education. In addition, we hope that EPSM can contribute to spurring (and answering) new and more specific questions about the historical development, causes, and effects of education policies and systems.
Supplemental Material
Supplemental Material - Education Policies and Systems Across Modern History: A Global Dataset
Supplemental Material for Education Policies and Systems Across Modern History: A Global Dataset by Adrián del Río, Carl Henrik Knutsen, and Philipp M. Lutscher in Comparative Political Studies
Footnotes
Acknowledgements
In addition to the authors, Sirianne Dahlum, Felix Haass, and Jonas Schmid, all part of the wider ELDAR project team (PI: Carl Henrik Knutsen) at the University of Oslo, were responsible for developing the questions and codebook. We thank several members of the DEMED project team (PI: Anja Neundorf) at Glasgow University, for very valuable inputs to the codebook, and direct a special thanks to Eugenia Nazrullaeva for access to their compiled overview of existing education datasets. This overview was invaluable when writing up the literature review section. We are especially grateful to our team of excellent Research Assistants, Johanne Heitman Akerø, Hannes Bräuer, Nimo Fuad Ali Hassan, and Anna Nybu for their invaluable efforts in coding education laws and policies worldwide. We thank Ben Ansell, Patricia Bromley, Jane Gingrich, Johannes Lindvall, Agustina Paglayan, Antoni Verger, Matthias vom Hau, and reviewers and editors at CPS for feedback on earlier drafts of this paper. Finally, we thank numerous country experts for helping us to identify data sources and respond to our questions.
Declaration of Conflicting Interests
The authors declared no potential conflicts of interest with respect to the research, authorship, and/or publication of this article.
Funding
The authors disclosed receipt of the following financial support for the research, authorship, and/or publication of this article: This project has received funding from the European Research Council (ERC) under the European Union’s Horizon 2020 research and innovation program (grant agreement No 863486).
Data Availability Statement
The EPSM dataset, documentation, replication code for the analyses of this paper, as well as a dataset of all EPSM data sources is publicly available on the Dataverse page (del Río et al., 2024) related to this article. For access to files for specific data sources, please contact the corresponding author; unfortunately, we cannot share all data sources since some are proprietary. We further note that, despite our best efforts, mistakes cannot be ruled out completely. Readers are encouraged to contact the corresponding author if they find any mistakes or suspect mistakes, or if they have other suggestions for how to improve the dataset. Depending on funding, we may update and extend the dataset with new indicators and countries in the future.
Supplemental Material
Supplemental material for this article is available online
Notes
Author Biographies
References
Supplementary Material
Please find the following supplemental material available below.
For Open Access articles published under a Creative Commons License, all supplemental material carries the same license as the article it is associated with.
For non-Open Access articles published, all supplemental material carries a non-exclusive license, and permission requests for re-use of supplemental material or any part of supplemental material shall be sent directly to the copyright owner as specified in the copyright notice associated with the article.