
Abstract
Decisions about how to organize and run an election can shape political participation. Policy choices may distribute election resources unequally, skewing voting outcomes. In low- and middle-income countries where electoral capacity and resources are scarce and decision-making highly centralized, election administration has the potential to shape results on a large scale. In the context of Kenya’s August 2017 elections, I study the consequences of a legislated threshold that determines the capacity of polling centers to quickly serve voters by reducing election-day lines. Using a regression discontinuity design, I find that turnout is 2.4% lower in congested polling places just below the threshold relative to polling places above the threshold. Relative to other hypothetical thresholds, the chosen threshold benefits the incumbent president, as incumbent strongholds receive more polling resources than opposition areas. The results demonstrate how electoral resource allocation shapes political behavior and election outcomes.
Election administration shapes voters’ participation costs (De Kadt, 2017a; Harris et al., Forthcoming). If the burden of these costs falls unevenly across the population, even well-intended election administration policies can create an uneven electoral playing field. Scholars and observers of elections in low and middle income countries (LMIC) often characterize election administration problems—like long election-day lines or voter registration issues—as a minor impediment to participation or, unfortunately, as a gauge of citizens’ commitment to democracy (Frank & Martínez i Coma, 2017). 1 However, canonical voting models and a robust empirical literature show that voters may be dissuaded from voting by small costs (Highton, 2006; Pettigrew, 2017; Stein et al., 2020; Stewart, 2013). While the study of election administration has traditionally been overshadowed by a scholarly focus on electoral manipulation, this article considers how basic election administration policies can affect voter behavior and election results.
In particular, I examine how such policies shape voter turnout and differentially affect the electorate via polling station congestion. Election-day lines are but one manifestation of election administration. Election administration influences citizens’ experience at the voting booth (e.g., Claassen et al., 2013; Kerr, 2018), whether through the identity of polling officers and party representatives (e.g., Ascencio & Rueda, 2019; Neggers, 2018), finger inking on election day (e.g., Ferree et al., 2020), the number and location of polling places (e.g., Brady & McNulty, 2011; Haspel & Gibbs Knotts, 2005), or the kind of voting machine used to cast a ballot (e.g., Ansolabehere & Stewart, 2005). Here, I probe how policies that affect election-day lines can create systematic inequities for registered voters.
Since election administration can affect election outcomes, it can also be politically volatile. In December 2016, a number of contentious election law amendments generated a kerfuffle in Kenya’s National Assembly (e.g., Mutambo & Langat, 2016; Wanzala, 2016). In those and earlier debates, a mundane amendment went practically unremarked: a clause capping the number of voters per polling place at 700. This change drove the doubling of election costs between 2013 and 2017, from $240 million to over $500 million, much of which was used to staff and equip polling places (IEBC, 2018, p. 22, para. 2.12). This law had distributive consequences, determining which areas of the country received additional polling resources. The law also shaped how long individuals waited to vote. Voters at a polling place—usually a school—with 700 registered voters would queue in one line leading to one classroom where ballot boxes, finger ink, and election officials waited. Voters registered at a polling place with 701 registered voters were split across two classrooms and two lines, each with around 350 assigned voters helped by a dedicated set of election officials. 2
In a polling center with 700 registered voters and 80% turnout, polling staff would have to process a voter every 71 s on average during the course of the day to serve all voters in 11 hr. 3 In a center with 701 voters at 80% turnout, each of the two streams would would have to process a voter every 2 min and 21 s on average to serve all voters. As a result, voters at single-stream polling centers near the limit were more likely to face lines than those at centers with two streams. By comparing turnout and vote share around the 700-voter limit, I show that dual-stream polling centers have 2.4% higher turnout than single-stream polling centers.
My work makes three contributions to our understanding of the effects of election administration on voter behavior. First, I provide the first plausibly causal estimates of the effect of lines on election day outcomes, revealing how decisions affecting internal polling place organization shape voter behavior on election day. Thus, the results complement existing work using diverse data sources—surveys (King, 2019; Stewart, 2013); administrative data (Herron & Smith, 2015, 2016); or cellphone pings (Xie et al., 2019)—to explore polling place wait times and line length. The magnitude of the effect is commensurate with related observational estimates in Pettigrew (2016) (i.e., 1% decrease per hour of waiting) and Highton (2006) (i.e., a 3.5% decrease for each increase of 100 registrants per machine).
Second, I find that the voter limit chosen by the legislature created an electoral dividend for the incumbent. While I find no qualitative evidence of an attempt to manipulate the limit, the choice served incumbent areas, which have more polling centers above the threshold. As a result, incumbent areas gained from the reduced costs of voting generated by shortened lines. By examining how different potential thresholds would have influenced voting costs across Kenya’s highly partisan regions, I show that the 700-person threshold was electorally optimal for the incumbent. Importantly, this finding does not account for the turnout effects I estimate.
Third, building on research on distributive politics, this article illustrates how even transparent, legislated rules (e.g., Malik, 2019) may lead to an unequal distribution of electoral resources and have disparate impacts on voters. In doing so, it bridges two distinct theoretical literatures on election administration (e.g., Pallister, 2017) and electoral manipulation (e.g., Birch, 2011, Chapter 7).
More broadly, this study complements work on election administration and electoral integrity (Norris, 2014). Cross-national and qualitative evidence suggests that election administration is important in shaping electoral outcomes and integrity (Elklit & Reynolds, 2002; Mozaffar, 2002). However, most work on election administration in Africa focuses on citizens’ perceptions, not the effect of election administration on election outcomes (Erlich & Kerr, 2016; Kerr, 2013). I show that election administration affects actual voting behavior, and that election resource allocation in LMICs can influence both turnout and election outcomes.
Lines and Election Administration
Traditionally, research on elections in African contexts takes a behavioral focus—how ethnicity conditions voter behavior (e.g., Carlson, 2017; Conroy-Krutz, 2012)—or an elite mobilization focus—how elites use strategies like vote buying and political violence to influence voters (e.g., Bratton, 2008; Kramon, 2016). Recently, scholars have begun dissecting how the policies and procedures of election commissions shape election outcomes in non-Western contexts. For instance, De Kadt (2017a) and Harris et al., (Forthcoming) examine electoral administration in South Africa and Kenya, building on work in American and European politics on how participation costs condition voter participation (Bhatti, 2012; Brady & McNulty, 2011; Dyck & Gimpel, 2005; Fauvelle-Aymar & François, 2018; Stein & Vonnahme, 2008).
While photographs of voters waiting in line remain a journalistic staple in many non-Western contexts, research on lines and waiting focuses on the United States. There, waiting to vote is described as a differential time tax, where “a government policy or practice [. . .] forces one citizen to pay more in time to vote compared to her fellow citizens” (Mukherjee, 2009, p. 177). Inequality of access arises when this time tax affects some types of voters more than others (Tokaji, 2006). The U.S. literature on election administration provides ample evidence that seemingly innocuous policies and choices may make it more difficult for some—usually minority—citizens to vote. For instance, the type of voting machines employed in precincts with a high percentage of African-American voters explains higher rates of voided ballots in those areas, and racial differences in requests for identification on election day may discourage participation (Cobb et al., 2012; Tomz & Van Houweling, 2003).
Lines on election day exhibit differential impacts similar to voting machines and voter identification, with racial minorities disproportionately affected by the time tax. Pettigrew (2017) uses survey data to demonstrate that predominantly-minority precincts have lines that are twice as long as white precincts; Stewart (2013) finds similar disparities. Using administrative data like voter check-in times to measure precinct congestion in Florida, Cottrell et al. (2020) shows that minority voters experienced longer waits than white voters. Late-closing precincts—another measure of long lines—were significantly more common in Hispanic precincts in Florida’s 2012 elections (Herron & Smith, 2015).
Such patterns may have long-lasting effects on voter behavior. Poor voting experiences on election day may depress future participation and reduce citizen confidence in the electoral process (Alvarez et al., 2008; Pettigrew, 2016). Positive experiences on election day, on the other hand, may increase future political participation, an effect explored in De Kadt (2017b).
The disparate impact of election administration policies remains relatively unexplored outside of the United States. In African contexts, anecdotal evidence suggests that electoral resource allocation is commonplace and consequential (Bratton, 1999; Elklit & Reynolds, 2002; Jinadu, 1997). Elections are commonly organized by a national (rather than state or county-specific) organization, making the potential impact of policy-making and implementation far-reaching. Despite nationwide consequences, administrative issues like lines are often seen as relatively minor infractions of electoral integrity (Frank & Martínez i Coma, 2017).
There is room for skepticism regarding the suppressive effects of lines in Kenya. Elections are highly partisan and turnout is high. Anecdotes suggest that strong social pressures exist to encourage voting: transport providers or bars refuse to serve citizens without inked fingers. 4 In the face of such pressure, a marginal voter might choose to bear the cost of election-day lines. On the other hand, the mere presence of legal interventions—like capping the number of voters at a stream or ensuring that queued voters can vote even after the 5 p.m. close-of-station—indicates a broader problem with polling center inefficiency, requiring legal remedy to prevent functional disenfranchisement. As this article shows, these solutions come with their own problems.
Recent work from Latin America suggests an alternative mechanism: clientelist networks may use brokers to mobilize voters, a strategy that may be particularly effective at smaller polling centers or levels of reporting. 5 Clientelist relationships represent a political quid pro quo: voters supply support, which politicians reward with resources. Disaggregated election results may support the enforcement of conditional clientelist bargains in the absence of the ability to monitor voters directly, as described by Rueda (2017) in Colombia. The effectiveness of such clientelist bargains may be conditioned by whether parties can monitor hired brokers to ensure supporters turn out on election day (Larreguy et al., 2016).
Clientelist “machine politics” is not the status quo in Kenya: politicians rarely monitor voters or communities, voters do not believe they are monitored, nor do they feel a responsibility to vote for politicians providing handouts (Kramon, 2017, Chapter 4). 6 Rather, handouts to voters serve an informational role. Recent evidence suggests that, on a local level, incumbent Kenyan MPs do not consistently reward communities based on past electoral support (Harris & Posner, 2019). Resnick (2012) and Young (2009) also note the absence of clientelist elements like organized monitoring in Kenyan and other African cases. 7
The lack of strong clientelist exchange structures and monitoring in Kenya may be seen as part of an historical erosion of early clientelist structures that began with the transition from Kenyatta to Moi (Barkan & Chege, 1989). Van de Walle (2009) provides an expansive historical discussion of why parties are poorly institutionalized across much of the continent, part of a larger argument raising doubt about the applicability of common clientelist theories in Africa. Hicken and Nathan (2020) provides an able summary of broker-based individual or collective monitoring explanations, finding them logically and empirically wanting. Simply put, existing work on Kenya and related areas suggests that clientelism is both rarer and less effective than implied by the literature. 8
Practically, monitoring voter attendance on election day would be a daunting task in Kenya. First, Kenyan polling centers have no formal precinct boundaries or residency requirements. 9 Kenyan citizens choose where they prefer to register, rather than being assigned to a polling center within a geographic area. While a hypothetical broker might have access to a copy of the voter register, that document carries no information about where registered individuals live, making systematic mobilization difficult. In the absence of a residential address system, the informational demands on a broker to locate or monitor voters are high. Given low levels of civil registration, many remain unregistered to vote, creating another informational hurdle for hypothetical brokers to overcome (Piccolino, 2016). This creates significant ambiguity about where to allocate election-day mobilization efforts. While clientelist explanations of voter mobilization using similar research designs (e.g., Larreguy et al., 2016; Rueda, 2017) may hold in other contexts, in Kenya—and likely many other African electoral environments—a much simpler and more pervasive explanation may explain these effects: lines resulting from election administration policies.
Kenyan parliamentary debates show that politicians have long been aware of the problems lines create for electoral participation. In 1983, future President Mwai Kibaki explained: “If you are forming only one queue and, above all, if there is only one place to go to in order to mark your symbol, and then go to only one ballot box to cast your vote, this will lead to a slowing down of the whole system.” 10 Kibaki’s description echoes the line-generating bottleneck in Spencer and Markovits (2010) where voting moves more slowly than identification processes.
Prior to the August 2017 General Elections, Members of the National Assembly advocated for reform of electoral laws to address, among other things, lines. Hon. Samuel Chepkonga (Ainabkoi), chair of the committee on justice and legal affairs in charge of drafting election amendments, advocated for a cap on the number of registered voters per stream, saying “We know many people who have refused to cast their votes [. . .] because they waste about an hour queuing on the line.”
11
Hon. Samuel Gichigi (Kipipiri) echoed the idea of a time tax: “I support the issue of limiting the number of voters in a polling station. A total of 700 voters is okay rather than have long queues that can easily bring chaos or lead to people being barred from voting because of time lapse.”
12
Opposition MPs similarly supported the change. Hon. G. P. O. Kaluma (Homa Bay) took a stronger position, advocating that the IEBC should have no discretion with respect to the voter limit: I support the idea to reduce the number of registered voters at a polling station to 700 and below. If Members look at that provision, there is a proviso at the end which we will need to delete [emphasis added]. The proviso says that a polling station shall not have more than 700 registered voters, unless the Commission determines otherwise. It is not a matter over which we need discretion. We want a process where if you contest for the presidency, it should not take you more than three hours to know the president of this country.
13
Hon. T. J. Kajwang’ (Ruaraka), a close ally of opposition leader Raila Odinga, and Hon. Chepkonga, the committee chair, had a brief exchange regarding whether the cutoff would be 500 or 700. Chepkonga explained that a cutoff of 500 would make it impossible to find adequate public facilities for polling places, as larger polling centers might require as many as 40 rooms to accommodate voters. 14 Hon. Kajwang’ signaled his satisfaction at this explanation. This public exchange accords with interview evidence with election commission officials, who also emphasized the choice of 700 over 500 in budgetary terms. 15 Civil society actors also supported the voter limit. The Kenya National Commission on Human Rights, a government watchdog group, explicitly advocated for the 700-voter limit in the 2017 elections (KNCHR, 2018). The Elections Observation Group (ELOG, 2017b) described the voter limit as one of several “positive changes” that would “affect the election landscape.” In summary, the adoption of the limit appeared to be supported by a cross-section of government, opposition, and civil society actors.
Importantly, the election law amendments debated in parliament were a departure from the existing balance of powers between Kenya’s electoral commission and the legislature. Prior to the amendment, passed in December 2016, “nuts-and-bolts” policy decisions like the maximum number of voters per stream were left to the discretion of the Independent Electoral and Boundaries Commission (IEBC). This reduction of discretionary powers worried bureaucrats at the commission, who wrote in a management briefing: “There is no doubt that having fewer voters in a polling station enhances efficiency. But capping such a number without providing flexibility to the Commission in certain circumstances assumes a higher risk with potential to disenfranchise voters” since it would force the commission to open new, potentially poorly subscribed, polling centers and risk overcrowding existing election infrastructure (IEBC, 2017a, 2017b). Why would an independent bureaucracy accept such a loss of discretion? Legislating a specific cutoff created a legal budgetary obligation to ensure that the IEBC would have sufficient resources to hold an election. As one election administrator put it: “The commission wanted to make sure that the maximum number of polling stations [i.e., determined by the voter limit] was mandated by law. The reason for this is that, then parliament would have a clear reason to give us a specific amount of money for the streams. If we had it in law, then we would have to get the money from parliament. Having a 500 [voter limit] would have been ideal, but then the budget would have been too high.” 16 While I cannot conclusively demonstrate the intentions of political actors, the administrative and budgetary arguments regarding the choice of the 700-voter limit are consistent across multiple independent public and private sources. These sources suggest that the limit was set according to practical administrative requirements, not to benefit a given set of voters.
Data and Research Design
The legal mandate of capping registrants at 700 per stream creates a discontinuity, and an opportunity to the study the effect of election day congestion on election outcomes. 17 The August 2017 presidential contest featured incumbent president Uhuru Kenyatta against opposition leader Raila Odinga. As a result of procedural irregularities in the transmission of results, Kenya’s Supreme Court invalidated the August 2017 presidential elections on constitutional grounds. Despite this legal finding, and mistrust among political parties, the elections were widely held by monitors to be of high quality (EUM, 2018). An independent parallel vote tabulation by Kenyan civil society organizations corroborated the IEBC’s August presidential election results (ELOG, 2017a). Below and throughout, I use polling-center-level results from the August elections as outcomes.
Regression discontinuity (RD) designs allocate units to treatment or control groups via the running variable: in this case, the number of voters registered at a polling center. This assignment should be as-if random around the cutoff of 700 registered voters, implying that units above and below the cutoff have similar characteristics. I follow Cattaneo et al. (2020a) to check for any discontinuity in predetermined characteristics near the cutoff. 18 For instance, turnout may vary by gender composition, median age, or ethnic composition at the polling center. Social characteristics of the neighborhood around a polling center like poverty (measured using nighttime lights and percentage of the population below the poverty line), the dependency ratio, literacy, or population density may affect political mobilization and turnout. Natural characteristics like terrain or slope may affect accessibility of a polling center. If the design is valid, such tests should find no discontinuity in the independent variables at the cutoff. Figure 1 shows no significant differences between polling centers just above and just below the cutoff on these predetermined characteristics. Supplemental Appendix A provides more details on the data used in these balance checks. 19
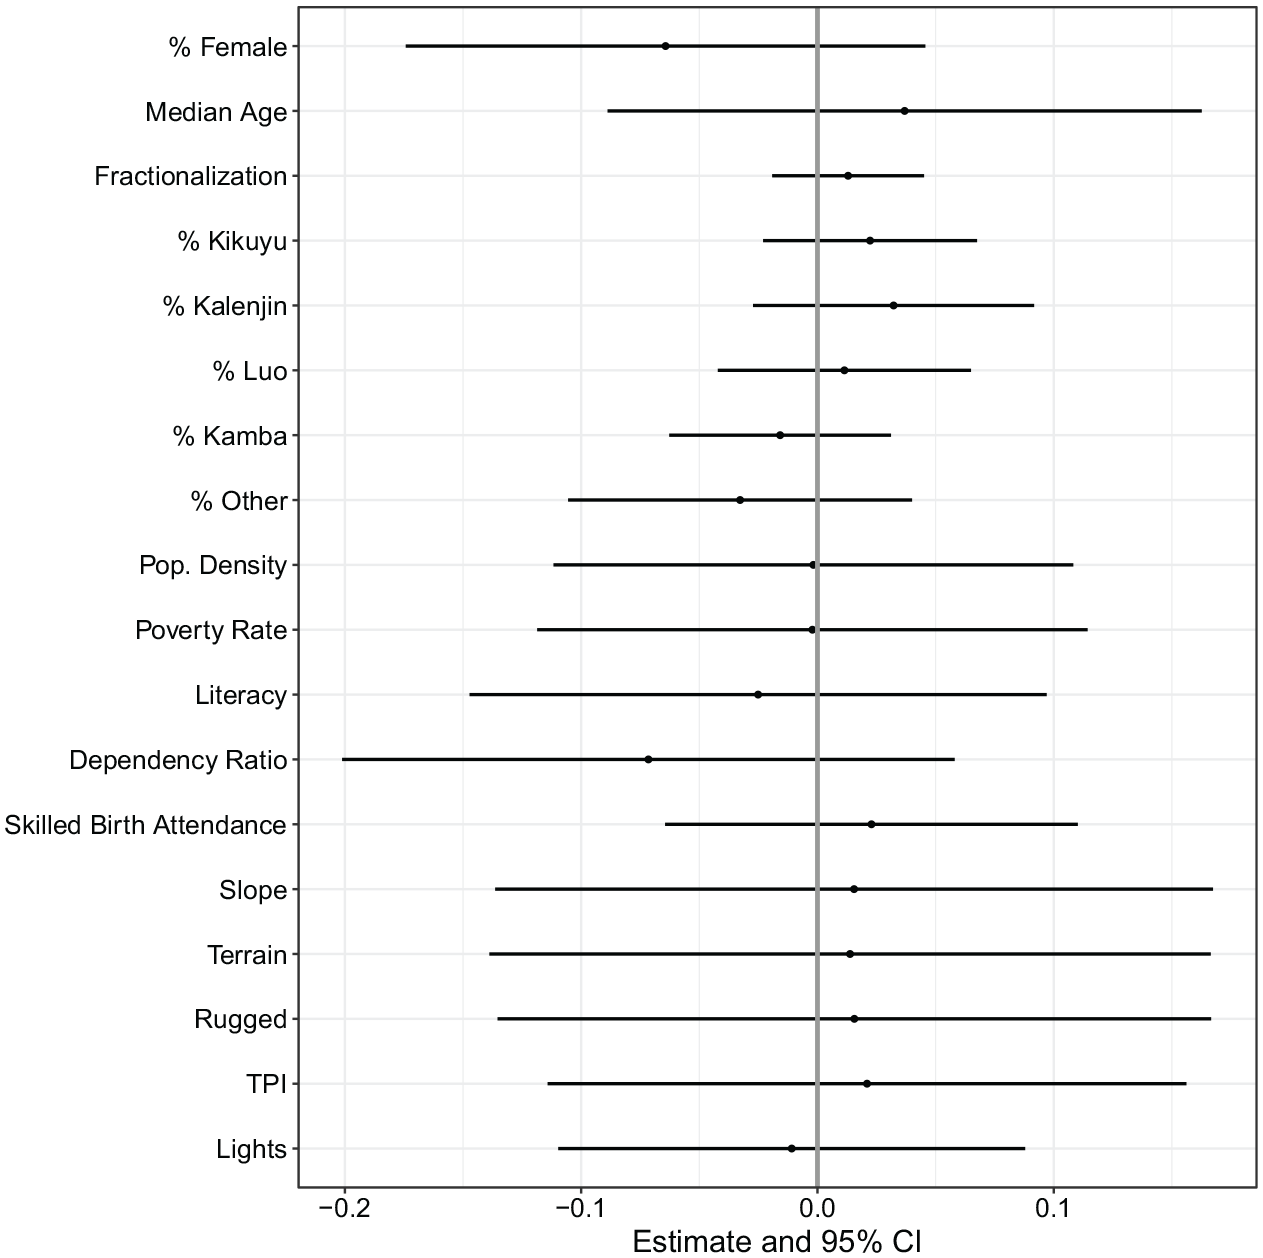
Balance tests: polling centers just above the 700-registered voter cutoff, at which an additional stream is added to a polling center, are similar to those just below the cutoff. Balance tests follow Cattaneo et al. (2020a) and estimate the effect at the discontinuity on predetermined characteristics. Line plots display the 95% confidence interval of the estimated difference at the cutoff.
Second, units must not be able to strategically sort around the cutoff. This could occur if voters could select the polling center at which they register to vote based on knowledge of the number of streams to be assigned in the future. If particularly savvy voters chose to avoid centers just below the cutoff and vote at those above the cutoff, the effect at the discontinuity might be due to strategic sorting, rather than a line-length effect. The strategic sorting problem is unlikely in Kenya. The registration agent does not routinely have access to information about the number of voters already registered at a polling center when registering new voters. Thus, faced with the choice of whether to register at two different polling centers, a citizen registering to vote is unlikely to know which polling center may be congested on election day.
Interviews with election administrators confirm this logic. When asked whether registrants ever sought out information on the number of registered voters at a given center, one veteran constituency elections coordinator responded, “I would not say it is impossible; [a well-informed person] may look for a non-congested station when registering [. . .] Out of the thirty thousand [people I have registered], maybe 100 maximum asked about polling station congestion.” 20 This suggests that voter-level sorting is rare.
Empirically, such sorting would generate a discontinuity in the density of voter registration at polling centers around the cutoff, as significant numbers of voters sought to register at a center just above the cutoff. A McCrary test (t = 0.64; p = .52) finds no evidence of sorting (McCrary, 2008). 21 In the 2017 elections, there were 16,104 single stream and 6,033 double stream polling centers, representing 90% of all polling centers nationwide. 22
Relative to commonly studied contexts like the United States, the equipment and procedures used in Kenya’s national election body are uniform nationwide. Kenya holds no early or absentee voting or election day registration, so voting occurs on the same day for all registered voters nationwide. Every polling center uses the same equipment for voter identification and identical ballots in the presidential contest. This contrasts with election administration in the United States, where precincts, counties, and states exhibit wide variation in policies, procedures, and ballot design, creating significant administrative heterogeneity (Ansolabehere, 2002; Citrin et al., 2014).
Results
Lines make voting costlier for voters, and thus decrease turnout. Since election administrators must finish serving queued voters prior to the start of counting, election-day lines can delay ballot counting and the reporting of results. I find evidence for both of these observable implications.
Figure 2 presents regression discontinuity results for turnout. Polling centers just above the cutoff have 2.4 percentage points greater turnout than those just below the cutoff (95% CI: 1.1%, 3.6%). 23 Just below the cutoff, average turnout is 77.9%, while just above, it is 80.3%. At the cutoff, long lines prevent 18 votes on average (95% CI: 9.6, 25.7).
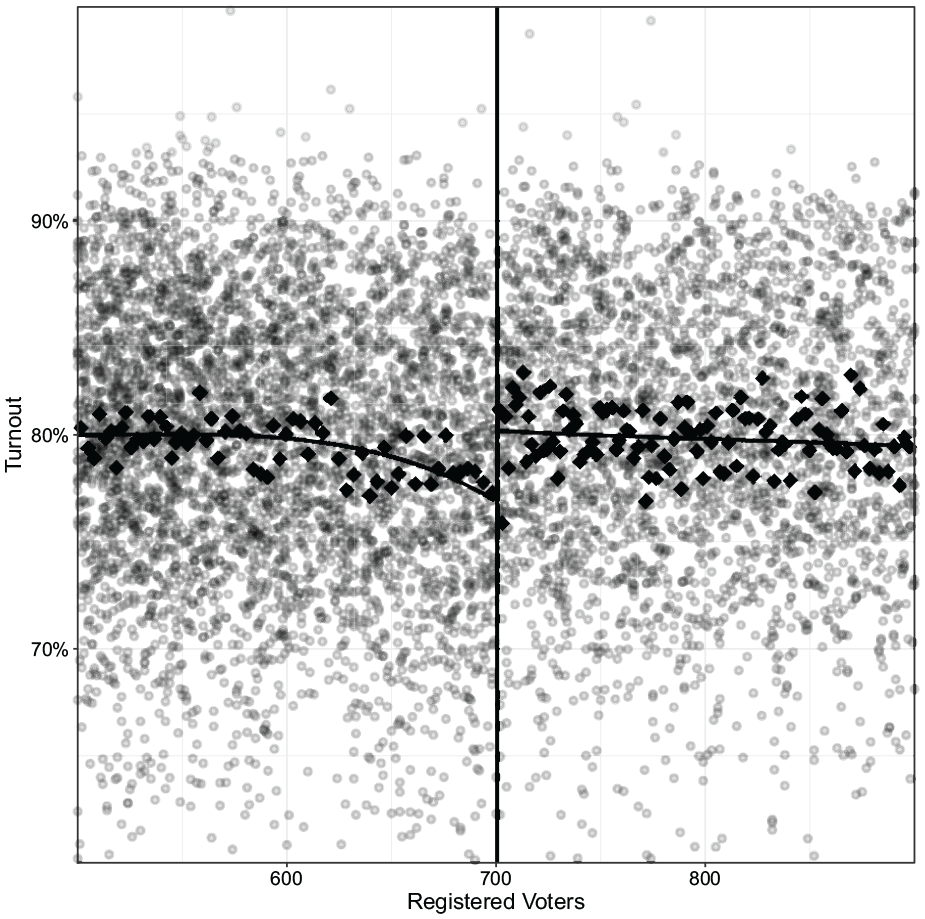
Discontinuity plot—turnout: polling centers above the 700-registered voter cutoff have an additional stream, leading to 2.4% higher voter turnout than polling centers below the cutoff. Dots represent individual polling centers. Squares show bin-specific turnout summaries.
While this turnout effect is consistent with a line-based mechanism, waiting- or time-related measures would provide more direct evidence (e.g., time to check-in, line length, etc.). Collecting such evidence would require an intensive data collection campaign. For instance, Stein et al. (2020)—a 42-author study—reports detailed line-related data collected at a convenience sample of 528 polling places in 25 jurisdictions. Herron and Smith (2016) carries out similarly-detailed data collection at one polling place in New Hampshire. Collecting such data in a prospective regression discontinuity design would require a small army; for comparison, the effective sample size for the time-based estimates presented below encompasses 4,243 polling centers. Direct measures of line length and waiting time would require an impractical prospective design. Thus, this retrospective study relies on another time-based measure related to line-presence.
I use a measurement strategy akin to Herron & Smith (2015), in which precinct closing times proxy for polling place congestion: “a closing time measures when on Election Day a precinct finished processing voters or tabulating votes” (p. 222). Like Herron & Smith (2015), I use the server timestamp reporting the receipt of a set of election results. While I attempted to access the log data in the IEBC’s electronic voting kits, I learned that this data had not been centrally downloaded. Regardless, such data would only provide voter check-in times à la Cottrell et al. (2020), with no information on when voters joined a queue or how long they waited.
Later time stamps imply longer end-of-day lines, which were sufficiently pervasive to require dedicated legislation. Election Law No. 24 of 2011 (rev. 2017) part 66.1 ensures that voters in line at 5 p.m. close-of-station can vote. Ballots cannot be counted until voters finish voting. Polling stations with end-of-day lines should report results later than those without lines, since counting is delayed until the line clears. With counting complete, the station’s presiding officer enters vote tabulations on both a statutory form 34A and a digital form, takes a photograph of the physical form 34A, and transmits both to a central server, which records a timestamp upon receipt. I use this timestamp data to construct two additional outcomes for each polling center: the average time between 5 p.m. close-of-station and the first timestamp received by the central server, and a robust regression-adjusted “delay time” that measures the delay between close-of-station and start-of-counting Cook (1977) and Koller & Stahel (2011).
Total time from 5 p.m. close-of-station to time of first report can be decomposed into two parts. The first part is the “delay time” between close-of-station and start-of-counting; the second is the “counting time” between start-of-counting and receipt-of-results. While we only have information on the time of receipt, a simple model allows us to use existing data to separate the delay time from the counting time:
Equation 1 represents the observed total time between close-of-station and receipt-of-results as the sum of the delay time and the counting time. I approximate counting time at each polling station as the number of ballots counted (e.g., turnout) times the estimated time it takes to count a single ballot. This equation mirrors bivariate linear regression, with the (unknown) delay time as the intercept and the (unknown) time to count a ballot as the coefficient. We can use this relationship to estimate the time to count a single ballot (
Figure 3 (left panel) examines total time to first report at the discontinuity, finding that double-stream centers report results 187 min earlier (95% CI: −248.6, −125.7) than single-stream centers. This is consistent with a delay in the start of counting due to congestion. Figure 3 (right panel) shows the estimated difference at the discontinuity in delay time. Average delay time is 97 min shorter at dual-stream polling centers compared to single-stream centers (95% CI: −160.0, −35.4). 24 This finding is consistent with the proposed line-based mechanism. 25
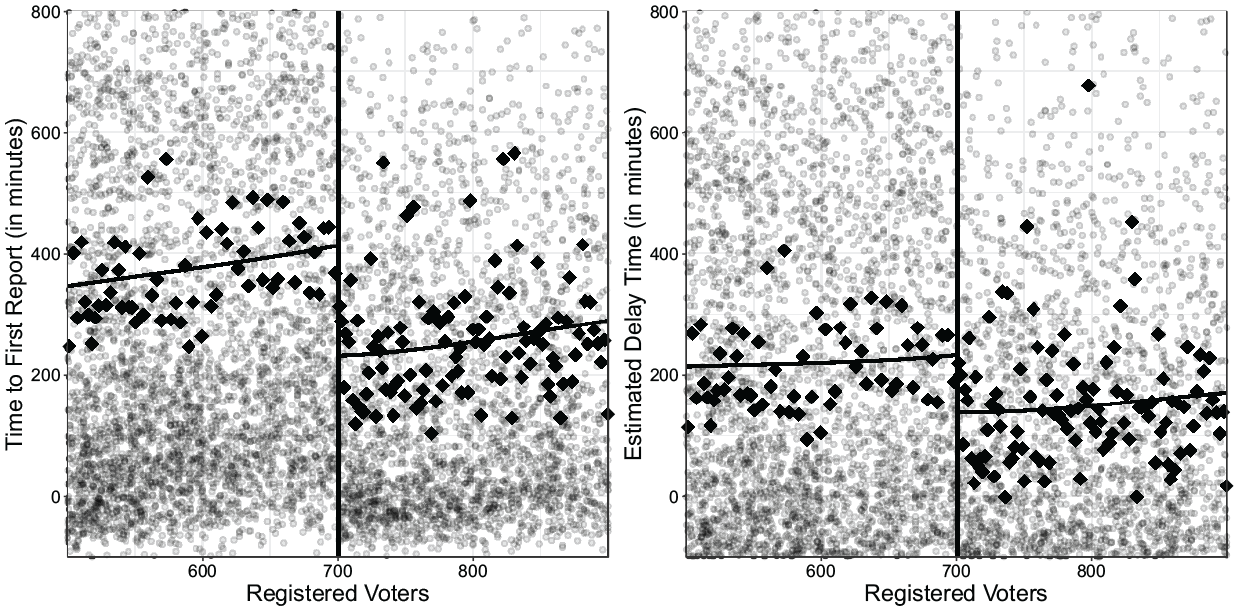
Total time to first report (left panel) and delay time between close-of-station and start of counting (right panel): dual-stream centers (to the right of the discontinuity) report results 187 min faster on average than single-stream centers. Similarly, in dual-stream centers, the delay time between close-of-station and start-of-counting is 97 min shorter on average than in single-stream centers. These differences are consistent with the presence of end-of-day lines leading to a delay in counting and reporting.
In Supplemental Appendix H, I present three analyses that support the interpretation that lines impede turnout. First, I provide observational evidence that suggests that lower turnout is related to longer lines. Second, I show that turnout just above the discontinuity is almost identical to turnout at similarly-sized centers well below the discontinuity that are likely to have similar lines. If line length is the culprit, then turnout just above the cutoff (where individual line length is approximately 350 votes maximum) should be similar to single-stream polling stations with around 350 registered voters. Third, I examine how voters facing shorter lines respond in especially difficult voting environments, namely rain on election day. These observational analyses provide additional indirect evidence supporting a line-based mechanism.
Figure 4 presents the incumbent presidential vote share at the discontinuity. I find centers with an additional stream have 6.7% percentage point higher vote share for Kenyatta, the incumbent president (95% CI: 0.6%, 12.7%). 26 Below, I discuss how regional disparities in the allocation of election administration resources leads to this finding.
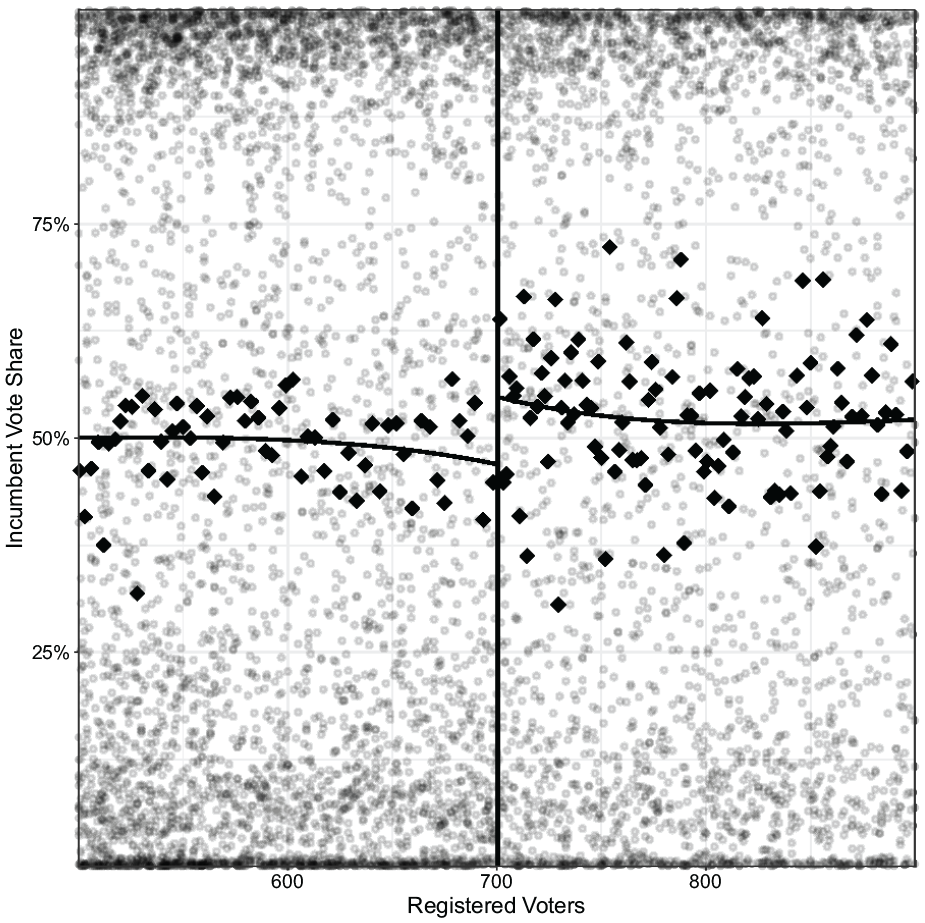
Discontinuity plot—Kenyatta vote share: polling centers just above the 700-registered voter cutoff have an additional stream, corresponding to 6.7% higher Kenyatta vote share than polling centers just below the cutoff. As discussed, this should not be regarded as a causal effect. Dots represent individual polling centers. Squares show bin-specific vote share summaries.
Vote Share and the Distribution of Election Administration Resources
Of course, the presence or length of lines did not cause individuals en masse to change their vote choice. Rather, the vote share discontinuity favoring the incumbent reflects how registered voters are distributed across the country. Incumbent strongholds tended to have larger numbers of registrants, leading to more dual-stream polling centers in those areas. As a result, marginal voters in opposition strongholds tended to face higher costs in terms of waiting than did voters in incumbent strongholds. Figure 5 (top panel) explores this idea by overlaying the density of polling center size—the running variable—by opposition and incumbent strongholds. Constituencies with 90% or more vote share in support of the opposition or incumbent candidate in the 2013 elections are strongholds. By using 2013 constituency-level returns, I mirror the clear information on electoral support available by 2017; this avoids splitting the data into subgroups based on 2017 electoral support, which might introduce post-treatment bias. This figure reveals the source of the vote share effect: polling centers just over the cutoff tend to lie in incumbent areas, whereas those just under the cutoff more frequently lie in opposition areas.
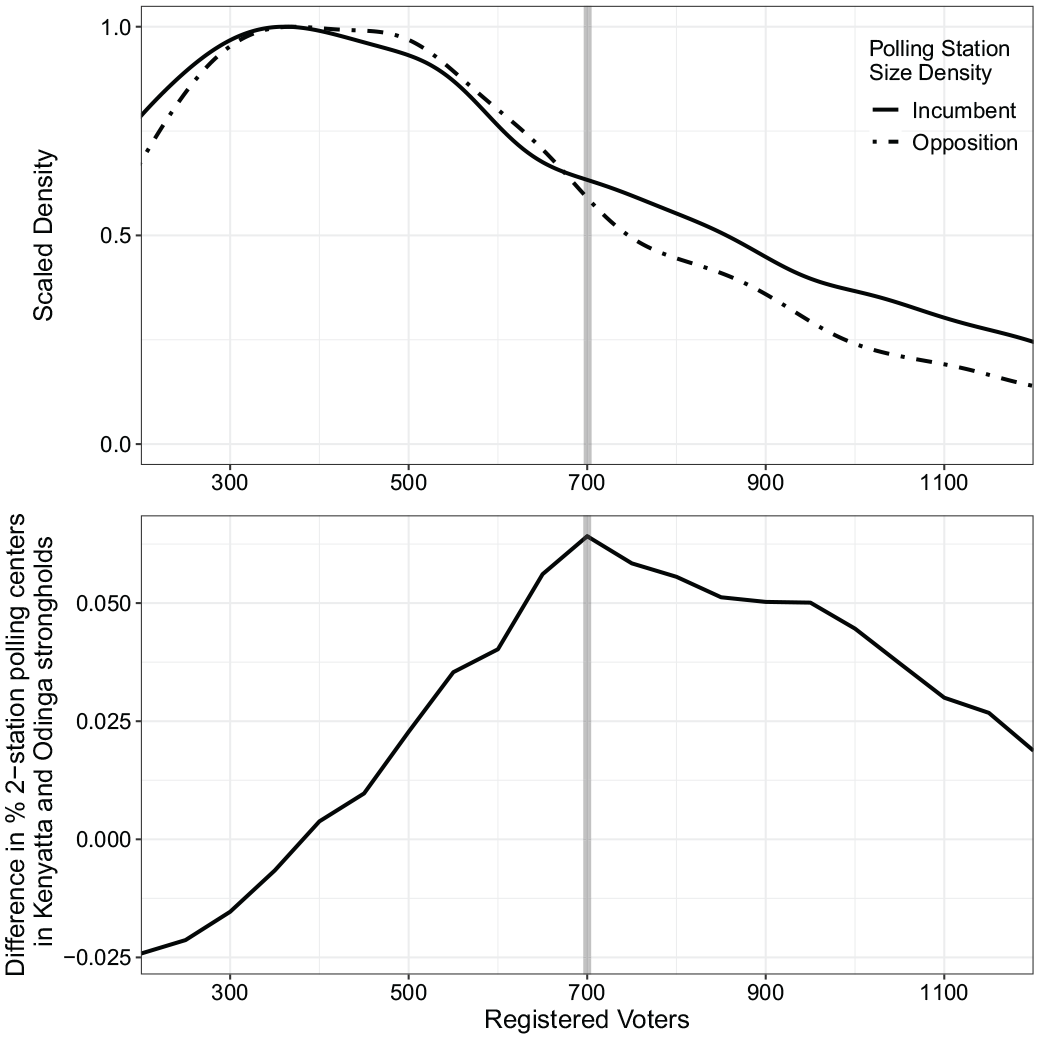
Polling centers just over the cutoff tend to lie in incumbent strongholds: as a result, the preponderance of voters experiencing a lower cost on election day are incumbent supporters.
Given how registered voters are distributed across polling centers and strongholds, it may be difficult to create an equitable distribution of dual-stream centers using a single threshold. To explore this, I examine the share of polling centers in incumbent and opposition areas that receive two streams due to the threshold across a series of hypothetical voter registration thresholds. Figure 5 (bottom panel) shows that incumbent strongholds received more dual-stream polling centers—and thus shorter lines—than opposition areas. In this figure, the horizontal axis reports various counter-factual thresholds for adding an additional stream at a polling center, with the actual 700-voter threshold marked by a gray vertical line. The vertical axis presents the difference in the percentage of polling centers having more than one stream in incumbent and opposition strongholds. Examining the difference in percentages of multi-stream centers describes how different hypothetical thresholds allocate the relative benefit of decreased congestion in stronghold areas. The results are striking: the 700-voter threshold maximizes the difference across incumbent and opposition areas, representing the policy choice that maximally advantages the incumbent.
The turnout effect in the full sample does not arise from regional disparity in polling resources. To show this, I carry out a subgroup analysis of stronghold areas, and estimate the turnout effect at the discontinuity for both incumbent and opposition regions. Across both areas, the turnout results display a similar effect at the discontinuity, despite the greatly reduced sample size: 2.2% for incumbent areas and 3.3% for opposition areas (both p < .01). This is consonant with the 2.4% turnout estimate found in the full sample. Neither the incumbent nor opposition areas show significant vote share effects, further supporting the distributional disparity discussed above, given the lack of variation in voting behavior within strongholds. The policy created a clear turnout bonus, but did so differentially, easing access to the ballot box in incumbent areas more than in opposition areas. 27
On the face of it, a stream creation policy implemented via a fixed threshold ought to be candidate-neutral, since it does not take aspects of the population into account that determine political preferences. In practice, the geographic distribution of citizens—and thus registered voters—across space may interact with policies like the 700-voter threshold in ways that do lead to differential impacts. As a result, policy makers may unintentionally discriminate in favor of certain political communities using blunt policy instruments like the streaming threshold under scrutiny. Such discrimination occurs when observable characteristics of the object of a policy (e.g., the number of registered voters per stream) are used to resolve a particular problem—in this case, polling center congestion. As demonstrated above, polling centers falling above the threshold tended to fall in areas inhabited by incumbent supporters, leading to a vote share effect.
Does the law’s passage represent the culmination of a concerted intention to buttress the incumbent’s electoral fortunes? This seems unlikely. Transcripts from the Joint Parliamentary Select Committee on matters relating to the IEBC, which discussed many potential amendments relating to the elections law, show surprisingly little interest in the nuts and bolts of election administration, focusing instead on issues related to the internal governance of the IEBC’s politically-appointed commissioners. Similarly, last-minute amendments and parliamentary debate prior to the passage of the relevant amendments suggest similar disinterest in the policy minutiae determining how long Kenyans wait to vote. 28 Interviews with IEBC staff from the period in question suggest a focus on the budgetary implications of the threshold, since it defined the number of personnel required for the election—by far the largest line item for the event. For instance, in a submission to a Senate standing committee, the IEBC pushed back against an initial version of the legislation suggesting a cap of 500 voters, which the IEBC forecast would almost double the number of polling stations to 57,331 polling stations. Indeed, the 700-voter cap seems to have been a compromise balancing cost and access-improvement, rather than a concerted effort to benefit a certain region.
Are these results generalizable? The basic mechanism that increasing voting costs may deter voters is widely applicable (Ansolabehere, 2009; Bhatti, 2012). Several countries have approaches similar to Kenya’s regarding the allocation of election resources based on voter registration. While rich covariate data is unavailable, I applied the same discontinuity design to Zimbabwe’s 2018 elections—where the threshold was 1,000 voters—and found similar results. Polling centers just above the threshold showed a 1.1% higher turnout (95% CI: 0.01%, 2.3%) than polling centers just below the threshold, results that were significant despite the fact that Zimbabwe has fewer than half as many polling centers as Kenya (p < .05). In contrast to the Kenyan results, the Zimbabwean results suggest that the vote share effect worked against the incumbent ZANU candidate, though the estimate is imprecise (−3.8%, 95% CI: −9.6%, 2.1%). This comports with contextual evidence that ZANU’s base is primarily rural—precisely the population that would be penalized by a streaming threshold favoring urban populations (Bratton & Masunungure, 2018, p. 10). In this case, we see that the incumbent may not benefit from a given policy, due to the location of incumbent supporters relative to the urban beneficiaries of the policy.
Taken together, the Kenyan and Zimbabwean data provide evidence of the subtle way in which policies designed to reduce barriers to voting may allocate electoral advantage. Which political interests benefit, however, may hinge on where supporters live, and how a policy choice shapes the distribution of electoral resources. In these cases, the differing results may be attributable to differences in the geography of incumbent support in the Kenyan (relatively urban) and Zimbabwean (relatively rural) cases.
Conclusion
The results presented in this article suggest that election-day lines had a significant effect on turnout and vote share in Kenya’s 2017 election. Polling centers with two lines and just above 700 voters exhibit about 2.4% higher turnout and 6.7% higher incumbent vote share than centers just below the threshold with a single line. These findings are practically and theoretically important for a number of reasons. First, from a theoretical perspective, the results refocus attention on institutions like electoral commissions that set the rules of the game—and thus the costs faced by individuals—at the polling center on election day. In contrast, existing work on political behavior in LMICs centers on the strategies parties and politicians use to motivate voters. Second, the results speak to existing work on the integrity and independence of election administration bodies, and provide a clear instance where popular and progressive legislation may create bias—by design or by accident—in existing independent administrative processes (Norris, 2014).
Third, the policy is a prime example of urban bias in election administration. Higher volumes of registered voters naturally occur in more populated areas. As a result, threshold-based rules allocate resources to more densely populated areas, leaving aside factors affecting costs rural voters face going to the polls, like large distances to polling centers. More broadly, these results emphasize the need for policy makers to consider how to allocate electoral resources in ways that equitably distribute the costs citizens face from electoral processes. This would require better data on election-day operations by IEBC, which could inform policy choices with evidence. 29 Also, well-developed technical solutions for the spatial allocation of public infrastructure and services (e.g., hospitals, emergency services) could be applied to determine appropriate placement of polling resources, and better reify the tradeoff between adding capacity to existing polling centers (which I study here) and creating new polling places (as in De Kadt, 2017a).
The magnitude of the turnout effect estimated here is consonant with findings in American politics on the suppressive effect of lines. Examining how increases in registrants per voting machine affects turnout in one Ohio county, Highton (2006) finds that a decrease of 100 voters per machine would have increased turnout by around 3.5%. Similarly Pettigrew (2016) shows that voter experiences of past waits decreases present turnout by just over 1%. The estimated result from Kenya is significantly stronger than that in Pettigrew (2016), which may be explained by the emphasis here on the effect of present waiting on present turnout, rather than of past waiting on present turnout.
The magnitudes of the effects are also significant when compared to recent work on vote-buying, another common and well-studied strategy for shaping African political participation (Kramon, 2017). Using observational data from Benin and a number of other African countries, Guardado and Wantchékon (2018) shows that, in unmatched data, vote buying relates to a 4.5% increase in turnout. With matching, however, results for both vote choice and turnout significantly attenuate. My results are also consonant with existing estimates of vote buying on vote share. In one experimental study, Kramon (2016) finds a positive relationship across multiple samples that vote buying may increase the probability of voting for a hypothetical candidate, with estimates ranging from 3% to 12%. While the vote share effects estimated in this article do not represent a causal effect as in Kramon (2016), the observed 6.7% jump at the cutoff shows the power of election administration choices to allocate costs across different kinds of voters. Thus, the substantive import of election administration appears on par with commonly studied political strategies for shaping voter turnout and choice.
More broadly, these effects are of similar magnitude to effects seen in the Get-Out-the-Vote literature. For instance, Dellavigna et al. (2017) estimates that social pressure related to the chances of being asked about voting contributes about 2% to turnout. A meta-analysis of 51 studies examining the effect of canvassing in the U.S. presented in Green and Gerber (2015) shows that, for high turnout (e.g., 50% and above) contexts, turnout increased by between 0.6% and 2.1%, with effects decreasing as turnout increases. Given Kenya’s average turnout rate of 80% in the August 2017 elections, the local average treatment effect of 2.4% demonstrates that basic choices made during election administration can be at least as consequential as common voter mobilization interventions.
These results raise several questions regarding the constitutionality of the legislated threshold in Kenya specifically. First, one could argue that the policy places a disparate burden on some voters, and represents a violation of Article 83(3) of the Constitution, which states that “Administrative arrangements for the registration of voters and the conduct of elections shall be designed to facilitate, and shall not deny, an eligible citizen the right to vote or stand for election.” Second, the insertion of the political preferences of the Parliament into the administrative functioning of the electoral commission may violate the constitutionally-mandated independence of the election body. 30 While legal standing of the “time tax” is clear in the United States thanks to NAACP State Conference of Pennsylvania v. Cortes, no litigation on the topic is pending in Kenya. 31 The results here highlight how seemingly benign decisions affect the costs voters face in voting, a concern that should be of particular concern in highly unequal contexts like Kenya.
The most obvious limitation of this study lies in estimation. If we interpret these results as the product of a quasi-experiment, the results are a plausibly-causal local average treatment effect: we cannot generalize about the effect outside of the specific observed threshold. Following Sekhon and Titiunik (2016), a more cautious interpretation of the design as an observational study, rather than a quasi-experiment, still evinces the central point: electoral administration matters because of how it shapes the costs voters face on election day, and which voters face those costs. Generalizing the effects of this particular policy to other contexts remains an open question best answered by similar studies in other contexts; the Zimbabwe results above provide evidence that the effect extends to at least one other context (Samii, 2016). The policy explored here is used in other places, suggesting that this study could be replicated were data available. 32 Another limitation lies on the precise interpretation of the local treatment effect. While the IEBC has clear guidelines for the establishment of polling centers and center layout, the estimated effect likely combines two different phenomena: a waiting effect related to the queue and a search effect related to finding the correct queue. The search effect represents an additional cost working against participation found only in multi-stream centers. Thus, the turnout bonus reported here is likely larger than the reported estimates. Finally, the policy plays out—and is conditional on—another policy decision that will be examined in future research: the number and location of polling centers. While aspects of this idea have been explored in De Kadt (2017a), future work may examine how the location of new polling stations shapes voter registration and turnout.
Supplemental Material
Online_Appendix – Supplemental material for Election Administration, Resource Allocation, and Turnout: Evidence From Kenya
Supplemental material, Online_Appendix for Election Administration, Resource Allocation, and Turnout: Evidence From Kenya by J. Andrew Harris in Comparative Political Studies
Supplemental Material
Replication_materials – Supplemental material for Election Administration, Resource Allocation, and Turnout: Evidence From Kenya
Supplemental material, Replication_materials for Election Administration, Resource Allocation, and Turnout: Evidence From Kenya by J. Andrew Harris in Comparative Political Studies
Footnotes
Acknowledgements
The author thanks Cole Tanigawa-Lau, Hannah Taylor, Hannah Melville-Rea, and Luis Francisco Gonzalez for excellent research assistance. Comments from Sergio Ascensio, Matthew Golder, Sona Golder, Rachel Martin Gould Harris, Bridgett King, Kinga Makovi, Ferran Martinez i Coma, Rabia Malik, Susanne Mueller, Zach Warner, and participants at the 2018 Pre-APSA workshop “Building Better Elections: New Challenges in Electoral Management” in addition to three anonymous reviewers significantly improved this manuscript. Errors are my own.
Declaration of Conflicting Interests
The author declared no potential conflicts of interest with respect to the research, authorship, and/or publication of this article.
Funding
The author disclosed receipt of the following financial support for the research, authorship, and/or publication of this article: The author appreciates research support from New York University Abu Dhabi for the publication of this article.
Notes
Author Biography
References
Supplementary Material
Please find the following supplemental material available below.
For Open Access articles published under a Creative Commons License, all supplemental material carries the same license as the article it is associated with.
For non-Open Access articles published, all supplemental material carries a non-exclusive license, and permission requests for re-use of supplemental material or any part of supplemental material shall be sent directly to the copyright owner as specified in the copyright notice associated with the article.