
Abstract
The considerable similarity in the growth paths of the Chinese and Indian economies since their respective reforms has changed after the 2008 crisis. This article tries to understand the trajectories of different parameters of economic growth in the two countries, and how these changed after the crisis. Growth has declined in both the economies, more consistently in China, compared to India. The share of exports in GDP has also declined in both economies. The dependence of the Chinese economy on exports has decreased; however, its dependence on investment has increased. Investment’s share in GDP in China has increased, whereas it has decreased in India. The structure of the manufacturing sector in China has undergone changes, which is not the case for India. The increase in the share of services and decline in the share of manufacturing in China implies that the production structure is becoming less unbalanced.
Keywords
Introduction
Chinese reforms initiated in 1979 ushered in a long period of very rapid increases in GDP. This increase was accompanied by high and rising levels of investment and booming exports that resulted in an increase in the Chinese share of world exports and of the share of exports in China’s GDP. India experienced a similar process of growth acceleration and higher levels of investment and exports after its 1991 reforms. An earlier paper compared the economic experience of these two economies since their respective reforms (Agarwal and Whalley 2015). We recapitulate the main findings of the earlier paper in the first section. We then analyse in the second section the impact of the 2008 global crisis on the two economies. The third section discusses the monetary and fiscal policies the countries adopted to counter the effects of the crisis and the policy dilemmas and choices policymakers faced. Next, in the fourth section, we discuss the performance of their economies subsequent to the new policies they adopted. In the fifth section, we discuss whether the imbalances in the economies at the time of the crisis have been rectified by the policies that were adopted to tackle the crisis. Finally, we end with some conclusions in the last section.
Reforms and Performance
We adopt two different methods to analyse the performance of the two economies. Firstly, we look at the actual performance of the two economies in the 1980s, 1990s and in the period 2000–09. Secondly, we examine the effects of the reforms. Reforms were undertaken starting in 1979 in China and 1991 in India. The effect of these consequential reforms on the economies is analysed by comparing their performance since the respective reform years. We do not directly compare calendar years, say 1994, but compare the years since the reforms. We compare the state of the Chinese economy 15 years since the reform, namely in 1994, with that of the Indian economy 15 years after the beginning of the reforms, namely in 2006. Thus, the states of the economies, 15 years since their respective reforms, are compared. We find considerable similarity in the paths of the economies since their respective reforms.
Actual Performance of the Economies
The economies grew rapidly in the years after the reforms. This growth was accompanied by changes in the production and demand structures of the two economies. Growth in both the economies accelerated in successive decades (Table 1). Furthermore, the Chinese economy grew considerably faster than the Indian economy, though the gap diminished in the 2000s.
Performance of the Chinese and Indian Economies (Average Annual %).
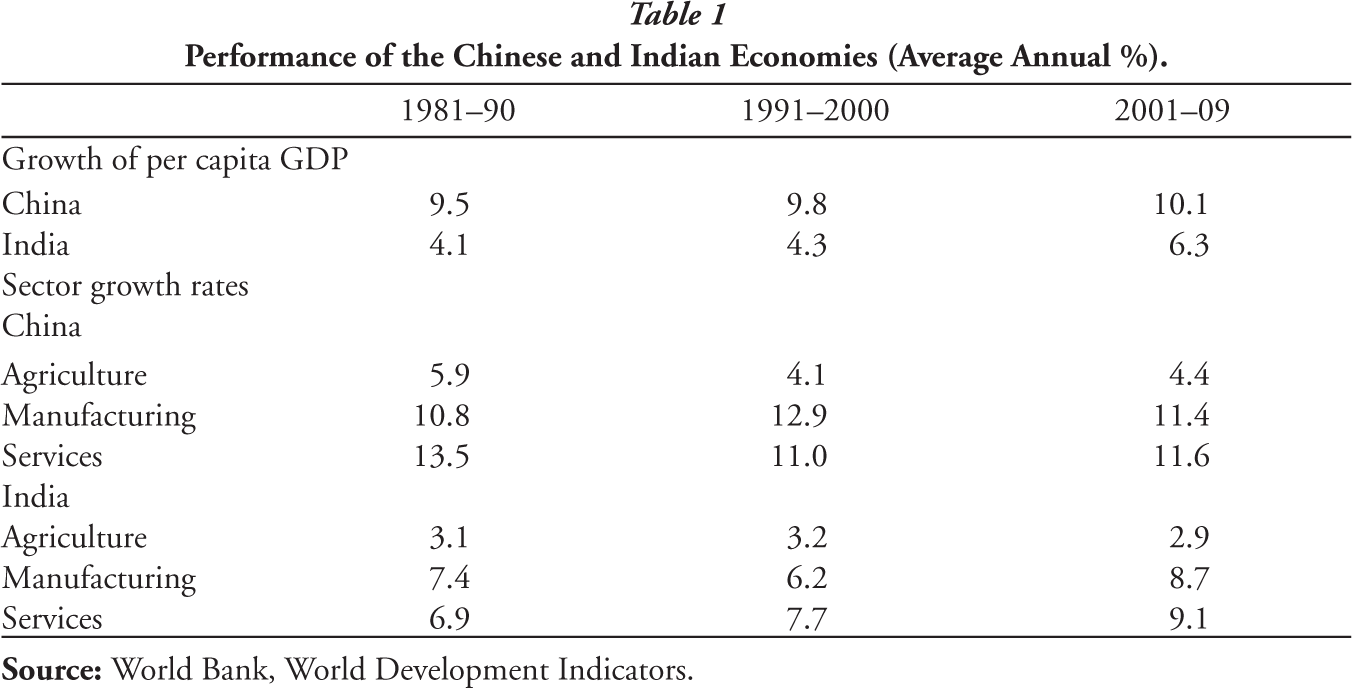
Growth of the different sectors, agriculture, manufactures and services, in China outpaced their growth in India in each of the periods (Table 1). But the gap diminished for all three sectors.
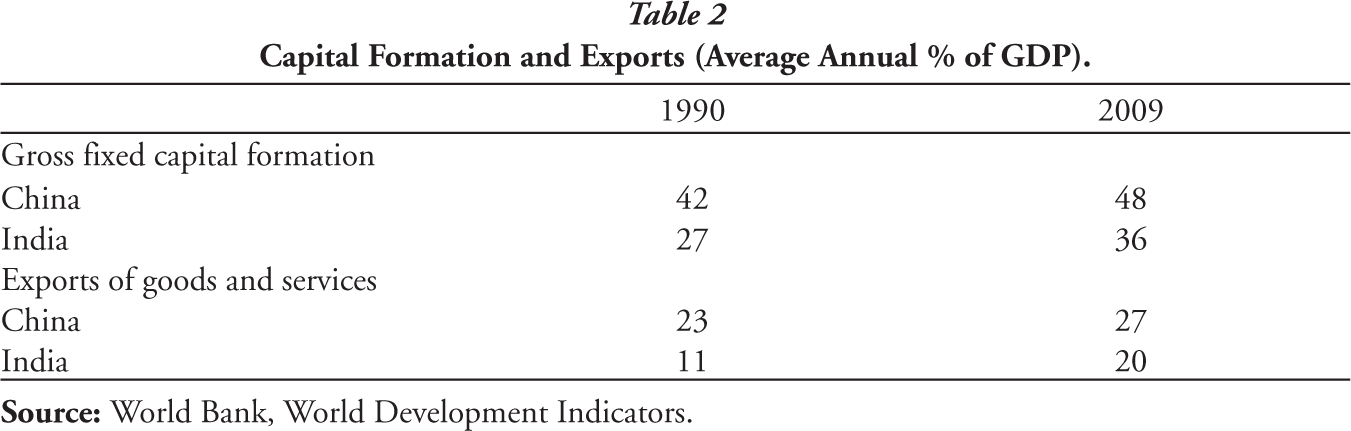
Capital Formation and Exports (Average Annual % of GDP).
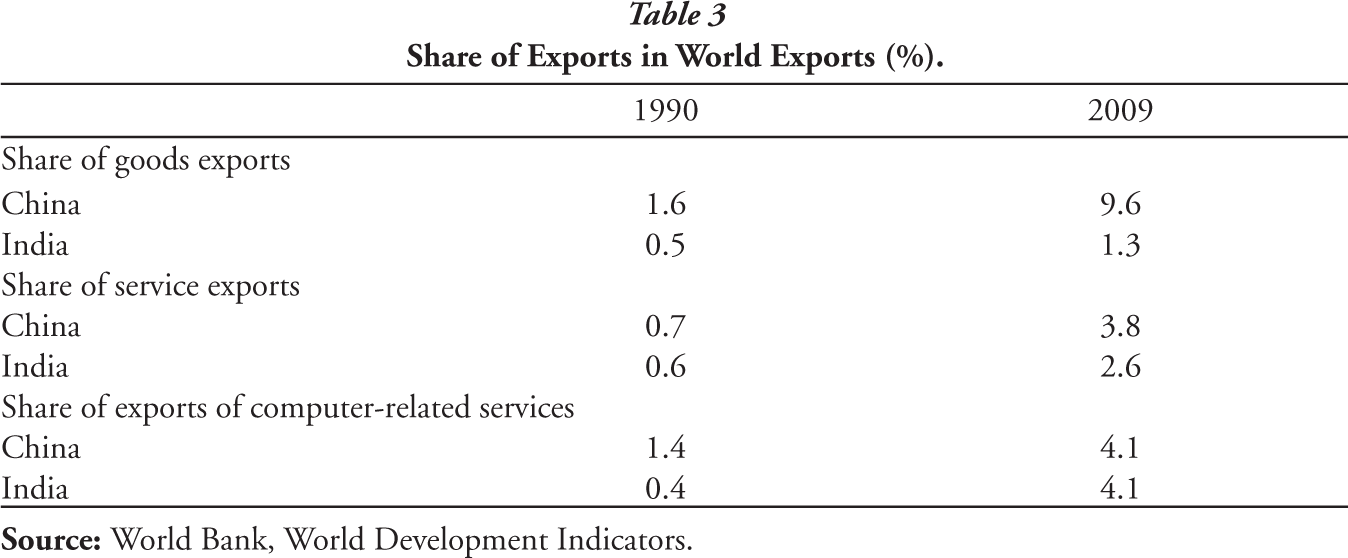
World exports of goods increased by 162% between 1990 and 2009 and developing countries increased their share of world exports from 23.6% in 1990 to 30.4% in 2009. Along with other developing countries, both China and India have increased their share of world exports of goods (Table 3), doing much better than developing countries generally. China increased its share of world exports of goods sixfold while India tripled its share. World exports of services grew faster than exports of goods as they became four times larger, though their amount remains considerably smaller. The share of developing countries in world exports of services increased from 13.6% in 1990 to 19.3% in 2009, their share of service exports is considerably smaller than their share of goods exports. China and India increased their share of world exports of services considerably more than developing countries generally, with China raising its share five times and India four times. It is only in computer-related exports that India does better than China, increasing its share 10-fold (Table 3).
Share of Exports in World Exports (%).
Despite the success of both the countries in raising their exports considerably, the behaviour of their current account balances was very different. China usually ran surpluses on the current account whereas India ran deficits. This has meant that China owns its large stock of foreign exchange reserves, whereas India’s reserves are mainly borrowed reserves, composed of portfolio inflows and deposits by non-resident Indians. 1 This makes the Indian economy more vulnerable to foreign shocks. 2
The Chinese and Indian economies increased the share of GDP invested and exported (Table 2). Also, the share of GDP exported and also invested was greater for the Chinese economy.
Both the economies have become more stable. The coefficient of variation (CV) for 11 indicators is calculated. The CV declined between 1981–90 and 2001–09 for most of the indicators. 3 But the Chinese economy is more stable. Of these 11 indicators, the CV is lower in India for only three indicators in the 1980s and 1990s, and this further decreased to merely two in the 2000s. Furthermore, there is no indicator that consistently has a lower CV in India than in China.
Economic Performance Since The Reforms
It is usually maintained that the reforms resulted in the two economies being put onto a different and higher growth trajectory than the economies had been on earlier. To take account of this we do not compare the performance of the two economies in terms of calendar time but in terms of years that have elapsed since the reforms. For instance, we do not compare the state of the two economies in 1994. 1994 is 15 years since the start of the reforms in China. So we compare this year 1994 for China with the year 2006 in India, which is 15 years since the start of the reforms in India. Also, we calculate the changes since the two economies have different starting points. For China, we take the value for 1979 as 100 and form an index chain for the other years taking 1979 as 100. Similarly, for India, we form an index chain taking 1991 as 100.
Conducting such an exercise corroborates the faster growth of the Chinese economy. Per capita GDP in the Chinese economy grew much faster, growing at an annual rate of 8.7% in the 16 years since the reforms, 1980 to 1995, and for India, for the 16 years since the reforms, 1992 to 2007, per capita GDP grew at an annual rate of 4.6%. Growth in both countries was accompanied by an increased share of gross fixed capital formation (GFCF) in GDP and a much higher share of exports of goods and services in GDP, as was discussed in Section 1A; but the paths for these two indicators were similar. However, the variance of the growth rate was 10.8 in China and a lower 4.5 in India. We see, as discussed below, this greater variability in the path of XGS (share of exports of goods and services) and GCFC for China compared to India. But despite this greater volatility, China generally experienced lower inflation than did India (Agarwal 2010).
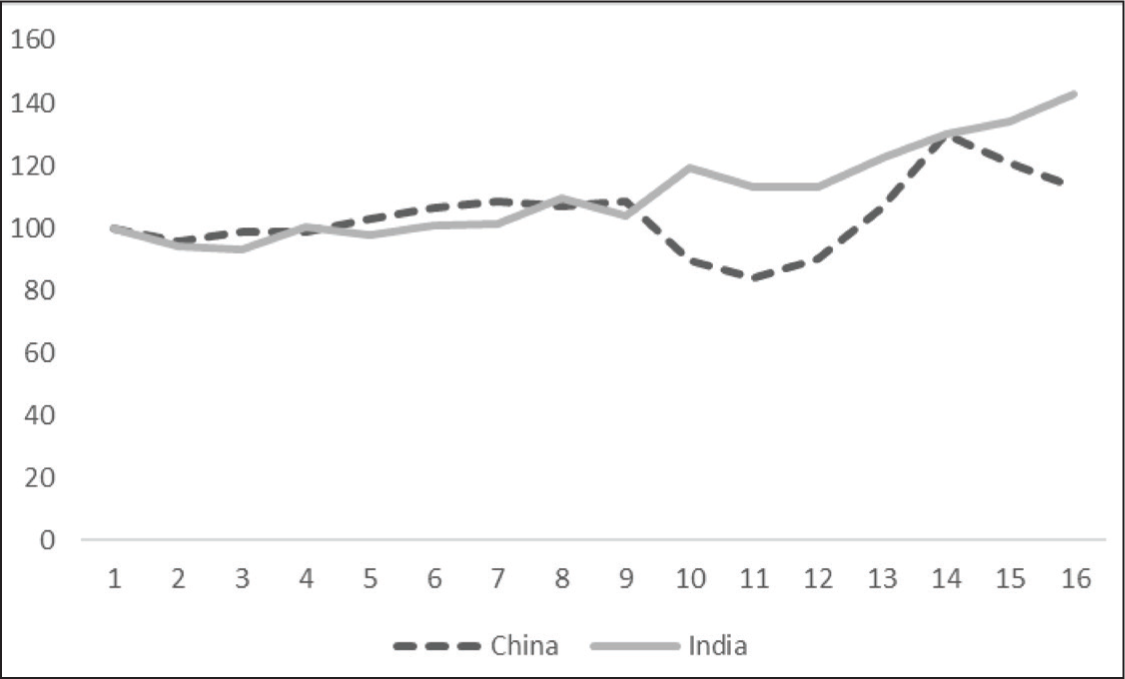
The share of GFCF in GDP though increasing steadily throughout the period in both the economies was higher in China for every year. But if we analyse it in terms of the path since each country’s reform, we find that the increase was greater in India. In the first 16 years after reforms, it increased from 25.1% to 35.8% in India, an increase of 40%, and from 28.6% to 32.34% in China, a somewhat smaller increase of about 13% (Figure 1). Furthermore, in China, the behaviour of this share showed considerable fluctuation. There was a substantial decrease in the share of GFCF in GDP in the mid-1980s before recovering to earlier levels before another decrease in the 16th year of the reform.
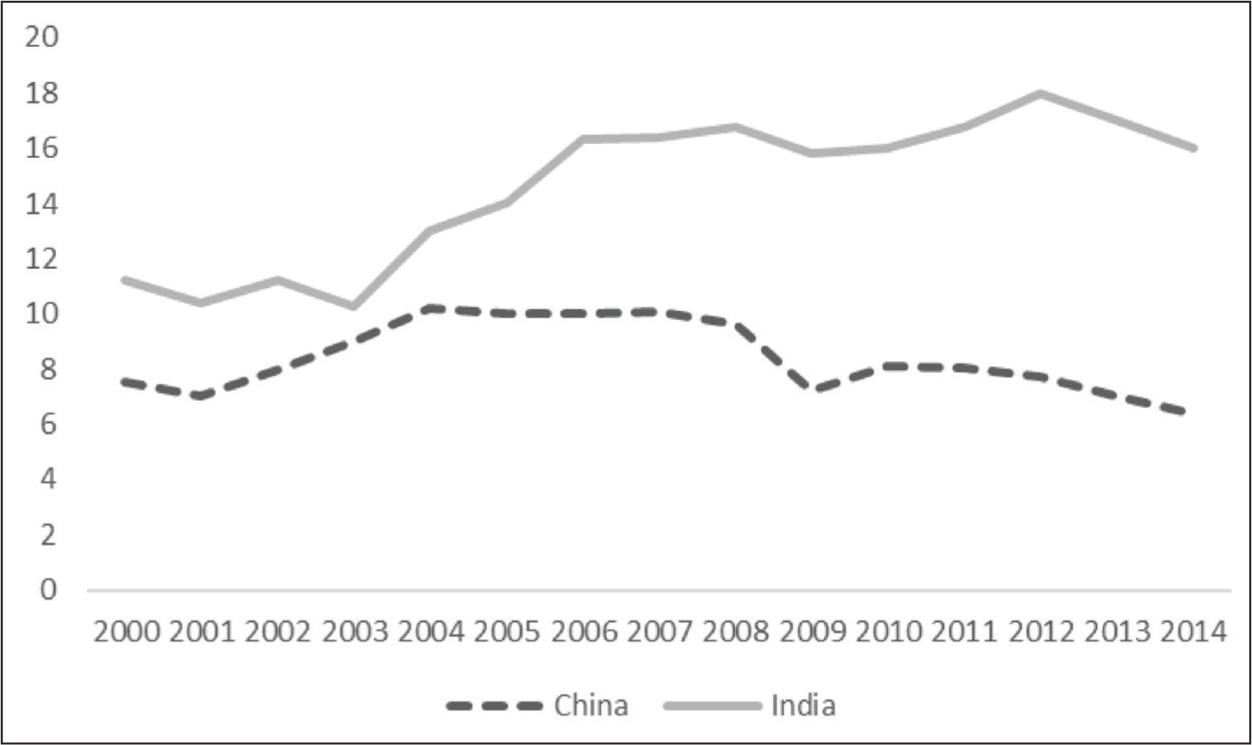
China is believed to have been much more successful than India in exporting, as throughout the period the share of GDP exported has been much higher. However, it is also important to note that XGS in GDP increased substantially in both economies after the reforms. But we note that the share of exports of goods and services (XGS) in GDP increased by much more (200%) in China than the growth in India of about 150% (Figure 2). Again, the share increased steadily in India while there were fluctuations in China. Furthermore, there is an almost parallel performance since the 10 years after the beginning of the reforms.
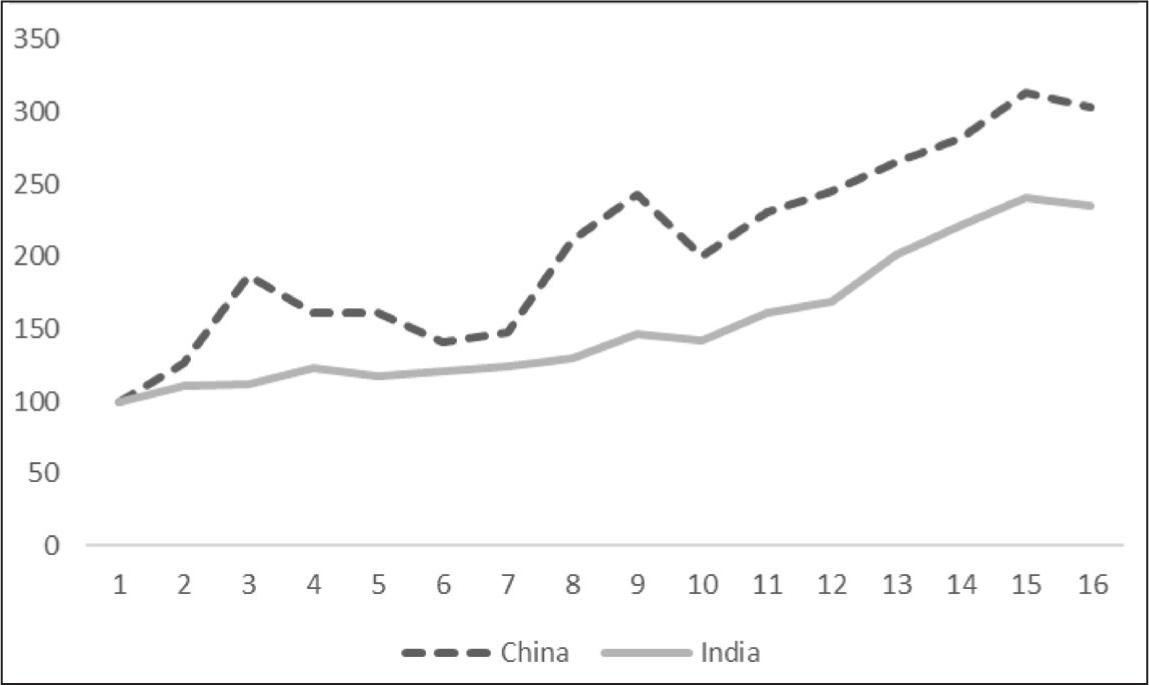
While China has been more successful in raising the share of exports of goods both in its GDP and its share of world exports than India, India has been more successful in increasing exports of services. India increased the share of exports of services in GDP fourfold in 16 years after reform, namely between 1991 and 2007 whereas it only doubled in China.
Export performance does not always mirror the output performance of the sector. Despite the more rapid growth of service exports by India, the share of services in GDP increased more rapidly in China by almost 40% almost twice that in India (Table 1). Furthermore, the share of exports of goods in GDP increased in both the economies despite the decline in the share of manufactures in GDP during this period in both the economies, decreasing by about 20% in China almost twice the decrease in India (Table 1). 4
Policies After The 2008 Crisis
In this section, we first discuss the policy response to the 2008 crisis, which was expansionary monetary and fiscal policy to counteract the recessionary effect of the decline in world economic activity. We next discuss the imbalances that this created and the difficulties these created for subsequent efforts to wind down the expansionary policies.
The Policy Response to the 2008 Crisis
The Immediate Response
Policymakers in both the countries sought to counter the fall in international demand because of the 2008 crisis. However, the situation of the two economies was very different at the commencement of the crisis. China’s economy was in a very favourable situation at the time of the crisis. It had US$1.6 trillion in international reserves along with a current account surplus of almost $400 billion or 10.4% of GDP in 2008 and a fiscal surplus of 1% of GDP (World Bank 2008). On the other hand, India’s economic position was much less favourable. The economy was experiencing excess demand that was manifesting itself in rising inflationary pressures and a rising current account deficit at the end of 2007. Because of the high rate of inflation, the Reserve Bank of India (RBI) had been following a contractionary monetary policy (Reserve Bank of India 2009, World Bank 2008).
The Chinese fiscal stimulus package envisaged spending about $575 billion, about 12% of GDP spread over two years, 2008 to 2010 (World Bank, 2008). This was financed partly through credit expansion, with total new lending equivalent to 30% of GDP in 2009. The expansionary monetary programme reversed the earlier contractionary monetary policy regime aimed at slowing the 11%–12% rate of growth over the previous years and reining in inflationary pressures. The shift involved interest rates being cut five times between September and December (Wong 2011). Conditions for loans to small to medium-sized enterprises and issuing of corporate bonds were eased. The credit quota was abolished, and a call was made for increasing credit (Wong 2011).
The combined fiscal deficit of the Centre and states in India including off-budget bonds was estimated to cross 11% of GDP for 2008–09, a huge rise from about 5% of GDP in 2007–08, a total fiscal stimulus of about 6% of GDP (Matthew 2009).
The Reserve Bank had lowered the repo rate by 425 basis points, 5 and the cash reserve ratio (CRR) by 400 basis points over a period of about seven months between October 2008 and April 2009. The overall provision of potential liquidity through conventional and non-conventional measures was about 9% of GDP (Reserve Bank of India, 2011).
These expansionary measures were in line with the recommendations of the International Monetary Fund and the G20 summit meetings at London in 2009. The communique from the London Summit of April 2009 said the G20 were undertaking an unprecedented and concerted fiscal expansion of $5 trillion. The central banks which had aggressively cut interest rates would continue to maintain expansionary policies for as long as needed (G20 2009).
The Unwinding of the Special Measures
The expansionary fiscal and monetary measures, while necessary, strengthened inflationary pressures; the monetary measures had meant a reversal of the RBI’s earlier contractionary policy, and the fiscal measures meant a deviation of the government’s announced path towards reducing the fiscal deficit—the Fiscal Responsibility and Budget Management Act, 2003.
Towards this end of winding down the expansionary measures, the monetary policy normalisation process, started in October 2009, was continued between February 2010 and July 2010 as the effective policy rate was raised by 250 basis points and the CRR by 100 basis points. The fiscal stimulus was reduced in 2009–10 to 1.8% from 2.4% in 2008–09 (Reserve Bank of India 2011). Despite tightening monetary and fiscal policy, inflation remained sticky forcing the Reserve Bank to raise its policy rate more aggressively in 2011–12. It hiked the repo rate by a total of 125 bps during the year so that the operational policy rate was raised by 475 bps in less than 17 months since March 2010, when the rate hikes began (Reserve Bank of India 2011).
The RBI was also concerned with a number of structural features that were affecting economic performance, and so influenced the policy measures adopted. On the fiscal side its main concern was that given the limitations of raising fiscal resources, the fiscal need was for a shift in the government’s expenditure from current expenditures to investment expenditures. It called for broader rebalancing demand from private and government consumption to private and public investment. It particularly thought it important to raise infrastructure investments. The decreases in public infrastructure investment had resulted in greater dependence on private infrastructure investment, which, in turn, depended on increased bank lending for such investment. The financing of long gestation projects with short-term bank financing aggravated the deterioration of asset quality arising from the effects of the cyclical downturn. 6 It sought to develop a bond market to finance long-term infrastructure investment but banks continued to play an important role that adversely affected the quality of their assets.
Also, the government encouraged investment in construction through various tax concessions. This was partly because construction is labour intensive and so would help to boost employment as manufacturing was not providing sufficient new employment. This diverted resources from investment in manufacturing. The very sharp decrease in the share of household financial savings in shares and the conversion of the development finance companies, such as the Industrial Development Bank of India and the Industrial Credit and Investment Corporation of India, into commercial banks, further reduced the sources of long-term finance for industry. As a consequence, the share of machinery and equipment in total GFCF declined, and this decline adversely affected the growth rate of the manufacturing sector (Agarwal and Ghosh 2017).
The higher inflation rates because of the expansionary policies following the 2008 crisis created another dilemma for the RBI. Higher interest rates encouraged capital inflows which if unsterilised would lead to an appreciated exchange rate that would harm exports. 7 As it was, exports had been severely hurt by the crisis. Sterilisation would lead to higher interest rates that would encourage further capital inflows while perhaps simultaneously discouraging investment.
China’s export growth plummeted from the fourth quarter of 2008 through 2009. This had a stunning negative effect on growth, –41% in 2009, as exports comprised one-third of GDP (Wong 2011). The larger Chinese stimulus programme raised somewhat similar concerns as in India. While the stimulus worked in bringing the economy to a higher growth path it appeared to spin quickly out of control (Wong 2011). Investment in fixed assets jumped to 66% of GDP in 2009, and infrastructure investment leapt to more than 18% of GDP, raising concerns about the economy’s absorptive capacity and the care with which projects were selected and implemented. 8 The big ramp-up in easy credit, for example, helped to fuel an asset bubble that sent prices of land and housing steeply upward, more than doubling in some big cities during 2009. The heavy pace of local investment was causing worries about rising local government debt. In early 2010, the government called for an immediate freeze and audit of local government investment corporations, and by year-end, the urgent problem for macro management had shifted decisively to slowing growth and tamping down inflationary pressures.
A second issue that had been arising even before the crisis, was further aggravated by the GFC. Rising wages were making its earlier labour-intensive strategy no longer viable. Also, a significant share of public enterprises was allowed to go bankrupt with a significant loss of jobs. In the decade after 1994, state enterprise jobs declined by 44 million and manufacturing jobs by 25 million (Overholt 2010). For continued rapid growth, higher value-added manufacturing growth was required. Further, a shift towards the domestic market, a vast expansion of the service sector, and the replacement of public enterprises by private firms was the need of the hour. But it was claimed that the crisis generated expenditures concentrated on older sectors, and the state enterprises that could create jobs quickly were more likely to be able to pay back their loans. Small and medium industries, the service sector and the private sector appear to have been severely damaged by the crisis (Overholt 2010). However, Lardy and Subramanium (2011) in a detailed analysis of the allocation of credit show that this was not the case. He showed that small enterprises received more of the credit than large enterprises; the former are predominantly private and the latter public. Withdrawal of the stimulus would need to be accompanied by measures that would help in the required restructuring. The GFC underlined that China needed to move beyond the hitherto dominant export and investment-oriented, low-cost growth model. The Chinese economy had grown dangerously over-reliant on exports and investments in the industrial sector. Due to a mixture of political interference and structural incentives, the growing Chinese capital stock had been allocated increasingly inefficiently, and as a result, China’s growth model was in danger of leaving the country in a ‘middle-income trap’ (Lynch 2015). However, the ‘One Belt, One Road’ initiative relies on high levels of infrastructure investment, and also perhaps to encourage exports through reduced transport costs. It could connect Western China with newer export markets in Eurasia. Chinese construction companies and work crews are expected to be the main contractors for OBOR projects.
The Outcome for the Chinese and Indian Economies
We now examine how the two economies have performed since the 2008 crisis. Initially, the economies maintained their high growth rates and it was believed that not only had they become decoupled from the performance of the world economy but many believed that they could lead the recovery of the world economy (Justin 2012).
Growth of per capita income fell in 2008 in India but then recovered strongly in 2009 and 2010. Since then, it has fluctuated but has trended down since 2016 (Figure 3 and Table 4). Chinese growth after an uptick immediately after the 2008 crisis has declined steadily after 2010.
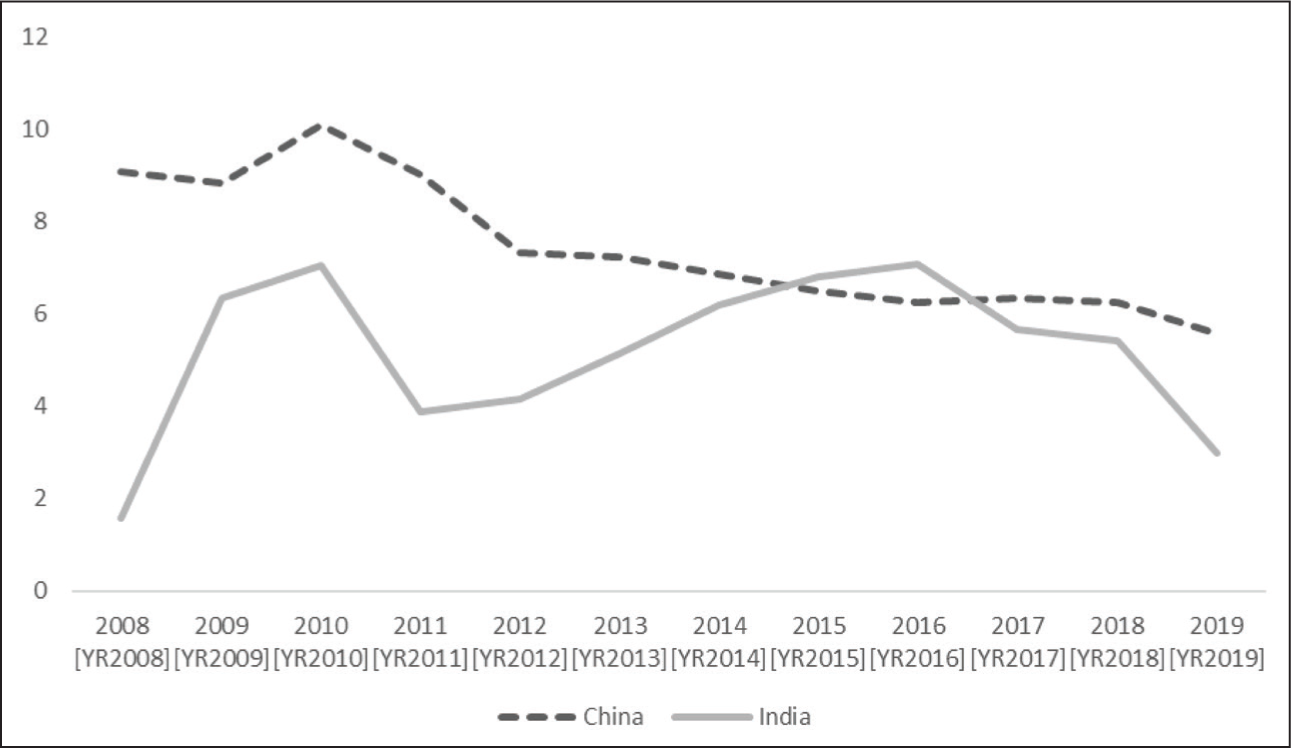
Growth of Per Capita GDP, 1992–2019.
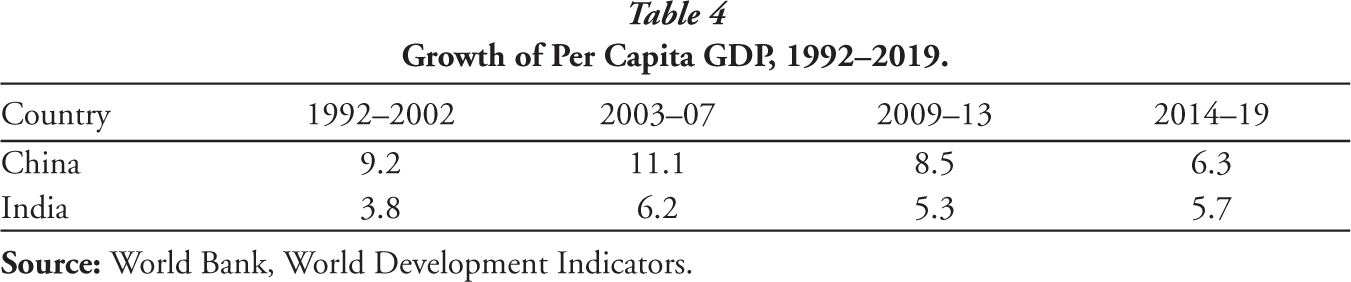
India’s growth shows more of a cyclical pattern, reinforcing the idea that the Indian economy is more unstable than it was in the pre-2008 period. However, the rate of growth has consistently declined over the past three years. China’s growth slowdown since 2008 almost completely comes from a sharp slowdown in total factor productivity growth (Lai 2015). During this period, the positive effect on growth from expanding investment has been completely offset by the negative effect of the slowdown in total factor productivity growth. Supply factors caused China’s growth to slow down when China crossed the Lewis turning point (Cai 2015). This prolonged slowdown does not support the idea that it was caused by cyclical factors.
The productivity slowdown is, however, just a statistical construct to reflect that the high rate of investment is not generating high rates of growth. The causes for the slower productivity growth need to be explored. China’s higher education and research system are expanding. The Chinese are now filing and owning the most patents. They are leaders in technology in areas such as 5G technology. It is not clear whether the economy is in a phase where new machine-producing industries are being established to take advantage of the new technologies being developed, and the higher Incremental Capital Output Ratio (ICOR) or lower productivity reflects a period before the new industries mature. Korea had gone through such a period when it was developing the next generation of technologically more sophisticated export industries. 9
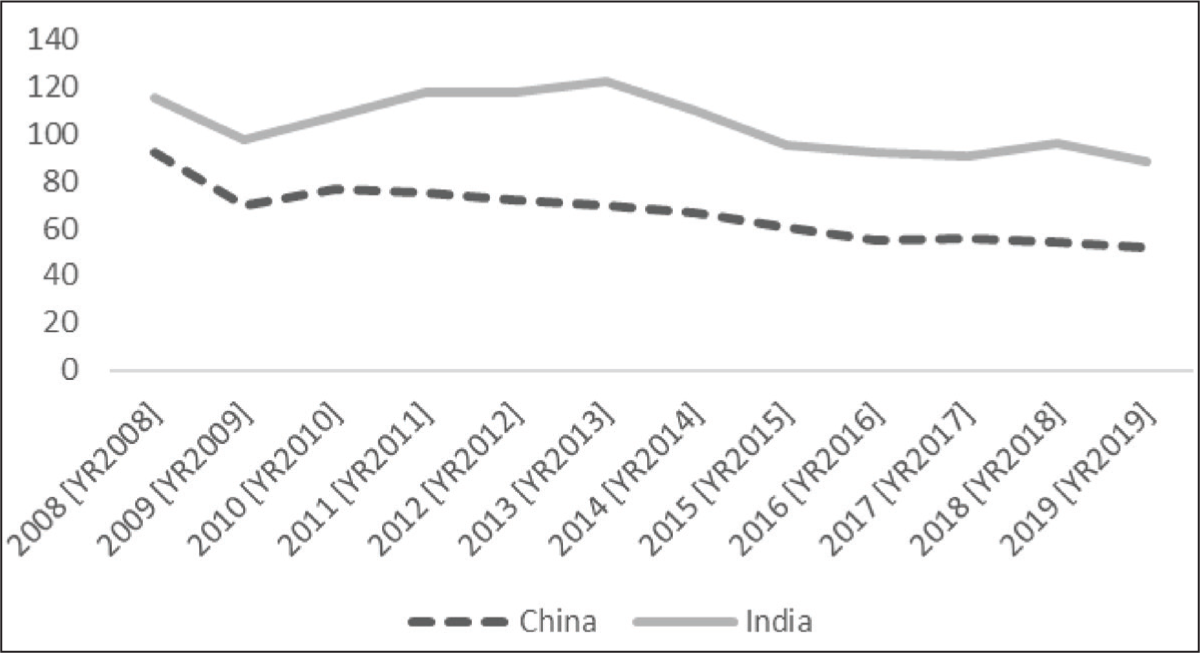
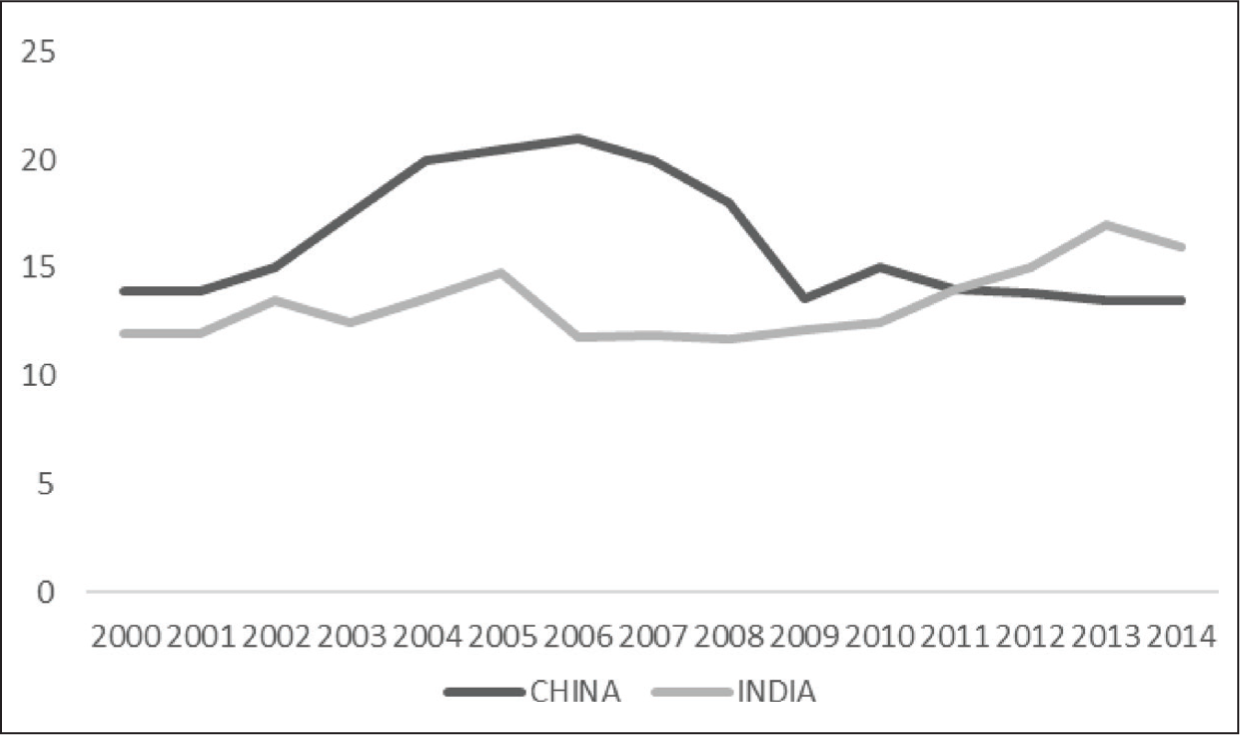
The slowdown in growth in the two economies was accompanied by a decline in the share of XGS in GDP (Figure 4). This share fell in India from 24.1% in 2008 to 18.4% in 2019, a decline of almost 30%. However, the decline was much sharper in China where the share fell from 32.6% in 2008 to 18.4% in 2019, a fall of almost a half. Again, whereas the share of exports decreased steadily in China since 2010 they increased in India till 2013 before declining.
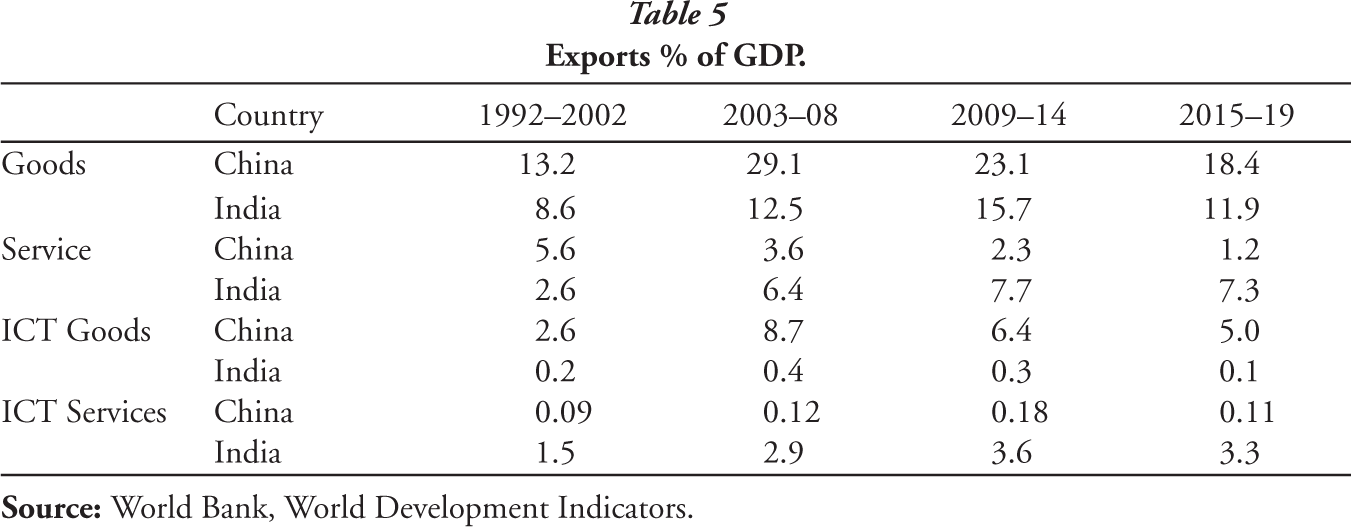
The share of exports both of goods and of services in GDP declined after 2008 (Table 5). For both, goods and services, the decline was much greater for China than for India. The share of exports of goods which was 15.7% and 29.4% in India and China, respectively, in 2008 declined to 11.2% and 16.7%, respectively, in 2019, with declines, respectively, of 30% and 50%. Share of exports of services in GDP fell by only 15% in India from 8.4% to 7.2% during the period, whereas it fell by almost 50% in China from 3.2% to 1.7%.
As a percentage of GDP, China exports more of ICT goods and India of ICT services (Table 5). Since the 2008 crisis, exports of ICT, goods and services, have declined in China and India both as a percentage of GDP and as percentage of goods and service exports respectively (Table 5). This decline doesn’t bode well for the future as ICT exports are the most dynamic segment of world exports.
Exports % of GDP.
The percentage of imports in gross value of output of manufactures has diverged since 2004, going up in India but going down in China (Figure 5). Also, the percentage of exports in the gross output of manufactures has been going down in China since 2006 and very sharply after 2008 (Figure 6). The behaviour has been very different in the case of India where the export percentage has grown since 2009. As a consequence, the export percentage has become greater in India than in China since 2012.
The behaviour of GFCF after the 2008 crisis is also very different in the two countries. The share of GFCF in GDP increased further in China from 39% to 42%, whereas it decreased in India from 35% to 27% (Figure 7). ICOR has increased in both countries but more in China so that it is now more than in India.
The change in ICOR reflects a change in the manufacturing structure in China. We calculate the percent of the gross value of output in each manufacturing sector in the total gross value of output of manufacturing. We then calculate the correlation between the shares of the manufacturing sectors for different years. The structure of manufacturing does not change much between 2001 and 2008 in either country, the correlation coefficient is over 0.9 (Table 6). However, there is a significant change after 2008. The correlation between the structure of the manufacturing sector in 2008 and 2014 is still very high for India, 0.98, but is small in the case of China, –0.26. This low correlation between the sector structure suggests that there has been considerable change in the structure of the manufacturing sector in China.
Correlation between Manufacturing Sector in Different Years.
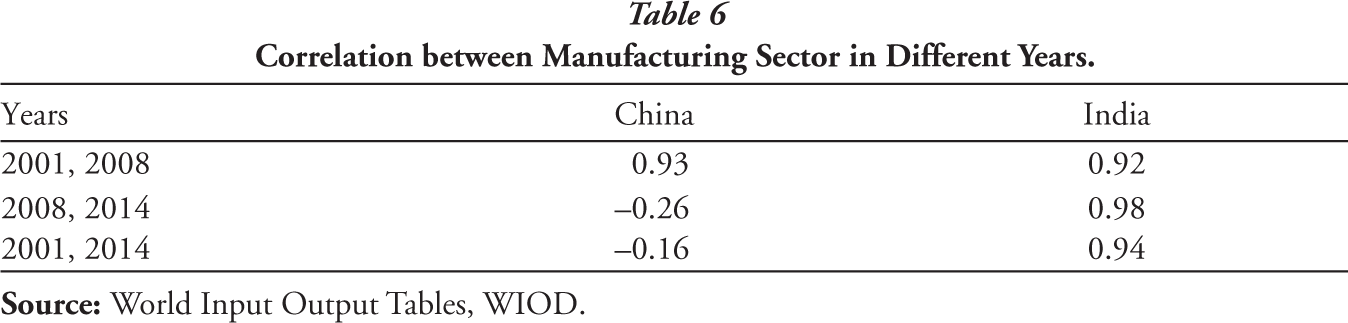
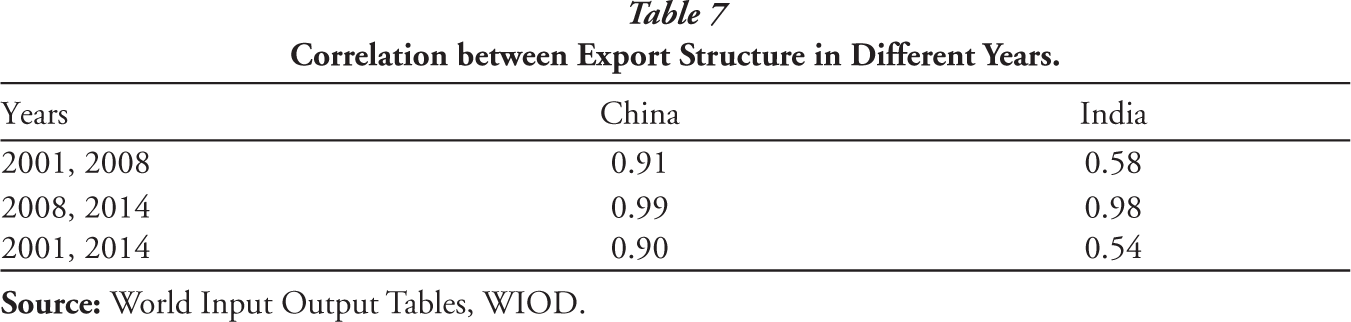
However, the shifting manufacturing structure in China has not resulted in a change in export structure (Table 7). This implies that the newer industries are not export-oriented, thus, perhaps explaining the decline in the share of exports in manufacturing or in GDP since 2008. There has not been much of a change in India’s export structure since 2008. The significant change in export structure between 2001 and 2008 in India is mainly because of changes in two export groups. Textile exports declined from 36.9% of total exports in 2001 to 15.9% in 2008 while in the same period, the percent of petroleum products increased from 0.4 to 18.7.
Correlation between Export Structure in Different Years.
Imbalances in the Chinese and Indian Economies
We now discuss the nature of imbalances in the Chinese and Indian economies. The Chinese and Indian economies have followed somewhat imbalanced growth paths. The Chinese economy is considered imbalanced because of its relatively small consumption, both personal and government, particularly the former, and considerable reliance on investment and external surpluses (Lardy 2010). The latter was because of the large export sector fuelled by an undervalued exchange rate (Lardy 2010). The Indian growth path is unbalanced in terms of large fiscal deficits and large current account deficits. Also, the production structure is imbalanced in the two countries. In China, the industrial sector is too large and the services sector is too small. In India, structural transformation has stalled as the share of industry has not been increasing as expected (Lele, Agarwal and Goswami 2018). We analyse in this section whether post-GFC growth has seen a rebalancing.
We first look at the production structure.
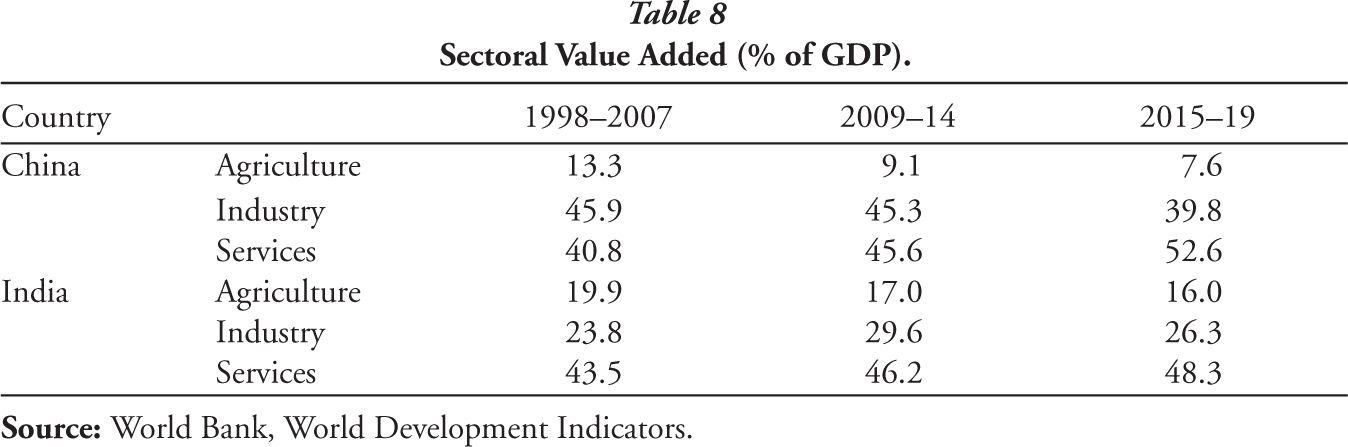
We see that there has been a rebalancing of the Chinese production structure with a decline in the share of industry and an increase in the share of services since the middle of the second decade (Table 8). This is in contrast to the immediate years after the 2008 crisis which saw little rebalancing. In contrast, structural transformation remains stalled in India. The share of agriculture seems almost constant and the share of industry has fallen. This lower share is mainly because of a fall in the share of manufacturers. Even the share of services in India is more or less in line with that in low-income countries generally.
Sectoral Value Added (% of GDP).
We next examine the demand structure.
In the initial years after the GFC, the imbalance in the demand structure increased in China as the share of household consumption fell and the share of GFCF increased (Table 9). However, the external surplus decreased, contributing a negative amount to growth in this period. The next period saw rebalancing as the share of consumption, both personal and government increased and the share of GFCF fell. The external surplus saw further adjustment and fell to only 1.8% of GDP.
Demand Structure (% of GDP).
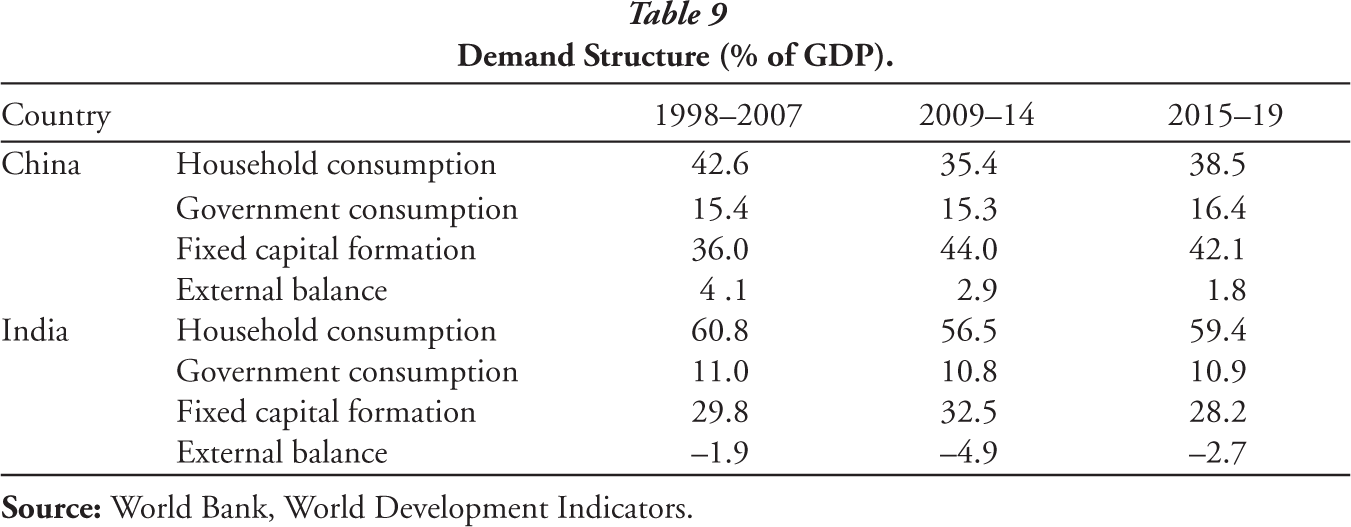
There were only minor changes in the demand structure in India. The only significant change in the second period, 2015–19, from the years after the crisis, is a decline in the share of GFCF and also in the external deficit. It is not clear that the fall in the share of GFCF is in the right direction if the economy is to grow at a rate needed to further reduce poverty levels and achieve other goals enunciated in the Sustainable Development Goals. While the decline in the external deficit is desirable, it is not appropriate rebalancing as the deficit is likely to increase if growth picks up. The immediate important imbalance in the Indian economy is the fall in the share of domestic savings. In the past, the recovery of investment has followed the recovery of savings (Agarwal and Ghosh 2017). So, if the economy is to invest more to accelerate growth, it is imperative to raise the savings rate. It might not then be appropriate to raise consumption as is often recommended in order to overcome a perceived lack of demand. 10 While government steps to raise consumption might push up the growth rate in the short term, it would not put the economy on a longer-term higher growth path.
Conclusion
The results of comparing the performance of the Chinese and Indian economies depend on how the comparison is conducted. When we compare their performance in the years till the GFC of 2008 in calendar years the Chinese grows faster and has a higher share of exports and investment in GDP than does India. However, we get a different perspective if we compare the performance of the two economies since their reforms. So instead of comparing their performance in the same year, we compare their performance after the same number of years after their respective reforms. We then find that the Chinese and Indian economies had very similar paths after their reforms starting in 1979 and 1991 respectively.
The GFC crisis of 2008 presented a similar challenge to the two economies. This was the collapse in external demand. They followed very similar policies to counter the effects of the 2008 crisis. Monetary policy, which had been contractionary to counter the inflationary pressures at the start of the crisis, was quickly reversed to tackle the deflationary pressures emanating from the world economic downturn. Fiscal policy was expansionary more so in China which had more fiscal space.
These policies were so successful in countering the deflationary effects of the GFC that many analysts believed that these two large economies could lead to international recovery. But the policies created imbalances that had long-run effects that resulted in poorer performance later but also resulted in divergent growth paths. The immediate effect was a quick economic recovery. Subsequently, the growth rate has tended to decline, consistently in China whereas in India it is difficult to disentangle the longer-run trends from cyclical features. The changes in economic structure have been more in China than in India. In both economies, the share of exports, both goods and services, in GDP declined, more in China than in India. The share of manufacturing output, not of value-added, exports has declined sharply in China so that it is now lower than in India. Also, the import content of manufactures declined in China whereas it increased in India. It seems that China is going through a period of restructuring with newer industries that are not only less import-dependent but also export less of their output. It could be that the lower export propensity of these industries is a short-run effect as these industries raise their efficiency and international competitiveness through learning by doing. However, the sectoral composition of exports of manufactures did not change very significantly in either country. In contrast, the industrial structure changed considerably in China unlike in India, suggesting that the newer industries were less export-oriented at least at this stage.
The changes in the share of exports and in the manufacturing sector suggest that there seems to be a beginning of the correction of the structural imbalances in the Chinese economy. The increase in the share of services and decline in the share of manufacturing implies that the production structure is becoming less unbalanced. There is also less dependence on exports. However, the share of capital formation in GDP had increased further so consumption remains low. Also, the efficiency of this increased investment may be questionable as growth of GDP has declined leading to a much higher ICOR.
The decline in the share of investment and of exports in India raises questions of what will provide the demand impulse for growth. Also, the decline in investment raises doubts about increases in the supply potential.
Footnotes
Declaration of Conflicting Interests
The authors declared no potential conflicts of interest with respect to the research, authorship and/or publication of this article.
Funding
The authors received no financial support for the research, authorship and/or publication of this article.