
Abstract
Background
Negotiating a return to driving after stroke is a complex process for both clients and health professionals. Stroke can result in functional changes in cognition, perception, and motor performance that impact driving ability (Perrier et al., 2010; Rapoport et al., 2019). As such, in many jurisdictions worldwide, there is a mandatory period of driving restriction post-stroke and driving can only be resumed when functional assessments reveal no residual functional impairments that would impact driving ability, including within Canada (Canadian Council of Motor Transport Administrators, 2020), the United States (Winstein et al., 2016), Australia (National Stroke Foundation, 2010), and the United Kingdom (Stroke Association, 2019). Clients experience considerable practical and deeply meaningful challenges when driving status is questioned and community mobility is threatened (Liddle et al., 2009; Patomella et al., 2009; Vander Veen & Laliberte Rudman, 2022). Health professionals, including occupational therapists, are aware of the high stakes associated with driving and feel ill-equipped to broach the contentious topic of driving with their clients (Korner-Bitensky et al., 2010; Sangrar et al., 2018). Therapists cite concerns regarding competency, lacking resources, ethical tensions, and role ambiguity among the barriers to addressing driving (Korner-Bitensky et al., 2010; Sangrar et al., 2018, Scott et al., 2024). As such, occupational therapists have identified a need for context-specific practice resources to navigate the difficult return to driving process with clients following stroke (Cammarata et al., 2017; Stack et al., 2018).
Supporting clinician professional development may provide a useful strategy to bolster competence addressing driving in clinical practice (Vander Veen et al., 2024). Clinical reasoning is a skill often considered in professional development in occupational therapy (Royeen et al., 2000). Clinical reasoning is defined as “a complex cognitive process that uses formal and informal thinking strategies to gather and analyze client information, evaluate the significance of this information and weigh alternative actions” (Simmons, 2010, p. 1151). A related construct in professional development and possible product of improved clinical reasoning is self-efficacy for career, or job performance (O’Brien et al., 2019). Bandura (1997) describes self-efficacy more generally as “the beliefs in one's capabilities to organize and execute the courses of action required to produce given attainments” (p. 3). As it applies to work contexts, self-efficacy is the confidence in one's ability to complete work-related tasks (O’Brien et al., 2019). Together supporting improvement in clinical reasoning may in turn impact self-efficacy, and build competence for addressing driving, a practice area fraught with many challenges. Moreover, both constructs are relevant for self-appraisal of clinical practice. As regulated health professionals, occupational therapists are required to regularly self-appraise their compliance with competency standards for practice (College of Occupational Therapists of Ontario, 2024, p. 4), which in many ways, is synonymous with self-appraisal of clinical reasoning and self-efficacy for any practice area, including driving.
The PReDAS and PReDAS-2
The Practice Resource for Driving After Stroke (PReDAS; Vander Veen et al., 2023) was developed to provide occupational therapists with a comprehensive, stroke-specific, evidence-based resource to inform clinical reasoning for addressing driving in the acute care setting. (N.B. This resource was designed to support occupational therapy generalists who do not have advanced training in driver assessment or rehabilitation.) Although many clients after stroke may attend inpatient or community-based therapy, acute care is where the initial discussions with an occupational therapist about driving may take place following stroke. Moreover, for clients who do not attend follow-up therapy, the acute care setting may be the only occasion to discuss driving with an occupational therapist. As per stroke best practice guidelines, clients are to receive recommendations and education about return to driving following stroke (Mountain et al., 2020, Winstein et al., 2016) and thus such information may need to be provided in acute care.
The PReDAS, informed by the Canadian Stroke Best Practice guidelines (Mountain et al., 2020), includes resources and procedures for five key elements including: (1) best practice education for the practitioner, (2) fitness to drive screening, (3) clinical decision-making aids, (4) stakeholder communication, and (5) community mobility planning. The PReDAS is not a screening tool or prescribed assessment battery, but rather, a practice resource for clinicians to address driving post-stroke within the acute care context. As such, the PReDAS recommends screening tools currently supported in the literature for clinicians to consider when developing a screening plan for their client, which is subject to change with emerging evidence. To that end, the research team completed a systematic review to update and extend existing reviews of screening tests predictive of fitness to drive following stroke concurrently with the present study (Vander Veen et al., 2025). The PReDAS guides the practitioner through the process of addressing driving from initial conversations with the client to communicating recommendations. A complete description of the PReDAS is outlined in (Vander Veen et al., 2023).
In a recent feasibility study, occupational therapists and physicians reported the PReDAS provided a clear and consistent process for addressing driving, enhanced communication and collaboration with the team and client, and supported clinical decision making for driving recommendations (Vander Veen et al., 2023). Clients similarly agreed the PReDAS was a useful resource to address driving and supported their own decisions surrounding returning to driving. Important areas of improvement in the PReDAS were suggested by both past participants and academic reviewers based on results from the feasibility study. Specifically, the updated version, the PReDAS-2, includes: (1) new client handouts to better tailor education for each client, (2) clearer administration guidelines, (3) an expanded screening results summary sheet for other clinical findings (such as OT functional assessments, observations or reports from other team members or family), and (4) more education for both clinicians and clients for legal and insurance implications of driving against medical advice or with a suspended license (both within the manual as well as in the client handouts).
Purpose
Considering the supportive findings from the feasibility study and recent updates to the PReDAS, evaluation of the PReDAS-2 is warranted. The previous feasibility study completed a single-time survey which primarily explored the self-reported utility and usability of specific features of the original PReDAS, with no specific measurement of constructs related to professional development, such as clinical reasoning or self-efficacy. More robust research is needed to examine how the PReDAS-2 can support addressing driving among occupational therapists employing repeated measures specific to professional development. Thus, the goal of the current study was to examine the relationship between use of the PReDAS-2 and self-reported clinical reasoning and self-efficacy of occupational therapists to address driving in acute stroke settings.
Method
Design
A concurrent multiple baseline across subject design (Ledford & Gast, 2018) was utilized to examine the effects of the PReDAS-2 on self-reported clinical reasoning and self-efficacy for addressing driving in acute stroke settings among occupational therapists. The present study received ethics approval from Western University's Health Research Ethics Board (Project ID: 124200). The study protocol was also registered on Open Science Framework (registration doi: https://doi.org/10.17605/OSF.IO/6ZCPH).
Multiple-baseline studies are intended for small sample sizes and include “baseline” and “intervention” phases with data collected at many time points. Participant outcome measures are compared between baseline and intervention phases to assess for change related to the intervention. Thus, the strength of this design is that experimental control can be established by comparing intersubject replication of the experimental effect across a small number of participants (Tate, 2018). For concurrent multiple baseline designs, the participants begin the study at the same time and each have a period of baseline data collection (measures taken before receiving the intervention), and intervention data collection (measures taken after receiving the intervention).
While this approach includes a smaller sample size, this design enables detailed, rich data collection from a smaller, engaged group of participants. Occupational therapists in acute care report driving is important to their practice but consistently report time constraints in their work (Murray et al., 2021; Vander Veen et al., 2023), which would likely extend to limited time for research participation as well. As such, a randomized controlled trial design requiring many participants to have sufficient statistical power, would be unrealistic given the characteristics of the target population. Moreover, as constructs such as self-efficacy and clinical reasoning may be dynamic (Ouweneel et al., 2013; Scaffa & Wooster, 2004), repeated measures as achieved in a multiple baseline design can demonstrate how constructs may change over time.
Participants
Occupational therapists were recruited through a variety of methods, including online invitations via social media platforms (Facebook and Twitter), professional networks (Clinical Preceptor Network from Westerm University, Greater Toronto Area Occupational Therapy Professional Practice Leader Network), and professional associations (Canadian Association of Occupational Therapists and Ontario Society of Occupational Therapists, and Provincial Stroke Networks). Occupational therapists were eligible to participate if they practiced on an acute stroke unit. To avoid threats to intervention fidelity, occupational therapists were ineligible to participate if there was already a participant enrolled from their local workplace (same physical building), or if they had viewed a copy of the PReDAS-2 previously. The letter of information and consent form was provided electronically via QualtricsXM, which directed prospective participants to provide their email address for communication throughout the study.
PReDAS-2 Intervention
To ensure each participant received the same exposure and training for the PReDAS-2, each occupational therapist participated in a one on one, 60 min training session. A brief multiple-choice knowledge test was administered to each participant after the training session to evaluate understanding of the material (Supplemental Appendix A). Training sessions occurred online via Zoom and involved reviewing the written manual via screen share. Participants also received a full-text electronic copy of the PReDAS-2 (including the manual and all resources) for use and reference throughout the study. As many occupational therapists work in teams, the participants were given permission to share the full-text electronic copy of the PReDAS-2 with any occupational therapists working on the same local acute stroke unit. Feedback from the feasibility study (Vander Veen et al., 2023) underscored the value of consistency in addressing driving, and thus permitting participants to share the resource on their unit provides an opportunity for team members to adopt similar approaches if desired.
Instruments
Self-reported clinical reasoning was measured via the Self-Assessment of Clinical Reflection and Reasoning (SACRR) tool, developed to evaluate clinical reasoning among occupational therapists and physiotherapists (Royeen et al., 2000). Items on the SACRR inquire about key behaviors and actions related to clinical reflection and reasoning (Royeen et al., 2000). Internal consistency of the SACRR has been reported between .87 and .92 as measured by Cronbach's Alpha, and its Spearman rank order correlation coefficient for test–retest reliability is rated as “acceptable” at .60 (Royeen et al., 2000). The SACRR contains 26 items (five-point Likert scale; strongly agree to strongly disagree) which were summed to create an aggregate score, with minimum and maximum scores of 26 and 130, respectively. Aggregate SACRR scores were used for all analysis.
Self-efficacy was measured by the Personal Efficacy and Beliefs Scale (PEBS; Riggs et al., 1994), which measures self-efficacy regarding work-related skills and tasks (O’Brien et al., 2019). Internal reliability is estimated at .82 from a sample of nurses working in acute care (Peterson et al., 2011). The validity of the PEBS is supported through positive correlations with similar measures of job satisfaction, job performance, and organizational commitment (Riggs et al., 1994). The PEBS is designed to be used across many professions by instructing respondents to refer to their specific work when completing the scale (O’Brien et al., 2019), and as such is expected to be appropriate for use with occupational therapists as well. The PEBS contains 10 items (six-point Likert scale; strongly disagree to strongly agree) which were summed to create an aggregate score; the minimum and maximum summed scores are 10 and 60, respectively. The aggregate PEBS scores will be used for all analysis.
As the SACRR and PEBS are broad measures of job self-efficacy and clinical reasoning and reflection, respectively, the measures were slightly adapted to cue the participants to answer the questions specific to addressing driving in their practice (Deane et al., 2022; Sari & Bayazlt, 2017). For example, instead of the following item from the PEBS “I have confidence in my ability to do my job”, the item was adapted to “I have confidence in my ability to address driving.” As with the PEBS, participants were cued to answer the SACRR as it related to addressing driving in acute care settings. The adapted SACRR and PEBS surveys are presented in Supplemental Appendix B. Demographic data was also collected including the year of graduation from occupational therapy program, number of years in practice, and number of years working in acute stroke care.
Procedure
Design standards for multiple-baseline studies recommend at minimum three participants (for across subject designs) and at least five data points in total, with best practice recommending at least three data points within both the baseline and intervention phases (Gast et al., 2018; Tate, 2018). As such, we recruited eight occupational therapists and obtained seven data collection points to accommodate for attrition and exceed minimum standards. Data was collected for a period of 6 months with data collected at seven points: at baseline, and at 1, 2, 3, 4, 5, and 6 months. As such, self-reported clinical reasoning and self-efficacy was measured seven times over the course of the study. Figure 1 illustrates the baseline and intervention phases of the study for all participants, as well as the seven data collection time points. To reduce threats to internal validity due to history (events occurring external to the study, such as a release of a new driving practice standard) or maturation (“natural” improvement in addressing driving that could occur over time), the length of the baseline phase varied across participants (Tate, 2018). The criterion for introduction of the PReDAS-2 intervention to participants was determined by number of months from baseline, whereby each participant was randomly assigned to receive the PReDAS-2 at month 2, 3, 4, or 5, ensuring two participants in each time frame. As compensation, each participant received one $25 e-gift card for each completed survey (out of seven) for a total of $175 in e-gift cards per participant.
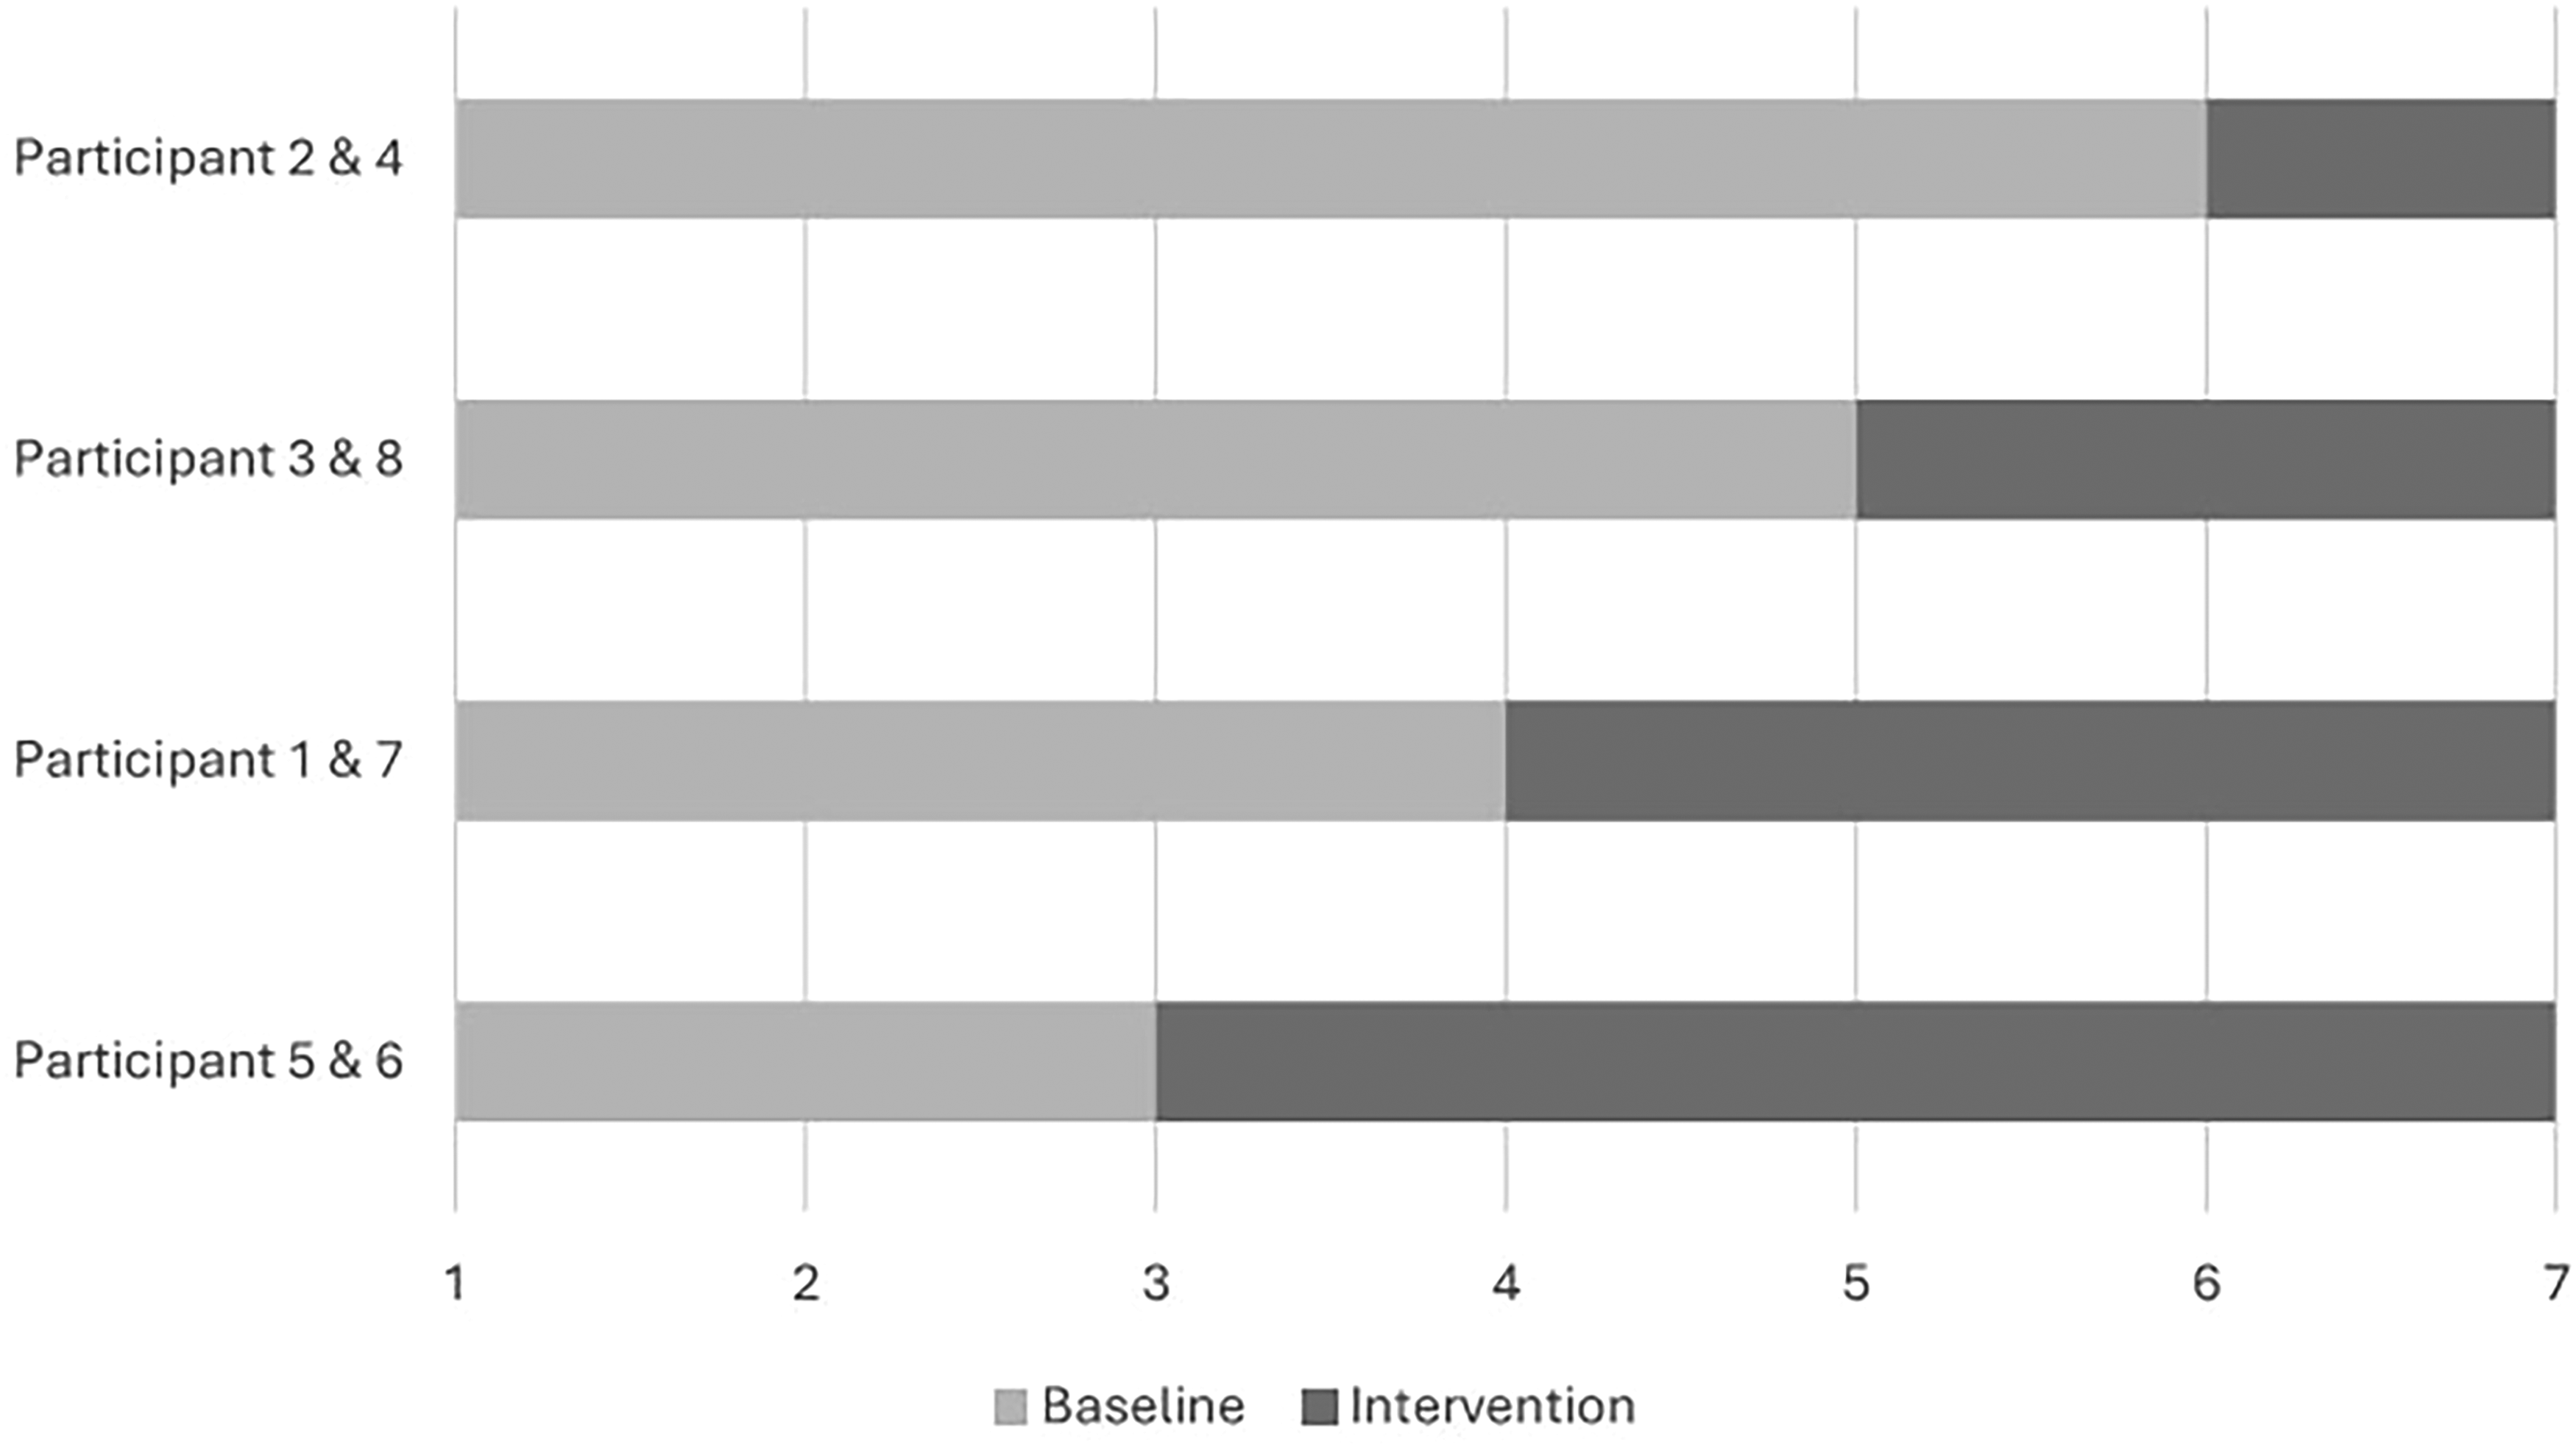
Baseline and intervention phase length and data collection time points (months) of participants. Note. Participants were randomized into baseline lengths of 3, 4, 5, or 6 months. The graph represents the length of each participant’s baseline and intervention phases. For example, participants 2 and 4 completed 6 surveys (baseline phase = 6 months) before receiving the PReDAS-2, and 1 survey afterwards (intervention phase = 1 month). Data was collected at enrollment and at the end of each month for 6 months, for seven total data collection points, as indicated on the x-axis.
QualtricsXM was used to obtain consent and complete data collection. Participants were emailed an online survey link to review the letter of information and express consent to participate in the study. After indicating consent, participants were automatically re-directed to the separate demographic survey to generate a unique participant ID. At the required seven data collection time points, participants were contacted via email to enter their participant ID and complete the PEBS and SACRR for each time point.
Analysis
Visual Analysis
Visual analysis is the most widely used analysis method for multiple baseline and other single-subject designs (Barton et al., 2018; Vannest & Ninci, 2015). Visual analysis is the visual inspection of graphed data by the researcher using systematic procedures to assess for patterns and relationships within the collected data (Barton et al., 2018). Visual analysis facilitates examination of the efficacy of the intervention across time and subjects and is critical for assessing experimental control (Barton et al., 2018). As such, visual analysis (Barton et al., 2018) was utilized to evaluate changes in (1) self-reported clinical reasoning and self-efficacy within participants and (2) observe the relationship between the introduction of the PReDAS-2 and occupational therapists’ reported clinical reasoning and self-efficacy across all participants. As such, line graphs were created for each participant to observe changes in scores for both measures (SACRR and PEBS) over the seven data collection points in the study.
The systematic method of visual analysis by Barton et al. (2018) was utilized. Line graphs were analyzed for variability/stability, level, trend, and overlap. Variability and stability are opposites and reflect the degree of variation of observed scores within phases, usually measured as “highly variable,” “somewhat variable,” and “stable” (Barton et al., 2018). Assessment of variability and stability are completed without numerical quantification, as no guidelines exist for quantifying the magnitude of variability/stability within visual analysis (Barton et al., 2018). Level is the range of measured scores (minimum and maximum observed scores) within both baseline and intervention phases (Barton et al., 2018). Trend refers to the direction of change in scores and is described as “accelerating” (scores increasing in ordinate value over time), “decelerating” (scores decreasing in ordinate value over time), or “zero celerating” (data line is or nearly parallel to the x-axis; Barton et al., 2018). Trend can be further characterized qualitatively as either a “gradual” slope of the trend line, or a “steep” slope of the trend (Barton et al., 2018). Overlap refers to the amount of data points that are identical between baseline and intervention phases and the absence of overlap in scores between baseline and intervention phases can signal a treatment effect (Barton et al., 2018).
Visual analysis of the graphed data to assess variability/stability, level, trend, and overlap is required to examine experimental control, and determine if there is a functional relationship between the intervention and the dependent variable(s) (Barton et al., 2018). A functional relationship can only be established if there are (1) at least three opportunities to observe the hypothesized change related to the intervention (at least three participants with baseline and intervention data) and (2) there are at least three actual observations of the hypothesized relationship in the data (at least three participants’ data demonstrated the expected change in scores from baseline to intervention phases; Barton et al., 2018). A functional relationship is confirmed when similar conditions generate the predicted levels and trends both within and across participants (Barton et al., 2018). If a functional relationship is established, it is examined for magnitude, or the amount of change in dependent variables related to the intervention using the conventions “small” (some variability in data, gradual trends, and evidence of overlap between baseline and intervention phases), “medium” (data more stable, trend becoming more steep but still overlap between phases), or “large” (stable and steep trends, very little to no overlap between phases; Barton et al., 2018).
Visual analysis is also a useful strategy to assess for threats to internal validity. As gaining expertise in addressing driving is a significant self-reported priority for occupational therapists (Cammarata et al., 2017; Vander Veen et al., 2024), it is possible therapists could access other resources not associated with the PReDAS-2, which could improve scores. Moreover, clinical reasoning and self-efficacy could also increase without intervention as clinicians gain practice experience. Detailed visual analysis of baseline trend can detect such improvement in scores due to maturation effects (Gast et al., 2018); thus, baseline and intervention trends were assessed.
Tau-U Analysis
Concurrently with visual analysis, Tau-U analysis is a widely accepted statistical procedure within single subject designs that: can control for type I errors, adjust for baseline trend, is less affected by within-case variability, correlates well with other indices (such as visual analysis), and discriminates well at upper and lower limits (Fingerhut et al., 2021; Parker et al., 2011; Vannest & Ninci, 2015). Tau-U analyses were conducted to evaluate the effect size of the PReDAS-2 using the conventions of small (<.20), moderate (.20–0.60), large (0.60–0.80), or very large (>0.80) (Vannest & Ninci, 2015).
The online Tau-U calculator on Single Case Research (Vannest et al., 2016; https://singlecaseresearch.org/calculators/tau-u/) was utilized to conduct Tau-U analysis. Initially, baseline data was assessed using the Tau-U online calculator for the presence of statistically significant baseline trend (p < .05), that is, the evidence of change in scores independent of the intervention (Parker et al., 2011). When statistically significant baseline trend was detected, baseline correction was applied and Tau-U was calculated to statistically control for baseline trend (Parker et al., 2011). Tau-U was calculated for each participant, combined for all participants, and combined for participants with at least three data points in each phase per best practice (Gast et al., 2018; Tate, 2018).
As multiple baseline designs require repeated measurement, missing data is inevitable and specific strategies must be utilized to impute missing data to reduce risk of bias (Aydin, 2024). Given the data for SACRR and PEBS are summed aggregate scores (vs. means), missing data must be addressed to reduce threats to internal validity. Following data collection, the missing data was identified, the proportion of missing data was calculated, and the expected nature of missing data (missing completely at random, missing at random, missing not at random) was assessed (Aydin, 2024). In the context of multiple baseline designs, missing completely at random is data missing which is unrelated to the observed or missing data (Aydin, 2024), such as a participant missing follow-up testing due to inclement weather. Missing at random is data missing which is unrelated to missing data but is related to observed data (Aydin, 2024). For example, if a participant selected “strongly agree” on a survey for many items in a row, they could have inadvertently missed one of the items in the sequence. Missing not at random is missing data related to the missing scores and the pattern of missingness is not random (Aydin, 2024), for example, a participant who performs much lower on a test than other participants and drops out of the study.
As the data collected is ordinal (“strongly agree” to “strongly disagree”) means are not an appropriate strategy for imputation. Instead, the “observed minimum” and “observed maximum” were imputed for missing data (Aydin, 2024). The “observed minimum” represents the lowest score reported by the participant within a particular phase (either in baseline or intervention) and by contrast, “observed maximum” is the highest observed score in that phase (Aydin, 2024). As higher aggregate scores are equal to improvements in the constructs within both scales (and the hypothesis is that scores will increase following the intervention), data imputation was completed to reduce the risk of type I error. Specifically, when data was missing from baseline, the “maximum observed” score was imputed, and for intervention, the “minimum observed” score was imputed. Consequently, the imputations reduced type I error by biasing toward a smaller change between baseline and intervention phases.
Findings
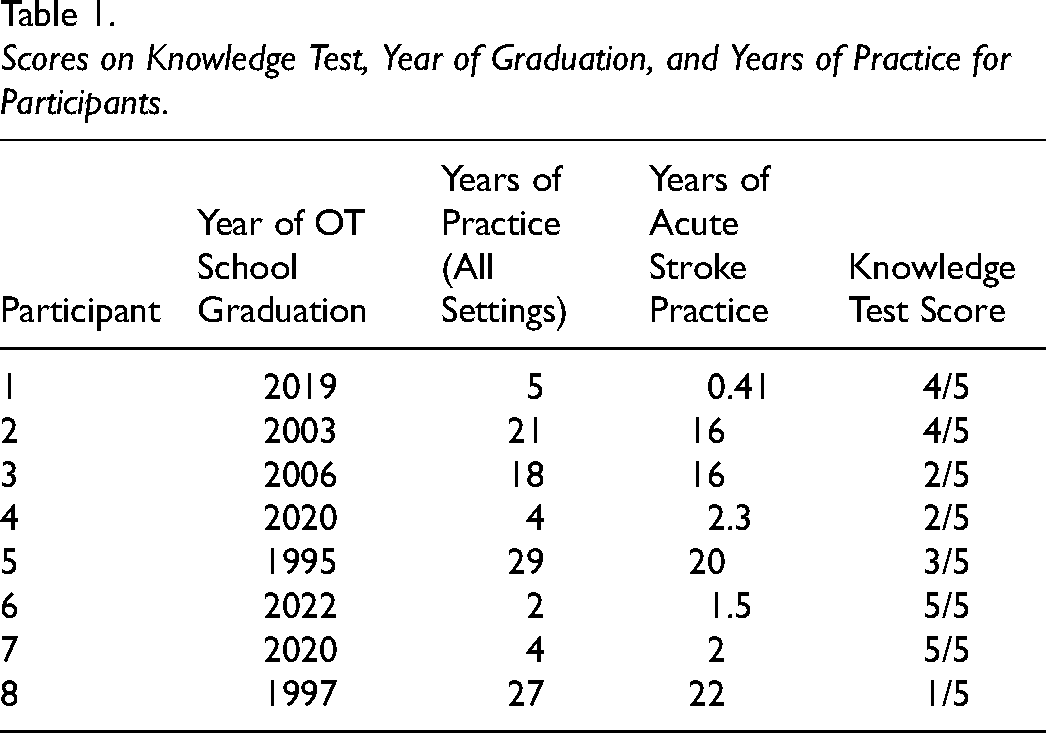
A total of eight occupational therapists participated, with a mean years of practice as an occupational therapist, and years specifically practicing in acute stroke care of 13.75 (SD = 11.23; range = 2–29) and 10 (SD = 9.3; range = 0.41–22), respectively. The mean score on the knowledge test (out of 5) was 3.3 (SD = 1.5; range = 1–5), indicating there was some variation in clinician knowledge following the PReDAS-2 intervention. Reviewing performance on knowledge test given the length of time the participant had been practicing, no consistent pattern was observed related to practice experience (e.g., that the people with less experience scored lower, or people with more experience scored higher). Table 1 presents the participant year of graduation, years of practice and corresponding scores on knowledge test.
Scores on Knowledge Test, Year of Graduation, and Years of Practice for Participants.
The amount of missing data was quite low, only seven (0.35%) individual item responses were missing from the 1,960 data points collected. Specific items missing and data imputations completed are presented in Supplemental Appendix C. Additionally, due to a technical issue with the QualtricsXM platform, SACRR Question 7 (“I look to theory for understanding a client's problems [related to driving] and proposed solutions to them”) was erroneously omitted from the online survey. As a result, no responses were collected for this item by any participant at any time point. As such, a total of 56 potential data points were missing due to measurement error (one item, by eight participants, at seven data collection time points, assuming a 100% response rate). If this item was included in the online survey, a 100% response rate for all items would have produced 2,016 data points across all participants and time points. Accordingly, an additional 2.8% (56 of 2,016) of data is missing due to measurement error. The minimum and maximums summed scores for SACRR based on this omission in the current study are therefore 25 and 125, respectively. As the missing data represents a small proportion (< 5%) and was uniformly missed for all participants, this item was dropped from analysis consistent with pairwise deletion or available case analysis (Aydin, 2024).
Visual Analysis
Figure 2 presents the line graphed data and Table 2 presents the specific visual analysis interpretations for clinical reasoning and self-efficacy. Visual analysis of clinical reasoning for addressing driving, measured by the SACRR, revealed that across all participants, data was “somewhat variable” within conditions for six of the eight (75%) participants. Level varied across all participants, from 67 to 121 (maximum score = 125) in baseline and 84 to 125 in the intervention. For five out of eight (62.5%) participants, there was a steep, accelerating trend postintervention in data with no overlap in scores between baseline and intervention phases. For two (25%) participants, there was a gradual accelerating trend (one with some overlap [participant 6] and one with no overlap [participant 2]), and for one (12.5%) participant the data was zero celerating, with data point overlap in baseline and intervention phases. Visual analysis indicates a functional relationship between the PReDAS-2 intervention and self-reported clinical reasoning. The data demonstrated more than three observations of the trend (>3 participants showed improvement in scores after the intervention), and the trend was consistent, whereby this pattern is evident as seven out of eight (87.5%) participant's scores trended toward improvement in self-reported clinical reasoning following the intervention. As the trends were steep and occurred for the majority of participants, the magnitude of the functional relationship is estimated as “large.”
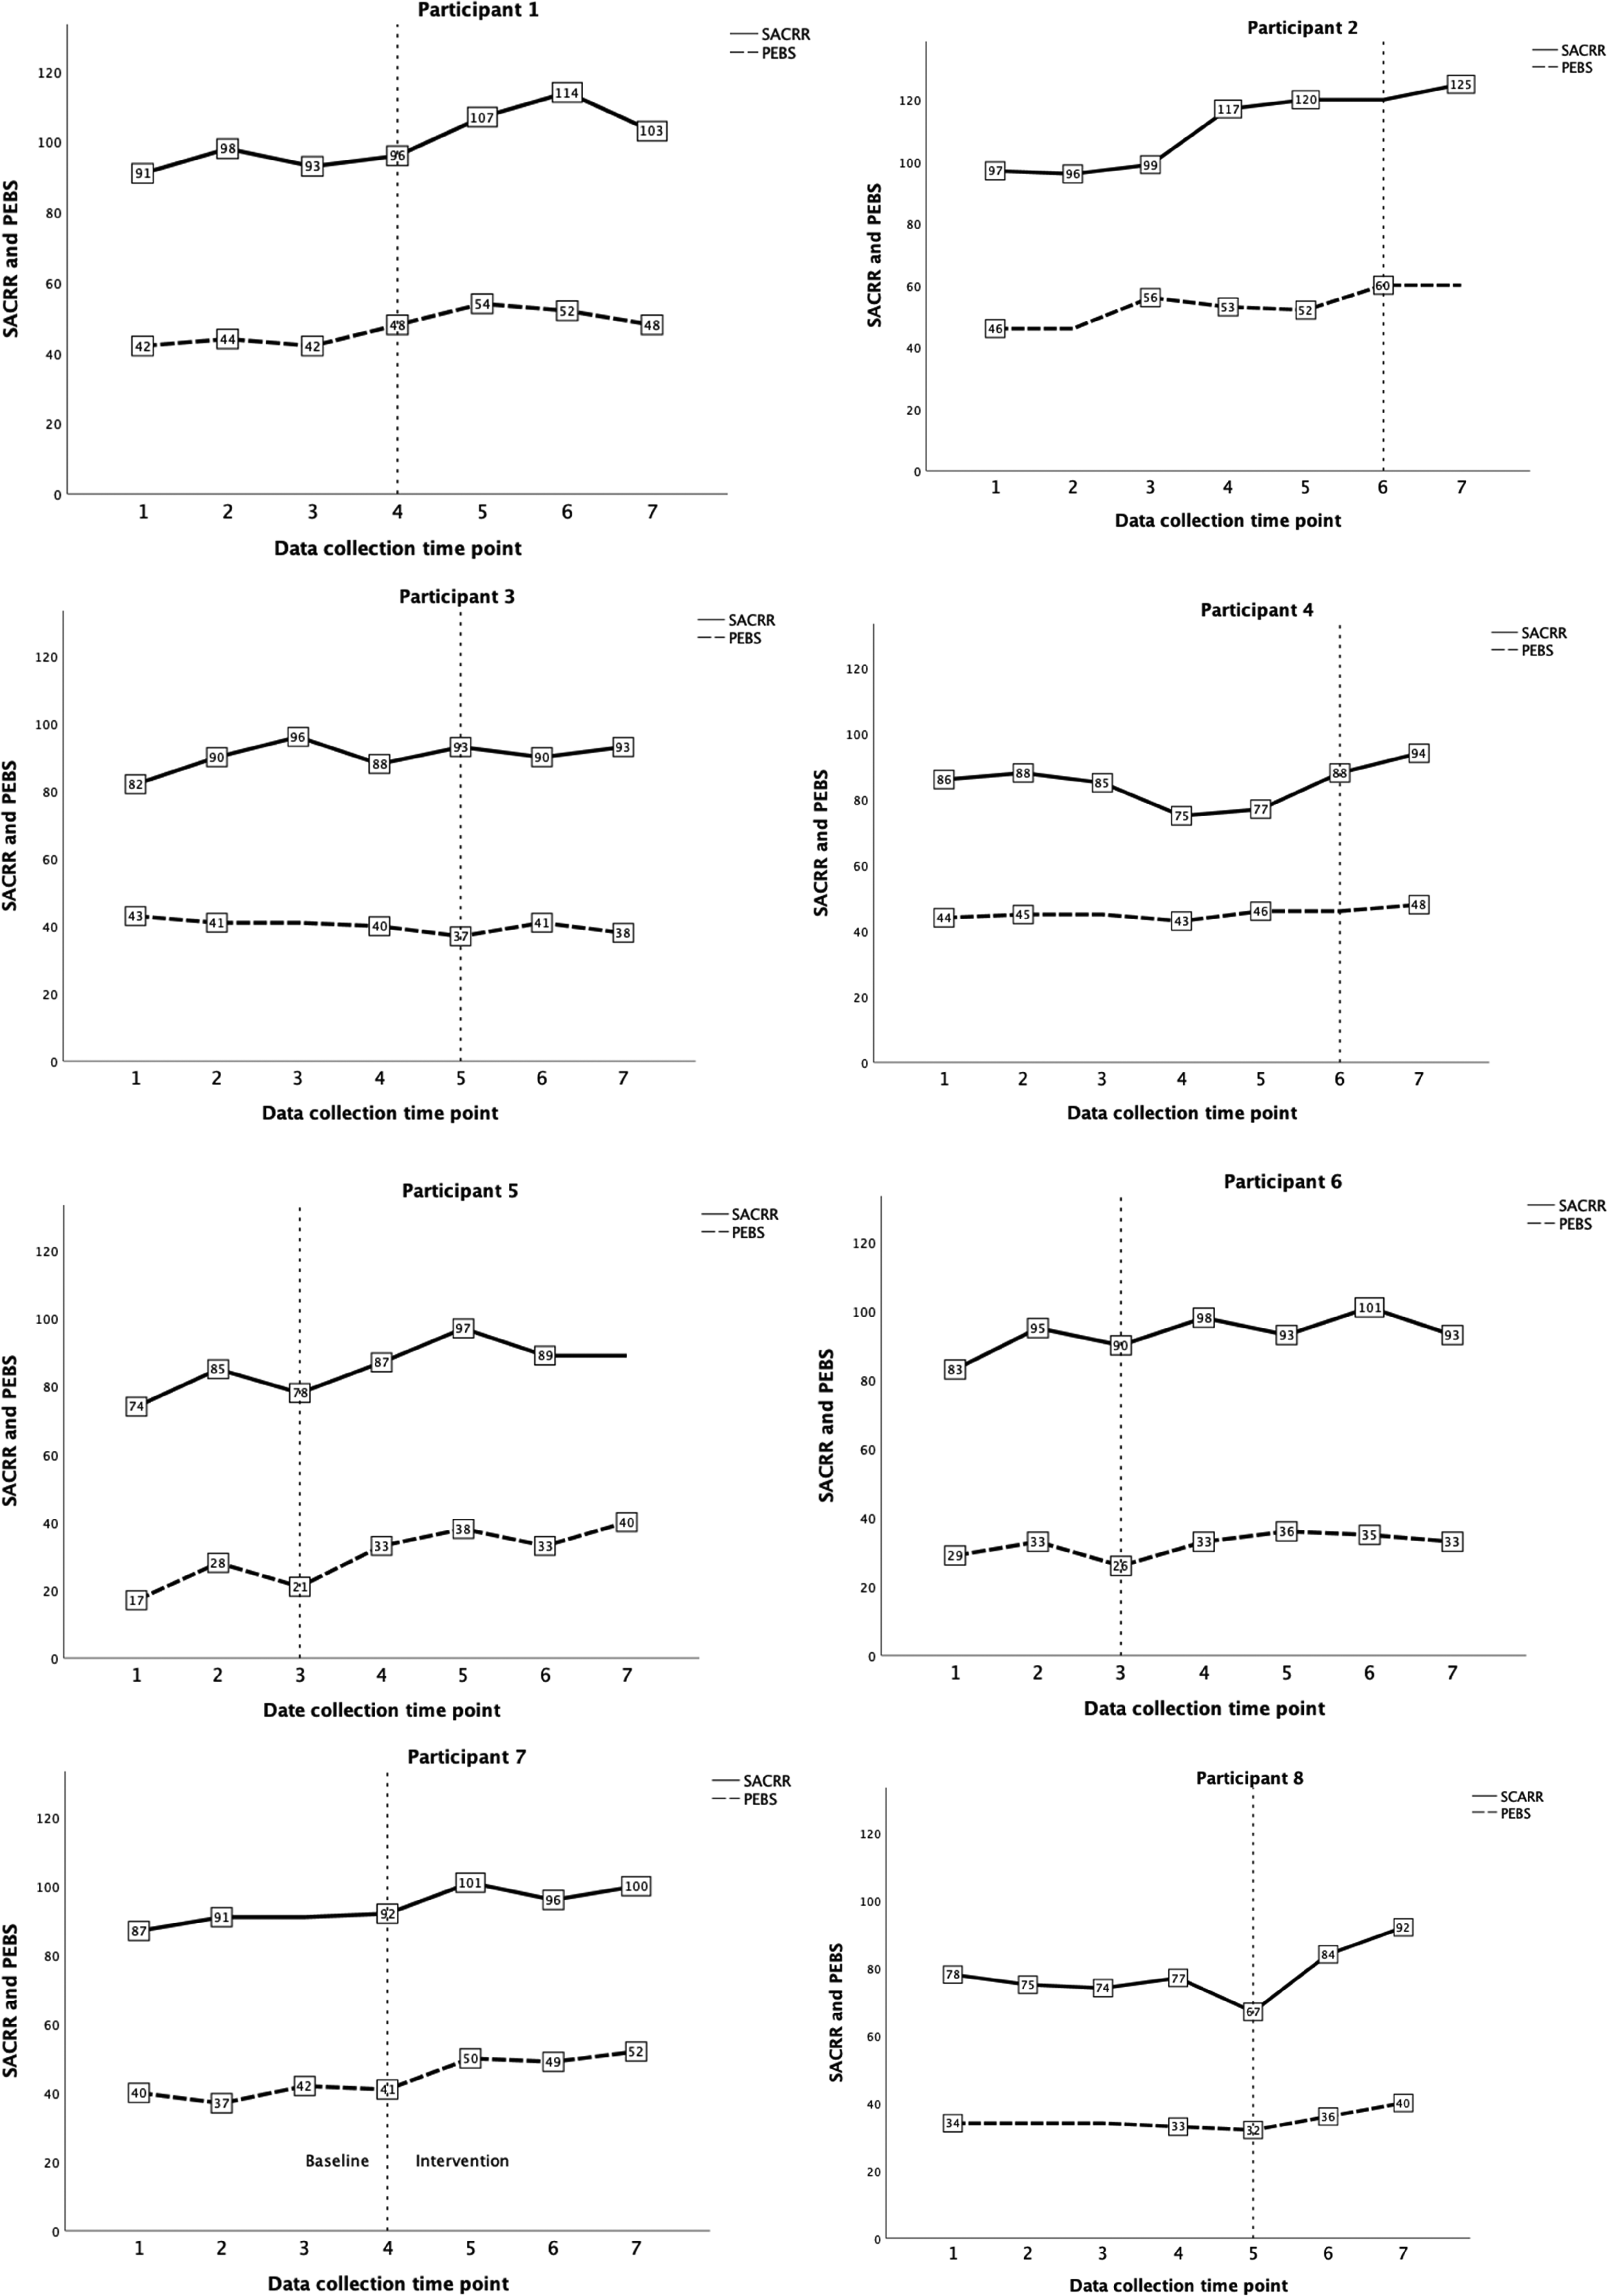
Line graphs by participant. Note. The baseline and intervention phases are separated by the vertical line, whereby the vertical line bisects the last baseline data point. All data points beyond the vertical line are within the intervention phase. Number labels are not repeated for adjacent scores. The maximum scores for SACRR and PEBS are 125 and 60, respectively. Data collection time points are measured in months.
Visual Analysis and Tau-U for SACRR and PEBS Scores Within Participants.
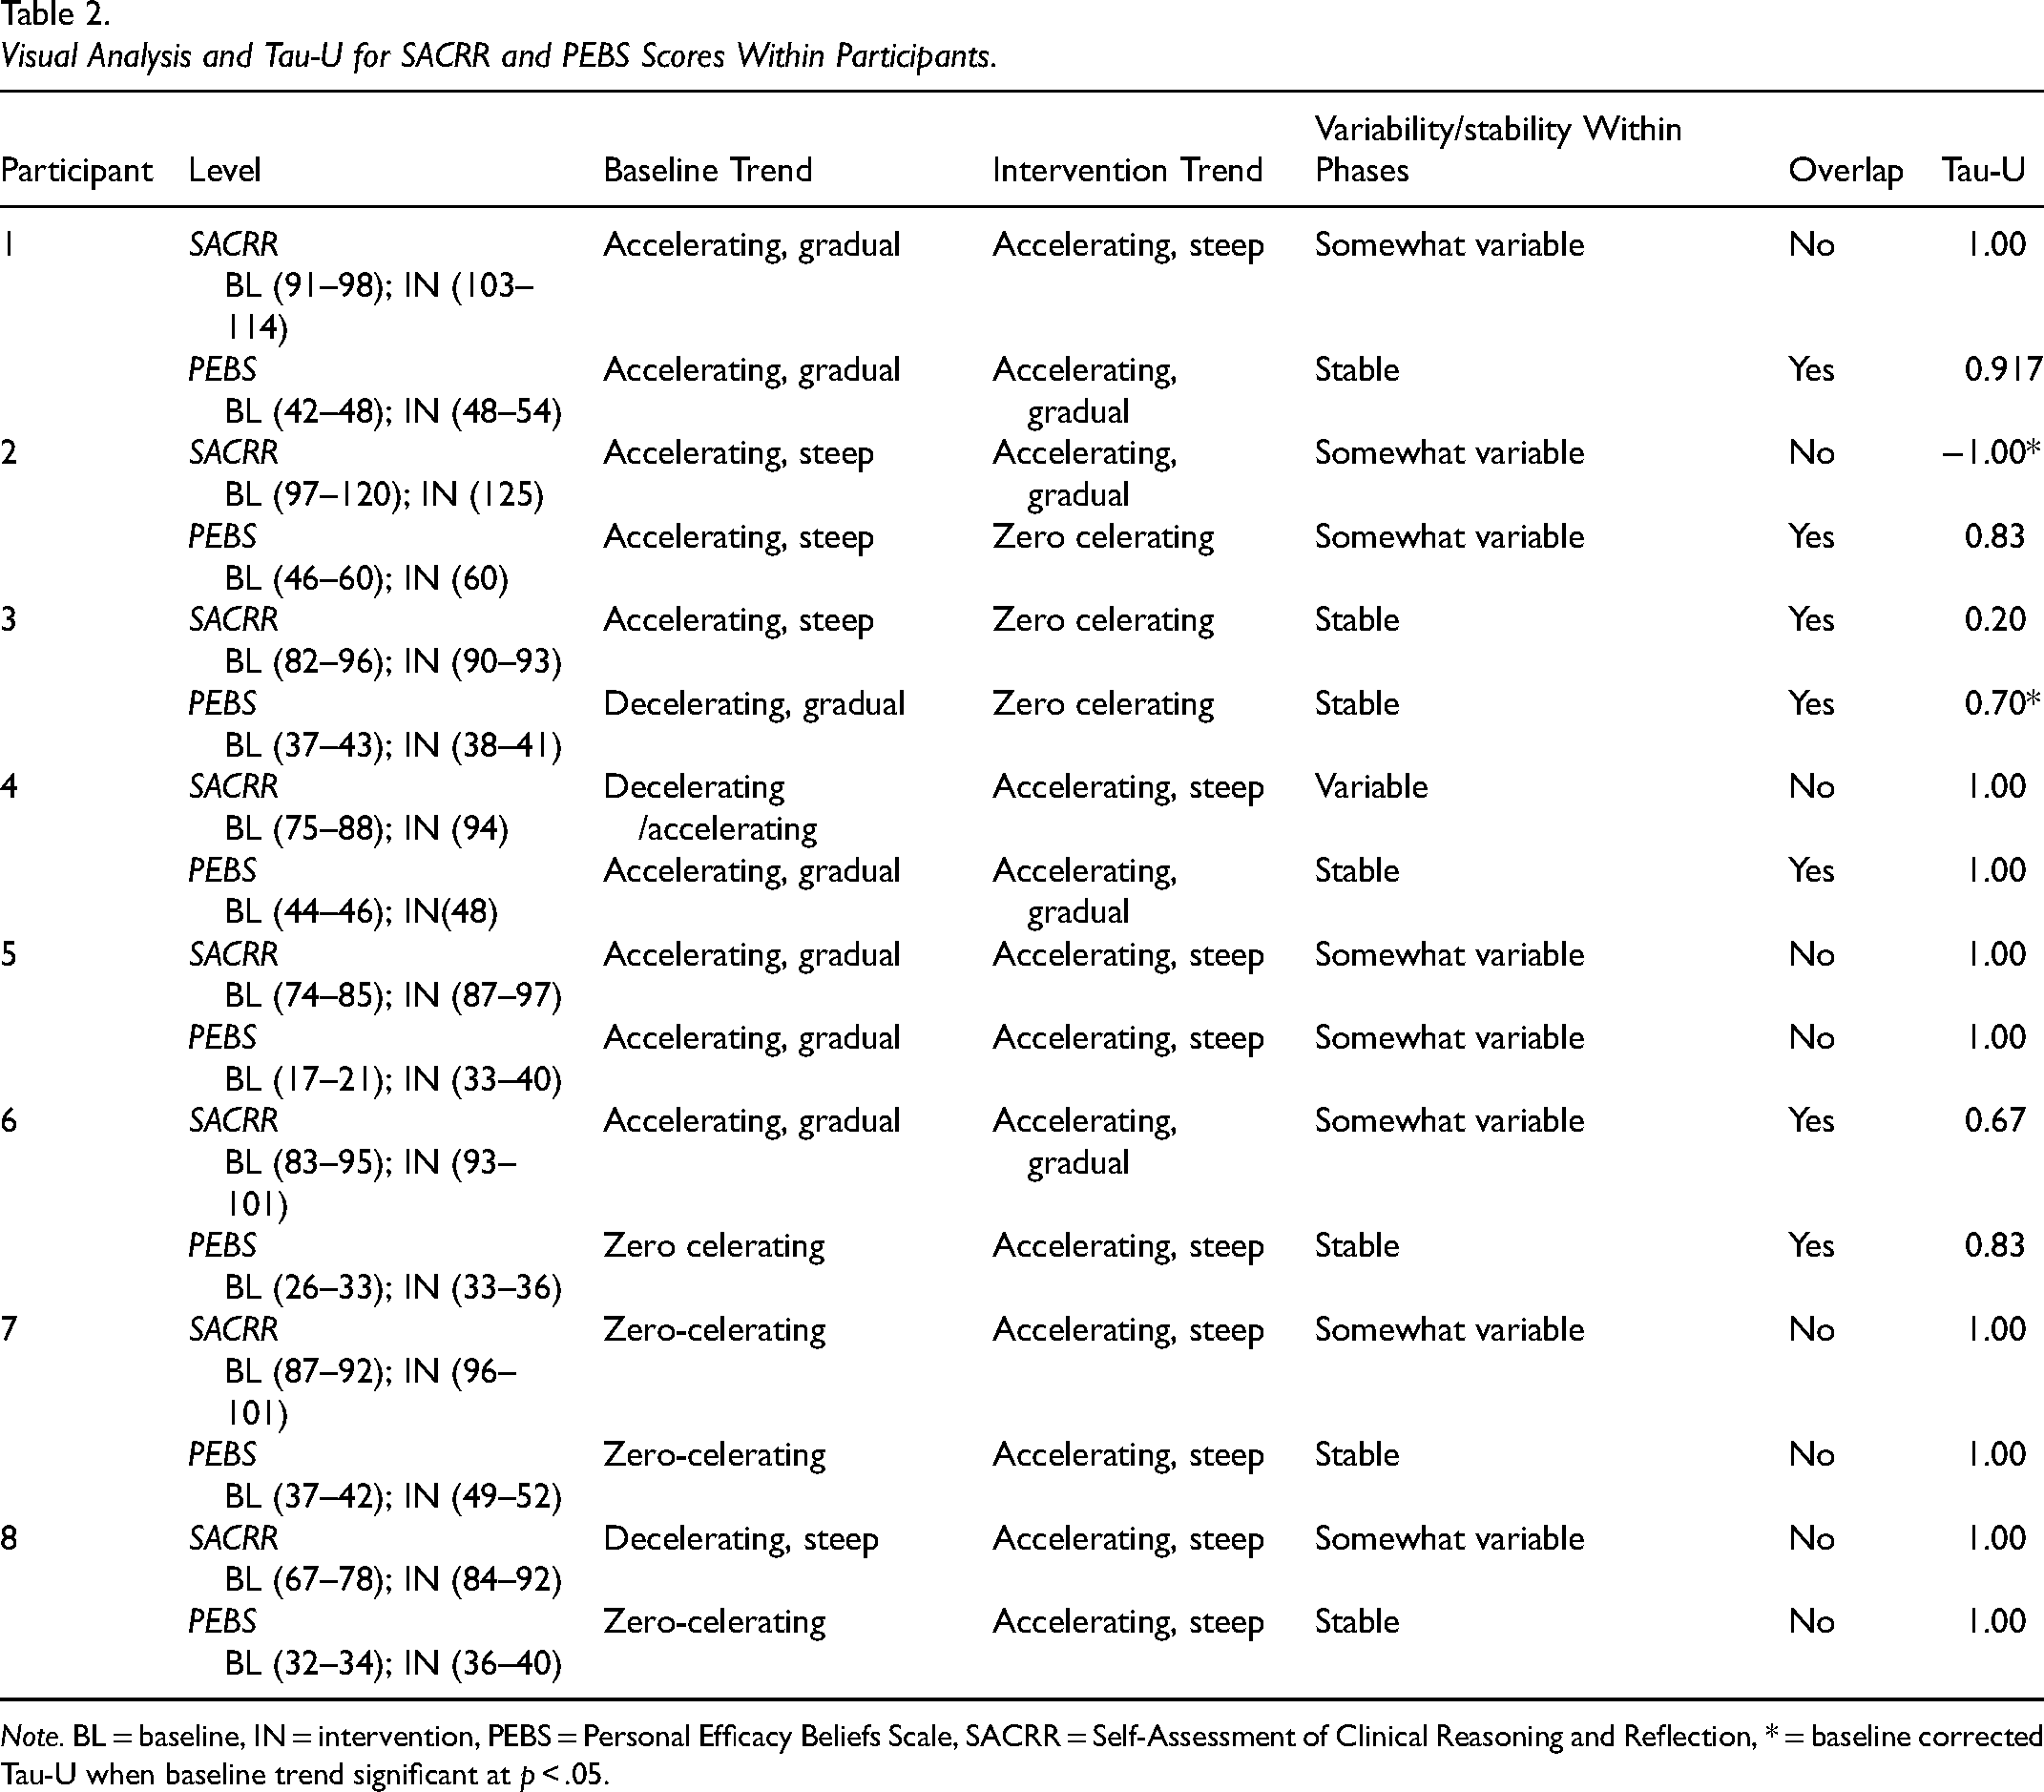
Note. BL = baseline, IN = intervention, PEBS = Personal Efficacy Beliefs Scale, SACRR = Self-Assessment of Clinical Reasoning and Reflection, * = baseline corrected Tau-U when baseline trend significant at p < .05.
For self-efficacy for addressing driving, measured by the PEBS, data was rated as “stable” for six out of eight (75%) participants. Level was particularly wide in the baseline phase (from 17 to 60 [maximum score = 60]) with less variation in the intervention phase (33–60). A steep accelerating trend was observed in four out of eight (50%) participants and a gradual accelerating trend was observed in two (25%) participants. The remaining two (25%) participants had zero celerating trends. Given data was fairly stable with mostly steep accelerating trends occurring in greater than three observations, the visual analysis provides evidence of a “large” functional relationship between the PReDAS-2 and self-efficacy.
Assessment of Baseline Trend
Baseline trend was examined for all participants to assess for threats to internal validity. Via visual analysis, accelerating trends in baseline were observed for five participants out of eight (62.5%) for clinical reasoning and four out of eight (50%) for self-efficacy. Baseline trend was also examined statistically using Tau-U, which revealed baseline trend was only statistically significant for two (25%) participants (participant 2 SACRR p = .024; participant 3 PEBS p = .026) and baseline correction was applied within Tau-U analysis as planned.
Tau-U Analysis
Within-participant Tau-U analysis for self-reported clinical reasoning and self-efficacy is presented in Table 2. For clinical reasoning, five (62.5%) participants had very large treatment effects (> 0.80), two (25%) had moderate treatment effects (0.20–0.60), and one (12.5%) had a negative treatment effect (score in negative range). The combined Tau-U score based on results from all participants for self-reported clinical reasoning is 0.70, which corresponds to a “large” overall treatment effect. For self-efficacy, seven participants (87.5%) had very large treatment effects, one (15%) had a large treatment effect, and two (25%) had moderate. For PEBS, the combined Tau-U score is 0.90, indicating a “very large” treatment effect. As best practice for multiple baseline studies is to collect at least three data points in each phase (Gast et al., 2018), a second combined Tau-U analysis was completed for the four participant's data which met this criteria (participant 1, 5, 6, and 7). The Tau-U for these participants for clinical reasoning and self-efficacy were 0.917 and 0.937, respectively, which also point to very large treatment effects of the intervention.
Discussion
Findings from a previous feasibility study demonstrated that the first version of the PReDAS was useful to support the practice of occupational therapists for addressing driving. The current study examined if the PReDAS-2 influenced the self-reported clinical reasoning and self-efficacy of occupational therapists for acute care driving practice. The findings suggest the PReDAS-2 may increase self-reported clinical reasoning among acute care occupational therapists, whereby a large overall treatment effect was observed. Self-reported self-efficacy for addressing driving also increased with use of the PReDAS-2 and demonstrated a very large treatment effect. The explicit goal of development first version of the PReDAS was to increase clinical reasoning skills of occupational therapists, and the trends in participant SACRR scores after use of the PReDAS-2 may provide support in attaining this goal. Moreover, occupational therapists have reported the desire to increase competency in addressing driving (Cammarata et al., 2017; Vander Veen et al., 2024), and improved self-efficacy may translate into increased competence. In fact, self-efficacy to complete job tasks is related to a host of positive outcomes including job satisfaction and performance (Judge & Bono, 2001). While Bandura (1997) posited that self-efficacy is context-specific, increased self-efficacy in a domain of practice that is met with such significant challenges (Korner-Bitensky et al., 2010; Sangrar et al., 2018) is likely a crucial endeavor.
Another important observation from the study was the high level of engagement from the participants. Acute care settings are among the busiest clinical settings (Britton et al., 2015; Murray et al., 2021), and yet, participants submitted 100% of the surveys, and each participant completed the intervention within the scheduling period per protocol. High engagement further demonstrates the importance of this practice area to occupational therapists and the desire to gain more expertise in this domain.
As visual and Tau-U analyses are complimentary methods, concordance between both indices increases the confidence in the findings (Fingerhut et al., 2021; Parker et al., 2011; Wolfe et al., 2019). In the present study, visual analysis interpretations and Tau-U scores were largely concordant, whereby large treatment effects were indicated by both. However, there were two occasions of discordance. Specifically, visual analysis for participant 2 showed that the highest clinical reasoning score was in the intervention phase, but the assigned Tau-U score was a negative number (−1.0) indicating a contra-intervention effect. There are likely two reasons for this discordance of Tau-U and visual analysis. First, there was only one data point collected in the intervention phase for this participant, so intervention trend cannot be fully examined. Secondly, there is evidence of significant baseline trend both in visual and Tau-U analysis (p = .024) whereby the participant increased in larger amounts in baseline (from 97 to 120), than in the intervention phase (120–125) and so the increase postintervention was a smaller magnitude. Thus, the rate of change was smaller in the postintervention phase which creates a negative Tau-U value. Of note, this participant also scored the ceiling value for clinical reasoning in the intervention phase (highest score in SACRR is 125) so even if further data points were taken, trend may still have been difficult to measure.
The other instance of discordance for visual analysis and Tau-U was observed for participant 3. Visual analysis showed a zero celerating trend postintervention, but Tau-U was 0.70, indicating a large treatment effect. Again, examination of baseline trend provides an explanation. The participant had a significant (p = .026) decelerating trend in baseline which was disrupted postintervention and data remained stable, instead of continuing to decelerate as in the baseline phase. Thus, there was a reduction in the decelerating baseline trend postintervention which created a positive Tau-U value.
Limitations
Although the findings for the PReDAS-2 intervention were positive, there are limitations to the study which must be considered. Firstly, given the evidence of accelerating trends in baseline phases (two of which were statistically significant), it is impossible to detect precisely how much treatment effect is directly attributable to the intervention, even after applying a conservative baseline correction. Potential threats to internal validity include Hawthorne effects (change in scores due to the participants’ awareness their responses will be observed by the researcher), Rosenthal effects (change in scores related to participant expectations of improvement), and maturation (change in scores over time unrelated to the intervention). Further, the data also had a moderate degree of variability which also can reduce the confidence in the treatment effect, particularly for clinical reasoning. Variability could be explained by measurement error (issues with reliability), or participant factors external to the study, such as work stress or recent positive work experiences.
Secondly, there was moderate variability in knowledge test scores taken postintervention. Despite the interventions following the same 1hr time frame and procedure, issues related to intervention fidelity are possible or the knowledge test itself was not a valid way to verify comprehension of the learning. Utilizing a checklist of key points to highlight in the manual may bolster treatment fidelity in future studies.
Another limitation is related to missing data from one item in the SACRR (“I look to theory for understanding a client's problems (related to driving) and proposed solutions to them”) which was omitted from the online survey due to a technical issue. Although data is missing, it is missing from all participants at the same rate (100%), and there is another similar item in SACRR (“I use theory to understand treatment/assessment techniques (related to driving”) that also addresses the notion of using theory which was included. Otherwise, the amount of data missing due to incomplete surveys from participants was extremely low (0.35%).
Lastly, there are two participants with a single data point postintervention. This reduces the ability to detect treatment effects in those participants. A methodological limitation to multiple baseline designs is the difficult balance between capturing enough data points to meet design standards and limiting data collection to reduce the risk of reactivity bias from the participants from repeated measurement (Gast et al., 2018; Tate, 2018). Moreover, as a concurrent multiple baseline design requires data captured at the precise same time points for all participants, additional postintervention data points only for participants with long baseline phases is not appropriate (Gast et al., 2018; Tate, 2018). Furthermore, uniformly increasing data collection points for all participants increases risk of reactivity bias due to increased measurement. Importantly, four participants’ data (1, 5, 6, and 7) met the design standards for multiple baseline designs (at least three data points per phase) (Gast et al., 2018; Tate, 2018). As such, the data from these participants is the most valuable for determining individual treatment effects, and a separate combined Tau-U analysis was also conducted for this group of participants (and results were consistent with the entire group Tau-U). However, the remaining four participants with shorter postintervention data collection, allowed longer observation of baseline trend to assess for improvement in scores not attributed to the intervention (such as maturation; Gast et al., 2018), which was statistically significant for two participants and corrected for in Tau-U calculations.
Implications and Future Directions
This study demonstrates the preliminary efficacy of the PReDAS-2 intervention to increase self-reported clinical reasoning and self-efficacy among occupational therapists for addressing driving post-stroke in busy acute care settings. The PReDAS-2 is responsive to the needs of occupational therapists and provides a resource to guide clinicians from initial conversations with clients to recommendations. Previous research has underscored the importance for specific practice resources to build capacity for fitness to drive practice (Korner-Bitensky et al., 2010; Sangrar et al., 2018; Vander Veen et al., 2024), and the present study provides evidence that such resources may increase self-reported clinical reasoning and self-efficacy.
While the present study does not provide evidence that the PReDAS-2 should be adopted by occupational therapists, it is likely appropriate for individual therapists to consider using it. As the resource is not prescriptive but rather compliments the occupational therapist's practice (Vander Veen et al., 2023), there likely is sufficient evidence for therapists to have access to the resource and use professional judgment to determine if it is appropriate to use within their practice. Given the importance for professional development in the domain of driving, and the positive findings from the present study, next steps will be to identify a platform where occupational therapists can gain access and use the resource. At the time of writing, the PReDAS-2 co-developers are investigating options for dissemination.
Further research is needed to evaluate the PReDAS-2 in a randomized controlled trial compared to routine care, and incorporating observation of performance (performance ratings with a simulated client, chart audits [Scott et al., 2024]) in conjunction with more self-report measures (including PReDAS-2 usage data in practice, frequency driving is addressed in their practice, etc.). Investigating the PReDAS-2 written materials without the one-to-one training session will also be useful to determine if the PReDAS −2 is valuable as a completely stand-alone resource. Furthermore, as the PReDAS was initially designed to be updated by emerging evidence, the screening section must also be updated to reflect current best evidence for driver screening, as identified in a systematic review conducted concurrently with the present study (Vander Veen et al., 2025). As the PReDAS-2 is designed specifically for acute care practice, development of resources applicable to later in the care continuum is another area for further development and research.
Key Messages
The PReDAS-2 may support increased self-reported clinical reasoning and self-efficacy for addressing driving after stroke among acute care occupational therapists.
The present study provides preliminary support for making the PReDAS-2 available to occupational therapists to consider using it to supplement their clinical practice to address driving after stroke.
Further research is warranted to determine if the PReDAS-2 should be recommended for use in acute care settings.
Supplemental Material
sj-docx-1-cjo-10.1177_00084174261424561 - Supplemental material for Evaluating the Practice Resource for Driving After Stroke-2: A Multiple-Baseline Study
Supplemental material, sj-docx-1-cjo-10.1177_00084174261424561 for Evaluating the Practice Resource for Driving After Stroke-2: A Multiple-Baseline Study by April Vander Veen, Jeffrey Holmes, Patricia Tucker and Liliana Alvarez in Canadian Journal of Occupational Therapy
Supplemental Material
sj-docx-2-cjo-10.1177_00084174261424561 - Supplemental material for Evaluating the Practice Resource for Driving After Stroke-2: A Multiple-Baseline Study
Supplemental material, sj-docx-2-cjo-10.1177_00084174261424561 for Evaluating the Practice Resource for Driving After Stroke-2: A Multiple-Baseline Study by April Vander Veen, Jeffrey Holmes, Patricia Tucker and Liliana Alvarez in Canadian Journal of Occupational Therapy
Supplemental Material
sj-docx-3-cjo-10.1177_00084174261424561 - Supplemental material for Evaluating the Practice Resource for Driving After Stroke-2: A Multiple-Baseline Study
Supplemental material, sj-docx-3-cjo-10.1177_00084174261424561 for Evaluating the Practice Resource for Driving After Stroke-2: A Multiple-Baseline Study by April Vander Veen, Jeffrey Holmes, Patricia Tucker and Liliana Alvarez in Canadian Journal of Occupational Therapy
Footnotes
Acknowledgment
The authors wish to acknowledge the contributions of Sarah Renner, OT Reg. (Ont.), as a co-developer of the first version of the PReDAS and for her feedback and review of the current version of the PReDAS-2.
Author Contributions
AVV co-designed the study with LA, completed the recruitment, conducted the intervention, completed data collection and analysis, and was responsible for manuscript preparation. LA provided supervision of the research, theoretical and methodological guidance, intellectual and editorial support in developing the study and preparing the manuscript for publication. PT and JH provided valuable input for study design and manuscript revision to prepare for publication.
Declaration of Conflicting Interests
The authors declared no potential conflicts of interest with respect to the research, authorship, and/or publication of this article.
Ethical Statement
Western University's Health Science Research Ethics Board (Project ID: 124200).
Funding
The authors received no financial support for the research, authorship, and/or publication of this article.
Supplemental Material
Supplemental material for this article is available online.
Author Biographies
References
Supplementary Material
Please find the following supplemental material available below.
For Open Access articles published under a Creative Commons License, all supplemental material carries the same license as the article it is associated with.
For non-Open Access articles published, all supplemental material carries a non-exclusive license, and permission requests for re-use of supplemental material or any part of supplemental material shall be sent directly to the copyright owner as specified in the copyright notice associated with the article.