
Abstract
Chambers and Dunstan proposed a model-based predictor of the population distribution function that makes use of auxiliary population information under a general sampling design. Subsequently, Rao, Kovar, and Mantel proposed design-based ratio and difference predictors of the population distribution function that also use this auxiliary information. Both predictors (CD and RKM) assume a single level model for the target population. In this article we develop predictors of the finite population distribution function for a population that follows a multilevel model. These new predictors use the same smearing approach underpinning the CD predictor. We compare our new predictors with the CD and RKM predictors via design-based simulation, and show that they perform better than these single level predictors when there is significant intra-cluster correlation. The performances of these new two level predictors are also examined via an empirical study based on data from a large-scale UK business survey aimed at estimating the distribution of hourly pay rates.
Background
Chambers and Dunstan[4] show that traditional survey methods used to estimate the extreme finite population quantiles of a response variable
We note that our framework also allows us to calculate small-area estimates for quantities that can be defined in terms of functionals of alternative smearing-type estimators of the small-area finite population distribution function, for example using the outlier-resistant finite population distribution function prediction approach developed in Tzavidis et al.[10]
In what follows we use simulation and an empirical study to compare the performance of our proposal with various potential predictors, including CD and RKM, under the two level super-population model.
Let
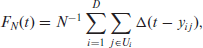
where
where
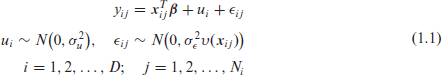
Model-based Approach
The distribution function

where

where

where

One needs to know the variance components

and

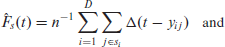
where
The predictors

where

Clearly empirical versions of these unconditional CD-type predictors are easily written down once we have estimates of the variance components
Predictors like (2.4) and (2.5) can be computationally extensive for realistic large-scale application like poverty mapping because all the sample residuals are used in the smearing method. In order to speed up calculation in this situation, Marchetti et al.[8] propose an alternative approach to implementing smearing based on Monte Carlo (MC) simulation. Following this approach, a Monte-Carlo approximation to the value of the non-sample part of

where the
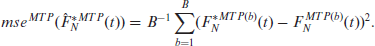
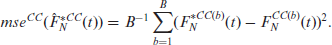
We propose two different bootstrap methods for estimating the mean squared error (MSE) of the EGSA/ELSA predictors. They are based on the non-parametric bootstrap developed by Marchetti et al.[8] and the two level block-bootstrap procedure developed by Chambers and Chandra.[1] We refer to the non-parametric bootstrap procedure of Marchetti et al.[8] as MTP, while the block bootstrap procedure of Chambers and Chandra[1] is referred to as CC. The steps of the MTP bootstrap procedure are as follows:
The CC-based MSE estimation method follows the same steps except for generation of the bootstrap population. Under this approach, the bootstrap population is generated as follows:
The CC bootstrap procedure then replicates steps 2–5 of the MTP procedure, leading to the CC bootstrap estimator of the MSE of
Numerical Evaluations
This section uses design-based simulation to illustrate the performances of the EGSA and ELSA smearing predictors of the finite population distribution function (2.1). These predictors are compared with their marginal versions MGSA (2.6) and MLSA (2.7) as well as with the single level predictors proposed in Chambers and Dunstan[4] and Rao et al.,[9] and with the unweighted (Dir) and the sample weighted (WDir) direct estimators given in Chambers and Clark[3]. In the two level CD-type estimators EGSA and ELSA
The simulation is based on a population of 338 sugar cane farms corresponding to a sample of these farms obtained in a 1982 survey of the Queensland sugar cane industry, for detail see in Chambers and Dunstan[4]. The unplanned domains in this case are the four cane-growing regions of Queensland, with three response variables used for the simulation: (a) total cane harvested; (b) gross value of cane; (c) total farm expenditure. The auxiliary variable
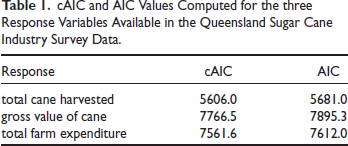
cAIC and AIC Values Computed for the three Response Variables Available in the Queensland Sugar Cane Industry Survey Data.
cAIC and AIC Values Computed for the three Response Variables Available in the Queensland Sugar Cane Industry Survey Data.
For each response variable, 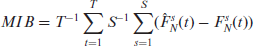
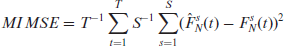
where
Simulation Values of MIB, MIAE and MIMSE for the Direct (Dir) and Sample Weighted Direct (WDir) Estimators, the Single Level Model-based Predictors CD and CD1, the Single Level Model-assisted Estimator RKM, and the Two Level Model-based Predictors MGSA & MLSA (Marginal CD Using Shrunken Random Effects), UGSA & ULSA (Conditional CD Using Unshrunken Random Effects) and EGSA & ELSA (Conditional CD Using Shrunken Random Effects) Under (i) Simple Random Sampling, (ii) Stratified Random Sampling with
Strata and Proportional Allocation, and (iii) Stratified Random Sampling with
Strata and Optimal Allocation. The Best Performances for Each Method of Sampling, Variable of Interest, and Performance Measure are Highlighted in Bold.
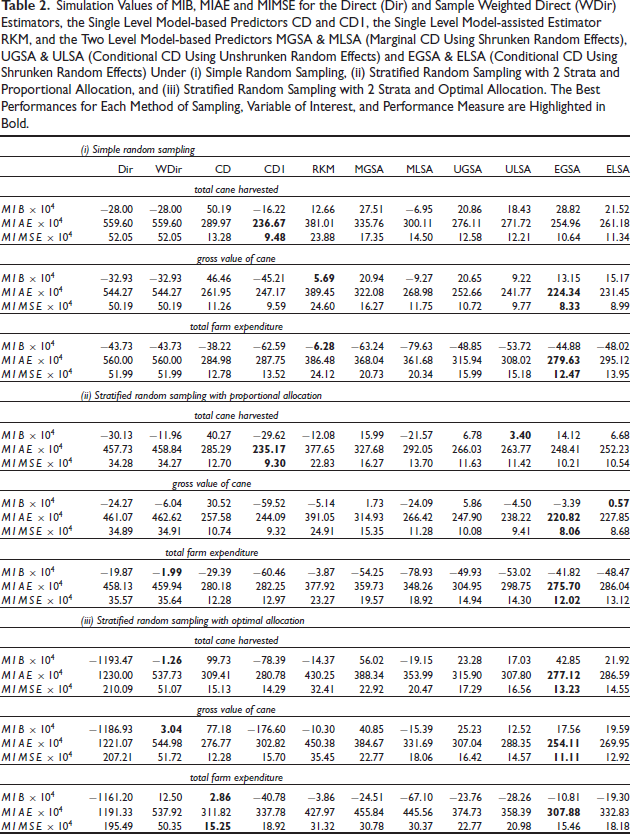
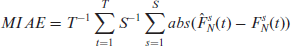
The simulation performances of the different distribution function predictors for the response variables total cane harvested, gross value of cane and total farm expenditure are set out in Table 2 for simple random sampling and stratified sampling with proportional allocation and optimal allocation respectively. These results show a mixed picture for the MIB measure, with design-based methods (WDir and RKM) performing best in 5 scenarios and model-based methods (MLSA, ULSA, ELSA and CD) performing best in the remaining 4 scenarios. However, this changes when we consider performances with respect to the MIAE and MIMSE measures. Here it is clear that the EGSA predictor performs best overall. In particular, it is outright best in 6 scenarios, second best after CD1 in two scenarios and equal best with CD in the remaining scenario. Although this seems a surprising result at first, given that CD1 is based on fixed region effects while EGSA is based on random region effects, it can be explained by noting that CD1 assumes homoskedasticity in model errors while EGSA allows for heteroskedasticity in level one errors. The importance of allowing for heteroskedasticity in model specification when predicting the value of a finite population distribution function also explains why CD and CD1 perform similarly, even though the the latter allows for average regional differences. It also emphasizes the fact that although the cAIC values generated by a two level model with heteroskedasticity and AIC values generated by a homoskedastic single level model with region as factor seem close (see Table 1), the CD1 predictor based on the latter model can perform worse than conditionally specified predictors like EGSA and ELSA based on the former model that also allow for heteroskedasticity.
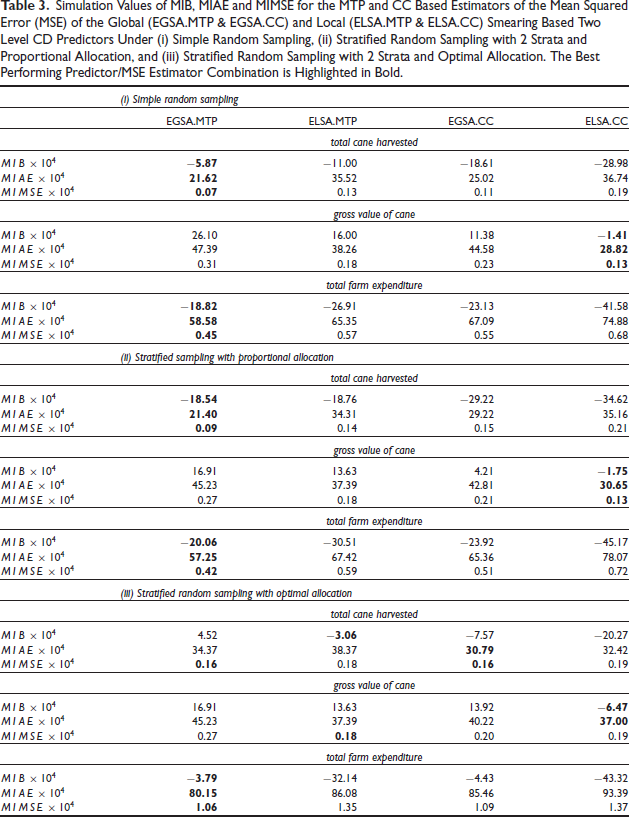
The simulation performances of the MTP and CC based MSE estimators of the EGSA and ELSA predictors are set out in Table 3. Interestingly, for both simple random sampling and for stratified sampling with proportional allocation, the variations in performance shown here depend on the variable of interest, rather than the performance measure used, or the predictor whose MSE is being estimated. In particular, for the variables total cane harvested and total farm expenditure the MTP method outperforms the CC method for both EGSA and ELSA, while the reverse holds for gross value of cane, where the CC method outperforms the MTP method for EGSA and ELSA. For stratified random sampling with optimal allocation, there does not appear to be any particular trend in these results. The MTP method works well for EGSA with total farm expenditure, while the CC works well with ELSA for gross value of cane. There appears to be little to choose between the two methods of MSE estimation for the variable total cane harvested.
Simulation Values of MIB, MIAE and MIMSE for the MTP and CC Based Estimators of the Mean Squared Error (MSE) of the Global (EGSA.MTP & EGSA.CC) and Local (ELSA.MTP & ELSA.CC) Smearing Based Two Level CD Predictors Under (i) Simple Random Sampling, (ii) Stratified Random Sampling with
Strata and Proportional Allocation, and (iii) Stratified Random Sampling with
Strata and Optimal Allocation. The Best Performing Predictor/MSE Estimator Combination is Highlighted in Bold.
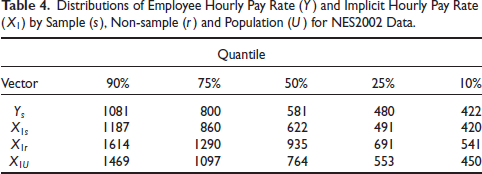
In this section we use data from the 2002 UK New Earnings Survey (NES2002) in an empirical study of the distribution of hourly pay rates (in pence units). Among
Linear models, with and without domain random effects, were fitted to
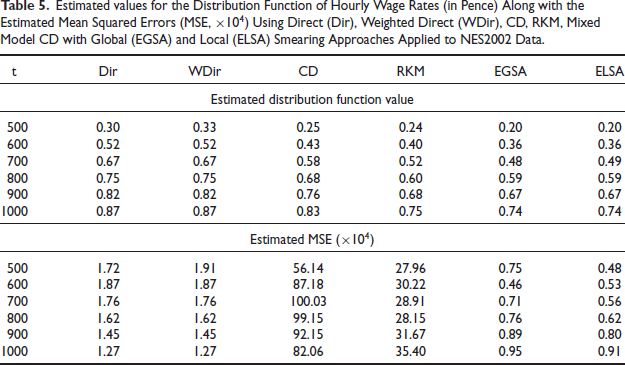
Table 5 shows that the estimates obtained using the unweighted (Dir) and weighted (WDir) direct estimators are higher than those obtained using the other methods. This was expected given that the quantiles of
Distributions of Employee Hourly Pay Rate
and Implicit Hourly Pay Rate
by Sample
, Non-sample
and Population
for NES2002 Data.
Distributions of Employee Hourly Pay Rate
and Implicit Hourly Pay Rate
by Sample
, Non-sample
and Population
for NES2002 Data.
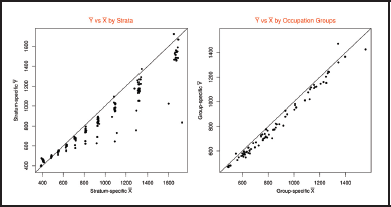
Stratum and Occupation (group) Specific Mean Hourly Pay Rate
and Implicit Hourly Pay Rate
for NES2002 Data.
Estimated values for the Distribution Function of Hourly Wage Rates (in Pence) Along with the Estimated Mean Squared Errors (MSE,
) Using Direct (Dir), Weighted Direct (WDir), CD, RKM, Mixed Model CD with Global (EGSA) and Local (ELSA) Smearing Approaches Applied to NES2002 Data.
In this article we extend the Chambers and Dunstan[4] approach to prediction of a finite population distribution function given two level clustered population data. Our simulation results and our empirical study provide evidence that two level smearing-based extensions of this approach (EGSA and ELSA) perform well when the population data exhibit significant intra-cluster correlation. We also develop two bootstrap methods for estimating the MSE of the predictors that we propose. These clearly show that ignoring intra-cluster correlation (a feature of single level predictors like CD and RKM) can lead to serious error when predicting the value of the population distribution function. The conditional two level smearing predictors EGSA and ELSA that we develop outperform their unconditional alternatives MGSA and MLSA as well as conditional versions based on unshrunken random effects (UGSA and ULSA). Some important advantages of the two level prediction methods that we propose in this article are that they can be easily extended to prediction of small area distribution functions and associated functionals (e.g., small area poverty indicators) and can also be easily extended to outlier robust inference following the approach described in Welsh and Ronchetti.[12] In further research, we aim to develop analytical MSE estimators of the the EGSA and ELSA predictors in order to further evaluate the performances of the bootstrap-based MSE estimators introduced in this article. We also note that non-parametric versions of the EGSA and ELSA predictors can be developed following Chambers et al.,[5] and also Kuk and Welsh.[7]
Footnotes
Acknowledgement
We would like to acknowledge the contribution of the National Institute for Applied Statistics Research Australia, University of Wollongong, in providing access to its high performance computing facility. The work of Salvati was supported by the program Progetto di Ricerca di Ateneo: From survey-based to register-based statistics: a paradigm shift using latent variable models (grant PRA2018-9).
Declaration of Conflicting Interests
The authors declared no potential conflicts of interest with respect to the research, authorship and/or publication of this article.
Funding
The authors received no financial support for the research, authorship and/or publication of this article.