
Abstract
The Martin and Pratt Nonword Reading Test (‘Martin & Pratt’) is an Australian-normed assessment of nonword reading accuracy. The current study was conducted to examine whether this test still validly and accurately estimates the decoding skills of primary school-aged children, despite its norms having been collected in 1996. To address these questions, reading assessment data were collected from 176 Australian students (3 independent schools) from Years 1 through 6. Strong correlations between the Martin & Pratt and similar measures were observed, although the standard scores generated were consistently higher than other tests. This pattern of results indicated that the test is valid but overestimates nonword reading ability.
Keywords
Introduction
Instruments for assessing literacy skills within a school-aged population are important because they reveal information about students’ skills that can then be acted upon by a teacher or literacy specialist. In an educational context, norm-referenced assessments are commonly used to compare a student’s performance with that of a reference group comprising students in the same year level or of the same age (American Education Research Association [AERA], 2014). These assessments have a number of specific applications. Firstly, they can help in identifying students with difficulties who may benefit from targeted support. Alongside other methods, norm-referenced assessments are also used in diagnostic settings by speech-language pathologists and psychologists. Finally, as well as having direct implications for students’ learning, norm-referenced assessments are commonly used in research settings, one reason being that they are not tailor-made to an intervention and can therefore indicate how well skills have generalised to unfamiliar contexts (cf. What Works Clearinghouse, 2020; cf. Clemens & Fuchs, 2022).
When selecting a norm-referenced assessment, as well as attending to the test’s obvious non-psychometric qualities, such as cost, duration, required qualifications and ease of administration and scoring, the user is faced with the question of: how similar is the student to the test’s normative sample? If the norms are based on a sample that is too dissimilar, an interpretation on their basis must be made cautiously. Ultimately, a test’s norms are only useful insofar as they reasonably represent the expected skills or behaviours of the student being assessed.
Recency of normative data
One factor affecting test representativeness is the recency of normative data collection. Educational test norms may be outdated if, in the years since data collection, the skills of school students have changed at a population level. For example, there is evidence that the average reading proficiency levels of Australian primary school students have improved (albeit slightly) in recent decades, according to the results from national assessments of literacy (Australian Curriculum, Assessment and Reporting Authority [ACARA], 2021). The same has been observed in Australian Year 4 students assessed as part of Progress in International Reading Study (PIRLS) testing (Hillman et al., 2023). Such changes to the average educational outcomes achieved by an entire population may have been brought about by educational policy and curricular reforms or advancements in initial teacher education.
With specific respect to Australian literacy outcomes, instruction in this domain may have evolved in the last thirty years, such that early years’ teachers have been moved towards including word-level phonics content in their lessons, rather than relying on methods embedded in Whole Language. Primarily, this shift has been prompted by evidence that direct phonics instruction represents foundational knowledge for literacy acquisition (e.g. Rowe, 2005). Even now, concerns about Australian students’ reading proficiency levels remain (e.g. Hunter et al., 2024). Nevertheless, over the last decade in particular, the emphasis on phonics instruction does appear to have increased, with several Australian state governments having either mandated or endorsed the use of a Phonics Screening Check in Year 1 classrooms since 2018 (e.g. South Australia Department for Education, 2024). Version 9 of the Australian Curriculum, which was released in 2022 and serves as a reference point for teachers across the country, also provides more explicit guidelines than in previous versions around developing beginning readers’ decoding skills and enabling them to apply those skills to decodable texts (ACARA, 2024; e.g. ‘Phonic and Word Knowledge’ content descriptions). Again, these more recent changes indicate there has been a gradual shift in teaching practices related to literacy. Assuming these practices translate to students’ actual skills, such a shift may have altered what constitutes ‘average’, according to results from normative assessments of reading.
Other factors to consider when evaluating norm-referenced assessments
The complexities associated with geographic location may also influence the similarity between a test examinee and the test norms. Developers of norm-referenced assessments often stratify their normative sample based on factors such as age, gender, race or ethnicity, language background, socioeconomic status, region and parental education (Cicchetti, 1994). The aim of stratification is to intentionally reproduce certain demographic characteristics of a population within the normative sample, so that the sample can be considered representative. While it is common practice in Australia and New Zealand to administer assessments that have been normed in other English-speaking countries, the demographic characteristics of the students sampled in those countries will differ, whether by chance or through systematic stratification. This, in addition to disparate curricular requirements, school semester structures, and – particularly relevant for nonword reading assessments – acceptable pronunciations of test items, make the use of internationally normed assessments an imperfect solution to the problem of not having locally normed assessments.
Aside from evaluating the composition of a test’s normative sample, users should also attend to the instrument’s other psychometric qualities (see e.g. De Los Reyes & Langer, 2018 for rubric). Reliability and validity are often examined as part of the standardisation process for test norming, although they are by no means limited to only characterising norm-referenced assessments. Reliability is the consistency with which a test captures an examinee’s performance across instances of a testing procedure (AERA et al., 2014). Validity refers to the instrument’s capacity to capture the skills it is being administered to capture (AERA et al., 2014). Specifically, criterion validity is reflected by the strength of the instrument’s association with another independent and gold-standard measure of the same underlying skill, as assessed either at the same time as the test under investigation (concurrent validity) or afterwards (predictive validity) (Sartori & Pasini, 2007). These qualities indicate to the test user how much confidence to have in the results generated from the assessments they are administering.
Assessing nonword reading accuracy
Some tests of nonword reading proficiency assess solely the accuracy of a reader’s response, while others assess fluency – that is, both accuracy and speed of reading. Although nonword reading accuracy and fluency measures tend to correlate highly with one another, they provide slightly different information. Fluency measures are quick to administer because readers are scored on the number of correct items pronounced aloud in a set period of time – usually 60 seconds. As such, they are quick and easy to administer, and may be useful for screening whole cohorts of students and monitoring the progress of those receiving intervention. They also draw on aspects of cognitive-linguistic functioning not altogether covered by accuracy measures, such as the degree of familiarity a reader has with the presented letter sequences. In other words, readers can be slow and accurate or fast and accurate, and only fluency measures capture this difference. In contrast, accuracy measures allow the examiner to control the pace of administration, thereby giving them time to mark specific error patterns, as well as giving the reader time to piece together the grapheme-phoneme constituents of an item and experiment with blending them together. The untimed test format also typically gives the reader more opportunities to demonstrate their knowledge, providing the examiner with an in-depth view on which particular letter sequences are still being acquired and whether errors appear to stem from, for example, lack of knowledge or difficulty blending.
Two nonword reading accuracy assessments with Australian norms are the Castles and Coltheart 2 ([CC2]; Castles et al., 2009), and the Wechsler Individual Achievement Test, third ed. Australia and New Zealand ([WIAT-III A&NZ]; Wechsler, 2016). The CC2’s normative data were collected more than a decade ago in 2008, and the sample itself represents an approximation of the wider population, having not been stratified. The WIAT-III A&NZ normative data were collected more recently in 2015 and 2016. However, administration requires formal qualifications or the completion of an accreditation course (Pearson, n. d.). This, in addition to the fact that accessing the Pseudoword Decoding subtest necessitates purchasing the entire test battery, may limit its usefulness for classroom teachers. Another, perhaps lesser-known, test is the Martin and Pratt Nonword Reading Test (hereafter the ‘Martin & Pratt’; Martin & Pratt, 2001). Standardisation of the Martin & Pratt took place in 1996 and the normative data were stratified to match the wider population of Southern Tasmania, rather than the whole of Australia. Hence, each of these assessment instruments may be considered imperfect, though still potentially useful.
All measures of nonword reading proficiency are designed with the intention of capturing a reader’s knowledge of how phonemes (and sometimes morphemes) are represented in print. Because nonwords (elsewhere referred to as ‘pseudowords’ or ‘nonsense words’) do not exist in the English orthography and are typically presented as isolated items, a reader cannot draw on any syntactic, semantic or sight word knowledge to recognise them. Thus, they provide a ‘pure’ means of evaluating the reader’s ability to decode unfamiliar items (Castles et al., 2018). This is important because difficulty with nonword reading often indicates the presence of written language processing deficits more broadly (Share, 2021; Snowling, 2001). By the same token, a reader who is readily able to decode newly encountered words is hypothesised to acquire orthographic representations from exposure to print via a self-teaching mechanism (Li & Wang, 2023; Share, 1995). In turn, word recognition skills contribute significantly to reading comprehension (García & Cain, 2014; Hoover & Gough, 1990; Tunmer & Hoover, 2019).
Current study
The current study was conducted to examine whether one particular nonword reading accuracy measure – the Martin & Pratt – could be used with confidence to assess the decoding skills of primary school-aged children. Because the original normative data for this test were collected in 1996, we were particularly interested in whether students assessed more recently demonstrate improved phonics skills, thereby rendering the test norms out-of-date.
Specifically, the research questions under investigation in this study were: (1) How strong is the concurrent criterion validity of the Martin & Pratt, as indicated by its correlations with other similar measures of nonword reading accuracy? (2) How well do Martin & Pratt standardised scores estimate primary school-aged students’ nonword reading accuracy, compared with other similar measures of nonword reading accuracy?
The Martin & Pratt was selected as the primary instrument for examination in this study because it has Australian norms, is easy to administer as a standalone test, and has shown evidence – according to the authors’ experiences of using it in clinical and trial settings – of overestimating students’ decoding skills. It was hypothesised that the test instrument would still show strong criterion validity, as evidenced by its high correlations with other similar measures, but that the standardised scores generated from its norms would be higher than those generated from other similar measures.
Method
Ethics statement
Ethics approval was obtained from the Human Research Ethics Committee at Macquarie University (Reference no. 52020608014091). Written consent was obtained from participants’ parents and the principals of schools where testing took place.
Participants
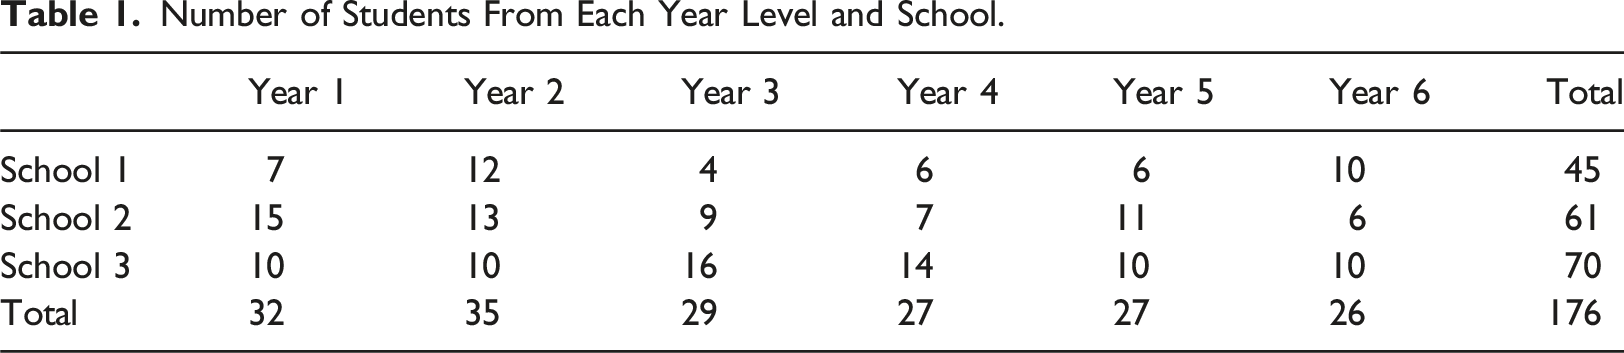
Number of Students From Each Year Level and School.
Recruitment process
For practical purposes, schools were only approached for participation in the study if they were in reasonable proximity to Brisbane, Australia. It was originally hoped that government schools could participate, but approval was not granted. Hence, a shortlist was developed containing only those independent schools in greater Brisbane that met the following criteria: • An approximately equivalent number of male and female students • An Index of Community Socio-educational Advantage (ICSEA) score of 900–1100 • A percentage of students with a language background other than English below 50% • NAPLAN Year 3 and/or 5 Reading scores that were ‘close to’ the Australian average (according to ACARA) in 2018 and/or 2019
Information pertaining to these criteria was collected at the beginning of 2021 from ACARA’s publicly available MySchool website. For context, NAPLAN scores that are ‘close to’ the Australian average are defined as those where the effect size (Hedge’s g) representing the difference from the Australian average lies between −0.2 and 0.2 (ACARA, 2022). The criteria were developed with the intention of recruiting approximately average-performing children into the study, relative to the wider population of primary school-aged students in Australia. By doing this, we hoped to avoid skewed data distributions (e.g., floor or ceiling effects) complicating our interpretations of results from test instrument comparisons and correlational analyses. Applying the inclusion criteria proved successful insofar as NAPLAN results for the three schools during the year of data collection were approximately average. Specifically, and according to MySchool information released after the data collection period, 2021 Year 3 NAPLAN Reading scores were ‘close to’ the Australian average at all three participating schools. 2021 Year 5 NAPLAN Reading scores at two of the three schools were ‘close to’ the Australian average, with the other school producing scores ‘above’ the Australian average (i.e. Hedge’s g representing difference from the Australian average = 0.2–0.5; ACARA, 2022).
At each of the three schools, parental consent forms were disseminated to all students in Years 1 through 6. Schools were informed of the research team’s intention to assess 10 students per year level. Where 10 or fewer consent forms were returned, all students were assessed. Where more than 10 consent forms were returned, the 10 participating students were selected at random by the research team. If there was spare time in the testing schedule and if the school was willing, additional students (again, selected at random) were assessed to bolster numbers.
Assessment measures
Martin and Pratt Nonword reading test (Martin & Pratt)
The Martin & Pratt (Martin & Pratt, 2001), which is an untimed measure of nonword reading accuracy, was the instrument of interest in the present study. In total, there are 54 test items, and these are presented in sets of six per page. Items increase in length and difficulty as the test progresses. All examinees begin from the first item, and the test is discontinued if they fail to accurately read aloud eight consecutive items. The number of nonwords read accurately throughout the test represents the examinee’s raw score, and this can be converted to either a standard score or a reading age equivalent. The Martin & Pratt has both a Form A and a Form B; only Form A was used in this study.
Wechsler Individual Achievement Test third ed. Australian and New Zealand Pseudoword Decoding subtest (WIAT-III A&NZ PD)
The WIAT-III A&NZ (Wechsler, 2016) comprises a battery of subtests, from which only the Pseudoword Decoding (PD) subtest was used in the present study. To complete this subtest, the examinee reads aloud from a list of 52 nonwords that get progressively longer and more complex. They are scored on their speed (based on the number of correct items in the first 30 seconds) and accuracy (based on the number correct before discontinuing or finishing the test). The test is discontinued if the examinee errs on four consecutive items. The PD accuracy raw score can be converted to a standard score, based on age- or grade-based test norms. For consistency with the Martin & Pratt, age-based norms were used in the present study.
Castles and Coltheart 2 (CC2)
The CC2 (Castles et al., 2009) is a test of real and nonsense word reading accuracy. The test stimuli comprise: (1) nonwords containing regular grapheme-phoneme correspondences (e.g. ‘gop’); (2) real words containing at least one irregular grapheme-phoneme correspondence (e.g. ‘good’); and (3) real words containing regular grapheme-phoneme correspondences (e.g. ‘bed’). Test items are presented on individual cards in a pseudo-mixed order (i.e. alternating in a fixed but unpredictable order between the three stimulus types). The examinee is scored on the accuracy of their response. In total, there are 120 items of increasing difficulty. Scoring for each stimulus type is discontinued if the student makes five consecutive errors. Results from all three stimulus types are presented in the Results section, with the Nonword score being most pertinent to the research questions. The raw score for each stimulus type can be converted to a standardised z-score using the test norms. For consistency with other measures, z-scores were converted to standard scores in the present study.
Wheldall Assessment of reading nonwords (WARN)
The WARN (Wheldall et al., 2021) is a measure of nonword reading efficiency or fluency. Stimuli are monosyllabic nonwords containing decodable grapheme-phoneme correspondences. Students’ scores on each of three ‘Initial Assessment’ lists represent the number of nonwords accurately read aloud in 30 seconds. The three scores are then averaged to find the overall raw score. The WARN was used with students in Years 1 and 2.
Wheldall Assessment of reading lists (WARL)
The WARL (Wheldall et al., 2015) is a measure of single (high-frequency) word reading efficiency or fluency. Students’ scores on each of three ‘Initial Assessment’ lists represent the number of words accurately read aloud in 1 minute. The three scores are then averaged to find the overall raw score. The WARL was used with students in Year 1.
Wheldall Assessment of reading passages (WARP)
The WARP (Wheldall & Madelaine, 2013) is a measure of oral reading fluency. Students’ scores on each of three 200-word ‘Initial Assessment’ passages represent the number of words accurately read aloud in 1 minute. The three scores are then averaged to find the overall raw score. The WARP was used with students in Years 2 through 6.
Neale Analysis of Reading Ability third ed. (NARA-3)
The NARA-3 (Neale, 1999) is a measure of passage reading proficiency. The examinee reads aloud progressively longer and more complex passages of text, after which they answer comprehension questions. The test is discontinued when the student reaches a specific number of reading errors (i.e. ≥16 for Levels 1–5 and ≥20 for Level 6). Raw scores for both accuracy and comprehension can be converted to percentile ranks, using the test norms. The NARA-3 was used with students in Years 2 through 6.
Procedure
Data collection took place during May and June of 2021. Students were withdrawn from their classrooms and taken to a quiet room on campus for the assessment sessions. Where possible and in the majority of cases, all assessments were administered in the one session, which lasted approximately 60 minutes. Data were collected by testers who were trained on the administration and scoring procedures for each assessment. Between assessments, testers offered participants short breaks to stretch and drink water; this was done to mitigate the risk of participant fatigue affecting test results. To ensure accuracy, all results that were written in record forms were double-checked by a different (similarly trained) person. Data that were entered from the record forms into a spreadsheet were also double-checked before analyses were conducted.
Results
Validity
To evaluate the concurrent validity of the Martin & Pratt as an index of decoding and reading ability, correlations were computed between Martin & Pratt raw scores and raw scores on all other tests. A second set of correlational analyses were also conducted between Martin & Pratt standard scores and standard scores on norm-referenced tests (i.e. all measures except the WARN, WARL and WARP). Several students were younger or older than the age range of norms for some assessment measures, resulting in a smaller sample size for standard score correlational analyses. Specifically, this pertained to five students aged under 6 years (who could not receive a standard score on the Martin & Pratt, WIAT-III A&NZ or CC2) and 17 students aged over 11 years, 5 months (who could not receive a standard score on the CC2).
Correlations Between Martin & Pratt and Other Measures.
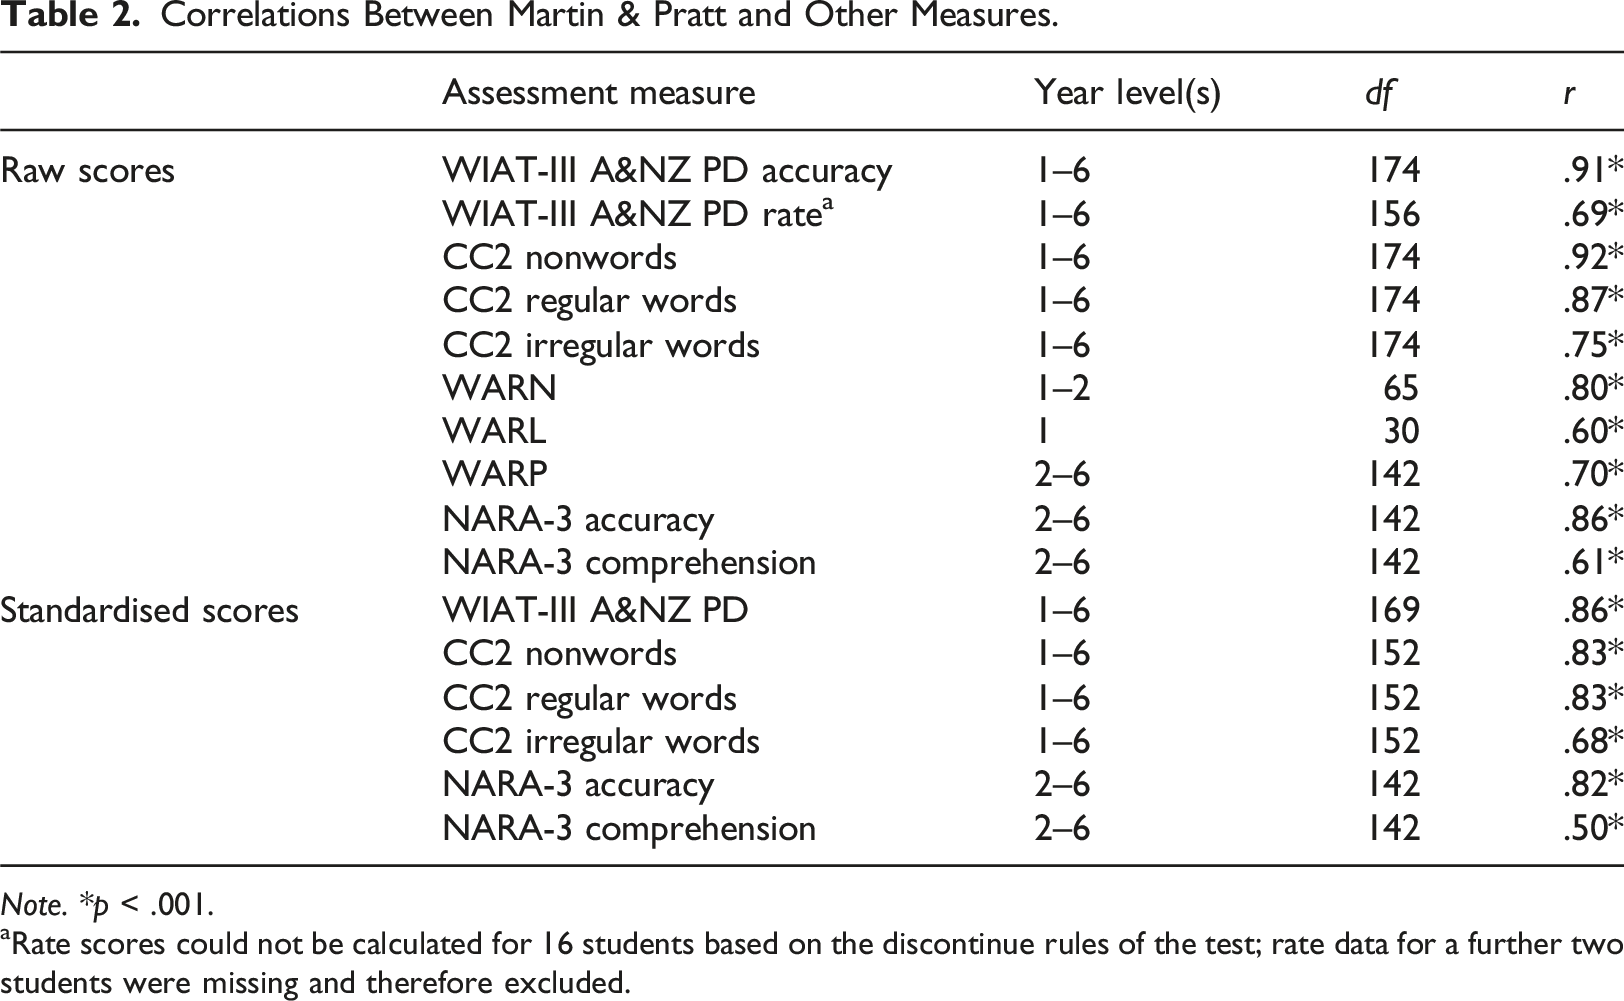
Note. *p < .001.
aRate scores could not be calculated for 16 students based on the discontinue rules of the test; rate data for a further two students were missing and therefore excluded.
Accuracy of standard scores
Mean Standardised Score Results on Measures of Untimed Nonword Reading Accuracy.
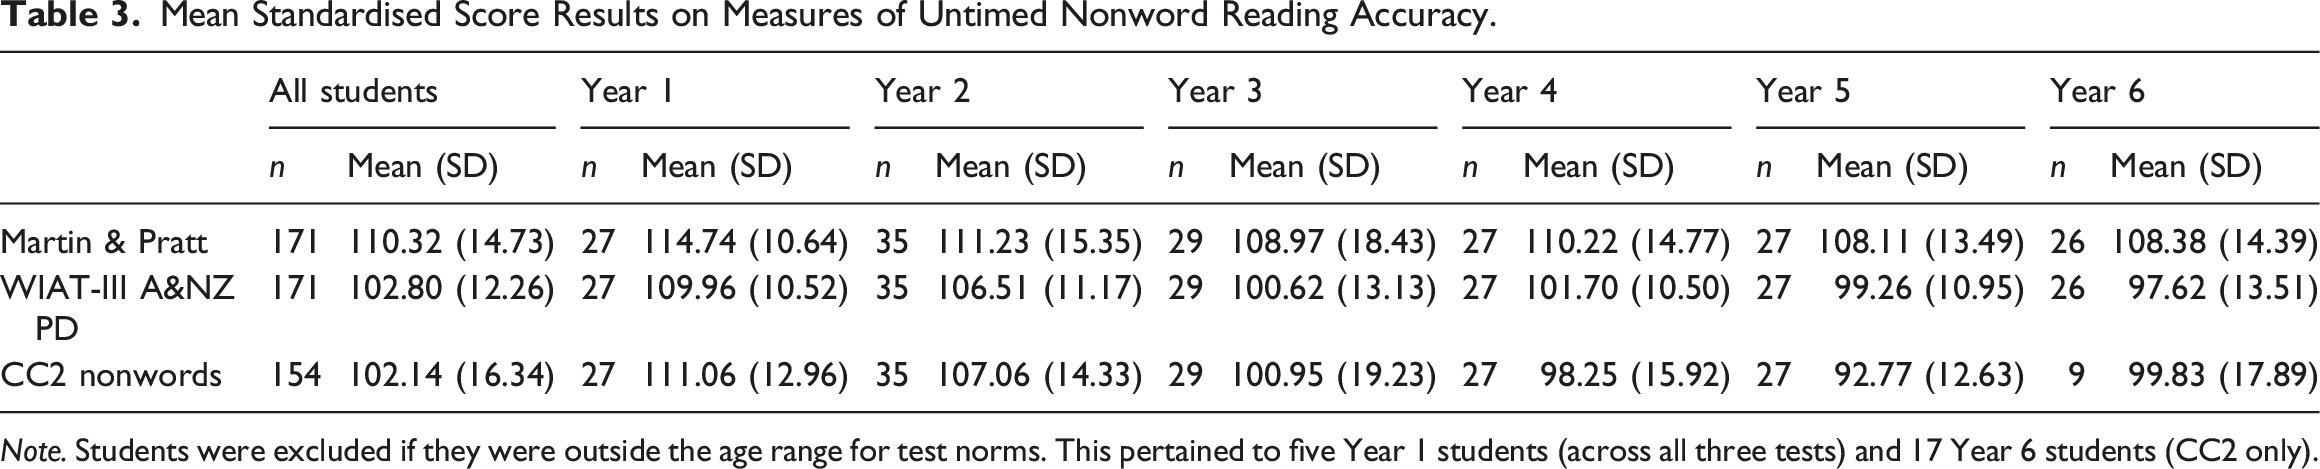
Note. Students were excluded if they were outside the age range for test norms. This pertained to five Year 1 students (across all three tests) and 17 Year 6 students (CC2 only).
The assessment selected for comparison with the Martin & Pratt was the WIAT-III A&NZ PD subtest. Paired t-tests were conducted to confirm that the standard score differences between tests were statistically significant, both overall (t (170) = 12.717, p < .001) and for each year level (Year 1: t (26) = 3.990, p < .001; Year 2: t (34) = 3.379, p = .002; Year 3: t (28) = 5.072, p < .001; Year 4: t (26) = 5.846, p < .001; Year 5: t (26) = 6.818, p < .001; Year 6: t (25) = 8.123, p < .001). These results confirmed that the original Martin & Pratt norms overestimated students’ nonword reading accuracy.
Discussion
In this study, the Martin & Pratt was examined for its concurrent criterion validity and the accuracy with which its standardised scores represented examinees’ actual nonword reading skills. Martin & Pratt scores correlated very strongly with the other untimed measures of nonword reading accuracy (i.e. WIAT-III A&NZ PD and CC2 Nonwords). This speaks to the test’s criterion validity, at least in the context of our relatively small and average-performing sample. The specific pattern of results, whereby Martin & Pratt scores were less strongly (though still significantly) correlated with more distal measures of reading proficiency, such as irregular word reading and passage reading comprehension, also speaks to the test’s construct validity in the same context. That is, there is some evidence that the test specifically measures a reader’s ability to decode unfamiliar words, rather than measuring another aspect of their reading profile. That said, Martin & Pratt scores also correlated strongly with those from tests assessing regular word reading accuracy and overall passage reading accuracy, indicating that the skills it captured may also be captured by other untimed assessments containing decodable word stimuli. With respect to the accuracy of the Martin & Pratt’s norms, the average standard scores generated for each year level were higher than expected, suggesting that the norms overestimated students’ abilities.
The results highlight the important distinction that must be made between the psychometric qualities of validity and norm representativeness. A test can still capture the construct it is intended to capture, while also producing standardised scores that under- or over-estimate examinees’ skills. Given the observed validity of the Martin & Pratt, its content and structure appear sound, and the raw scores derived from the test may still be useful when, for example, a user wants to evaluate changes in absolute test performance from one time point to another. Additionally, the test may provide useful information about the consistency of an examinee’s recorded error patterns. However, the findings from this study indicate that, in its current state, the suitability of the Martin & Pratt as a norm-referenced assessment is potentially limited. Users should interpret the standard scores derived from the original test norms with caution, on the understanding that they may overestimate examinees’ decoding skills.
The test’s tendency to overestimate standard scores is likely due to the amount of time that has passed since normative data were collected in 1996. At around this time, there was substantial opposition to systematic phonics instruction in the United States and Australia (Carnine, 2000; Hempenstall, 1996). Certainly, some scholars responsible for initial teacher education retain this attitude, and there is still a way to go in terms of improving Australian students’ reading proficiency and ensuring educators receive sufficient training in implementing phonics instruction (Buckingham & Meeks, 2019; Hunter et al., 2024). Nevertheless, since 1996, there has been more attention on the value of teaching phonics, alongside other skills like phonemic awareness, vocabulary, fluency and comprehension. Such attention may have resulted in an improved average nonword reading performance for students more recently assessed as part of the present study.
Limitations
One limitation of the present study is that we did not formally collect any information about what literacy instruction practices the participating schools had been delivering over the years. Hence, while there is an observable difference in performance between the original norm sample and our sample, we can only speculate that the source of that difference is attributable to a gradual shift over time towards more evidence-based phonics instruction. Although it is reasonable to suspect that the students who participated in the present study received more phonics instruction than those included in the original test norming study, we cannot draw any direct links between certain teaching practices and nonword reading outcomes.
Another limitation of the study is that we did not employ a process of stratified random sampling, with systematic attention to factors like geography, urbanicity and socio-economic status; nor did we include schools from all three Australian sectors (i.e. government, Catholic and independent). Moreover, the size of our sample (approximately 30 students per year level) was not as large as would be recruited for a typical standardisation or norming study. Hence, the scores derived from our sample cannot be said to represent the skills of primary school-aged students across Australia. While the results suggest that the Martin & Pratt correlates strongly with other measures of nonword reading accuracy, additional research to validate the test on a larger scale would be ideal. Importantly, our conclusion that the Martin & Pratt overestimates skills is not based on the assumption that the sample’s inflated scores represent average Australian students’ nonword reading abilities. Instead, it is based on the finding that the sample’s Martin & Pratt standard scores were significantly higher than those derived from other similar measure (in particular, the WIAT-III A&NZ PD subtest). This difference was consistently observed across year levels and comparison test measures, suggesting that it was not simply due to measurement error.
A somewhat unexpected finding from the study was that Year 1 and 2 students showed inflated standard scores on both the WIAT-III A&NZ PD subtest and CC2 Nonwords. This raises the possibility that even the assessment most recently normed in Australia – the WIAT-III A&NZ – is now misaligned with the standard for students’ average performance. Such misalignment may be the result of a population-level increase in average nonword reading performance during the five or six years between WIAT-III A&NZ normative data collection and the present study’s data collection. Alternatively, the Year 1 and 2 students sampled in our study may have simply been high performers; as stated above, without having randomly selected or stratified the sample, we cannot make any bold claims about the representativeness of their performance. Further research is needed to establish how Australian school students’ literacy skills, as measured using norm-referenced behavioural assessments, change in response to new instructional practices – particularly when those practices have such a direct relationship with the skills being measured (i.e. phonics instruction and nonword reading proficiency).
Conclusion
In this study, we sought to examine the adequacy of the Martin & Pratt. The results provided support for the criterion validity of the Martin & Pratt as a measure of nonword reading accuracy, at least with respect to approximately average-performing Australian students. However, the test’s standardised scores appeared inflated relative to other measures of nonword reading accuracy, suggesting the published norms for the test are outdated. The results speak to a need to update norms where the increased adoption of certain instructional practices may have prompted a change in students’ average performance.
Footnotes
Declaration of conflicting interests
The author(s) declared the following potential conflicts of interest with respect to the research, authorship, and/or publication of this article: Emeritus Professor Kevin Wheldall is a director of MultiLit Pty Ltd and Dr Nicola Bell is a paid employee of MultiLit Pty Ltd. MultiLit is a commercial organisation that publishes literacy-related instructional programs and assessments. MultiLit has recently republished the test under investigation in this study (i.e. the Martin & Pratt).
Funding
The author(s) received no financial support for the research, authorship, and/or publication of this article.
Appendix A
Table A1
All Correlations Between Measures (Raw Scores). Note. *p < .01; **p < .001. r = Pearson correlation coefficient; N = number of students included in analysis; N/A = measures were not administered concurrently; WARN/L/P = Wheldall Assessment of Reading Nonwords/Lists/Passages; WIAT-III PD = Wechsler Individual Achievement Test third ed. Australian and New Zealand Pseudoword Decoding; CC2 = Castles & Coltheart 2; NARA-3 = Neale Analysis of Reading Ability third ed.; Comp = Comprehension score.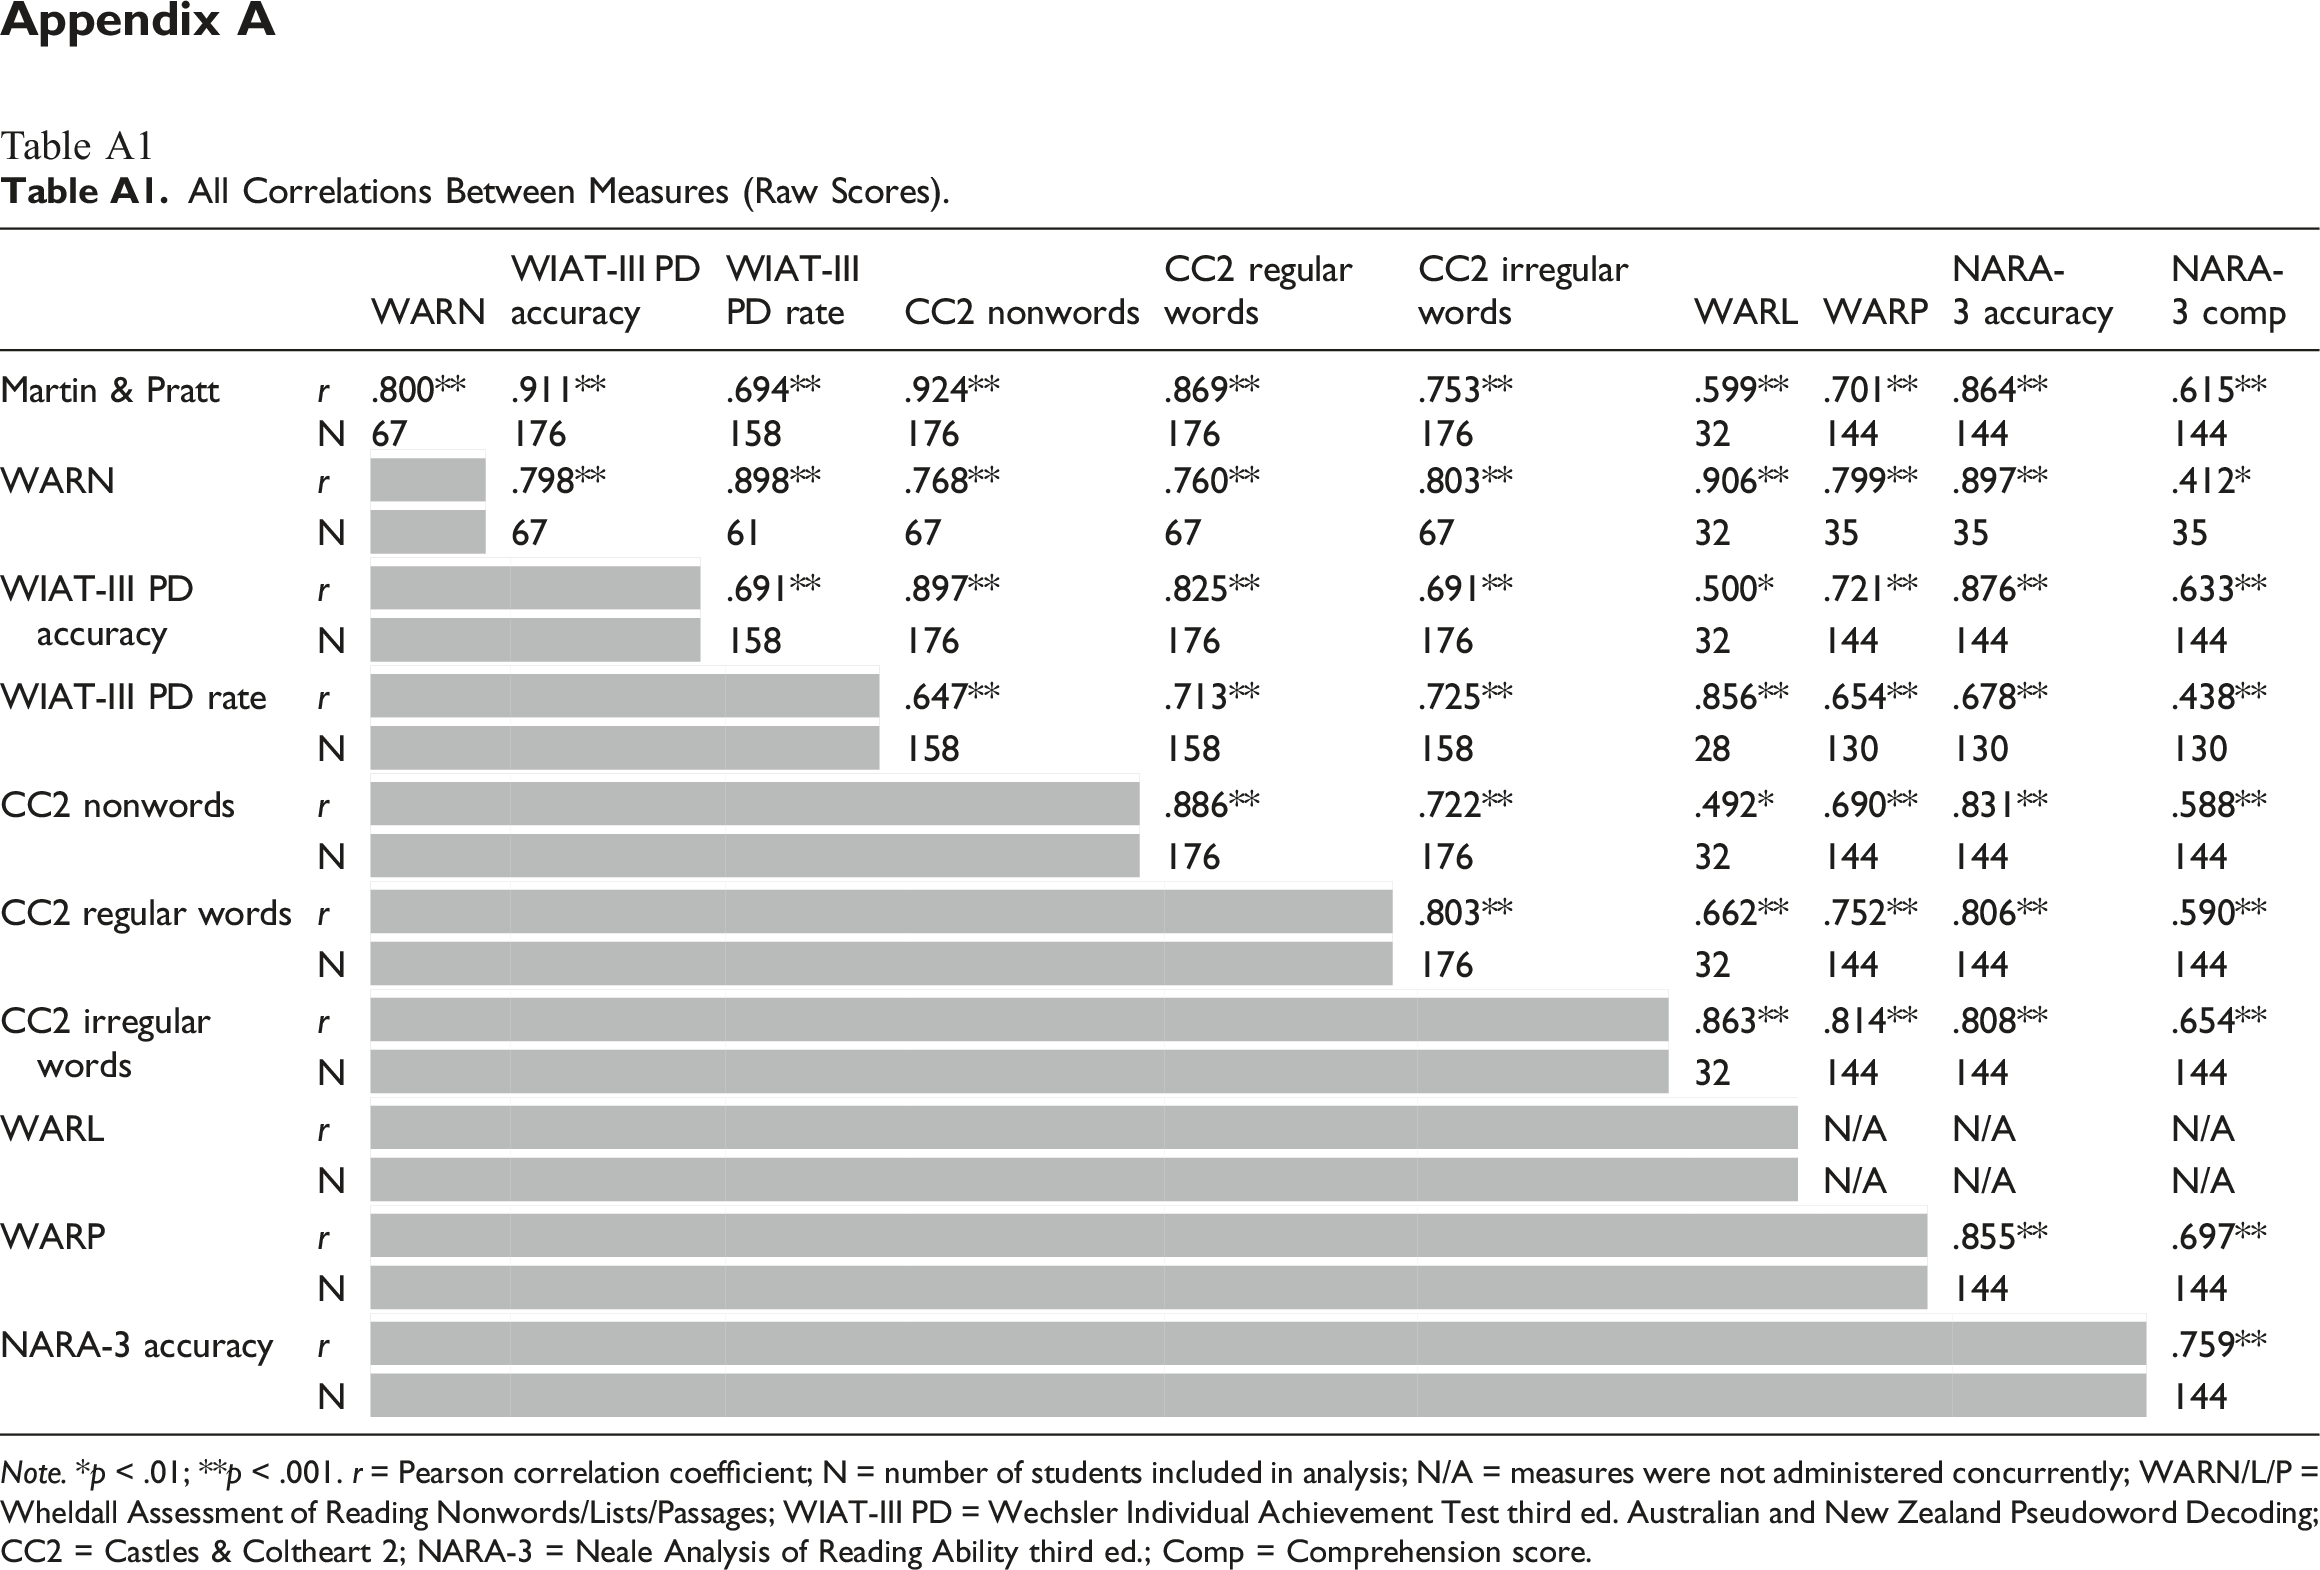
WARN
WIAT-III PD accuracy
WIAT-III PD rate
CC2 nonwords
CC2 regular words
CC2 irregular words
WARL
WARP
NARA-3 accuracy
NARA-3 comp
Martin & Pratt
r
.800**
.911**
.694**
.924**
.869**
.753**
.599**
.701**
.864**
.615**
N
67
176
158
176
176
176
32
144
144
144
WARN
r
.798**
.898**
.768**
.760**
.803**
.906**
.799**
.897**
.412*
N
67
61
67
67
67
32
35
35
35
WIAT-III PD accuracy
r
.691**
.897**
.825**
.691**
.500*
.721**
.876**
.633**
N
158
176
176
176
32
144
144
144
WIAT-III PD rate
r
.647**
.713**
.725**
.856**
.654**
.678**
.438**
N
158
158
158
28
130
130
130
CC2 nonwords
r
.886**
.722**
.492*
.690**
.831**
.588**
N
176
176
32
144
144
144
CC2 regular words
r
.803**
.662**
.752**
.806**
.590**
N
176
32
144
144
144
CC2 irregular words
r
.863**
.814**
.808**
.654**
N
32
144
144
144
WARL
r
N/A
N/A
N/A
N
N/A
N/A
N/A
WARP
r
.855**
.697**
N
144
144
NARA-3 accuracy
r
.759**
N
144