
Abstract
National testing of students has become an increasingly prevalent policy tool, often implemented to drive improvement through increased accountability and heightened competition between schools. Such testing has been found to generate negative emotional responses among students, including increased stress and anxiety . However, there is little examining whether such responses are associated specifically with national testing regimes or are more general responses to testing situations. This study surveyed 206 students in Australian secondary schools to compare responses to NAPLAN and internal school tests. Students reported higher expectations for their performance in internal school tests than for NAPLAN, higher levels of boredom for NAPLAN and greater levels of confidence for their internal school tests. While most students reported low levels of negative emotional responses to NAPLAN, a small group of students reported strong negative emotional responses to both NAPLAN and internal school tests, suggesting that negative responses to national testing programs may be more dependent on the individual student.
Keywords
Introduction
The drive for increased accountability for schools and teachers has led many education systems around the world to implement state and national testing regimes. Countries that have established national or state testing programs for school students include England, the United States, Scotland, Indonesia and Australia (Supovitz, 2009; Gorur, 2015). While some countries and states use sample testing, many opt for population testing that arguably provides a complete picture of student achievement and allows comparisons to be made between different groups of students (males compared to females, wealthier students compared to disadvantaged ones), between schools and between sectors or states.
Such large-scale programs require the investment of significant resources, and impact on millions of students and teachers. They have understandably been the subject of considerable research to determine how such testing programs influence pedagogies used, the curriculum, the focus and energies of principals and teachers, and students’ experiences of schools. This body of research considers what the positive and negatives of testing programs are, and whether the benefits of such testing programs balance or outweigh their potential and experienced downsides.
A range of potential positive effects from national and state testing programs have been identified in the literature. Supovitz (2009) notes that two key theoretical reasons for introducing national and state testing programs are that they will improve alignment within and across schools, and will increase teacher motivation to teach well and student motivation to learn. Improving alignment increases the likelihood that students will achieve essential competencies regardless of where they learn, and whether they transfer between schools, and some researchers have indeed reported increased alignment between the documented curriculum and the taught curriculum (Clarke et al., 2003; Jones, 2007; Phelps, 2006). Some researchers also report that testing does in fact lead to greater student motivation to study (Sloane & Kelly, 2003). Supovitz (2009) also notes that an additional reason for implementing testing programs is that they provide broad information about student achievement at national, state, school, teacher and student levels, and the argument that testing improves teaching and learning by providing this type of information is often used by testing authorities (e.g. see Australian Curriculum Assessment and Reporting Authority, 2020). However, while national and state testing regimes appear to increase the capacity of systems and schools to track changes in student achievement over time and adjust resourcing accordingly to address student need (Santiago et al., 2011), there is evidence that the information they provide is much less reliable or useful at the level of the teacher or individual student (Rogers et al., 2018; Supovitz, 2009; Wu, 2015).
In addition to these positive impacts, the literature highlights a range of negative effects generated by national or state testing programs. These negative flow-on effects can be categorised into impacts on first, schools, second, teachers, third, teaching and fourth, students. At the school level, while national and state testing programs may sharpen the focus on what policymakers see as essential competencies, they have been found to be associated with reduced student access to and emphasis on curriculum areas that are not included within the testing program, encouraging teachers to teach to the test and narrowing the learning focus (Polesel et al., 2014; Rentner et al., 2006; Thompson, 2013; Thompson & Harbaugh, 2013). Some research has found evidence of reduced time spent on non-tested areas (such as the arts) and there is evidence that these types of effects may be most keenly felt in disadvantaged schools, which may be under most pressure to bring their students ‘up to scratch’ (Thompson & Harbaugh, 2013). However, it should be noted that in some Australia research on NAPLAN, strong effects on teacher practice and the curriculum are reported by relatively few teachers (Rogers et al., 2018).
Also at the school level, research reported in other countries indicates that, particularly where high stakes are attached to schools or students doing well in the tests, national and state testing programs can lead to various forms of cheating and gaming the system (Vasquez Heilig & Darling-Hammond, 2008; Jacob & Levitt, 2003). Where poor-performing schools are named and shamed through publication of results, schools may use strategies such as suspending poorly performing students for the duration of the testing period to inflate artificially the school’s scores (Nichols, Glass, & Berliner, 2006). In the longer term, schools may use tactics such as encouraging low-achieving students to drop out (Vasquez Heilig et al., 2012), placing them into unassessed special education classes (Allington & McGill-Franzen, 1992; Figlio & Getzer, 2002), or diverting resources away from students who will not be assessed (Yiu, 2020), all forms of cream-skimming.
There is also evidence of an impact on teachers themselves. Some studies have found that national and state testing programs are associated with a reduction in teachers’ morale and sense of professional autonomy (Crocco & Costigan, 2007; Wright & Choi, 2005). Thompson (2013) respondents indicated that NAPLAN tests in Australia had generated increased pressure on teaching staff. Ashadi and Rice (2016) documented impacts on teachers’ professional opportunities and career pathways in Indonesia, with those teachers perceived to be more competent or better qualified being assigned to classes sitting for the national tests and being offered more extensive professional learning than other teachers in the same schools.
With regard to teaching, the research suggests that, within curriculum areas targeted for testing, national and state testing programs can lead to a focus on low-level skill acquisition, rather than deeper and more meaningful learning (Chang et al., 2013; Thompson & Harbaugh, 2013). Lobascher (2011) found that national and state testing programs were associated with use of ‘defensive pedagogies’ that are teacher-centred and reduce student activity and agency. Other research with teachers on their teaching practice following the introduction of national and state testing regimes has confirmed these findings (e.g. Polesel et al., 2014).
Finally, there are the impacts on students. Concerns have been raised about negative emotional impacts on students due to the implementation of national and state testing, and there is a considerable body of research into this topic. Paris and McEvoy (2000) reported that students experienced anxiety and freezing in response to national tests, while exhaustion, crying and frustration responses were found among some children by Madhaus et al. (2009). Athanasou (2010), cited in Polesel et al., 2012) reported that wellbeing issues, such as the inability to sleep, were associated with NAPLAN tests among Australian primary students. Other Australian research with teachers finds that they identify NAPLAN as having a negative impact on student wellbeing (Cummings et al., 2015), with reports of increased student anxiety and stress, or even crying (Thompson, 2013; Rice et al., 2015). Howell (2017) research with primary school students in Australia found that NAPLAN tests were construed as high stakes by students and associated with negative emotional responses such as anxiety, even though the policy intention is that such tests are low stakes for students. Cummings et al. (2015) found that around one third of students reported feeling worried or sad before and during NAPLAN testing. However, it should be noted that some studies find no such effects: Rogers et al. (2016) found only slightly increased stress levels among the great majority of students sitting for national tests, with high stress levels reported by only around 3% of participating students.
The finding that national and state testing programs may impact negatively on student wellbeing by causing distress has been a major point of contestation in discussions around the programs, with the media particularly highlighting research with these types of findings (e.g. Bell, 2018; Bowden, 2014; BBC News, 2018). However, while there has been a considerable body of research that has sought to explore student emotional reactions to national and state testing, this research has had several limitations. The first is that much (although not all) of the research has sought the views of administrators, teachers and parents about student responses to tests and is thus second-hand and does not capture the students’ perspectives. As Rogers et al. (2016) note, it is possible that teachers and parents with negative attitudes towards state and national testing programs perceive greater levels of distress among children and adolescents than actually exist, or that parents and teachers who have observed student distress disproportionately volunteer for research on the impact of testing programs. The second limitation is that the research on student reactions has for the most part assumed that students’ emotional responses to national and state testing programs are a function of the imposition of such tests rather than potentially being a more general reaction that some students have in response to any testing situation. Both points are important. It is possible that teachers and parents are drawing conclusions about the degree of distress students feel in relation to testing, that may not accurately reflect students’ own perceptions of their responses. It is also possible that students who have negative emotional responses to large-scale high-stakes testing may be at least as distressed by regular internal school testing, and thus state or national testing programs are placing little further emotional burden on such students that they do not already experience in school.
Segool et al. (2013) did seek to compare elementary school student anxiety responses to No Child Left Behind tests with their responses to regular in-school testing. This study found significantly higher anxiety among students in response to NCLB tests compared to in-school tests. But there appears to be little else examining this issue. Further, Howell (2017) study suggests that younger students might respond more anxiously to national testing than older students because they have little understanding of how the tests are used or what the consequences of testing are. This aligns with the research of Rice et al. (2015), which found that negative emotional responses to NAPLAN testing were reported much more frequently by teachers of students in primary/elementary schools than those in secondary schools.
Finally, there is relatively little that seeks to explain theoretically why students might respond to tests (whether national or regular internal assessment experiences in schools) in the ways that they do, and how their perceived need and motivation to do well in tests might inform such responses.
The current study sought to address these gaps in the literature. The study drew on Wigfield and Eccles (2000) expectancy-value theory to examine student responses to testing. Expectancy-value theory posits that our motivation for a goal will be a function of the value we place on the goal, and the expectations we have of being able to attain it with effort. If, for example, a person strongly desires a goal, but has very low expectations of being able to attain it, motivation will be low. If the person perceives that they can easily attain a goal, but places little value on it, motivation is also low. In contrast, where the person places a high value on a goal, and has a strong expectation that they will be able to attain it with effort, motivation will be high.
We expanded upon Wigfield and Eccles’ theory by hypothesising that students’ emotional responses to testing (both NAPLAN and internal school tests) would be related to their expectations and values. We hypothesised that where students place a high value on doing well in a test, they are more likely to report strong emotional responses (both positive and negative) to testing. We further hypothesised that students with high expectations to do well would be more likely to report positive emotional responses to testing. We also hypothesised that students reporting high levels of motivation as expressed as effort in a test would be more likely to report positive emotional responses to testing, while students reporting low levels of motivation (as expressed by effort) would be more likely to report boredom in response to testing.
We sought to compare students’ emotional responses to the Australian national literacy and numeracy tests (NAPLAN) and their internal school assessments in mathematics and English. We predicted that student expectations, values and motivation would influence student emotional responses to testing for both national tests and formal school-based assessments.
The research questions framing the study therefore were: Are students’ self-reported levels of value, expectations and motivation (as reported effort) the same for national testing (NAPLAN) and internal school tests? Are students’ emotional responses to national testing (NAPLAN) and to internal school tests the same? If not, what differences are evident? How are student self-reported levels of value, expectations and motivation (as self-reported effort) related to the types of responses students report in relation to testing?
Context for the Study
The study was conducted in the state of Victoria. The Australian National Assessment Program (Literacy and Numeracy), or NAPLAN, was established in Australia in 2008 and assesses all students in Years 3, 5, 7 and 9 (that is, students who are usually 8, 10, 12 and 14 years of age respectively). NAPLAN is an annual test that measures students’ proficiency in reading, writing, language conventions (spelling, grammar and punctuation), and numeracy through five separate tests, administered across 3 days. Test results are sent to parents and schools approximately 5 months later, although online testing for some schools began in 2019 and is expected to produce a faster turnaround time as it is rolled out across the country. 1 Criterion-referenced reports are delivered to parents giving an indication of how an individual student’s achievement compares to a typical student in their year, and schools receive both individual and aggregate achievement data for all tests. School-level results are also made public on the national My School website, and the level of achievement of students in each school is mapped on the website against 59 similar schools in a format that was designed to be easily read by the public (Gorur, 2015), so that parents can use this information to make a judgement about how well their child’s school is performing. While the My School website was designed to make it difficult to construct league tables of school performance, media outlets quickly developed school ranking tables (‘league tables’) following the release of NAPLAN results (Gorur, 2015).
An individual student’s NAPLAN results are for the most part simply used to provide information to parents and inform teaching, although there are reports of some schools using NAPLAN results to inform selection for entry into the school or into specific academic streams or subjects (for example, advanced maths courses). Overall, NAPLAN might be considered low stakes, then, for most of the students undertaking the tests. However, the publication of school results online, and the potential for this to impact on school prestige and student enrolments, together with the common use of NAPLAN results by departments of education to monitor school performance, means that the tests are arguably high-stakes for schools, principals and teachers.
Materials and methods
Approach
A total of 15 schools was targeted to participate in the study. Secondary schools were targeted for two reasons. First, students at secondary schools have considerably more experience with NAPLAN tests, having already completed them at primary school in Years 3 and 5. Second, secondary schools conduct more formal and frequent internal tests with students that are overtly labelled as tests, allowing a better comparison to be made between students’ perceptions of their reactions to NAPLAN and their school’s internal tests than would be possible with primary school students.
Schools were contacted initially by an email that included the Plain Language Statements for the project and sample consent forms. The email was followed up with a telephone call a week later to determine whether the school was interested in participating. The study targeted students in Years 7 and 9 as these are the years that undertake NAPLAN tests, and the questionnaire was conducted in the month after NAPLAN to ensure that students’ memories of the experience were recent. Where a school indicated its willingness to participate in the study, a member of the research team visited the school to speak with students, provide the link to the online questionnaire and answer any questions from students and teachers. Questionnaire completion took around 15 min, and was undertaken during class time in the presence of the teacher.
Students were offered an incentive of a small confectionary item on returning the parental permission form to increase participation; they received this incentive regardless of whether or not their parent agreed to their participation (i.e. the incentive was used simply to ensure the signed form was returned). No other incentives were involved.
Ethics
Ethics approval was obtained from the Victorian Department of Education and Training, the Catholic Education Office (Melbourne), the Catholic Education Office (Sale) and the University of Melbourne Human Research Ethics Committee. Participation in the student questionnaire was anonymous, and individual schools have not been identified.
Sample
To facilitate the research, schools where the researchers had an existing professional relationship were targeted. Of the 15 schools approached, four agreed to participate in the study. The sample of schools included single sex and co-educational schools from rural and metropolitan areas. Two participating schools were government schools and two were Catholic; while several independent schools were approached, none was able to participate in the study.
Sample characteristics.
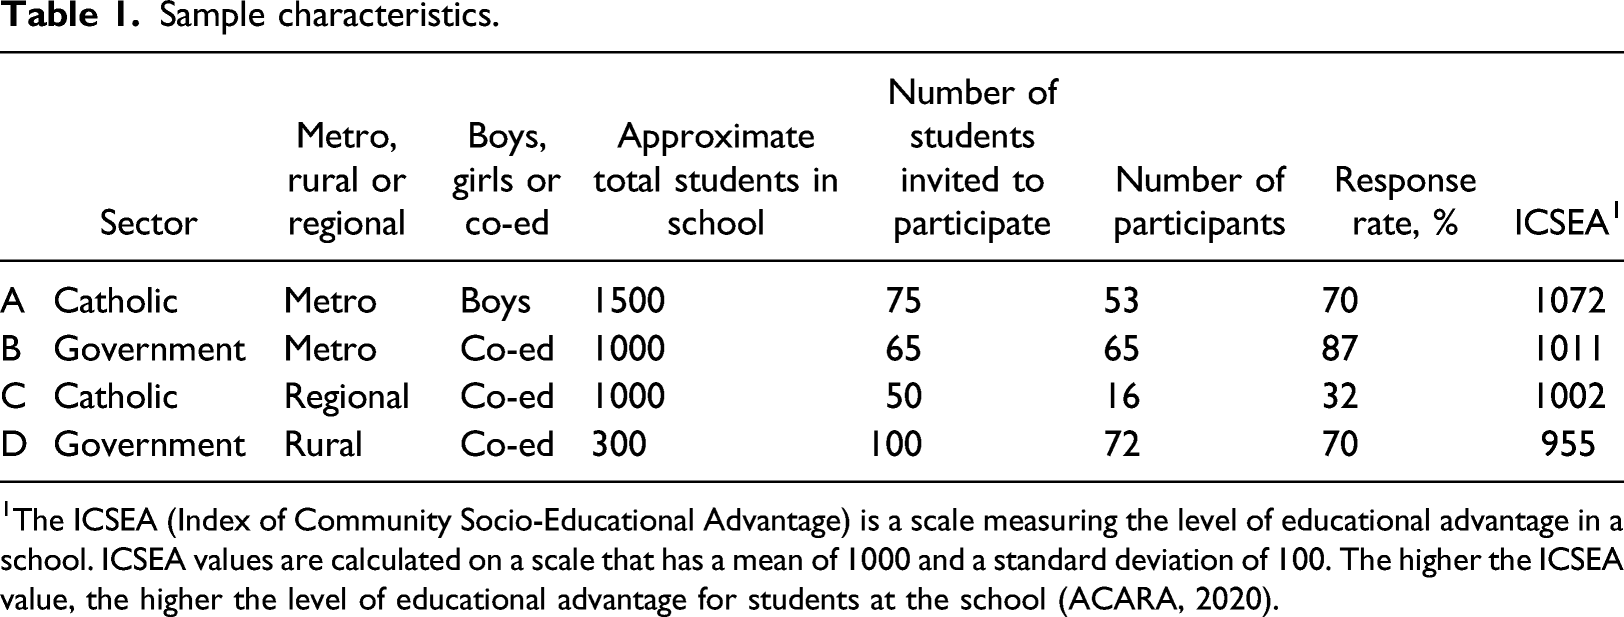
1The ICSEA (Index of Community Socio-Educational Advantage) is a scale measuring the level of educational advantage in a school. ICSEA values are calculated on a scale that has a mean of 1000 and a standard deviation of 100. The higher the ICSEA value, the higher the level of educational advantage for students at the school (ACARA, 2020).
The sample has a slightly higher percentage of students from government schools than the state percentage of Victorian students attending government schools. In Victoria, 64% of the secondary student population attends government schools (Victorian Department of Education and Training, 2017). There is also a considerable over-representation of Catholic school students in this study compared to the state’s 17%. The schools in the study were all around average socio-economic status, as indicated by the ICSEA.
Instrument
The questionnaire used in this study built on existing instruments. Some of the constructs investigated have been measured in previous research on the impact of NAPLAN (Polesel et al., 2012; Rice et al., 2015; Wyn et al., 2014). The developed questionnaire was trialled with a small sample of students in a non-participating school and adjusted prior to use with the schools participating in the study.
A 36-item online questionnaire in Survey Monkey was developed, which gathered information from students on a range of topics. Specifically, the questionnaire collected data on the following: Demographic information (age, gender) Student perceptions of teacher attitudes to assessment (NAPLAN, school tests) Student perceptions of parent attitudes to assessment (NAPLAN, school tests) Student expectations of own performance in assessment (NAPLAN, school tests) Student levels of motivation for the assessment (NAPLAN, school tests). This was assessed through self-reported effort (‘How hard did you try…’) for each test. Student self-reported value for doing well in the assessment (NAPLAN, school tests) Student experience of feedback from the tasks (NAPLAN, school tests) Student experience of preparation for the tasks (NAPLAN, school tests) Student self-efficacy in the assessed subjects Emotional responses to tests (negative, positive and neutral) for NAPLAN and for the most recent school test in the equivalent subject Personality (as measured by the Ten-Point Personality Inventory TIPI scale (Gosling et al., 2003).
The questionnaire also included some brief open-ended sections for students to make any additional comments about their experiences of NAPLAN and school testing. Data from the questionnaires were transferred to and analysed in SPSS, using paired t-tests, McNemar’s tests, and Gamma and chi-square analyses.
Results
Comparing student value, expectations and motivation for national assessment program (literacy and numeracy) and internal school tests
We first sought to compare students’ responses to the national standardised tests, and their internal school tests. We compared the value students placed on doing well, their expectations that they would do well, and their level of motivation as measured by self-reported effort in NAPLAN and internal school tests.
Comparison of the Value Students Placed on Doing Well in NAPLAN and Internal Tests.
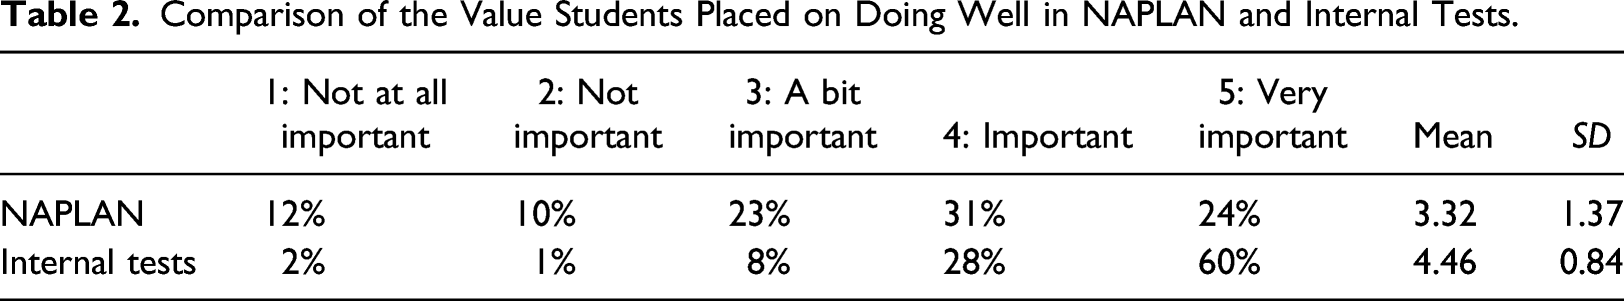
A paired t-test found that there was a significant difference between the value students placed on doing well in NAPLAN (M = 3.32, SD = 1.37) and the value students placed on doing well in internal tests (M = 4.46, SD = 0.84, t (205) = −10.17, p < 0.001, d = 1.00). Most students (60%) reported that it was ‘Very important’ to them to perform well in internal tests, which was more than double the percentage of students (24%) who identified doing well in NAPLAN as ‘Very important’ to them. Twelve percent of students selected the ‘Not at all important’ option regarding NAPLAN, compared to only two percent of students choosing the ‘Not at all important’ option for internal tests.
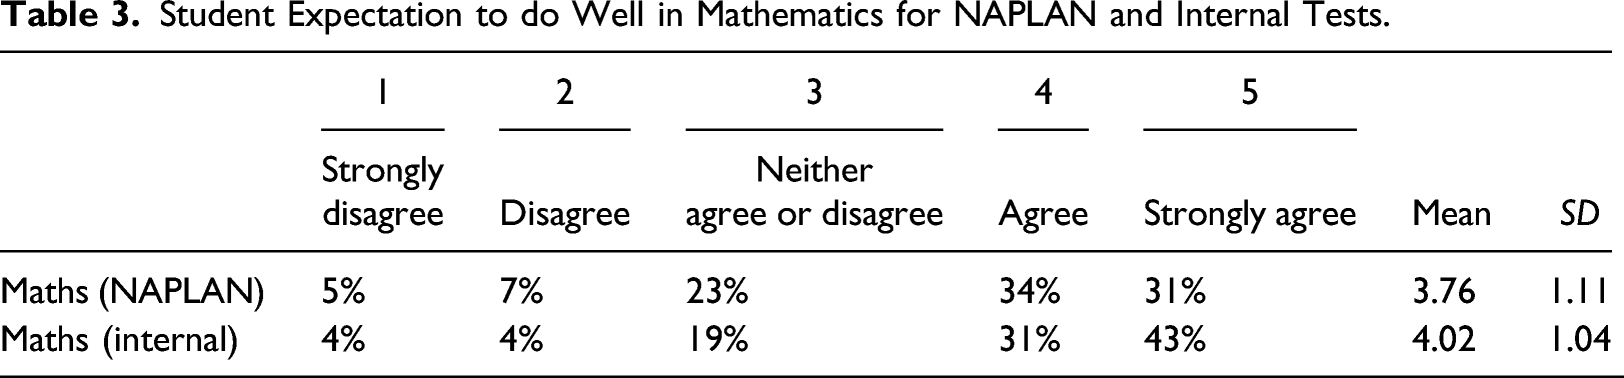
Student Expectation to do Well in Mathematics for NAPLAN and Internal Tests.
Student Expectations to do Well in English (composite) for NAPLAN and Internal Tests.
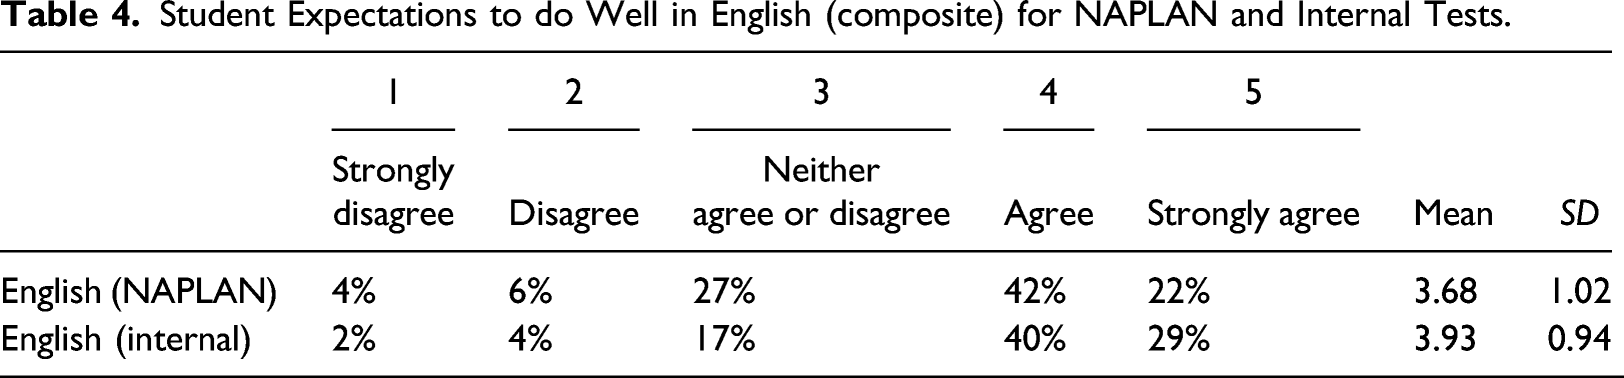
A paired sample t-test found students reported significantly higher expectations do well in internal mathematics tests (M = 4.02, SD = 1.04) than in NAPLAN mathematics (M = 3.76, SD = 1.11, t (205) = −2.52, p = 0.006, d = 0.24). A second paired sample t test found students reported significantly higher expectations to do well in internal English tests (M = 3.93, SD = 0.94) than in NAPLAN English (M = 3.68, SD = 1.02, t (205) = −2.51, p = 0.006, d = 0.25). Further analysis showed that most students (65%) reported the same expectations for both types of tests (NAPLAN and internal school). However, approximately one in four (27%) students expected to perform better on internal tests than NAPLAN. Very few students expected to perform better in NAPLAN than in internal school tests (8%). This may be because internal tests are often tailored to the content taught in class, boosting student confidence in their capacity to do well in them.
Expectancy-value theory would predict that if an individual’s expectations to do well and value placed on doing well are higher, their motivation will be higher. Given that both value and expectations were higher for internal tests than for NAPLAN, it was anticipated that student motivation as measured by self-reported effort would be higher for internal tests than for NAPLAN.
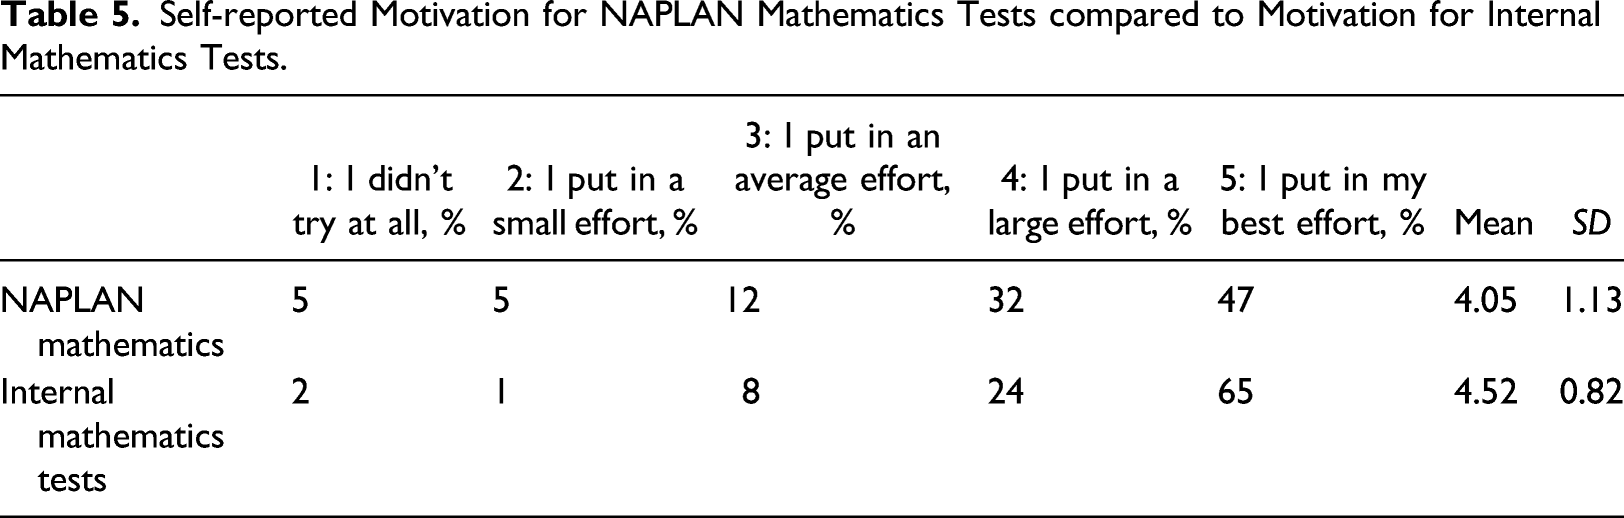
Self-reported Motivation for NAPLAN Mathematics Tests compared to Motivation for Internal Mathematics Tests.
Self-reported Motivation for NAPLAN English Tests (composite) compared to Motivation for Internal English Tests.
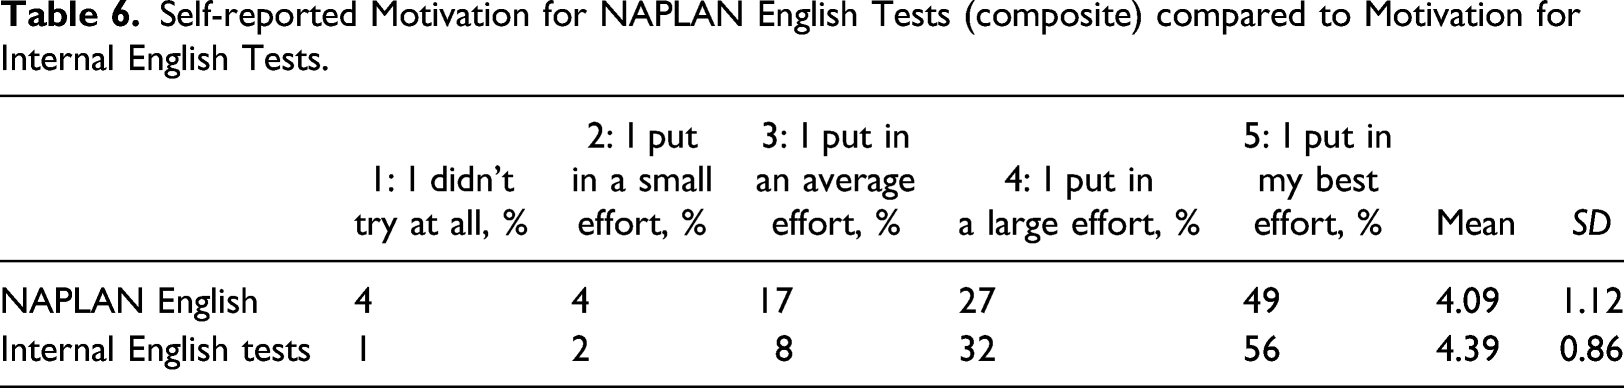
A paired sample t-test found students reported significantly higher motivation for internal mathematics tests (M = 4.52, SD = 0.82) than for NAPLAN mathematics (M = 4.05, SD = 1.13, t (205) = −4.83, p < 0.001, d = 0.48). A paired sample t-test found students reported significantly higher motivation for internal English tests (M = 4.39, SD = 0.86) than NAPLAN English (M = 4.09, SD = 1.12, t (205) = −3.45, p < 0.001, d = 0.30). In internal mathematics tests, 65% of students reported that they put in their best effort, compared to 47% of students reporting the same for NAPLAN mathematics. The pattern is similar although not as strong in students’ reporting of English, in which 49% of students reported that they put in their best effort for NAPLAN compared to 56% reporting that they put in their best effort for internal English tests.
These findings were consistent with what would be predicted by our application of expectancy-value theory. Students placed more value on doing well in internal tests than doing well in NAPLAN, had higher expectations of doing well in internal tests than in NAPLAN, and were therefore more motivated for and reported putting in more effort for internal tests of both English and mathematics.
Students in this study demonstrated higher expectations to do well, value placed on doing well and motivation for internal school tests than for NAPLAN tests. We now compare the emotional responses of students to each form of assessment.
A comparison of student emotional responses to national assessment program (literacy and numeracy) and internal tests
To understand better whether the negative student responses to national and state testing programs are specific to those testing situations, or occur as readily in-school tests, we compared student responses to internal tests and NAPLAN. We also sought to determine whether there were other emotional responses to testing among students, not just negative emotions such as nervousness.
Students were asked: ‘Thinking back to the last time you completed a [NAPLAN/Internal] test, which of the following did you experience?’ The response items comprised three positive emotional responses to testing (feeling confident, excited, enthusiastic), one neutral item (feeling bored) and six negative emotional responses (feeling nervous, feeling stressed, experiencing sleeplessness the night before, feeling sick, freezing during the test and crying). Students were asked to tick any items they had experienced, and were able to select more than one option.
Students’ Reported Emotional Responses to NAPLAN and Internal School Tests.
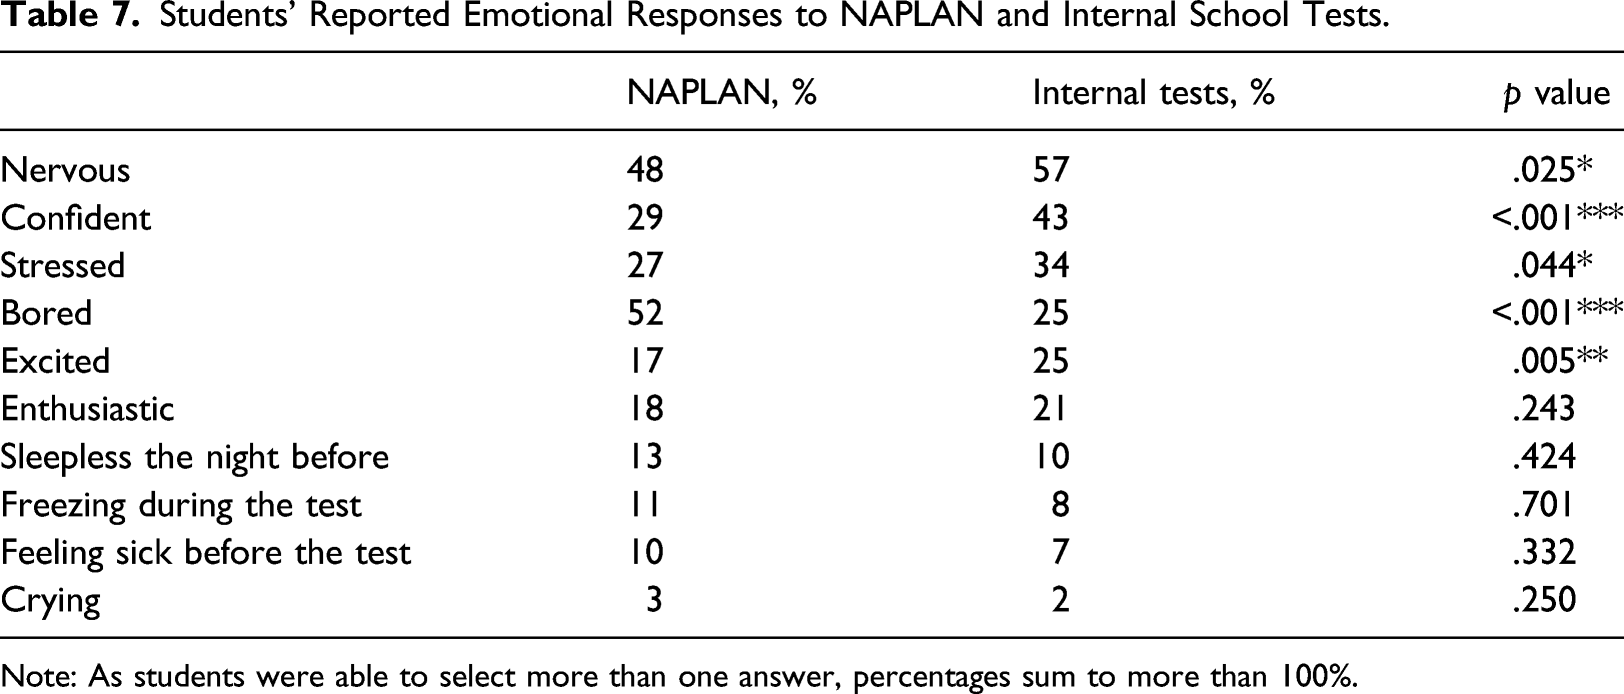
Note: As students were able to select more than one answer, percentages sum to more than 100%.
An exact McNemar’s test determined that there was a statistically significant difference in students’ responses to NAPLAN and internal tests for feeling nervous, confident, stressed, bored and excited.
For positive emotional responses to testing, 43% of students in the sample reported feeling confident before their internal tests, compared to 29% reporting confidence prior to sitting NAPLAN (p < .001). More students reported feeling excited before internal tests than before NAPLAN (p = .005). There were no statistically significant differences between students feeling enthusiastic prior to NAPLAN and internal tests.
For the negative emotional responses, there was a small but statistically significant difference between students feeling nervous prior to NAPLAN and internal tests, with fewer students reporting feeling nervous for NAPLAN than for internal tests (p = .025). More students reported feeling stressed prior to internal tests than reported similar feelings before NAPLAN (p = .044).
The greatest difference in student responses to the two forms of testing was that students were much more likely to report being bored for NAPLAN than for internal tests, with almost double the number of students reporting feelings of boredom associated with doing NAPLAN compared to internal tests (p < .001). Small percentages of students reported feeling sick, freezing, and sleeplessness the night before for both NAPLAN and for internal tests. There were no significant differences in the number of students reporting these responses for NAPLAN and internal tests.
Relationships between value, expectations and motivation, and student emotional responses to tests
We also sought to examine the relationships between value, expectations, motivation and student emotional responses to tests. We consider each of these below in relation to the NAPLAN tests. 2
In relation to NAPLAN mathematics, there were similar strong positive relationships between expectations to do well and positive emotional responses – feeling excited (G = 0.617, p < .001) confident (G = 0.430, p < .001), and enthusiastic (G = 0.546, p < .001). Consistent with NAPLAN English, there was a negative relationship between expectations to do well in NAPLAN mathematics and boredom (G = –0.529, p < .001). No relationships were found between expectations and students reporting negative physical responses.
In summary, students who expected to do well in NAPLAN (whether English or mathematics) were more likely to feel excited, enthusiastic and confident, and less likely to feel bored than students who had lower expectations for their performance.
Value
Analysis of the value students place on doing well in NAPLAN and their emotional responses indicated that the value students placed on doing well was positively correlated with positive emotional responses, including feeling excited (G = 0.687, p < .001), confident (G = 0.564, p < .001) and enthusiastic (G = .523, p < .001). There was also a strong positive correlation between feeling nervous (G = .442, p < .001), and the value students placed on doing well in NAPLAN, yet there was no statistically significant relationship between the value students placed on doing well in NAPLAN and feeling stressed. The only significant negative correlation was between the value students placed on doing well and boredom (G = –0.774, p < .001), indicating that the less value students place on doing well in the NAPLAN tests, the more likely they were to report feeling bored with the tests.
There were no statistically significant relationships between the value students placed on doing well and the other negative responses (sleeplessness, feeling sick, freezing during the test or crying). In sum, students who placed a higher value on doing well in NAPLAN were more likely to experience feeling excited, confident and enthusiastic, but also more likely to report feeling nervous in response to the tests. They were less likely to report feeling bored than students placing a low value on doing well in NAPLAN.
Motivation
Motivation for performing well in NAPLAN as measured by reported effort was correlated with positive responses, but not negative responses. Students responded to the questions, ‘How hard did you try in NAPLAN mathematics tests this year?’ and ‘How hard did you try in NAPLAN English tests this year?’ Relationships between reported motivation and students’ emotional responses were investigated using Goodman and Kruskall’s Gamma. Motivation as assessed by self-reported effort in NAPLAN English was positively correlated with students reporting feeling excited (G = .370, p = .012), confident (G = .350, p = .004) and enthusiastic (G = .354, p = .029). There were similar positive correlations between reported motivation in NAPLAN Mathematics and feeling excited (G = .347, p = .003), confident (G = .435, p < .001) and enthusiastic (G = .339, p = .039). The only significant negative relationship was between motivation to do well in NAPLAN mathematics and feeling bored (G = .293, p = .032). There were no statistically significant relationships between the motivation students have for NAPLAN and the other negative responses (stressed, feeling nervous, sleepless the night before, feeling sick, freezing or crying). As would be predicted by our application of expectancy-value theory, students with greater levels of motivation for NAPLAN are more likely to report positive emotional responses to the tests.
Discussion
National and state testing programs are now an important feature of the education policy landscape in many countries, whose implementation consumes significant resources, and shapes students’ experiences of school and learning. For these reasons, research into the impact and efficacy of such programs is vital and ongoing. Arguably, as the key stakeholders in the endeavour of education, the impact on students should be a key focus of this research.
As national testing programs have been implemented around the globe, numerous studies have reported that students suffer emotionally from them as evidenced by their negative emotional responses to the tests—high levels of student stress, crying, sleeplessness and so on (Cummings et al., 2015; Simpson, 2018). In some countries, these reports have been strong enough to lead to calls to abandon or modify significantly national testing programs (see for example, Bell, 2018; BBC News, 2018).
However, testing in various forms is a part of students’ experiences in school. It is possible that some students respond negatively to any testing situation, and removing national testing programs will not alter this response, simply provide one less occasion on which the response will occur. There is little in the research that helps us understand whether students’ observed and reported negative emotional responses to national and state testing programs are created by these programs, or if they are simply the response that some students have to any form of testing, whether this testing is national or carried out by the school as part of its routine instructional practices. The extent of such responses among students is also somewhat under-researched, and has often been determined through seeking parents’ and teachers’ views on the proportion of students affected, and to what degree. Students’ voices have been far less frequently captured.
There is also a need for a much more nuanced understanding of why students respond as they do to testing. Missing in many of these debates on national testing is an understanding of how students think about testing, the stakes that are associated with various tests, the value that students place on doing well, and their own understanding of how likely they are to achieve a result that matters to them. Further, these values, expectations and levels of motivation are likely to link strongly to the types of emotional responses students have to testing. No matter what the testing program or situation, if a student does not value doing well in a test, they are unlikely to be very highly stressed by sitting it.
This study sought to examine and compare student responses to national tests and internal school tests, and to examine how the value they placed on doing well, their expectations to do well, and their levels of motivation for the tests were related to their emotional responses, within an Australian context. The first finding was that the negative emotional responses that have featured in international debates around national and state testing programs were in fact more likely to be experienced for internal school tests than for national tests. Students in our study were more likely to report both nervousness and feeling stressed prior to internal school tests than prior to NAPLAN. The most striking difference between student responses to the two forms of testing was that there was a much greater proportion of students reporting feelings of boredom in response to national testing than to internal school tests.
The study also considered positive emotional responses to testing, both for national and internal school tests, something that is not routinely covered in the extant literature. Significant numbers of students reported feeling enthusiastic or excited in response to testing, possibly because they enjoy the challenge, or because they are strong students who anticipate doing well and having a strong academic self-concept validated by their test results. These positive emotional responses were more frequent for internal school tests than for national tests, but suggest that for some students at least, testing may be a positive rather than negative experience.
As predicted by our application of expectancy-value theory, students who expected to do well in a test were more likely to report feeling excited, enthusiastic and confident, and students who placed a high value on doing well in a test were similarly more likely to report feeling excited, enthusiastic and confident. More concerning was the finding that students who were not expecting to do well, and those who placed a low value on doing well, were more likely to report feelings of boredom in relation to doing the test. It is possible that weaker students might be responding to their perceptions of their own academic capacity by devaluing doing well and emotionally switching off from an experience that might confirm any feelings of inferiority. This type of disengagement has the capacity to becoming a vicious circle of low performance leading to low motivation and lower future performance. Further research is needed to confirm if this is the case.
The study further found that students’ self-reported levels of effort were lower for national tests than they were for their school’s internal tests, which, together with large numbers of students reporting feeling bored in national tests, raises important questions about the positioning of such tests both in policy and in public debates. National and state standardised tests are frequently presented by politicians and the media as objective, reliable, and accurate, with the implication that school-level teacher-developed tests and teacher judgements about student progress are not, or at least not to the same degree. For example, the rationale for Scotland’s Scottish National Standardised Assessments (SNSA) program argues that they have been introduced to ‘provide teachers with objective [authors’ emphasis], comparable information about [student] progress’ (SNSA website, n. d.). Writers such as Au (2013) have noted how this positioning has the effect of reframing structural inequalities within education as being due to individual differences in merit. However, in addition to such concerns, the higher levels of boredom, and lower levels of effort for national tests than for their internal school tests that students reported in this study suggest that their achievement in national tests might potentially be a poor indicator of their actual level of ability. Depending on students’ beliefs around national and state tests, and they value they place on doing well, it may be that the results from supposedly objective externally-developed standardised national and state tests are in fact a less accurate indicator of students’ achievement levels than results from their internal, teacher-developed school tests.
Our research also found that some of the more extreme documented negative student emotional responses to national testing (for example, sleeplessness) may be limited to a relatively small group of students for whom both national and internal school tests are stressful experiences. Between 3 and 13% of students reported the strong negative emotional responses of sleeplessness, crying, freezing or feeling sick prior to NAPLAN tests, and similar (slightly lower) percentages were reported in response to internal school tests. This contrasts with some previous research indicating that large numbers of students are unduly distressed by national and state testing programs (see, for example, Howell, 2017; Rice et al., 2015), although the findings are in keeping with the work of Rogers et al. (2016), who found that only small numbers of students reported high stress levels for national tests. There are two potential reasons that might explain this discrepancy. First, as noted earlier, much of the research on student emotional responses draws on the perspectives of teachers, school leaders, psychologists and parents, but does not incorporate student views (see, for example, Heiser et al., 2015, cited in Simpson, 2018). It may be that adults overestimate the level of distress that these programs cause for the students (adults may particularly notice upset students and foreground these students in their thinking) or there may be sampling bias in that parents or teachers strongly against national and state testing may disproportionately volunteer to participate in research on the topic. Second, different national and state testing programs have different stakes attached to them. In some instances, stakes may be very low or not valued by students, which would suggest that students are unlikely to be distressed by the tests, while in other contexts in which the stakes for students are much higher and more highly valued by students (for example, a student who does not achieve highly enough might not be able to access a preferred learning stream such as extension mathematics) may potentially lead to much higher levels of student anxiety, nervousness, sleeplessness and so on. NAPLAN has relatively low stakes for students, so our findings may simply be a reflection of this.
This also suggests the need for further research on national and state testing programs that incorporates and critically examines the stakes attached to doing well in any testing program, and the value that is placed on those stakes by the full range of stakeholders. Often such research assumes that those involved in testing will value tests and the stakes associated with them equally, and will respond in similar ways. However, different stakeholder groups – students, parents, teachers, school leaders and policymakers – will have different stakes in the outcomes of these tests, and within each of these groups, the value placed on the stakes is likely to vary among individuals. How these stakes differ between stakeholders, the role that the value placed on stakes plays, and the effects of these aspects on responses to testing, often remain unexamined. There is a need to expand nuanced approaches that involve systematic examination of the stakes and the value placed on them to understand fully the impact of such programs on all involved.
The study also has some limitations that point the way to future research. The research was conducted with students in secondary schools, and there is some evidence that suggests that younger students, with a much less clear understanding of the stakes associated with tests and with less exposure to formal testing in their day-to-day school experience than older students, might be more strongly affected emotionally by national testing programs (e.g. Howell, 2017; Rice et al., 2015). Findings from this research need to be verified with a broader range of students, including students from both primary and secondary schools, as well as schools from various sectors, of differing sizes, and in diverse geographical locales. This would allow for a greater understanding of the nuances, and support generalisability to the broader population. In addition, future research should seek to include selective schools or schools with a competitive ethos where there may be additional expectations for students to perform well. More research is also required to determine whether these findings can be replicated across a range of schools with high or low ICSEA values. Such replication is important given that Thompson and Harbaugh (2013) report that teachers in low socio-economic status schools are more likely to see NAPLAN as having a negative impact on students. The low stakes associated with NAPLAN tests for students (but not for teachers and principals) in Australian schools also suggest that student responses, especially the extent of negative emotional responses to national tests, would differ, perhaps greatly, in states and countries where there are much higher stakes attached to doing well for the students. Again, these differences need to be explored in greater detail by subsequent research.
The study also found positive emotional responses among students to both NAPLAN and internal school tests. As we noted, such responses are not routinely explored in the literature on high-stakes testing. There is a need for further examination of these positive responses in broader samples and across age groups, and to clarify how they are related to the testing situation and the nature of the stakes for those being tested.
Finally, the study has implications for policymakers and schools. For schools, the findings indicate that there are some students, potentially a small group, that find formal testing situations – whether in national testing programs or during normal school testing of student learning – stressful and upsetting. The findings also suggest that for some lower achieving students, testing is associated with feelings of boredom and reported low effort, potentially leading to a cycle of lower student motivation, engagement and achievement. School psychologists and teachers need to be aware of such students and offer them appropriate support to minimise these effects, and the literature suggests a range of potential interventions (e.g. von der Embse et al., 2013). For policymakers, the findings suggest that some of the concerns about negative student emotional responses to testing might not hold, at least for older students in situations where the tests are low stakes for them.
This is not to say that there are not many valid reasons to question the use of high-stakes testing programs, as the literature documents many other negative impacts of testing programs. These include distortion of curricula and pedagogy (e.g. Avalos et al., 2020), the negative messages they send about trust in teachers (e.g. Vasquez Heilig et al., 2018) or their ability to mask such inequality by promoting notions of objectivity and merit (Au, 2013). Rather, the negative student emotional impacts generated by such testing might not, under some circumstances, be a major reason for their discontinuation.
Footnotes
Acknowledgments
This article reports on findings that arose from work undertaken as part of the first author’s Doctor of Education thesis. The authors would like to acknowledge the feedback of Professor David Gurr and Associate Professor Lawrie Drysdale in shaping this study and article.
Declaration of Conflicting Interests
The authors declared no potential conflicts of interest with respect to the research, authorship, and/or publication of this article.
Funding
The authors received no financial support for the research, authorship, and/or publication of this article.