
Abstract
This study analysed students’ attitudes towards school and the relationship between these attitudes and reading performance. Using a sample of 57,572 Year 7 and 9 students from 306 Victorian government schools, the analysis combined two de-identified data sets – students’ responses to the Student Attitudes to School Survey and their performance in NAPLAN reading assessments – from a single year (2017). The findings of this study demonstrate that a re-organisation of survey items into six new factors may represent student attitudes more usefully than the current 20-factor structure. Each of the six factors was found to relate to a set of demographic moderators. The results yielded statistically significant relationships between each attitude factor and reading achievement and growth. This study proposes a four-cluster model that groups schools with similar profiles across the six attitude factors. This model may improve the ability of the education system to interpret and analyse relative data and use these findings more effectively.
Keywords
Supporting children to read is a fundamental function of an education system. By the secondary stage of schooling the students’ capacity for learning relies on a certain level of reading that provides access to learning activities, materials and tasks required to succeed at school. Without these reading skills, students are less likely to complete school and/or make the same social and economic contribution as their reading-competent peers in later life. In Australia, for example, school disengagement is often a result of low reading ability (Reschly, 2010). This disengagement undermines student learning in many curriculum areas, reduces long-term economic growth and creates other financial costs (Shoghi, Willersdorf, Braganza, & McDonald, 2013). Student disengagement in school reduces long-term economic growth, creates an annual fiscal burden of $12.6 billion and costs individuals and the community $23.2 billion, at 2014 values (Lamb & Huo, 2017).
Students’ reading ability develops in stages as they move from decoding text to more complex comprehension. Children begin by learning to decode symbols of written text. To do this effectively, they first need to attain the alphabetic principal, that is, understanding that visual symbols in a writing system represent the sounds of spoken language (Castles, Rastle, & Nation, 2018). Once students can decode text into spoken language, they move to accessing whole words of written language. In this stage of reading, students move from understanding the meaning of a word by decoding its alphabetic elements to interpreting meaning from the printed word itself (Castles et al., 2018). Once they can quickly and easily understand the meaning of individual words, children move to the final phase of reading development – comprehending and analysing text. In this stage, often in curricula for elementary ages, readers can link information from the text with relevant background knowledge and construct meaning from a passage of writing (Castles et al., 2018). Reading attainment remains a problem for many young people, approximately 20% of 15-year-olds in Organisation for Economic Co-Operation and Development (OECD) countries do not attain a level of reading ability to participate productively and effectively in life (OECD, 2016).
Secondary schooling supports students to move to the final phase of reading development to understand, reflect and analyse text. The OECD provides a definition of reading literacy that highlights the complex skill-set that students draw on in this stage of their schooling. The OECD’s Program for International Student Achievement (PISA) tests 15-year-old students in ‘reading literacy’ which it describes as: ‘understanding, using, reflecting on and engaging with written texts, in order to achieve one’s goals, develop one’s knowledge and potential, and participate in society’ (OECD, 2017, p. 53).
A standardised reading test is undertaken by Australian school students as part of the National Assessment Program Literacy and Numeracy (NAPLAN). Students in Years 3, 5, 7 and 9 complete tests during a single teaching week in May each year. Tests cover the four ‘domains’ of reading, writing, spelling and grammar and numeracy. Results are provided to schools, made available online and published in the media (Johnston, 2017). NAPLAN testing has resulted in some unintended consequences, adversely impacting students and the curriculum while placing an emphasis test preparation in schools and third party providers of education resources (Senate Standing Committee on Education Employment and Workplace Relations, 2013). The intention of NAPLAN is to improve student outcomes, however the evidence to support a link between standardised testing and changes in teaching practice that improve learning outcomes is limited (Johnston, 2017). Using NAPLAN data as the basis for comparing individual schools is problematic (Brady, 2013); however, system-level aggregate data provide a useful indication of student attainment and growth (Senate Standing Committee on Education Employment and Workplace Relations, 2013).
Numerous factors affect student achievement and these factors are complexly interrelated (National Education Association, 2017). No single factor drives student achievement, instead a number of factors that Toshalis and Nakkula (2012) term a ‘web of causality’ interact in complex ways to support student learning. Student learning and the factors that support it interact in dynamic, multi-directional relationships rather than as a neat linear model of inputs, processes and outputs. Student attitudes to school are a part of this ‘web’. Attitudes may be described and defined in a multitude of ways in the research literature. In this study, we focus on the following attitude dimensions: cognitive engagement, social engagement, student–teacher relations, learner confidence and dispositions, student safety and low experience of bullying. Each of these have been related to student achievement in the research literature, and, importantly, each is a construct (or ‘parent factor’ in the language of the survey) of the Victorian Department of Education (DET) Attitude to School Survey (AtoSS), a key measure in this study. The constructs relate to DET’s Framework for Improving Student Outcomes and are based on ‘the best available evidence about what influences student outcomes’ (DET, 2018a). The following sections summarise the literature on each of these dimensions.
Cognitive engagement
The extent to which students feel cognitively engaged and challenged by school correlates with their achievement. Students are cognitively engaged in their learning when they demonstrate higher levels of self-regulation, feel more invested in their learning, seek more challenging tasks and feel they are working towards achieving mastery (Fredricks, Blumenfeld, & Paris, 2004). Cognitive engagement may be a mediator of academic achievement as it precedes changes in students’ achievement in school (Reschly & Christenson, 2012). Students with higher levels of cognitive engagement are more likely to sustain their engagement with school over time (Huston & Ripke, 2006) and perform better academically (Finn & Zimmer, 2012).
Social engagement
Student learning occurs in a social context that sees young people interact and form relationships with their peers, this is particularly the case during secondary school. The extent to which students feel social engagement and belonging is important for their academic achievement. A number of components contribute to social engagement, including the extent to which students adhere to social norms, their explicit feeling of connectedness to school, the extent to which they feel they have voice and agency in their learning, and whether they feel engaged or included by their teachers (Gonzalez & Padilla, 1997; McNeely, Nonnemaker, & Blum, 2002). Toshalis and Nakkula (2012) claimed that when given more control, choice, challenge and opportunities to collaborate, students are more likely to improve their achievement, participate in class and engage in self-reflection, while less likely to exhibit problem behaviour.
Teacher–student relations
The relationships teachers build with students support student achievement. In a study of the relationship between school size and achievement, Crosnoe, Kirkpatrick Johnson, and Elder (2004) found the presence of a positive interpersonal climate, characterized by positive student-staff relationships was a major variable explaining achievement differences between schools. Hamre and Pianta (2005) showed that where student–teacher relationships provided students with high levels of instructional and emotional support, student achievement and behaviour improved. In a meta-analysis of 119 different studies, Cornelius-White (2007) concluded that the strongest relationship was between teacher–student relations and critical and creative thinking outcomes. In its analysis of behavioural elements, the meta-analysis also showed a strong positive relationship between teacher–student relationships and participation in schooling (Cornelius-White, 2007).
Learner confidence and disposition
Learner confidence, or self-efficacy, contributes to student achievement. In his social cognitive theory of human functioning, Bandura (1977, 1986) introduced the concept of self-efficacy and linked it to self-regulation and cognitive function. Bandura (1993) further argued that students with high efficacy are more likely to achieve academically, become engrossed in activities, set and pursue challenging goals, respond more productively to failure, and are less likely to be stressed or depressed than those with a low-efficacy outlook. This suggests that teachers play an important role in building students’ confidence in meeting the expectations of the lesson. Pajares and Schunk (2002) argued that students’ self-efficacy beliefs best determined how much time they spend on a task, how long they persevered with challenges and how resilient they were.
Student safety and experience of bullying
Feeling safe at school allows students to concentrate on learning (Bryk, Sebring, Allensworth, Easton, & Luppescu, 2009). Bullying, or peer victimisation, significantly undermines students’ feelings of safety. Berkowitz (2013) argued that bullying victims’ feelings of security are significantly lower than their peers, as are their feelings of teacher support. Bullying also correlates with a reduction in attendance rates for students (Ladd, Ettekal, & Kochenderfer-Ladd, 2017). Research suggests a relationship between student wellbeing and academic performance (Quinn & Duckworth, 2007). In its assessment of Grade 4 students, PIRLS shows that reading achievement is negatively related to bullying with ‘students who are bullied about weekly scoring on average 38 points lower than those who are almost never bullied’ (Thomson, Hillman, Schmid, Rodrigues, & Fullarton, 2017, p. 62).
Using student attitude surveys to measure factors supporting achievement
Student perceptions are the thoughts, beliefs and feelings that students have about people, situations and events (Schunk & Meece, 1992). Students are the ‘central participants in classroom interactions’ and therefore provide important views about what they perceive supports learning in an effective classroom environment (Egeberg & McConney, 2017, p. 196). It is the student’s perceptions of their social and cognitive engagement, relations with teachers, confidence as learners, and their experiences of safety and bullying that matter. Accordingly, it is important to understand these perceptions.
One purpose of this study is to quantify the relationship between different elements of student attitudes data and reading achievement to identify the things that most strongly relate to student achievement. While this is not a new area of research, this study focused on using measures that are already conducted in Victorian schools and used for reporting purposes. A related purpose was to evaluate the attitude factors for the influence of various moderators (sex, year level, language background, indigeneity, parent education. A secondary purpose of this work is to understand the reliability of the AtoSS so more informed decisions can be made by policy makers, system-level agents and school leaders. AtoSS results are provided to regions and schools in Victoria using question-level and factor-level numerical results. Providing stakeholders with a greater understanding of factor-level reliability, and alternative ways of organising questions within factors may support more effective decision-making at the system, regional and school levels. Finally, more appropriate score reporting of the AtoSS is discussed with the intent to improve the readability and maximise the interpretations of the various scales.
Methodology
Sample
This study draws on two data sets relating to the same group of Year 7 (age 12–13) and Year 9 (age 14–15) students, containing their performance in NAPLAN reading assessments and their responses to the AtoSS. The data were generously provided by the Victorian Department of Education (DET). DET expects that all Victorian Government secondary students in Years 4 through 12 complete the AtoSS in a given year. This study draws on data for Years 7 and 9 students who completed the survey online in 2017. There were responses for the AtoSS from 29,771 Year 7 students and 27,801 Year 9 students, and this represents a participation rate of 81% of Year 7 and 87% of Year 9 students. DET advised that much the missing data occurred through the matching process of the two data files but were unable to provide more information about the causes of matching issues.
Students came from 199 secondary schools (Years 7 to 12), and 74 combined primary and secondary schools. The students came from all four regional locations of Victoria (North eastern, North western, South eastern and South western). In Victoria, schools are classified on an equity scale based on their level of disadvantage that ‘provides an individual loading for students from disadvantaged backgrounds that will increase with the density of disadvantage at the school’ (DET, 2018b). The social disadvantage loading considers parental occupation and education levels in an index called the Student Family Occupation and Education (SFOE) index. A lower loading on this index represents low levels of social disadvantage while a high loading represents high levels of disadvantage. Schools in the sample ranged from .16 (lowest disadvantage) to .73 (highest disadvantage), with a mean of .47 (SD = .12), with enrolment numbers that ranged from 5 to 613 students (i.e. combined Year 7 and 9 enrolments) with a mean of 193 students.
For the NAPLAN data, the sample of this study includes 77,005 students from 306 Victoria schools, from Year 7 (N = 38,611) and Year 9 (N = 38,394). The regions were approximately equal in the number of students (North east 24%, North west 22%, South east 22%, and South west 32%). Of those students, 48% were female, and 52% male, 32% (N = 25,076) were classified as Language Background other than English (LBOTE), and 2.3% (N = 1,806) identified as Aboriginal or Torres Strait Islanders (ATSI). The Parental highest level of education included 7% with Year 9 or below, 7% Year 10, 6% Year 11, 11% Year 12, 28% Cert I-IV, 16% Advanced Diploma, and 25% BA or higher. Altogether, there were 52,270 students who completed both the AtoSS and NAPLAN.
Measures
The AtoSS provides data on student opinions about school and is used to support schools with student wellbeing, engagement, school improvement and planning. Most survey items use a five-point Likert response scale whereby 1 = ‘Strongly disagree’, 2 = ‘Disagree’, 3 = ‘Neither agree nor disagree’, 4 = ‘Agree’ and 5 = ‘Strongly agree’. The five items the Experience of Bullying component of the survey use a ‘yes/no’ scale.
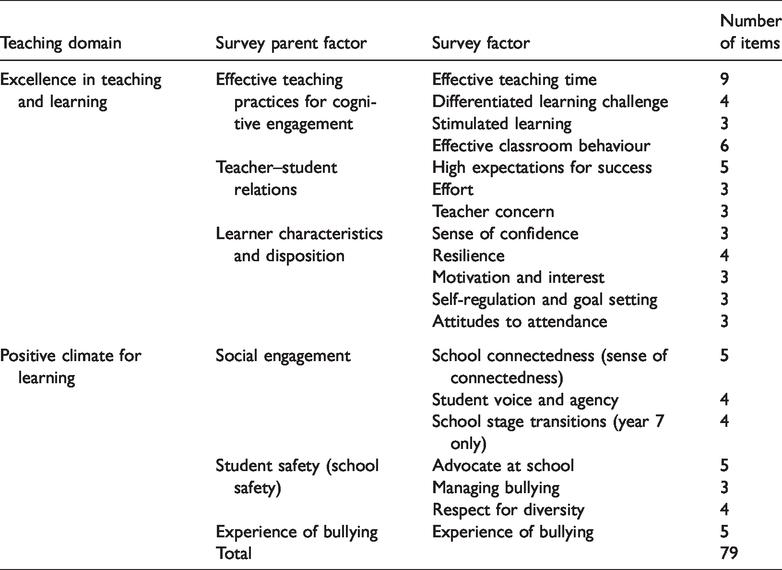
While the AtoSS has run for a number of years, its items and structure were ‘refreshed and validated’ prior to its migration to an online platform (DET, 2017). A theoretical framework of ‘domains’ and ‘constructs’ was developed by DET to support the redesign of the survey. The Australian Council for Educational Research (ACER) led the survey re-development and validation process prior to the 2017 survey year. ACER began by establishing the content validity of the survey framework developed by DET, before conducting a literature review to develop definitions of proposed survey constructs. ACER then selected items from existing surveys, collating over ‘700 items from international surveys and scales to select relevant items for each measure’ (DET, 2017). Before inclusion, each item was considered on its reliability in previous research, evidence of ‘discriminant, convergent and content validity from existing data’ and whether the content and wording of an item was age-appropriate (DET, 2017). In its final form for 2017, the survey was organised around two Domains of the DET Framework for Improving Student Outcomes. Table 1 shows how these domains house the ‘parent factors’ and ‘factors’ of the survey.
The Student Attitude to School Survey framework and items (DET, 2018c).
NAPLAN reading assessments test students’ ability to make meaning from written texts (Australian Curriculum, Assessment and Reporting Authority (ACARA), 2017). To cater for a spread in reading abilities, tests begin with short, simple texts and become more complex. Tests include three text types – imaginative, informative and persuasive. Students are provided with a ‘magazine’ containing a range of texts illustrating different writing styles. Students are given 65 minutes to read the texts and select answers from multiple choice options in a separate booklet. Scores are scaled to allow comparisons over time.
ACARA reports student growth using a ‘relative growth’ approach by measuring the change in results between tests, relative to ‘similar students’ – that is, students with the same NAPLAN score two years prior. In this analysis students were grouped by growth in the 2017 reading test, based on the test they sat two years earlier (for Year 7 students, the 2015 Year 5 test and for Year 9 students, the 2015 Year 7 test.) The available data did not include students’ actual results from the NAPLAN test two years prior, only their assignment to one of three possible ‘growth cohort’ categories. Students in the ‘high growth’ group have growth levels in the top 25% of similar students, students with ‘medium growth’, in the middle 50% and students with ‘low growth’ in the lowest 25% of similar students.
Data from the AtoSS were analysed using maximum-likelihood factor analyses with oblique rotation (Promax) to identify the best subset of items that load on defensible and interpretable factors. A correlated solution was used as it is most unreasonable to expect the factors to not correlate, and it is also, whilst desirable, not reasonable to force items to load primarily only on one factor. Then estimates of reliability (Cronbach’s alpha) were calculated. Multivariate Analyses of Variance (MANOVA) were used to explore group differences based on the identified factors. Given the sample size is so large, p < .001 was used as the desirable alpha threshold. To ensure that significant effects of worthwhile magnitude were interpreted, the study only considered effect sizes greater than .20 in its analysis (Cohen, 1962; Sawilowsky, 2009). Where there were significant effects, a univariate analysis of variance (ANOVA) was used for each factor to identify which most contributed to these overall effects. Correlations were used to relate the various factors to the NAPLAN reading and progress measures. A cluster analysis at the school level, with its associated dendogram, was used to see identifiable and meaningful clusters of schools could be identified based on school-level profiles on the AtoSS factors.
Results
Factor structure of the AtoSS
|The maximum-likelihood factor analysis identified six factors based on 55 of the 75 items for Year 9 and 56 of the 79 items for Year 7 (the four additional items in the Year 7 survey relate to school transitions). These factors explained 49% of the common variance. Table 2 shows the loadings for each item against the six factors proposed in this study, and the location of each item in the original structure of the AtoSS. The following labels were assigned to the factors: Effective Teaching Practices, Learner Characteristics and Disposition, School Connectedness, Advocate at School, Experience of Bullying, and High Expectations for Success.
Factor loadings for the AtoSS items.
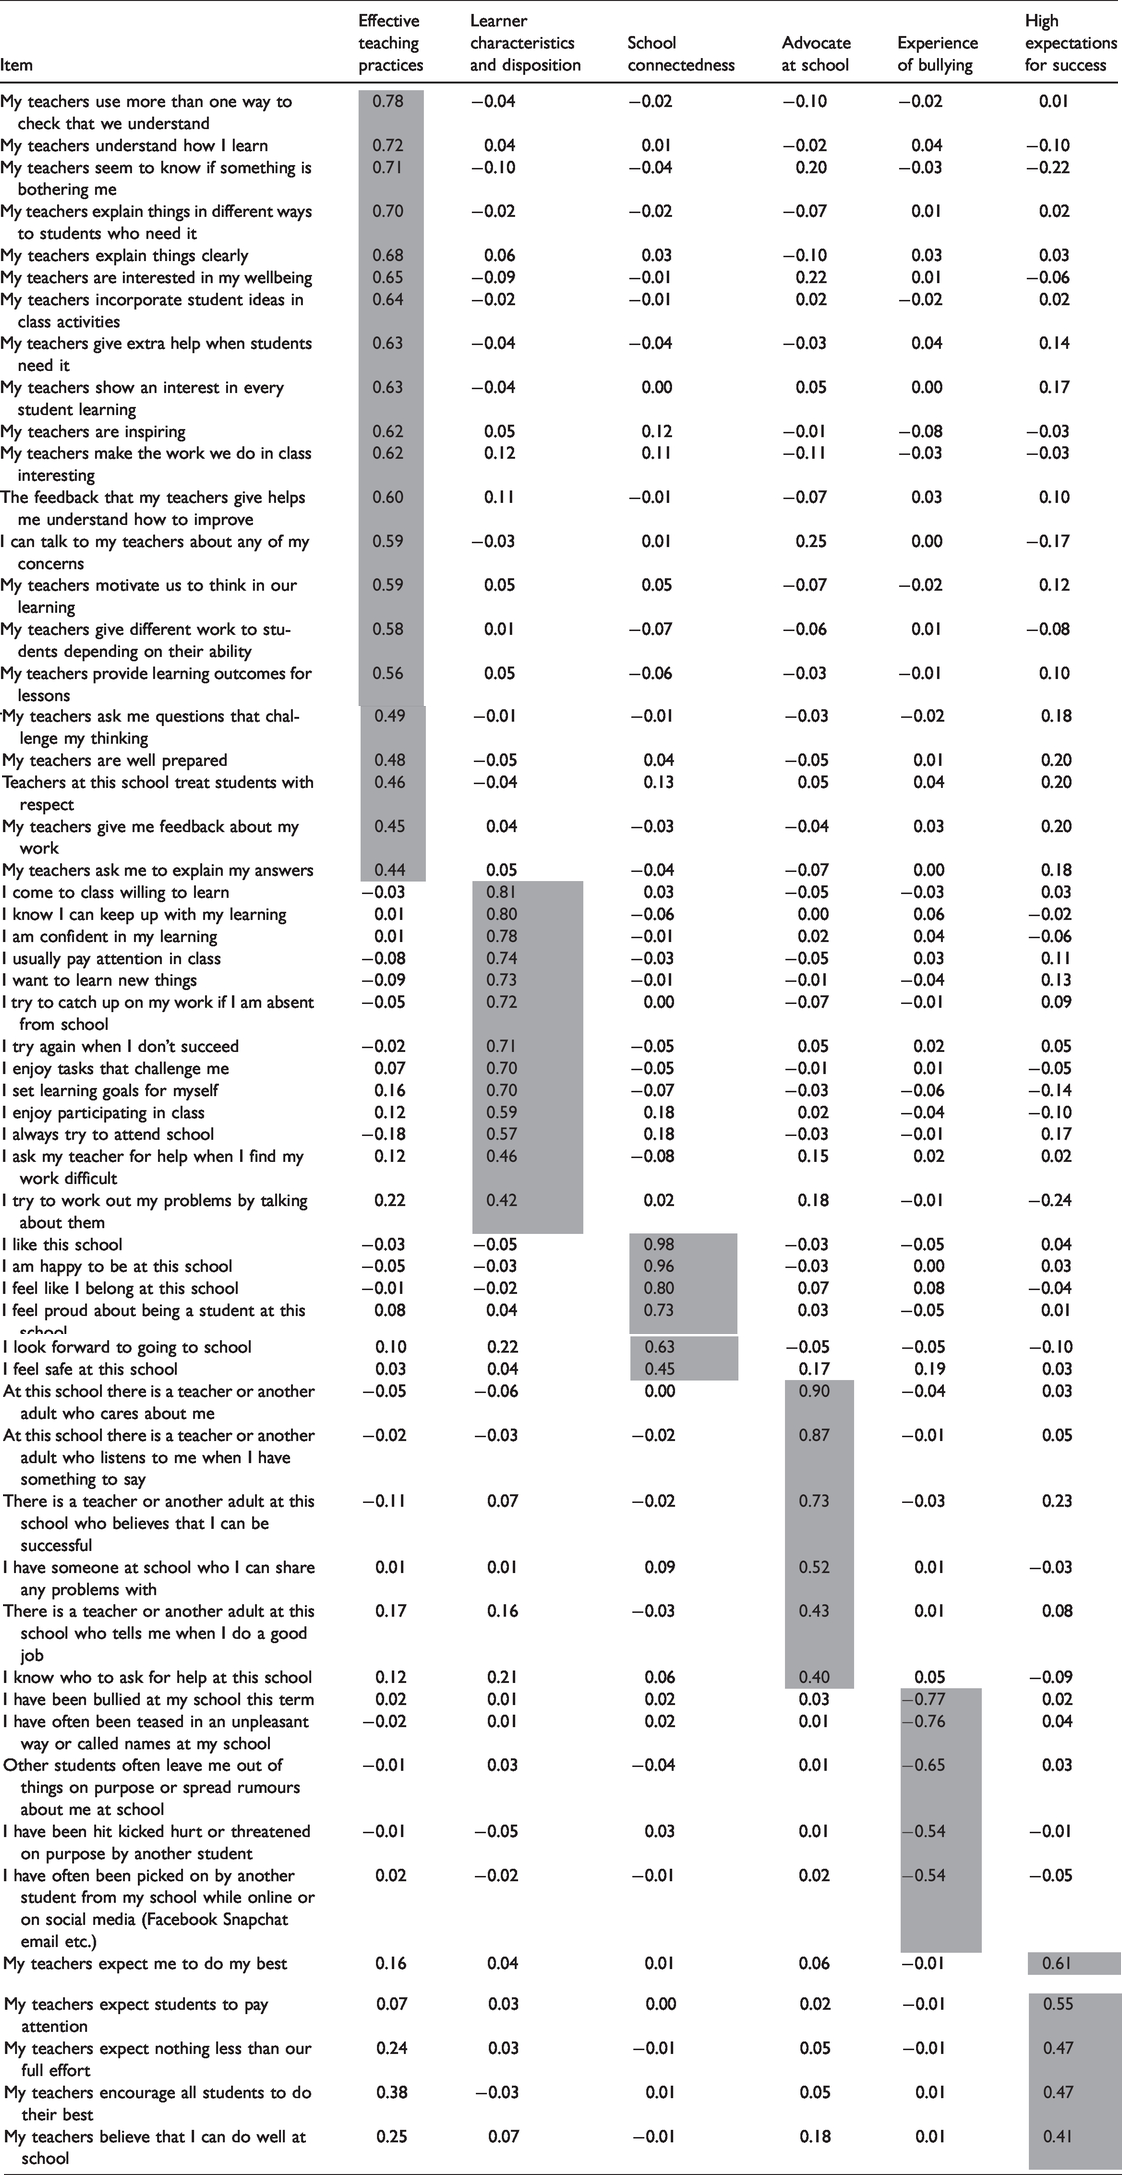
Effective Teaching Practices includes items that ask students how effective they feel their teachers are at checking for understanding, building relationships with students, maintaining a productive classroom culture and providing cognitive challenge. Learner Characteristics and Disposition relates to teacher–student relations, student thinking strategies, learner confidence, engagement, and attitudes that influence how they engage with and persist with learning. The Advocate at School factor includes items that ask students to consider whether they can identify an adult at school who they have a positive or productive relationship with. High Expectations for Success relates to students’ perspectives on the expectations that their teachers have them to do their best at school.
Two factors were identified that related to students’ experiences of safety in the school environment – School Connectedness and Experience of Bullying. The School Connectedness factor includes items about safety, and students’ feelings of connection to their school. The Experience of Bullying factor focuses on whether students have been bullied in the last term, how, and how often. Items in the School Connectedness factor all include the phrase ‘this school’ distinguishing these items from the other student safety items found in the Experience of Bullying factor, which remain more about personal experiences with bullying.
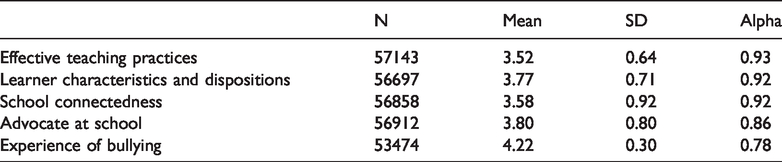
The descriptive statistics and estimates of reliability (coefficient alpha) for each of the six calculated factors were sufficiently high to allow for meaningful exploration of mean differences (Table 3).
Means, standard deviations and estimates of reliability (alpha) for the attitude scales.
Moderator effects and attitude factors
There were statistically significant differences across the six attitude factors for the interaction between Sex and Year Level (Year: Mult F = 727, df = 6, 52,638, p < .001; Sex: Mult F = 121, df = 6, 52,638, p < .001; Year * Sex: Mult F = 18, df = 6, 52,638, p < .001). All but Experience of Bullying and High Expectations for Success contributed to this interaction effect. Year 7 students had higher means in all cases than Year 9 students, whereas the differences between males and females are relatively small. There were no effects for Experience of Bullying for Year level (d = .04) or for Sex (d = . 01); but there were main effects for High Expectations for Success for Year level (F= 2,479, df = 1, 52,643, p < .001, d = .46 – Year 7 had higher expectations than Year 9) and for Sex (F = 218, df = 1, 52,643, p < .001, d = .13 – females had higher expectations than males).
There were statistically significant differences across the six attitude factors for Language Background (Mult F = 145, df = 12, 106,620, p < .001), Indigeneity (Mult F = 14, df = 12, 166,620, p < .001), and Parent Education (Mult F = 47, df= 12, 106,620, p < .001). LBOTE students had higher means on all attitude factors, and Indigenous Australian students had lower means on Learner Characteristics and Disposition, School Connectedness and higher means on Experience of Bullying, but had similar scores on Effective Teaching Practices and Advocate at School to their non-Indigenous peers.
NAPLAN achievement and reading gain
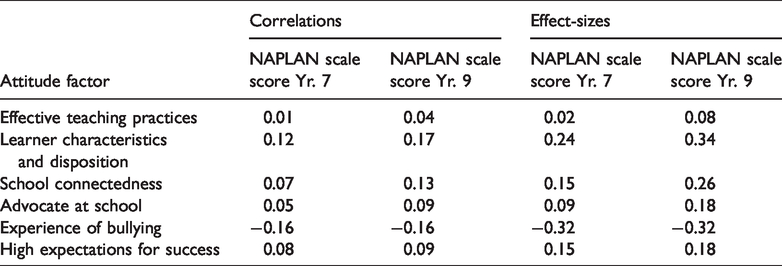
In terms of the first research goal, there were statistically significant correlations with the six attitude factors and the NAPLAN reading scale scores although the magnitude of the correlation is small (Table 4). Learner Characteristics and Disposition and Experience of Bullying had the largest correlations, followed by School Connectedness and Advocate at School.
Relationship between attitudes and NAPLAN scale scores.
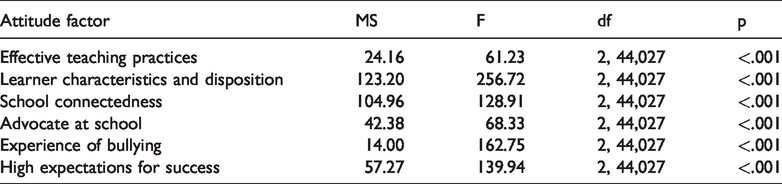
There were overall statistically significant differences between the six attitude factors and gain in NAPLAN over the past two years as shown in Table 5 (Wilks Lambda = .98, Mult F = 68.03, df = 12, 99,044, p < .001). All six factors contributed significantly to this overall difference. All factors differentiated between the low and high gainers in NAPLAN, and these effects were similar in magnitude to the correlations with the reading scale scores (see Table 4).
Relationship between attitude factors and NAPLAN relative growth.
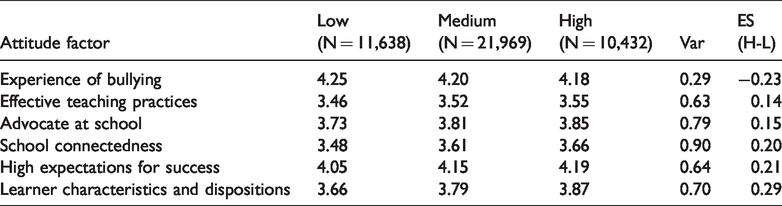
Students who gained more over the previous two years also tended to be students who were bullied less, felt more connected to school and reported higher levels of motivation, resilience and other dispositional factors. These students also felt their teachers were effective, acted as advocates for them and their learning and held high expectations for their success. Table 6 shows the mean attitude response for each factor by the three growth groups of students. Note, a high score on bullying means high levels of bullying).
Mean attitude score by growth cohort.
Based on the items within each of the six attitude factors proposed in this study, Figure 1 categorises each factor into three categories – factors with items that ask students to reflect on themselves (student focused), factors with items that ask students to reflect on their school (school focused) and, factors with items that ask students to reflect on the practices of their teachers (teacher focused) – note two factors qualify for two categories. Figure 1 also ranks the factors by the average effect size they have in terms of NAPLAN reading performance across Years 7 and 9.
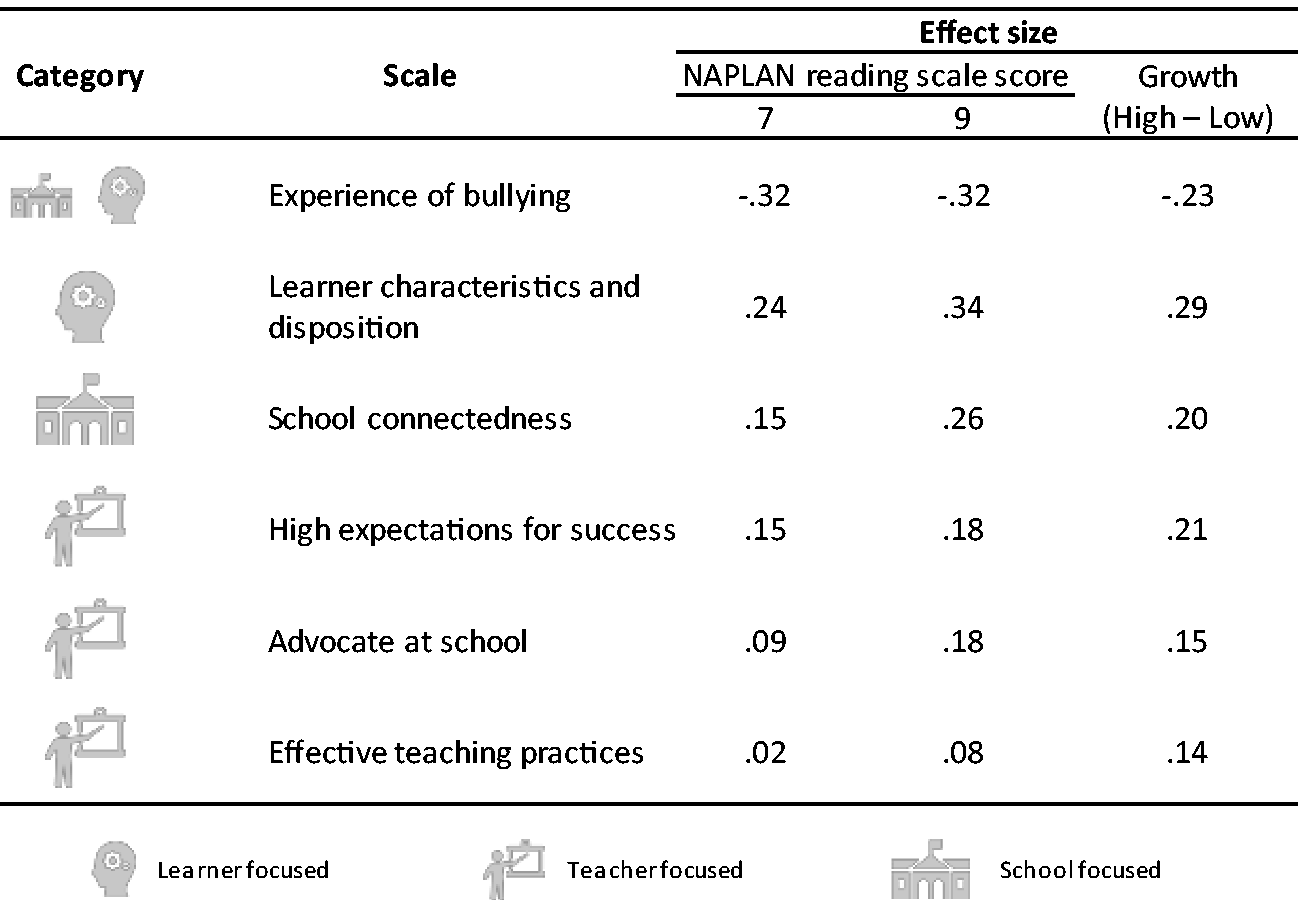
Attitude factor effect sizes in terms of achievement and gain.
Clustering schools
A cluster analysis was used to assist in creating groups of schools with similar profiles across the six attitude factors. A dendogram showed four identifiable clusters, moving from lowest score across the six factors (Cluster 1) to highest (Cluster 4; Figure 2). For five of the factors, the mean factor score increased across the clusters in line with their numeric value (i.e. increasing from Cluster 1 to Cluster 2, etc.) while the Experience of Bullying factor score moved inversely with cluster number (as expected given its reverse coding). Figure 2 shows these relationships graphically.
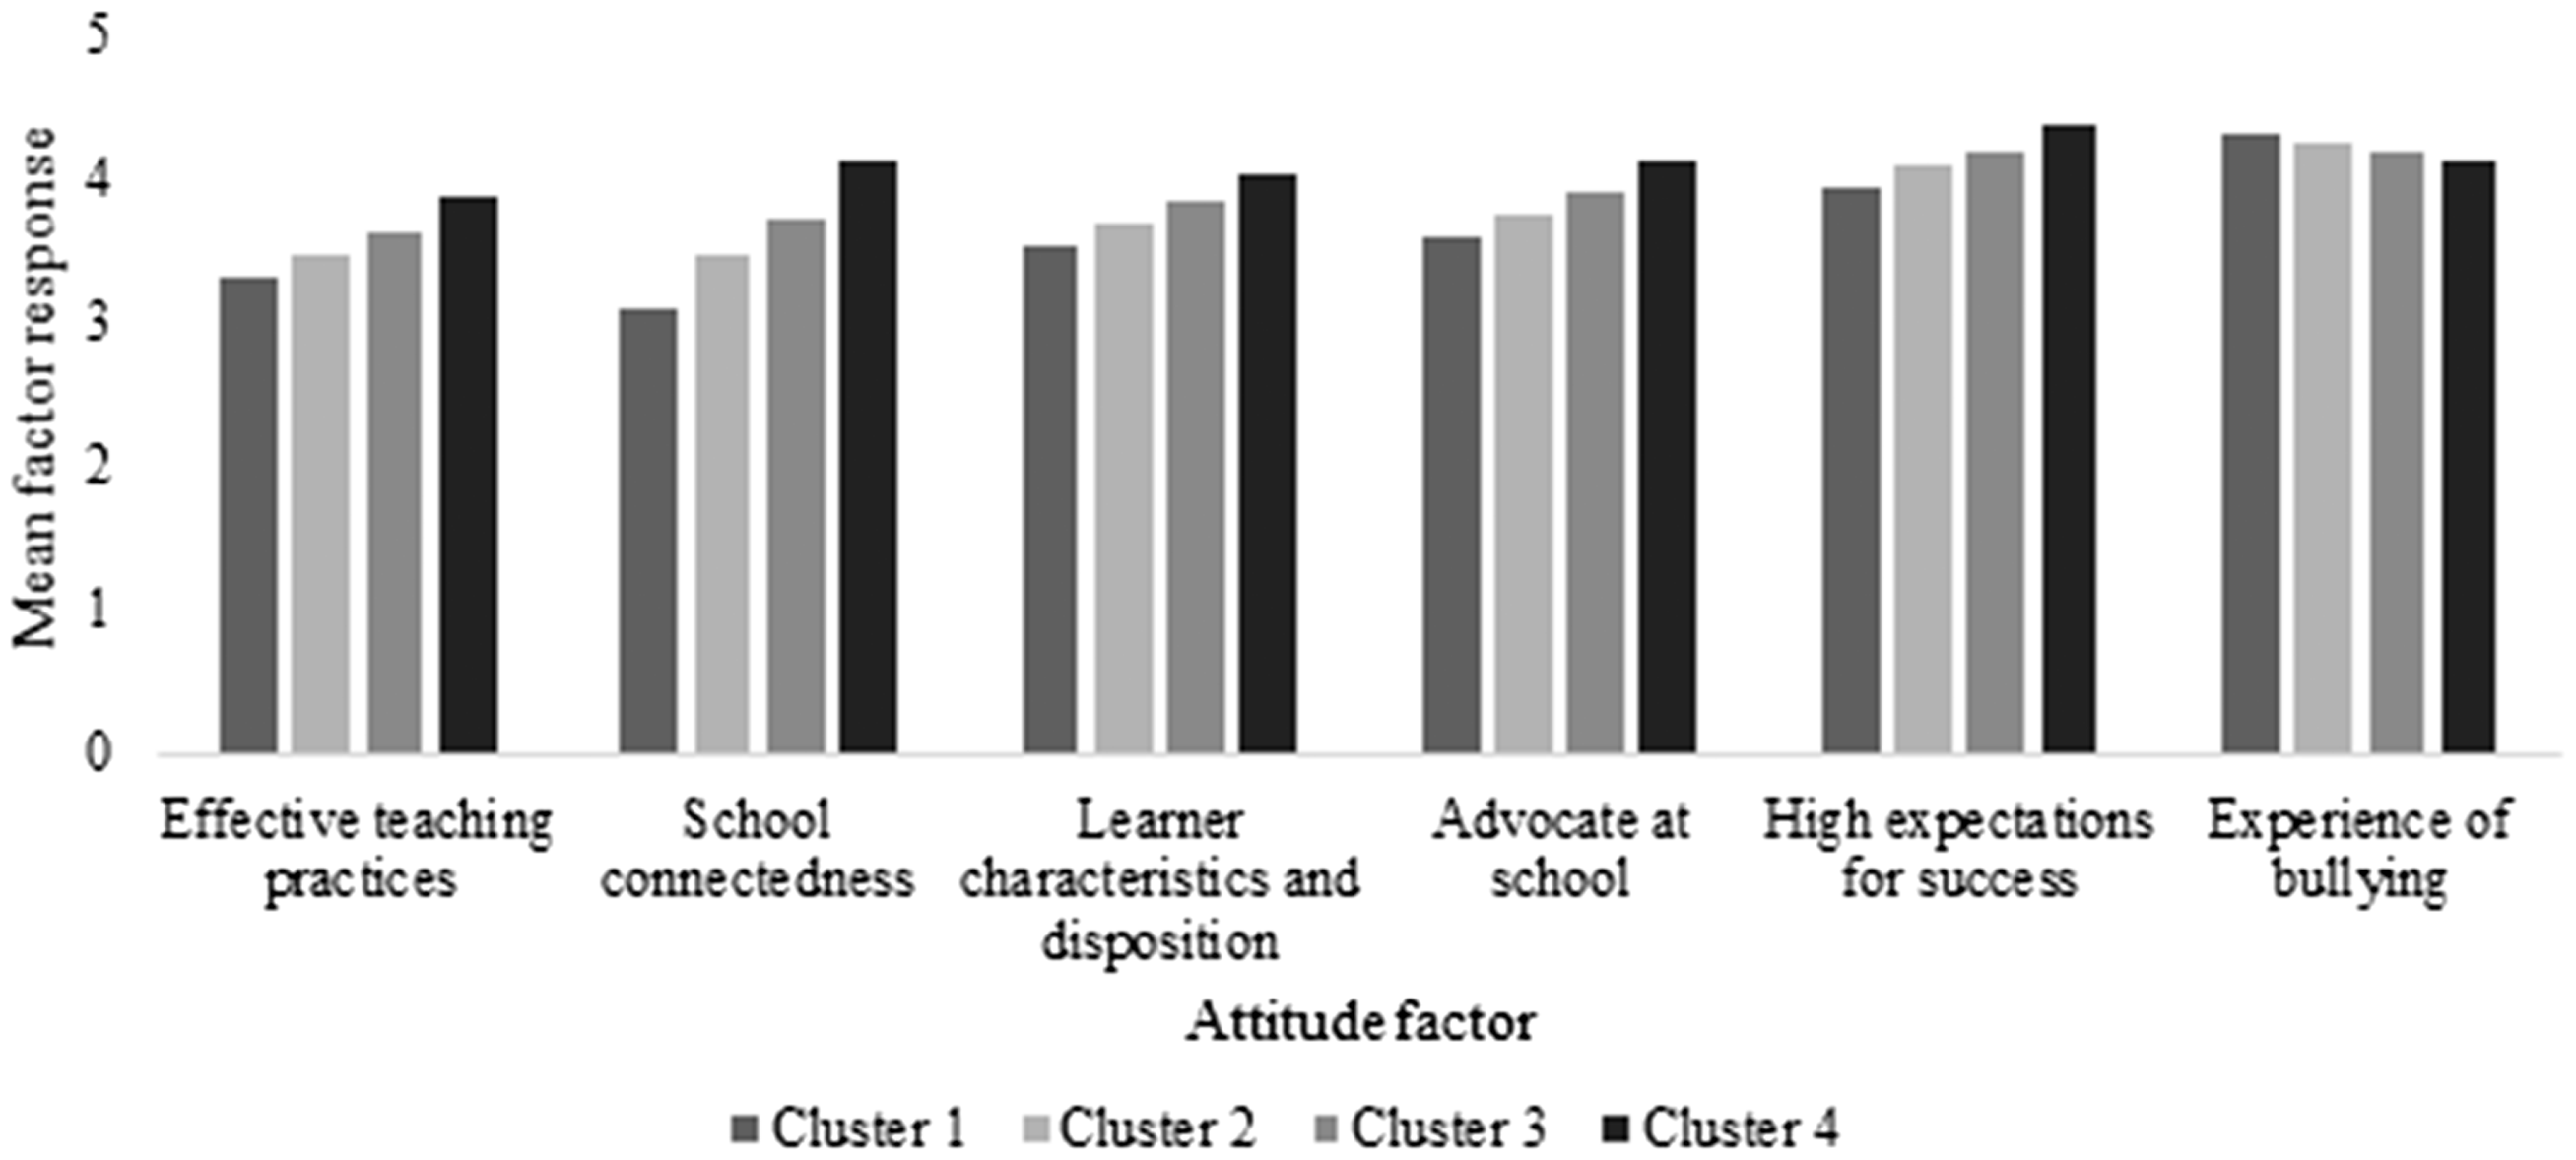
Mean factor score by cluster.
These four clusters were unrelated to school type (combined primary+secondary or secondary only: chi-square = 7.80, df = 6, p = .254) or regional location of the school (chi-square = 9.97, df = 9, p = .362). There was a statistically significant relationship between membership in the four clusters and socio-economic classification of the school (F = 8.00, df = 3,267, p < .001), meaning that SFOE was higher in Clusters 1 and 2 (schools with high levels of disadvantage), and lowest in Clusters 3 and 4 (schools with low levels of disadvantage). Among the clusters, there were also differences related to NAPLAN in Years 7 and 9 and the gain measure (Wilks Lambda = .826, Mult F = 4.16, df= 12, 667, p < . 001). The NAPLAN reading and gain were higher in Clusters 3 and 4 than in Clusters 1 and 2. Thus, it seems that some schools (cluster 3 and 4) who start with students from higher socio-economic families have both higher average NAPLAN scores, and higher value-added or gain scores.
Discussion and conclusions
The goal of this study was to analyse students’ attitudes to school and evaluate the link between these attitudes and reading achievement, to evaluate the influence of various moderators, and to understand the properties of the Attitude to School scale. As ‘central participants in classroom interactions’ students provide important and useful perspectives about what shapes their experiences at school (Egeberg & McConney, 2017, p. 196). This study analysed data from more than 77,000 2017 Year 7 and 9 students in Victorian government schools. Six factors measured different elements of students’ attitudes with high reliability: Effective Teaching Practices, Learner Characteristics and Disposition, School Connectedness, Advocate at School, Experience of Bullying and, High Expectations for Success.
Student attitudes are important for reading achievement
The results of this study show that for Year 7 and 9 students in 2017, there was a positive relationship between five factors of student achievement and students’ performance in NAPLAN reading, and a negative relationship between students’ Experience of Bullying and the NAPLAN reading achievement. More importantly, there were positive correlations between gains in reading achievement and attitudes to school – those who made the greatest reading gains were those with more positive attitudes to school. Surveys of student attitudes are a measure of student voice and this finding reaffirms the relevance of student voice to achievement. Students are the ‘end-user’ of all activities that schools undertake – including their views and perceptions should underpin effective school decision making. When adults in schools incorporate student voice in decision making it improves students’ self-concept and encourages achievement, participation and self-reflection (Morgan & Streb, 2001; Toshalis & Nakkula, 2012).
The finding that the relationship between the Experience of bullying factor and reading achievement and reading gain was one of the stronger relationships is of particular note. The idea that students who experience higher levels of bullying struggle with reading achievement is not a new finding (Thomson et al., 2017), but it is interesting to note that when averaged across Years 7 and 9, this factor had the strongest relationship with how students perform on the NAPLAN assessment. Many schools embark on projects to improve reading achievement, but not all would consider an effective bullying strategy and actions as being an important component of their ‘must-have’ list. An area for further work is to evaluate the extent to which school and system level reading improvement initiatives need to include a focus on issues like bullying and teacher relationships, which correlate with reading achievement; and whether such inclusions can improve the efficacy of reading interventions. Additional work to analyse the direction of causality in the relationship between these factors and achievement may be an important next step.
The moderator analyses showed an interaction between sex and year level for each of the six factors of student attitudes. Year 7 students had higher mean results on all six attitude factors than Year 9 s, and Year 7 females had higher means than their male peers. Three of the attitudes factors (Effective Teaching Practices, Learner Characteristics and Dispositions and School Connectedness) contributed most to these overall significant interactions between year level and sex. Students with a LBOTE status had higher attitude means across all factors while Indigenous students had lower means on three of the factors (Learner Characteristics and Disposition, School Connectedness, and higher perceptions of Experience of Bullying). In all factors, student attitudes were higher for students whose parents had higher than a CERT IV qualification and above compared to those who left during or at the end of secondary school.
What these findings also reinforce is that student learning is not a linear process resulting from a single input like effective teaching. Instead it is more useful to think of student learning occurring in the ‘web of causality’ described by Toshalis and Nakkula (2012) with the factors that support achievement interacting in complex, dynamic and multi-directional ways.
It is important to recognise the limitation that this study cannot determine the causal relationship between attitudes and achievement. Willms (2003) provides three plausible descriptions of the relationship between student engagement and achievement – student attitudes are one measure of engagement and the descriptions can be extended to cover the relationship between attitudes and achievement. The first model proposes that attitudes precede achievement – students first become disengaged from school and develop negative attitudes, as a result, they experience declines in their academic achievement. The second description is that achievement precedes attitudes – students who experience lower levels of achievement are less likely to feel engaged and positive towards their schooling. The final model proposes that numerous other things, including individual, environmental and relational factors, jointly influence achievement and student attitudes. Further work can be done in this area to understand more about which model is most relevant when describing the relationship between students’ attitudes and their reading achievement.
A secondary goal of the study was to explore different ways in which results of the AtoSS could be summarised and communicated to schools. The first method classified the six factors identified in the earlier analysis based on the focus of contributing items – student-focused, teacher-focused and school-focused. It is interesting to note that the three ‘teacher focused’ factors had the lowest average effect size of the six factors, and the ‘student-focused’ factors supporting learning the highest. This does not necessarily suggest teachers’ pedagogical practices are not important for student learning, instead it suggests effective pedagogy is best implemented alongside positive relational factors captured in the High Expectations for Success and Advocate at School factors. These findings speak to the complex and dynamic environment in which student learning occurs and show that it is students’ perceptions of teacher practice, not the practices themselves, that really matter for student learning. In this sense, it seems it is not the ‘intended’, or even the ‘enacted’ practices of teachers that matter most for student learning: rather, it is the ‘student-experienced’ teacher practices reflected in student attitudes that are most important.
Another way of optimising the way schools see and use AtoSS data is to use the school’s membership in one of the four clusters, identified in the cluster analysis, to give a ‘big picture’ interpretation of the school’s performance. It may be beneficial to show schools how their AtoSS data are positioned relative to the other schools with similar attitude data and relative to the other clusters schools. Figure 3 provides an illustrative example of one way schools could be given an ‘at-a-glance’ view of their schools’ AtoSS results, where each factor mean can be compared to the four cluster means.
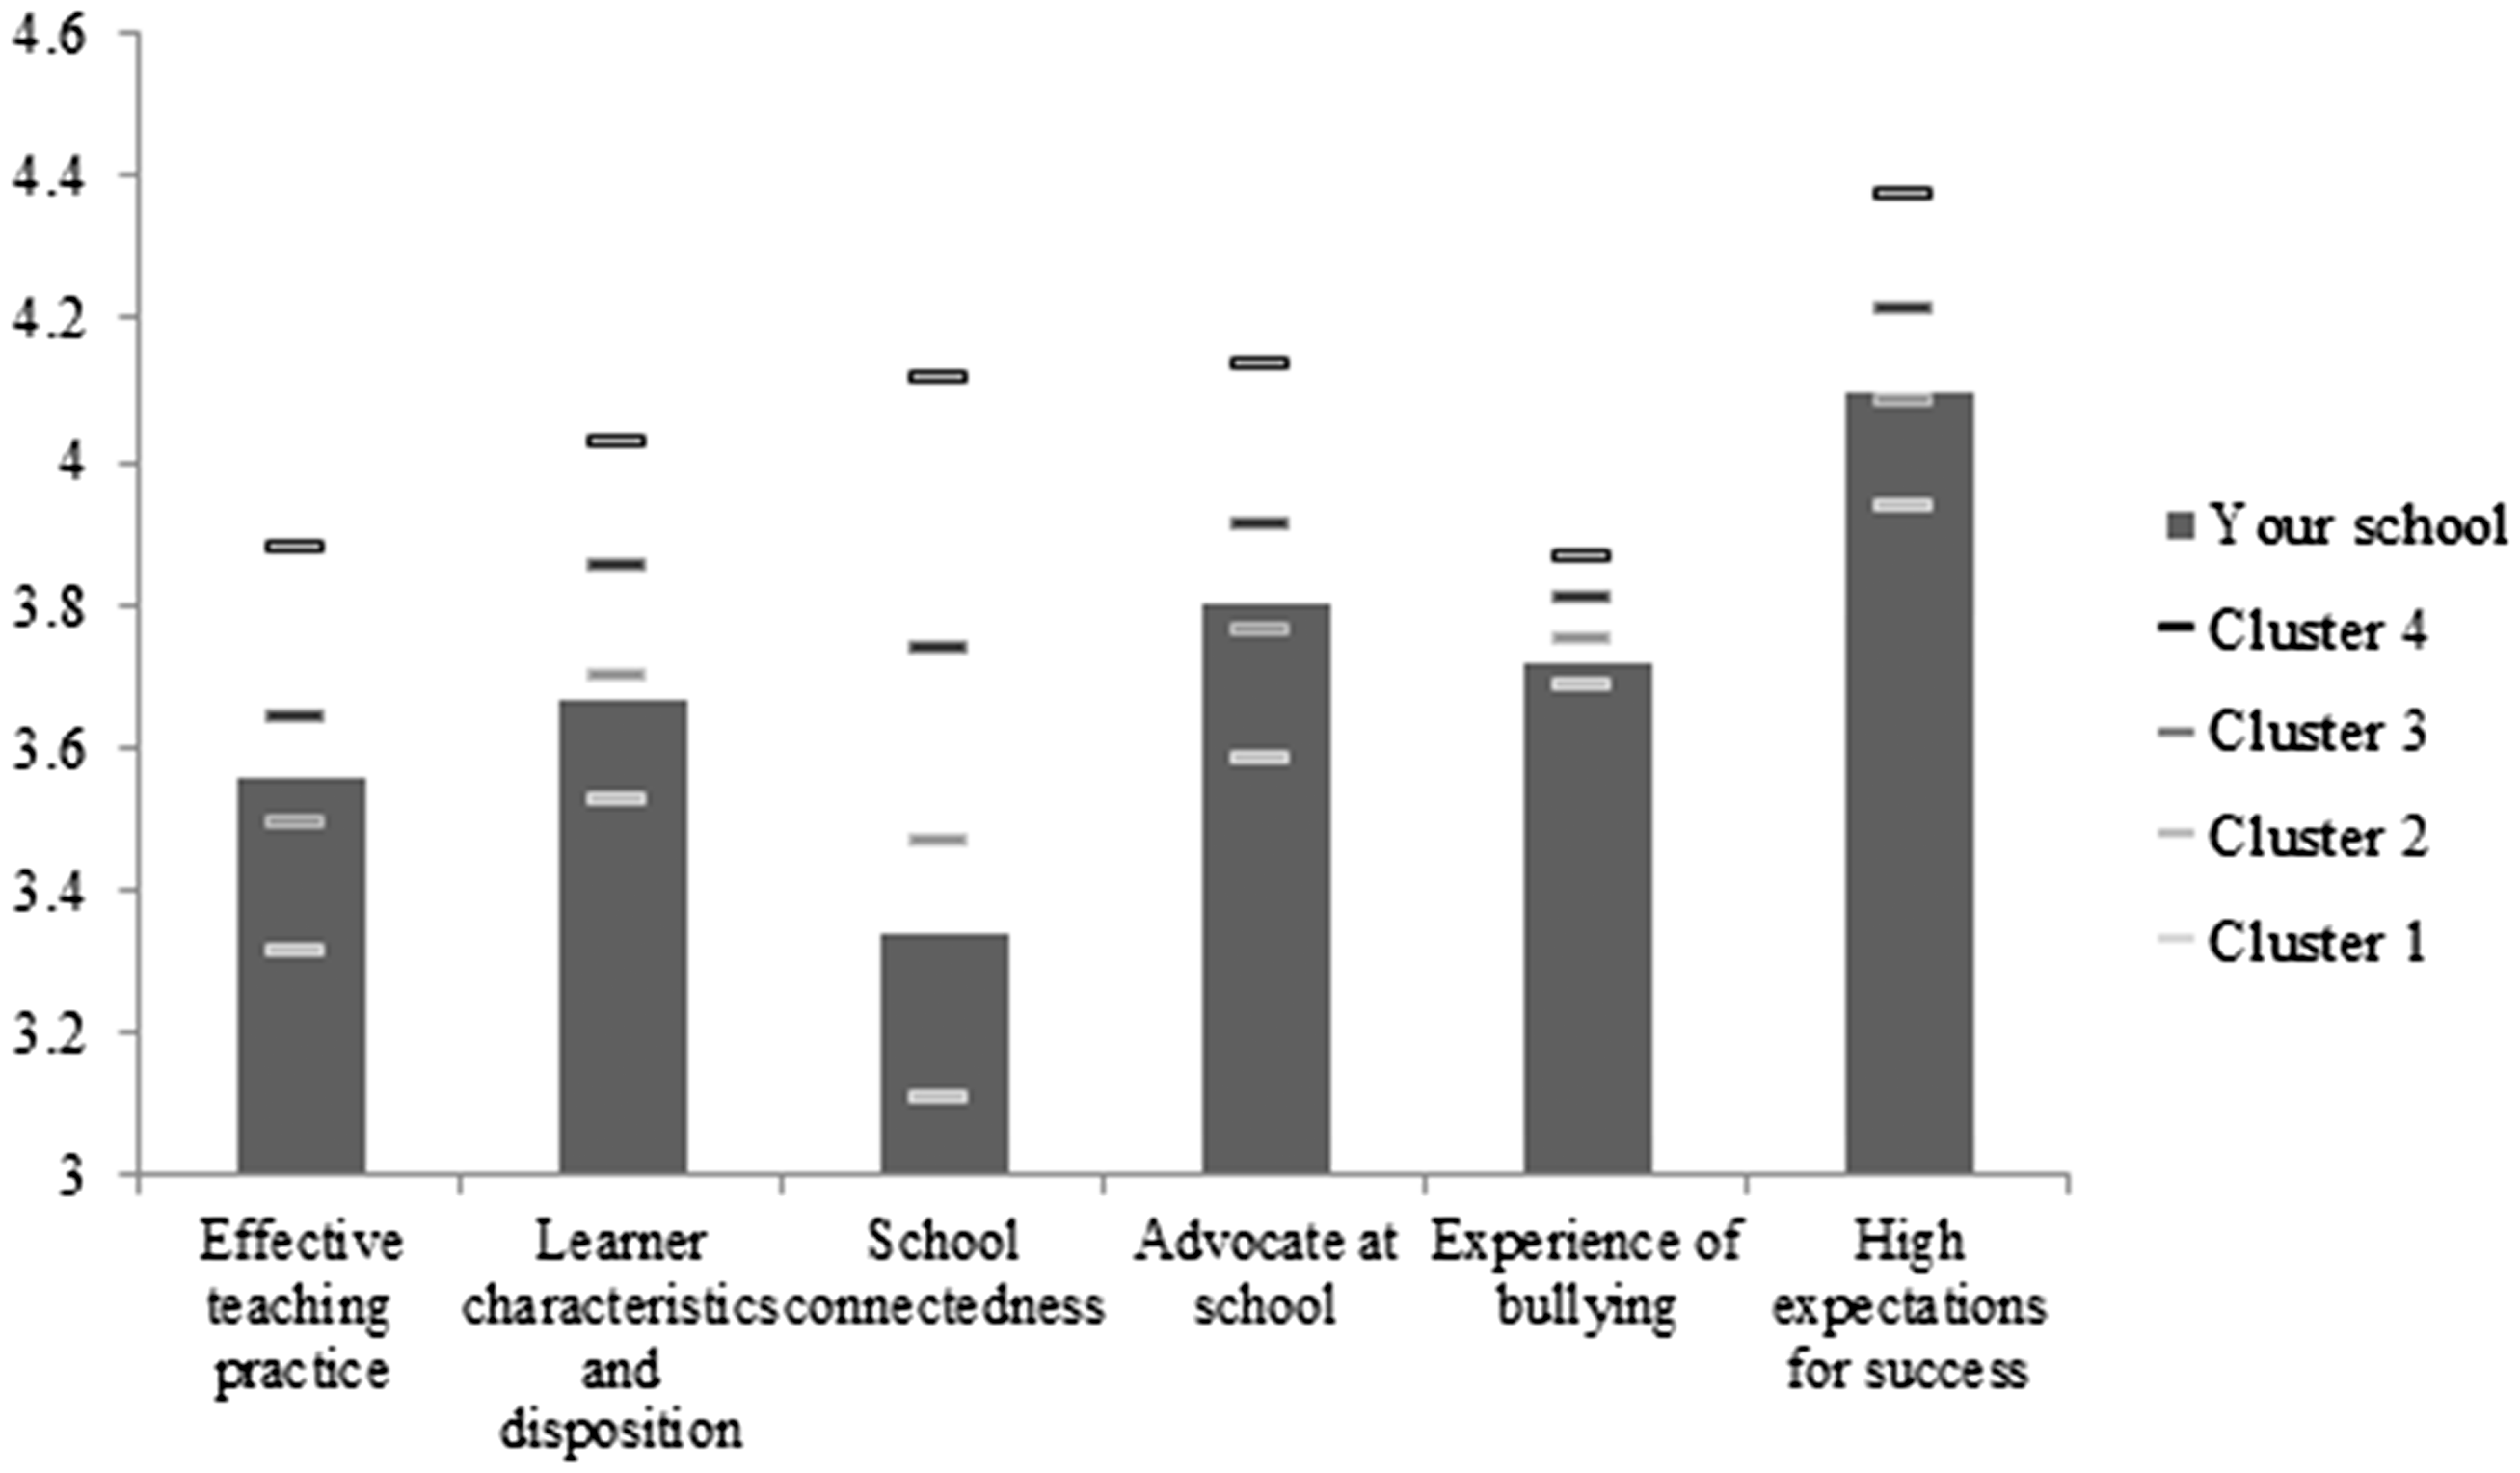
Proposed school-level reporting tool, example 1.
As an example, the chart in Figure 3 shows data for a school selected from the sample of this study. The school is a 7–12 secondary college that in 2017 had between 500 and 700 students and a high SFOE loading (and on this latter is not clustering with so many other high SFOE schools). This school is a Cluster 2 school and its mean results sit near the Cluster 2 mean for most factors. The chart allows a school to quickly identify their areas of relative strength and relative weakness. For example, this school may observe that for most factors (Effective Teaching Practices, Advocate at School, Experience of Bullying and High Expectations for Success) they are performing better than most schools in Cluster Two. Another clear takeaway for this school may be a need to improve School Connectedness where they sit between Clusters 1 and 2, Learner Characteristics and Disposition may be another area of focus. A major message is that this school should not sit complacently as it is only in Cluster 2 and can see it should be aiming more for a Cluster 4 profile.
Concluding comment
Surveys evaluating student attitudes provide a useful and reliable measure of students’ perceptions of school climate factors. This study shows that these perceptions, as measured by instruments already in wide-spread use in Victoria, have an important relationship with students’ reading achievement and growth. Changes to the structure and reporting of these data to schools and other stakeholders may support more effective decision making in the Victorian education system. As students are the central participants in the activities of schools, it is important that their perceptions are not only considered but used effectively to support improvements in student outcomes.
Footnotes
Declaration of Conflicting Interests
The author(s) declared no potential conflicts of interest with respect to the research, authorship, and/or publication of this article.
Funding
The author(s) received no financial support for the research, authorship, and/or publication of this article.