
Abstract
The aim of this study was to show that some of the errors made by students when responding to mathematics assessment items can indicate progress in the development of conceptual understanding. By granting partial credit for specific incorrect responses by early secondary students, estimates of the difficulty of demonstrating full and partial knowledge of skills associated with the development of proportional reasoning were determined using Rasch analysis. The errors were confirmed as indicators of progress, and hence partial knowledge, when the thresholds of achievement followed a logical order: The greater the proficiency of the students, the more likely they were to receive a higher score. Consideration of this partial knowledge can enhance the descriptions of the likely behaviours of students at the various levels of learning progressions and this can be informative for teachers in their planning of learning activities.
Keywords
Introduction
Prioritisation of the development of learning progressions for planning the curriculum to be taught in Australian schools is one of the recommendations from the Gonski report (The Department of Education and Training, 2018). These learning progressions will provide further assistance to teachers in their recognition of student progress and for their planning of appropriate learning activities. The Australian Curriculum, Assessment and Reporting Authority (ACARA) is, at the time of writing, continuing to develop and refine the learning progressions for literacy and numeracy and input from students, researchers and teachers is vital for the ongoing evolution of these progressions.
Most of the information used in the creation of learning progressions comes from students’ correct responses to assessment items. Further consideration of those incorrect responses which indicate partial knowledge (PK), or progress in conceptual understanding, can allow more detailed descriptions of progress to be provided. For the development of knowledge and understanding associated with proportional reasoning — important but challenging skills for students to acquire — this added detail in the associated learning progressions can provide extra support for teachers, and thus improved outcomes for students.
Background
This article provides an overview of the role of PK in the development and elaboration of learning progressions; in particular, the process by which PK is detected and confirmed. While the study relates specifically to skills associated with the development of proportional reasoning for students in Years 7 to 9, the process is applicable in the creation and evolution of other learning progressions.
Learning progressions
The concept of a learning progression originated in the account of the hypothetical learning trajectory described by Simon (1995, p. 133) as “the learning goal, the learning activities, and the thinking and learning in which students might engage”. Learning progressions or trajectories have been presented in the literature as hypotheses of student understanding based on empirical data (Seah & Horne, 2020a), as likely learning pathways (Briggs & Peck, 2015) and as visible indications of increasing conceptual understanding (ACARA, 2020). Many descriptions of learning progressions incorporate all of these perspectives and in some of these, instructional activities and assessment items are also included (Fonger et al., 2018).
Learning progressions have also been described as numerical scales with proficiency scores associated with specific behaviours and hence with different levels of progress in a particular construct (Adams et al., 2018). This linking of scaled scores with developing student understanding is the foundation for the creation of many learning progressions reported in recent research. In a variety of these studies, Rasch measurement theory was applied to student responses in assessment items to create numerical scales, and thence to generate the descriptions of the expected student behaviours at the various levels (Confrey, 2019; Seah & Horne, 2020a; Siemon, 2019; Watson & Callingham, 2017). In these studies, the assessments contained constructed response (CR) items where students created and provided their own answers to the questions. Some CR items consisted of several related parts, and students were able to obtain credit when they responded correctly to some parts but not to others.
Partial knowledge
While a correct response suggests that the student has full knowledge and understanding of item content, some incorrect responses to CR items, or selections of incorrect options in multiple-choice (MC) items, indicate that students know some aspects of item content, but not enough to generate or recognise the correct response. Such errors may indicate that a student has developed greater conceptual understanding of the item’s construct and has achieved a higher level on the learning progression than the student who provides a different incorrect response. In this scenario, the student is deemed to have PK of the item content.
Growth of knowledge results in greater understanding of principles, concepts and mathematical structure as well as the acquisition of facts, terminology and procedural fluency (Bloom et al., 1956). Knowledge may be incorrectly formed when only some existing knowledge is recognised for its relevance to the new situation, or when current knowledge is applied inappropriately (Ben-Zeev & Sternberg, 1996; Gila et al., 2010, Smith et al., 1993). When learning to add fractions, for example, students may initially apply their “whole number thinking” and conclude that
Increases in the numbers of particular errors or misconceptions have been associated with the development of knowledge and have been described as indicators of progress. Evidence for this is provided by Sadler (1998) in a study of MC items used to test scientific understanding, and by Hodgen et al. (2012) in their study of CR items used to test understanding of number and algebra. In both studies, the proportion of certain misconceptions and errors increased as student proficiency increased, and then declined for the students with the highest levels of proficiency. In one example, students provided 0.11 as the representation of eleven-tenths; they knew that the tenths started in the first column after the decimal (Hodgen et al., 2012). The claim by Confrey (1990, p. 42) that the development of misconceptions, was “unavoidable and necessary in the development of knowledge” is supported by the research findings.
Some studies link PK with levels of achievement. At two different levels of their learning progression for geometric reasoning, Seah and Horne (2019) refer to “incomplete reasoning” and “partial solutions and explanations”. In Battista’s (2004) learning trajectory of measurement, errors are linked to different levels of thinking. Double-counting errors are eliminated at Level 3, and at Level 5 students are still unable to use abstract calculations for large arrays. Typical errors were also identified at each level of difficulty in the development of some of the skills associated with ratio and proportion (Misailidou & Williams, 2003); the analysis confirmed the developmental hierarchy of these errors. Confrey (2019) provides further examples of behaviours that are described in learning progressions and which could be PK; including student-generated strategies and representations. Alonzo (2018) suggests that the inclusion of errors and misconceptions in learning progressions prompts teachers to focus on the students’ mathematical behaviours rather than on the achievement of the learning goals. Insight into such behaviours can provide important information for teachers to enable them to plan appropriate learning activities to allow students to develop the understanding of why their ideas are incorrect.
Scoring common errors as partial understanding was suggested by Callingham and Watson (2004) as a means of providing greater detail of developmental pathways. If responses provide evidence of PK, then it is reasonable to conclude that such errors should not only receive a partial score, but should also be considered for describing progress. Examples of such use of incorrect responses to assessment items used in the development of learning progressions were not found in the research literature at the time of writing.
Proportional reasoning
Proportional reasoning, which “involves recognising and working with relationships within relationships (i.e., ratios) in different contexts” (Siemon et al., 2012, p. 32) is an important concept for students in Years 7 to 9 to acquire and was thus chosen as a relevant context for the study of PK. Proportional reasoning is essential for success at higher levels of mathematics and for understanding basic numeracy in personal finance and future employment. To achieve sound proportional reasoning, students need to develop skills and understandings relating to linear relationships, fractions, decimals, percentages, rates and ratios.
Consideration of the errors that students often make, as well as a study of the literature relating to the development of skills and understandings associated with proportional reasoning, can provide some insight into the common errors and misconceptions which can be classified as PK of proportional reasoning. Additive thinking, where students use addition instead of multiplication to solve problems involving proportions, is one example reported in the literature (Misailidou & Williams, 2003). Another example relates to scaling area and volume: Students apply a linear scale when thinking that the area of a square would double if the side length were doubled. Modestou and Gagatsis (2007) found this to be a persistent error over a range of student abilities. Operations with speed and other intensive quantities can be challenging for students and a common error is to average speed over different distances to determine the mean speed (Lamon, 2005).
Other examples of common errors and misconceptions that I have observed in my teaching career relate to the recognition of the proportional nature of problems. When first learning about operations with percentages, a common error made by students is to ignore the proportion and to calculate with absolute values: An increase of 10% is seen as an increase of 10. Often more advanced students do not recognise which type of proportion applies (direct or inverse) and they do not identify if the values should increase or decrease. They then apply the scale factor using incorrect operations.
Reports which describe the scoring of errors as partial understanding to enhance descriptions of development, as suggested by Callingham and Watson (2004), have not been located in the research literature. Errors may indicate partial understanding but it is essential that they are confirmed as indicators of progress and hence PK if they are to be included in the descriptions of the mathematical behaviours at the various levels of a learning progression. This study describes a process by which errors are confirmed as PK during the production and analysis of the numeric scales that show the relative difficulties of providing a partly, or a fully correct response.
Methodology
To develop numeric scales of the relative difficulties of being partly or fully correct on a variety of items, three different assessments were investigated. The data consisted of the responses of students in Years 7 to 9 to items that tested skills and understandings associated with the development of proportional reasoning. Rasch measurement theory (Rasch, 1960) was applied in the analysis of these responses to CR and MC items using RUMM2030 software (Andrich et al., 2016). Estimates of item difficulty and student proficiency were determined, and graphs that showed the relationships between these estimates were produced.
Data collection
For the first assessment, conducted in the United Kingdom, approximately 5000 students aged 11 to 14 years had responded to 38 CR items that tested skills relating to ratios and fractions (Hodgen et al., 2012). The assessed skills included the adjustment of quantities in recipes, determination of percentages, proportional division and operations with fractions. The data provided (J. Hodgen, personal communication, December 2, 2016) consisted of all correct and incorrect responses.
The responses to the second assessment were from the Australian students in Years 7 and 9 to the National Assessment Program-Literacy and Numeracy (NAPLAN) tests in 2013 and 2014, and were provided by ACARA (A. Dow-Sainter, personal communication, February 4, 2016). Each test contained 64 items of which there were between 46 and 50 MC items in any one test. Only the MC items which tested skills associated with proportional reasoning were investigated but all items were included for the estimation of student proficiency. Random sampling was used to generate approximately 3000 records from each test for the analyses.
The third set of responses resulted when over 1200 Year 8 students from Western Australia participated in an online test of skills associated with proportional reasoning. Of the 60 MC items constructed for the test (Burfitt, 2019), every student was initially offered Items 1 to 10, which were deemed to address the Year 8 curriculum in Western Australia (School Curriculum and Standards Authority, 2016). Then, either with an adaptive test regime, or at random, each student was offered a further 20 items. By having the set of 10 common items, it was possible to place all students on the same scale even though they had not all done exactly the same test.
The construction of the MC items for the Year 8 test was guided by the principles outlined by Haladyna (2004) and these included the presentation of the main idea in the stem, use of positive language throughout and making response options independent of each other. Each item had four response options, only one of which was correct, and one of the three distractors (incorrect options) was purposefully written to capture PK of item content. This informative distractor, the one with information about student learning, could be selected by students with common misconceptions, limited understanding or less than complete knowledge; that is, PK.
The MC items were constructed to (a) address varying levels of difficulty, (b) test a wide range of the skills and understandings associated with developing proportional reasoning, (c) be easy to understand and (d) be set in a familiar context. Some items were adapted or adopted from research studies and others were created by the author. Further detail of the design and conduct of the test, of item construction and review, and of the justification for the selection of informative distractors, is available in the original research report (Burfitt, 2019).
Data analysis
Independent analyses using Rasch modelling were carried out for each of the three assessments. For the initial analysis of the student responses in each assessment, items were scored dichotomously, with either one point (1) for a correct response or zero points (0) if the response was incorrect. Based on this dichotomous scoring, estimates of both item difficulty and student proficiency were produced. These estimates, measured in logits, form an “ordered conjoint measurement scale” (Callingham & Bond, 2006, p. 1) which shows the relative difficulty of the various items as well as the varying proficiencies of the students who participated in the assessment. To improve the accuracy of the item difficulty estimates for all MC items, student responses were tailored to remove the effects of guessing using analyses proposed by Andrich et al. (2012). After tailoring, difficulty estimates for the easiest items are lowered and those of the most difficult items are increased.
For each assessment, a second scale was produced when the items were scored with more than two values, that is, with partial credit. Two points (2) were given for a correct response, one point (1) was given for a response that was hypothesised to reflect PK, and zero points (0) were awarded for other incorrect responses. Only one of the distractors in each MC item was awarded a score of 1, and nearly all CR items had only a single incorrect response that was scored with partial credit. Where it became evident that partial-credit scoring did not work for any item, as discussed in the following section, dichotomous scoring was reinstated for that item.
The final scales of item difficulty for each of the three assessments had some items scored dichotomously, and others scored with partial credit. As the three assessments are not linked, each scale is unique, and while it theoretically stretches infinitely in both directions, the estimates on the scale are mostly located between –3 and +3 logits.
Confirmation of partial knowledge
PK, as described earlier, was the basis for deciding which responses or selections should be awarded partial credit. Evidence to confirm the existence of PK can be seen in the distractor curves for the MC items and in the category probability curves (CPC) for both MC and CR items. The differences in the difficulty estimates of scoring one or two points on the item indicate the relative difficulty of being partly or fully correct.
When the curve for one distractor peaks for students in the middle of the proficiency range, or when the curve for one distractor is visibly above all others (Andrich & Styles, 2011; Sideridis et al., 2016), then the distractor is said to contain information; in this case about student knowledge. This behaviour is shown in Figure 1 where the distractor curve for Option 3 is higher than all other curves and has a distinct peak when the PersonLocation is about −0.2. As PersonLocation increases, students are increasingly attracted to this distractor and then about the middle of the proficiency range, this attraction decreases.
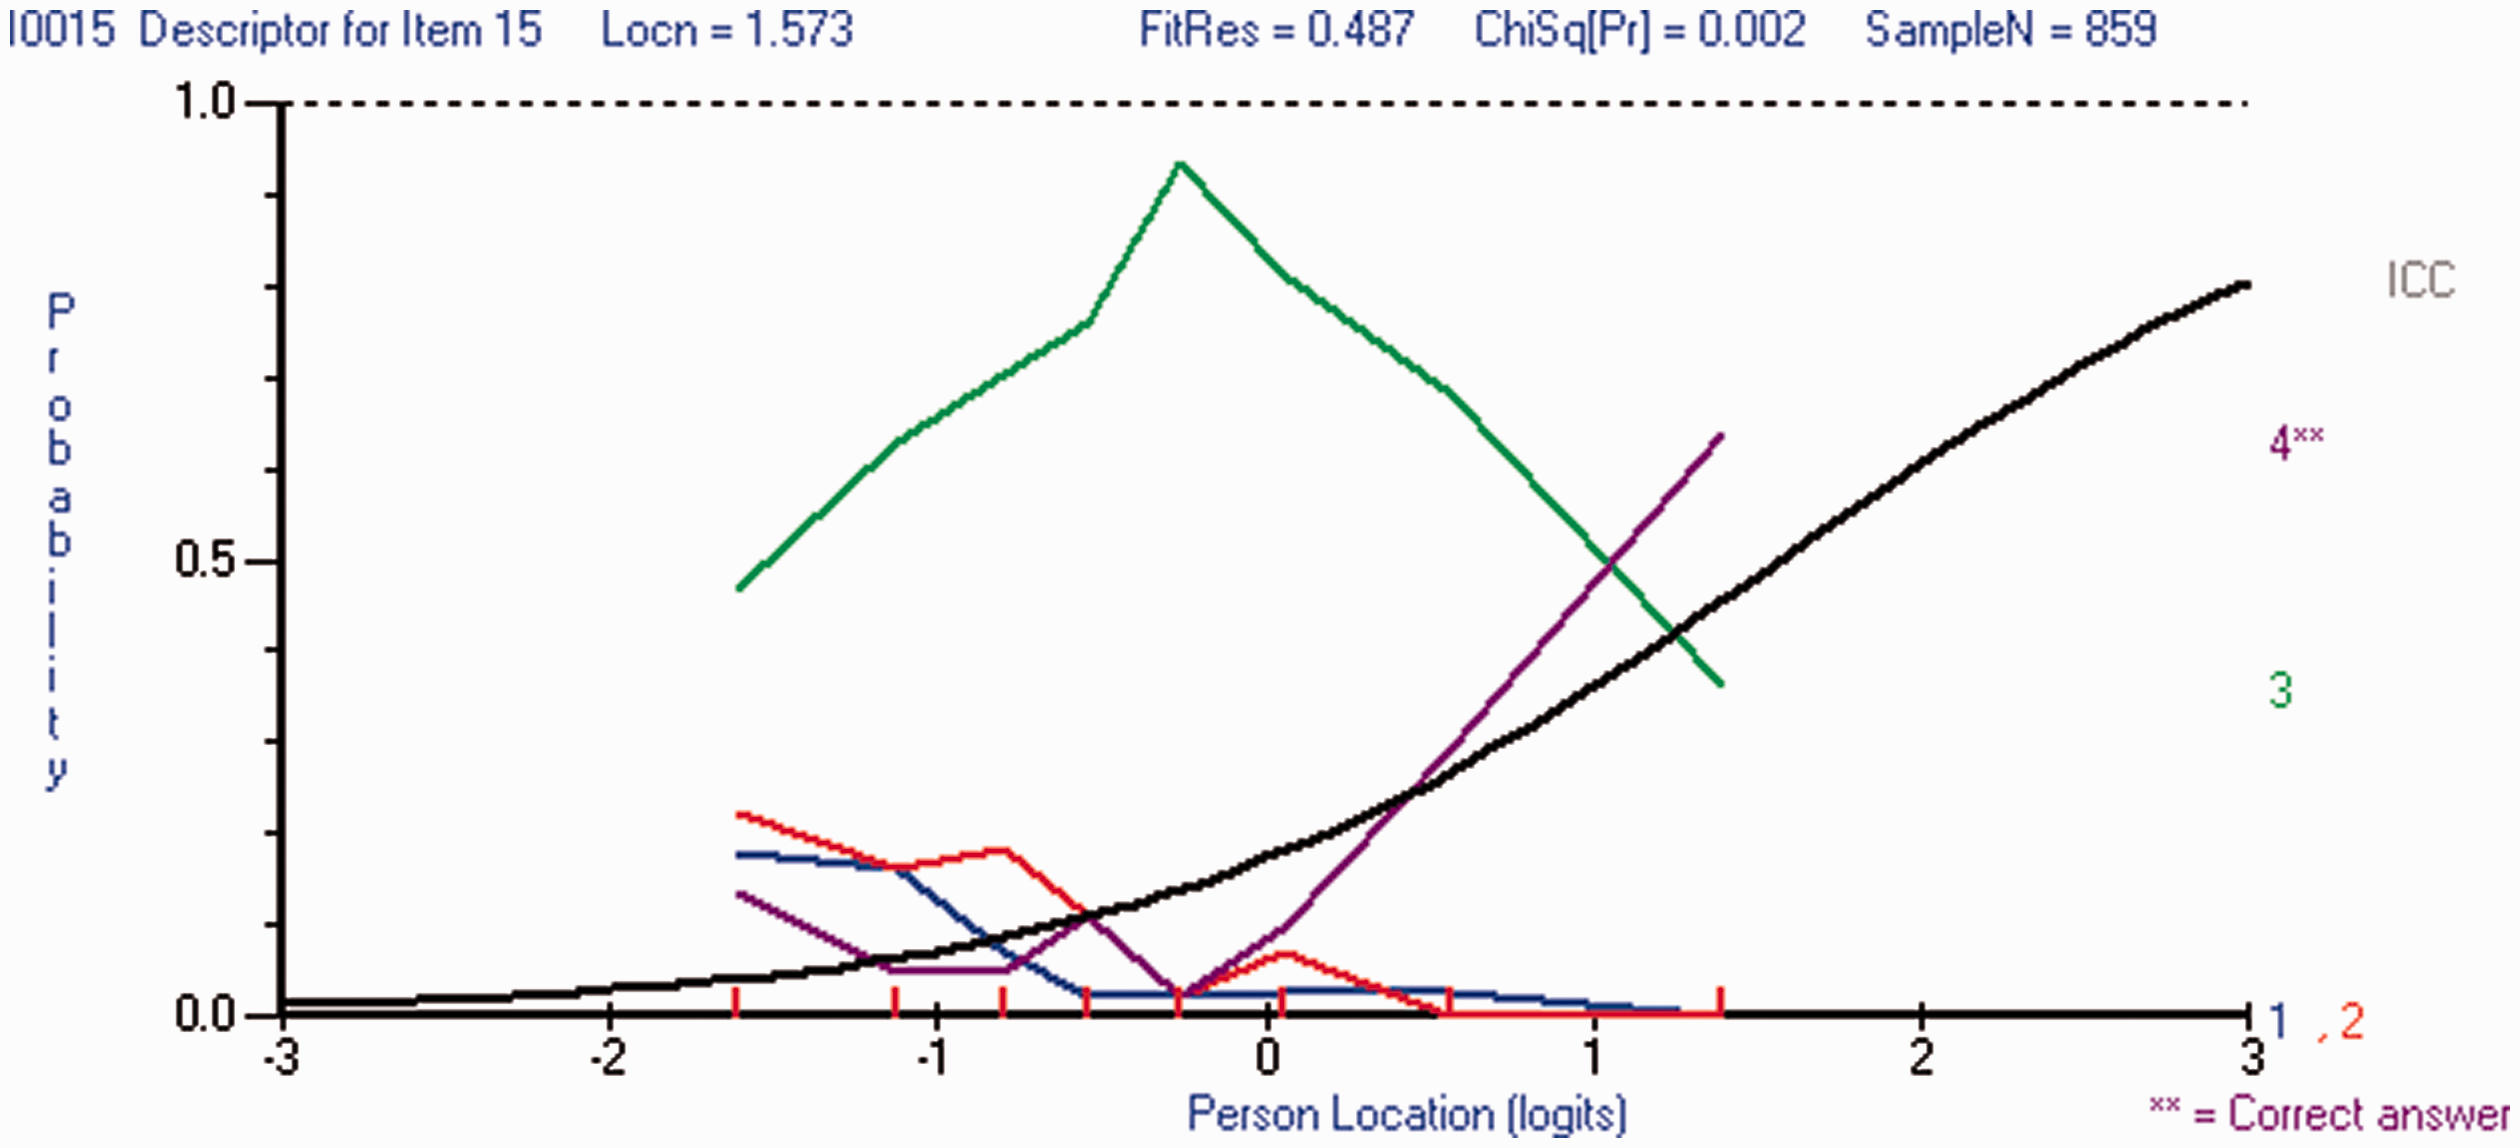
Distractor curves showing evidence of an informative distractor.
The validity of partial-credit scoring, and hence confirmation of PK, for both CR and MC items, is seen in the nature of the CPC which shows the relative difficulty of obtaining scores of 0, 1 and 2 (Van Wyke, 2003). The conjoint scale on the horizontal axis is used to read the estimates of these relative difficulties, as well as the threshold values. The threshold values indicate where there is an equal probability of persons receiving one score or another and they are read at the point of intersection of two graphs.
In Figure 2, the estimate of proficiency (PersonLocation) at the first threshold (–1.2), where there is equal probability of obtaining a score of 0 or 1, is much lower than the estimate at the second threshold (2), where there is equal probability of obtaining a score of 1 or 2. For this item, the thresholds are ordered because the probabilities follow a logical order in which the persons with the higher locations (i.e. greater proficiency) are more likely to receive a higher score. The threshold distance, that is, the difference between the first and second thresholds in this item, is about 3.2 and this difference reflects the relative difficulty of being fully, as opposed to being partly, correct.
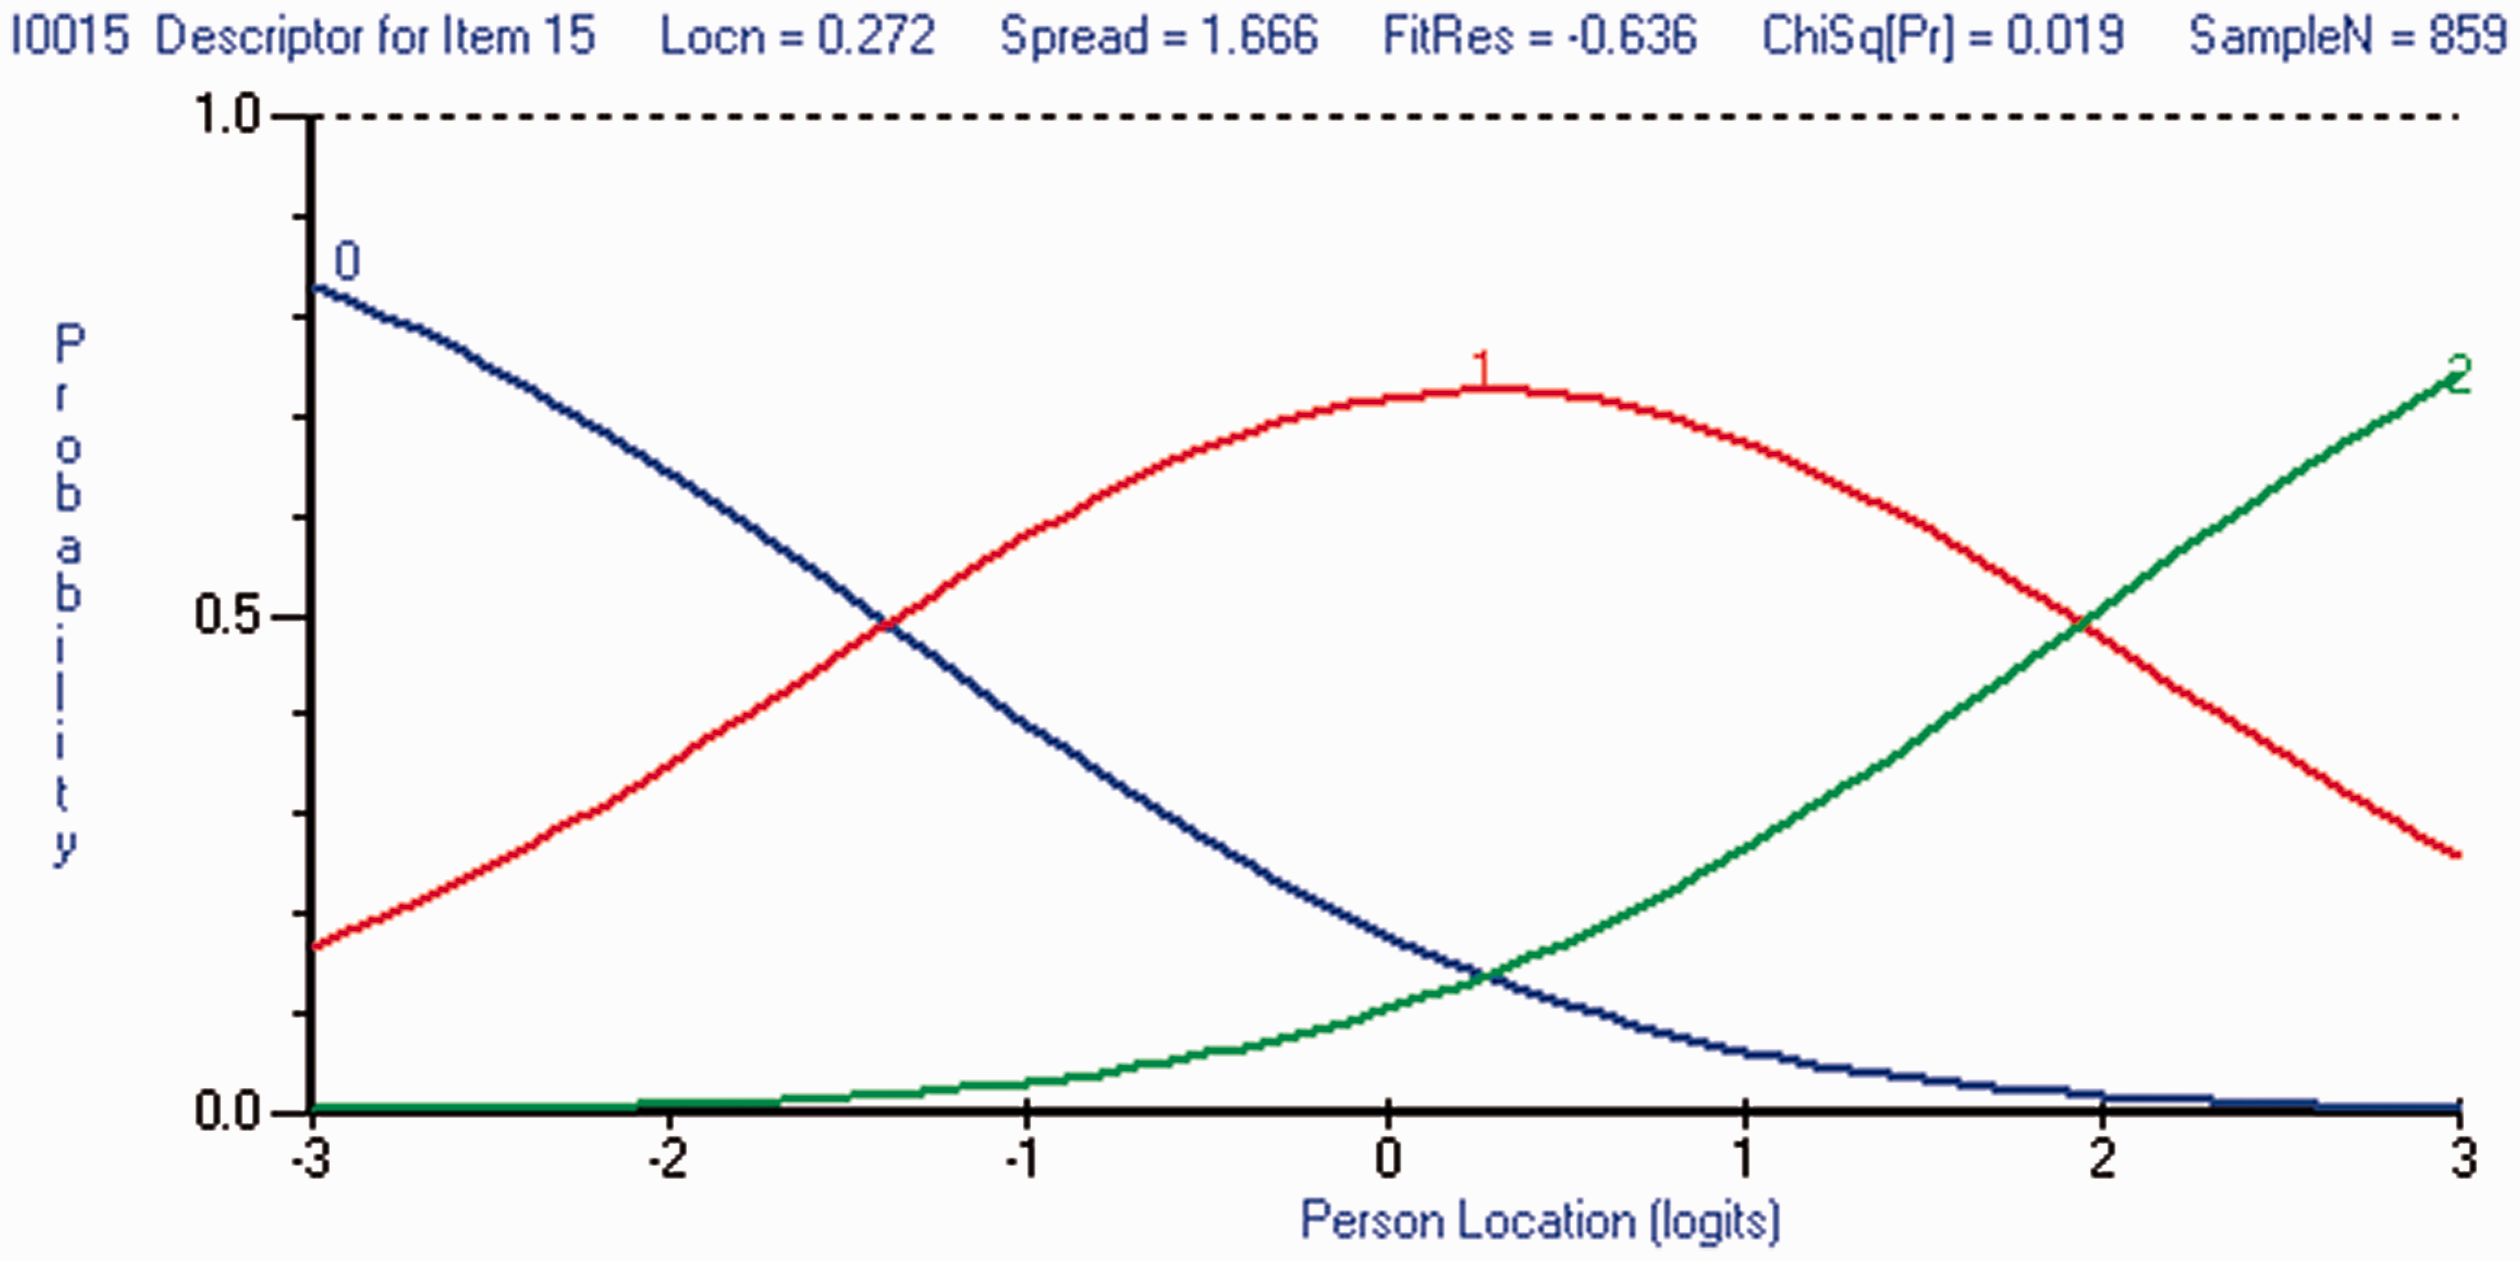
Category probability curve showing evidence of ordered thresholds.
Where the thresholds are disordered, as shown in Figure 3, there is no range of PersonLocation for which the probability of scoring 1 is higher than that of scoring 0 and at the same time higher than that of scoring 2. This evidence was used to invalidate partial-credit scoring and revert to dichotomous scoring for the item.
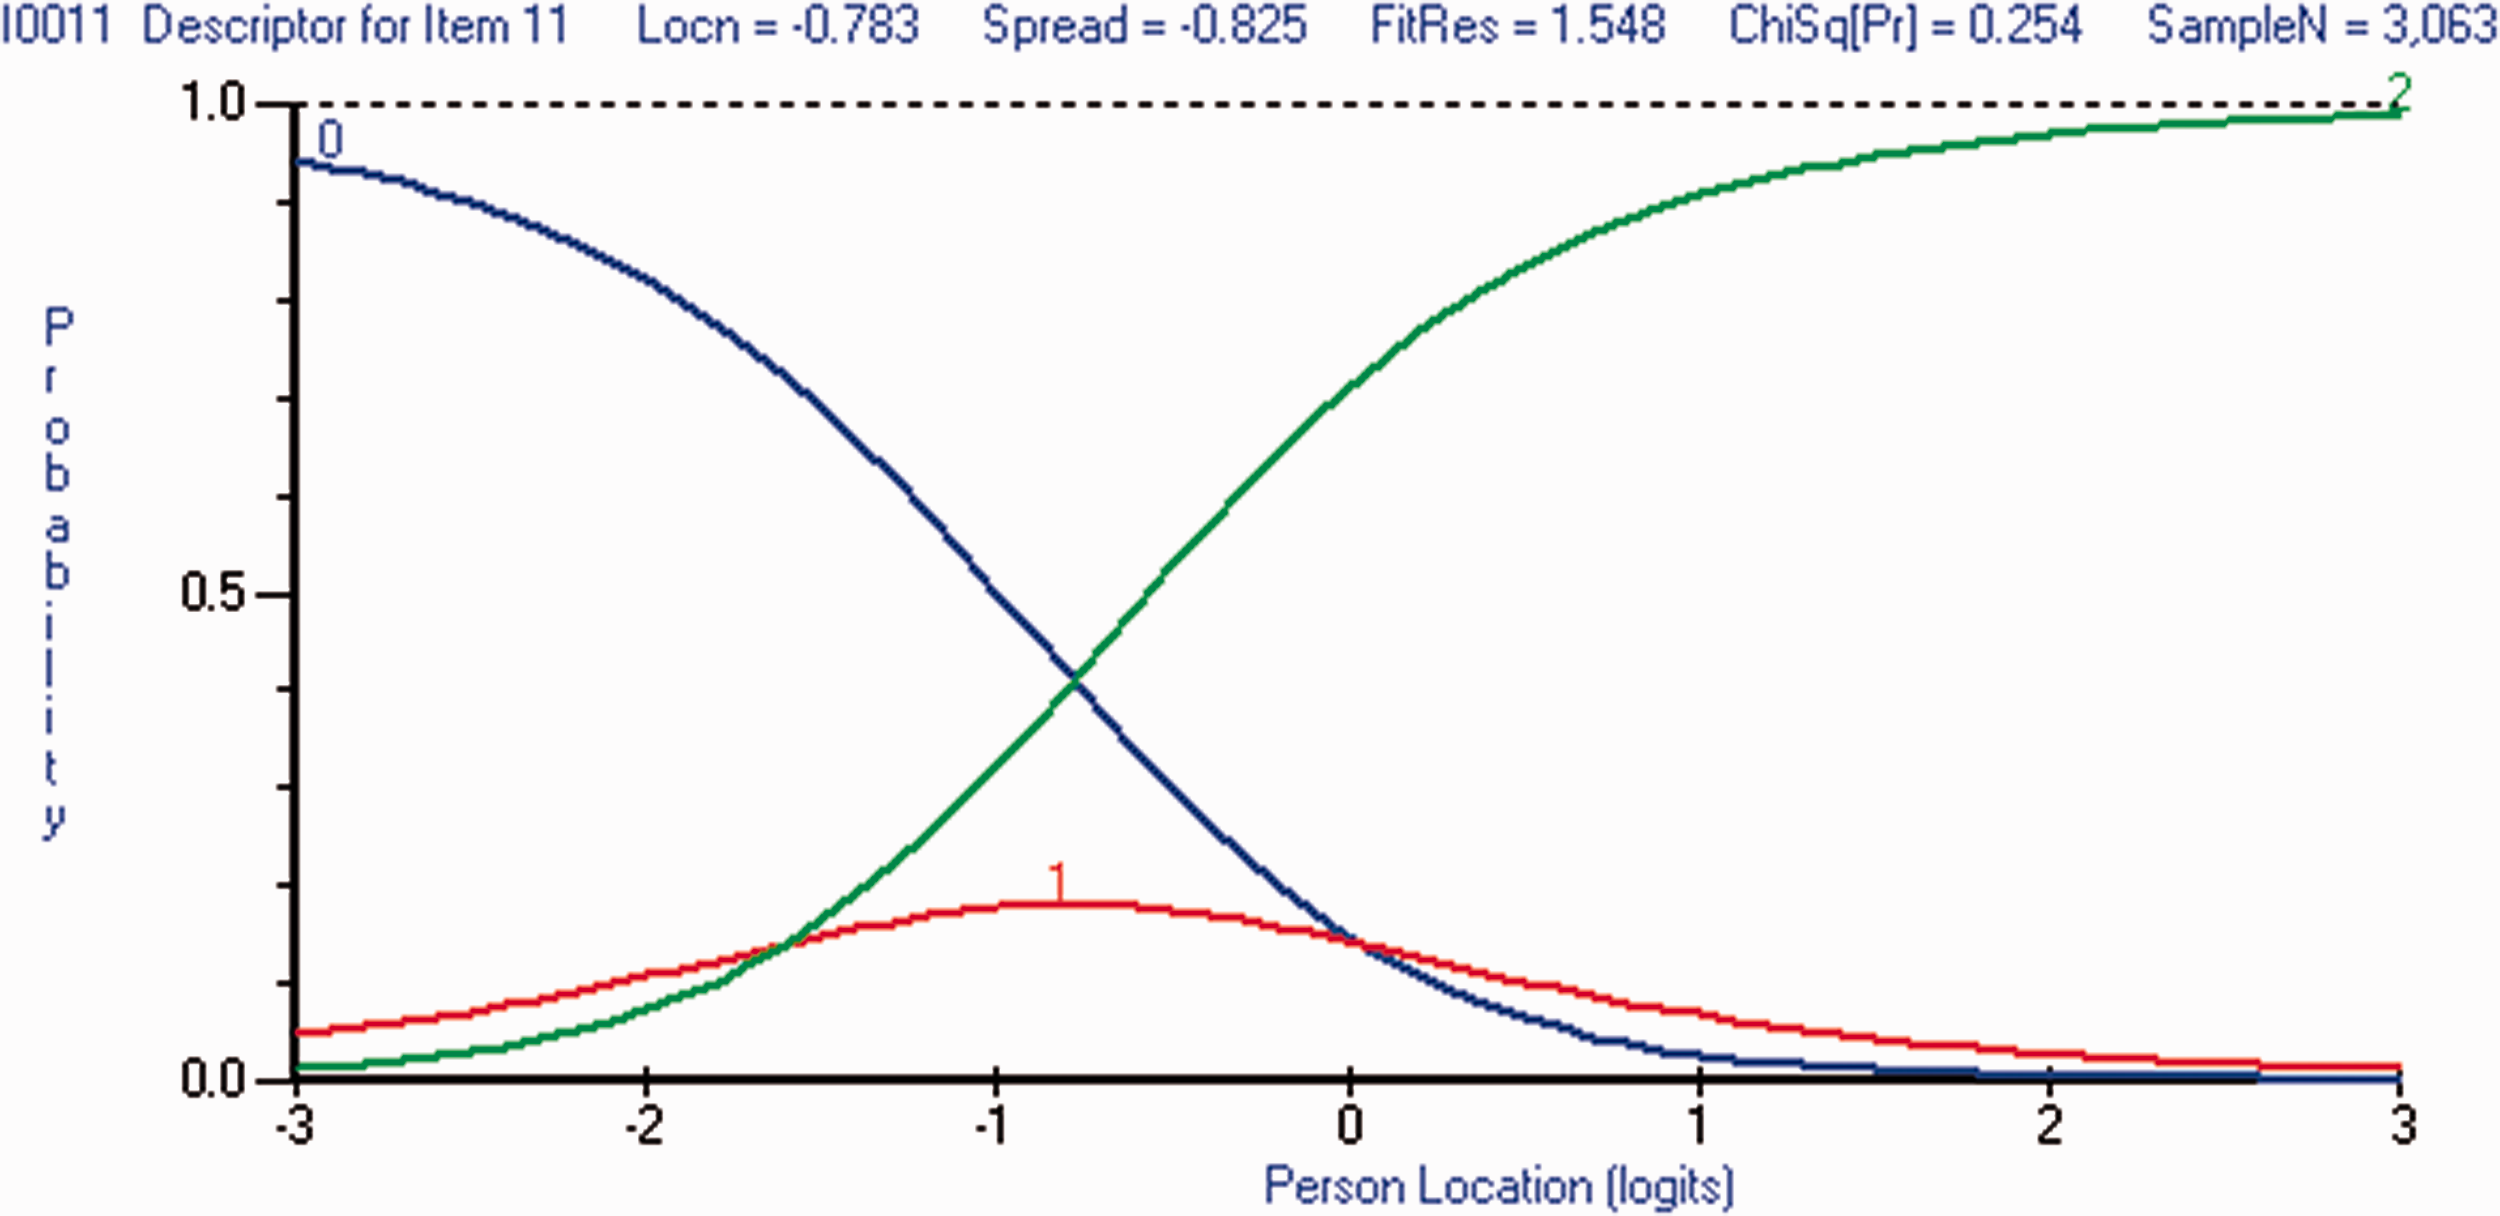
Category probability curve showing evidence of disordered thresholds.
Results
Based solely on item content, many of the items which tested skills associated with proportional reasoning were hypothesised or constructed to contain opportunities for students to demonstrate their PK. For the three assessments, the number of items with ordered thresholds after partial credit was given (i.e. PK confirmed) is summarised in Table 1. Between 33% and 53% of the items with possible PK had ordered thresholds. The threshold distances vary in each item and a small distance indicates very little difference in the proficiency estimates of the students who scored 1, compared to the estimates of those who scored 2. When the threshold distance for an item is 0.4 logits, a person with a 50% chance of scoring 2 rather than 1 has a 60% chance of scoring 1 rather than 0 (Andrich, 2016). As the threshold distance increases, this person’s probability of scoring 2 rather than 1 also increases.
Numbers of items with ordered thresholds in each test.
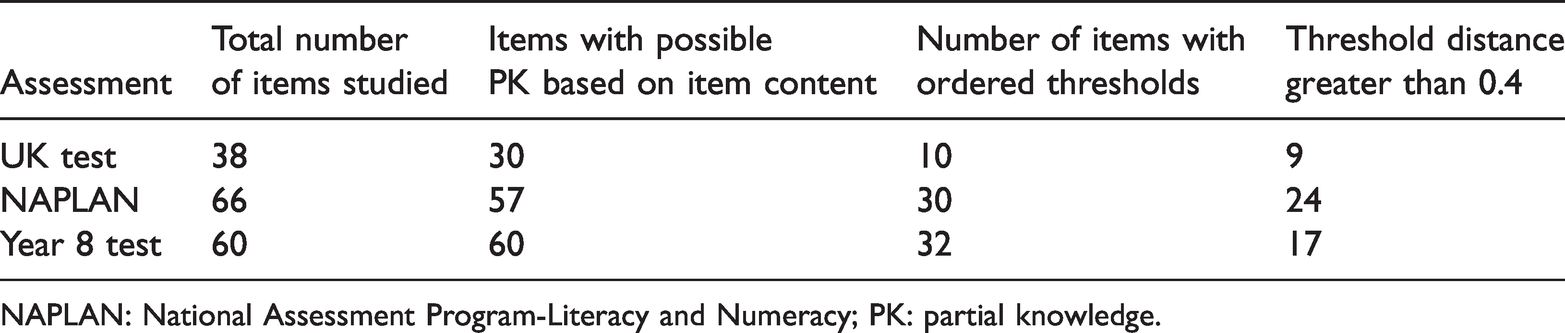
NAPLAN: National Assessment Program-Literacy and Numeracy; PK: partial knowledge.
The distractor curves for the MC items in both the NAPLAN and Year 8 assessments showed considerable evidence of the existence of student PK. There were 25 MC items in the NAPLAN assessments for which the appearance of the distractor curves indicated PK and for 22 of these items, partial-credit scoring was successful; thresholds were ordered. For the other three items, one had disordered thresholds and the others had negligible threshold distances. In the Year 8 test, designed to allow students to select PK options, the items were assigned to one of four groups according to the perceived strength of their distractor curves as indicators of PK. The group with the strongest visual indicators of PK had the highest proportion of items with successful partial-credit scoring (20 of 22), and the group with the weakest indicators of PK had the lowest proportion (3 out of 21).
Part of the item map for the Year 8 test is reproduced in Figure 4. This shows the final scale of difficulty estimates for some of the items scored with partial credit. The estimates of difficulty for being partly or fully correct are highlighted for Items 15, 17 and 26. In Item 17, for example, the difficulty estimate for obtaining a score of 1 (denoted by 17.1) is 0.4 logits and the estimate for obtaining a score of 2 (denoted by 17.2) is 2.2 logits. Such maps have been used to guide the allocation of skills to the various levels of learning progressions (Day et al., 2019; Seah & Horne, 2020b) and can be further used to place skills and understandings indicative of PK on the developmental pathway.
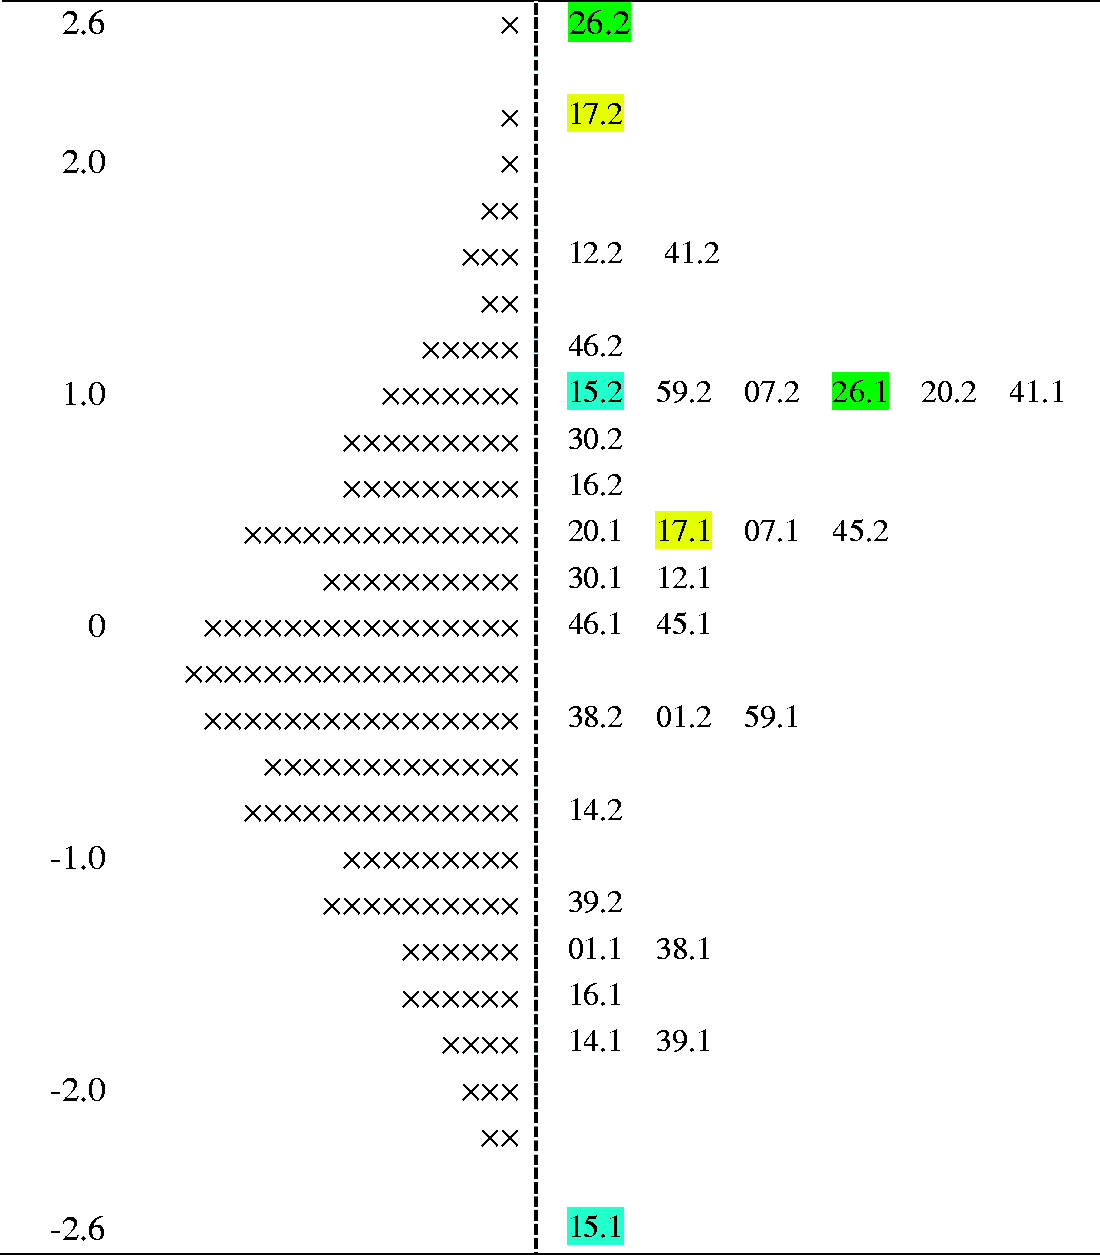
Item map showing threshold difficulties and student distribution of students at each class interval (× = 7 students, #.2 = second threshold, #.1 = first threshold).
In the first assessment, the percentage of students who received credit for their PK of item content ranged from 23% to 50% (mean = 40%) across the items with partial-credit scoring, while the proportion who were correct on the same items ranged from 4% to 29% (mean = 16%). The percentages of students receiving partial credit were also high in the Year 8 test; ranging from 29% to 74%.
One of the items for which PK was confirmed in the first assessment described Mr Short’s height as six paperclips or four matchsticks and Mr Tall’s height as six matchsticks. When asked for Mr Tall’s height in paperclips, students with partial understanding demonstrated additive thinking by giving 8 as the answer. Additive thinking was also confirmed as PK in a question where students were given two similar diagrams and asked to apply the proportion 8:12 to determine missing values a and b in 9:a and b:18.
For the NAPLAN numeracy tests, PK was confirmed when students selected the response for the addition of two fractions as the fraction formed when the numerators and denominators were added. They did not recognise the importance of the common denominator. In one item, 5 cm was chosen by students with PK as being 5% of 140 cm, and in another item, calculating travel time by dividing speed by distance was confirmed as PK.
Evidence of students’ PK in the Year 8 test related to averaging speeds where the time travelled was different, applying a linear scale factor to area scaling and applying the correct proportion but not recognising that the type of proportion was indirect rather than direct. There were also items where students demonstrated additive thinking, applied absolute change rather than relative change and selected interim calculations instead of final ones.
There was little evidence of confirmed student PK in the easier items of all three assessments. Some examples where PK was not confirmed involved the creation of equivalent fractions, additive thinking when the scaling factor was familiar, recognition of simple ratios from a diagram or description and the recognition of the correct operations to calculate a simple proportion.
Discussion
Learning progressions generally consist of descriptions of likely student behaviours at the various levels of development with the behaviour being indicative of what students know and understand. For the creation of the learning progressions, there are several ways of obtaining information about the likely behaviours of students at these levels. First, there is the possibility of gathering evidence from teachers by collating their observations of student behaviours, but this places challenging demands on teachers. Other ways to obtain information are to study the literature on observed student behaviours and on the theories of the growth of knowledge. Hypothesising about likely behaviours is valuable in the initial creation of the learning progressions but further evidence is needed to confirm these developmental pathways. The evidence to confirm the pathways comes from the investigation and analysis of students’ responses to assessment items.
Incorrect as well correct responses should be considered for the creation of the numerical scales used to identify the descriptions of student behaviours at the different levels. When incorrect responses are shown to be indicators of progress, they signal changes in the development of conceptual understanding. Descriptions of these errors can be included in the elaborations of the likely behaviours at the various levels of the progression. The results of this study suggest that the use of additive thinking to solve problems relating to proportional reasoning would be at a lower level on the learning progression than the use of multiplicative thinking. Similarly, the ability to use proportional change incorrectly would be on a lower level than either the ability to recognise the type of proportion as being direct or indirect, or the ability to identify the correct type of factor for scaling a mathematical object. Students may perform correct operations but not recognise that the numbers that they are using should be proportions (e.g. percentages) rather than absolute values. This recognition comes later in the development of their understanding and use of the skills necessary for the development of proportional reasoning. By including these errors in the level descriptions of the learning progressions, teachers can recognise changes in student learning and plan instruction to facilitate student progress to more advanced levels.
Confirmation of which errors are indicators of progress is based on the analysis of the students’ responses to assessment items. For either CR or MC items, students may provide or select a response that indicates that they know or understand only part of what is required to be correct: This PK can be scored with partial credit. PK is confirmed when the thresholds are ordered and the item difficulty estimate for passing the first threshold, that of being partly correct, is lower than the threshold for obtaining a full score. The size of the difference in these threshold estimates reflects the relative difficulty of being fully and partly correct but further research is necessary to identify the value for which the threshold distance becomes significant.
The distractor curves in the MC items provide further support for the identification of PK. They can be used as evidence of the hypothetical information proposed for any distractor as well as to indicate which distractors might contain extra information and thus be suitable for partial-credit scoring. When the curve for one distractor is noticeably higher than any other curve, or when it peaks in the middle of the proficiency range, then that distractor is hypothesised to contain information. For this study, the distractor curves for some of the distractors thought to contain information did not indicate PK. Furthermore, there were some items for which the distractor curves indicated options for partial credit that had not been previously considered. Until the process of using distractor curves to indicate informative distractors becomes more reliable, it is advisable to confirm the existence of PK by also examining the size of the threshold distance.
In the current study, the items for which students could show their PK were the more difficult ones. For the items with the lowest difficulty estimates (easiest items), even in the Year 8 test where the MC items were designed to capture PK, partial-credit scoring was not successful in discriminating different levels of proficiency. Most of these easier items were written for the Year 8 curriculum and they tested content that was likely to be familiar for the students. The presence of easy items in an assessment, particularly near the beginning, is a common practice designed to provide students with success, and hence the confidence to continue the test. However, it would be expected that these same items would provide opportunities for students who are younger and possibly in earlier stages of conceptual development to demonstrate their PK.
Awarding credit for PK, even though the responses or selection of options may be incorrect, has further benefits for students and teachers. The proportion of students receiving this credit is considerable and many students would welcome the extra credit as well as gain confidence from the recognition of their progress. There is more information about student learning available to the teacher; both in terms of how much progress has been made and what further progress is needed for students to reach higher levels along the progression.
While the proficiency and difficulty scales were unique to each assessment, the order of skills and understandings is expected to be similar for a variety of assessments and thus informative for the construction of learning progressions. In Australia, students in Years 7 and 9 participate in the annual NAPLAN assessments, which result in considerable amounts of data available for further analysis. Investigation of past and future responses in these assessments could provide valuable insight into the orders in which students develop skills in a variety of mathematical constructs.
Conclusion
This study has shown that, for both CR and MC items, student PK can be identified even when the items have not been constructed specifically to recognise it. By confirming and crediting PK in both CR and MC items, there is an increase in the amount of data available to inform the construction of the learning progressions without adding any extra demands on the students and teachers. Learning about the PK that the students have developed is most informative for the creation and continuing refinement of learning progressions and it is a process that can make significant contributions in other learning areas.
Footnotes
Acknowledgements
The research was supported by an Australian Government Research Training Program (RTP) Scholarship and the contributions from Principals, staff and students in Western Australian schools have been invaluable.
Declaration of Conflicting Interests
The author(s) declared no potential conflicts of interest with respect to the research, authorship, and/or publication of this article.
Funding
The author(s) disclosed receipt of the following financial support for the research, authorship, and/or publication of this article: This work was supported by the Pearson Psychometric Laboratory.