
Abstract
Mathematics curricula have traditionally focused on content knowledge, often in the form of a scope and sequence of increasingly difficult mathematics. The importance of using and applying mathematics is recognised in the current Australian Curriculum Mathematics (AC: M) as ‘proficiencies’ that are intended to be integrated with the content. There is little support for teachers to develop these proficiencies – reasoning, understanding, problem solving and fluency. Learning progressions are sequences of learning that focus on cognitive processes, and thus provide a useful basis for curriculum development. Using an empirical Statistical Reasoning Learning Progression as an exemplar, a new approach to curriculum development is suggested that links content knowledge with the proficiencies. The outcome is a zone-based, rather than year level based, curriculum that allows teachers to target their teaching, so that students develop increasingly sophisticated understanding of statistics and probability.
Introduction
It is some 30 years since ‘Chance and Data’ was first included as a separate content strand of the Australian mathematics curriculum (referred to commonly as the AC: M). In that period, there have been several iterations of the AC: M, both nationally and at state level. Despite these developments, there is little evidence that students’ understanding of statistics and probability has advanced (Callingham & Watson, 2017). Some of this lack of advancement has been attributed to the AC: M having too great an emphasis on procedures, such as graph reading or identifying likelihoods of particular outcomes from frequency counts, rather than the development of the underlying concepts of statistics and probability (Watson & Callingham, 2020). Others point to the impact of the National Assessment Program – Literacy and Numeracy (NAPLAN), with its emphasis on skills, and concerns that it is becoming the de-facto mathematics curriculum in many schools (Hogan, 2012).
In the current AC: M, “content descriptions specify what young people will learn, and achievement standards describe the depth of understanding and the sophistication of knowledge and skill expected of students at the end of each year level or band of years” (Australian Curriculum, Assessment, and Reporting Authority [ACARA], 2020). The AC: M is underpinned by four proficiency strands that are intended to inform teaching: understanding, fluency, problem-solving and reasoning. However, the apparent focus in the content descriptors and achievement standards is largely on content knowledge and skills. The proficiencies themselves are left within the aims and rationale for mathematics; they are not explicitly referenced in the main body of the content descriptors (Atweh et al., 2012). Rather, they are presented implicitly within the wording of the content descriptors as verbs (for example interpret and compare), leaving it for teachers to individually identify how these may be used to develop the relationships among the proficiencies in an integrated way that truly develops students’ conceptual understanding (Sullivan, 2012).
There are several challenges with the current curriculum approach. As the focus is on essential content within a strict, hierarchical year level, there is little emphasis on the concepts that provide a foundation for the intended content knowledge. In addition, students are expected to meet new content and achieve the required standard within the year. There is little flexibility for students who may need to consolidate their understanding, and little attention to building cohesive connections between content that the proficiencies proclaim is important, for example in fluency. Assessment and teaching in this environment becomes upwardly focused, rather than cyclical.
As Confrey et al. (2014) claim, one way of addressing these issues is to use an evidence-based learning progression as a basis for curriculum development. The advantage of using an evidence-based progression approach is that prior knowledge needed to develop new understanding is clearly defined, based on available research. Assessment processes can be developed to identify where students need more support and when they are ready to move to new content. These processes can be explicitly linked to learning materials that can be used with a range of students, and teaching can also target the underpinning proficiencies (Siemon et al., 2018).
In this article, a curriculum for statistics and probability is proposed, which is based on a learning progression of statistical reasoning developed during a four-year, design-based research project in the middle years (Years 7 to 10) of schooling. Outcomes linked to targeted assessment are suggested along with teaching approaches, bringing together the curriculum–assessment–instruction triad. Implications of this approach are then considered.
Historical background
In Australia, the Australian Curriculum: Mathematics (ACARA, 2020) is the national curriculum document. It has evolved since 2010, following the first major attempt at national curricula over 30 years ago. At that time A National Statement of Mathematics for Australian Schools (Australian Education Council [AEC], 1991) was the first published curriculum statement across eight identified curriculum areas. It was followed three years later by two other significant documents, Mathematics – a curriculum profile for Australian schools (AEC, 1994a) and Mathematics – work samples (AEC, 1994b). At the same time, New Zealand was revising its school curricula, providing an overall Framework (Ministry of Education [MoE], 1993) for seven Learning Areas, eight Essential Skills and Attitudes and Values, including Mathematics in the New Zealand Curriculum (MoE, 1992).
The Australian Statement and New Zealand Framework followed similar moves in the United States by the National Council of Teachers of Mathematics (NCTM, 1989), to suggest a mathematics curriculum for that country: Curriculum and Evaluation Standards for School Mathematics. As well as including general standards on Problem Solving, Communication, Reasoning, Connections, and Estimation, standards for Statistics and Probability were included for all three grade level groupings of the Standards (Grades K-4, 5–8 and 9–12). As Jones and Tarr (2010) report in detail, this was the culmination of various attempts over the 20th century to include Statistics and Probability in school curriculum. Worth noting is the specific reference in the Connections Standard that students use mathematics in other curriculum areas and in their daily lives (Grades K-4, p. 32); apply mathematical thinking and modelling to solve problems that arise in other disciplines, such as art, music, psychology, science and business; and value the role of mathematics in our culture and society (Grades 5–8, p. 83); use and value the connections between mathematics and other disciplines (Grades 9–12, p. 148).
These points not only reflected the general views about mathematics of Freudenthal (1968), but also those of Rao (1975) who claimed that statistics cannot exist without context. As well, they were reflected in Australia in the Work Samples (AEC, 1994b) provided for the 1991 curriculum.
The curriculum profile for Mathematics (AEC, 1994a) detailed the desired outcomes from the Australian curriculum for Chance and Data under five headings: understanding, estimating and measuring chance variation; collecting data; organising data; displaying and summarising data and interpreting data. Similarly in New Zealand, there were three headings for Statistics: recognise appropriate statistical data for collection and develop the skills of collecting, organising and analysing data, and presenting reports and summaries; interpret data presented in charts, tables and graphs of various kinds and develop the ability to estimate probabilities and to use probabilities for prediction (MoE, 1992, p. 10). Although often procedurally based with very few explicit mentions of variability and suggestions of a limited range of contexts, overall, these profiling descriptions did implicitly align with the American Statistical Association’s later Guidelines for Assessment and Instruction in Statistics Education (GAISE) Report (Bargagliotti et al., 2020; Franklin et al., 2007), which describes statistical problem solving as, Formulate Questions – Anticipating Variability; Collect Data – Acknowledging Variability; Analyse Data – Accounting for Variability; Interpret Results – Allowing for Variability.
The explicit acknowledgement of the essential nature of variation in the GAISE description is critical in building meaningful classroom activities and requires a high profile in the classroom. Research has shown that although traditional statistics texts introduced “expectation” (e.g., related to averages) earlier than “variation” (e.g., related to the standard deviation), students’ informal appreciation of variation in authentic contexts develops before their appreciation of expectation (Shaughnessy, 1997; Watson, 2005). Variation was also considered one of the types of thinking fundamental to statistical thinking by Wild and Pfannkuch (1999) when they introduced their Statistical Investigative Cycle.
In New Zealand, the status of statistics rose in the curriculum when the title of Mathematics was extended to Mathematics and Statistics (MoE, 2007). Following the initial version of the Australian Curriculum: Mathematics (ACARA, 2020) in 2010, the Australian Association of Mathematics Teachers (AAMT) sponsored the creation of Top Drawer Teachers, an extensive website to assist teachers in interpreting and implementing the new curriculum in the classroom. The Statistics “drawer” (Watson et al., 2013) focused on five “Big Ideas” underpinning the Statistics and Probability section of the curriculum for statistical problem solving, with their relationships illustrated in Figure 1.
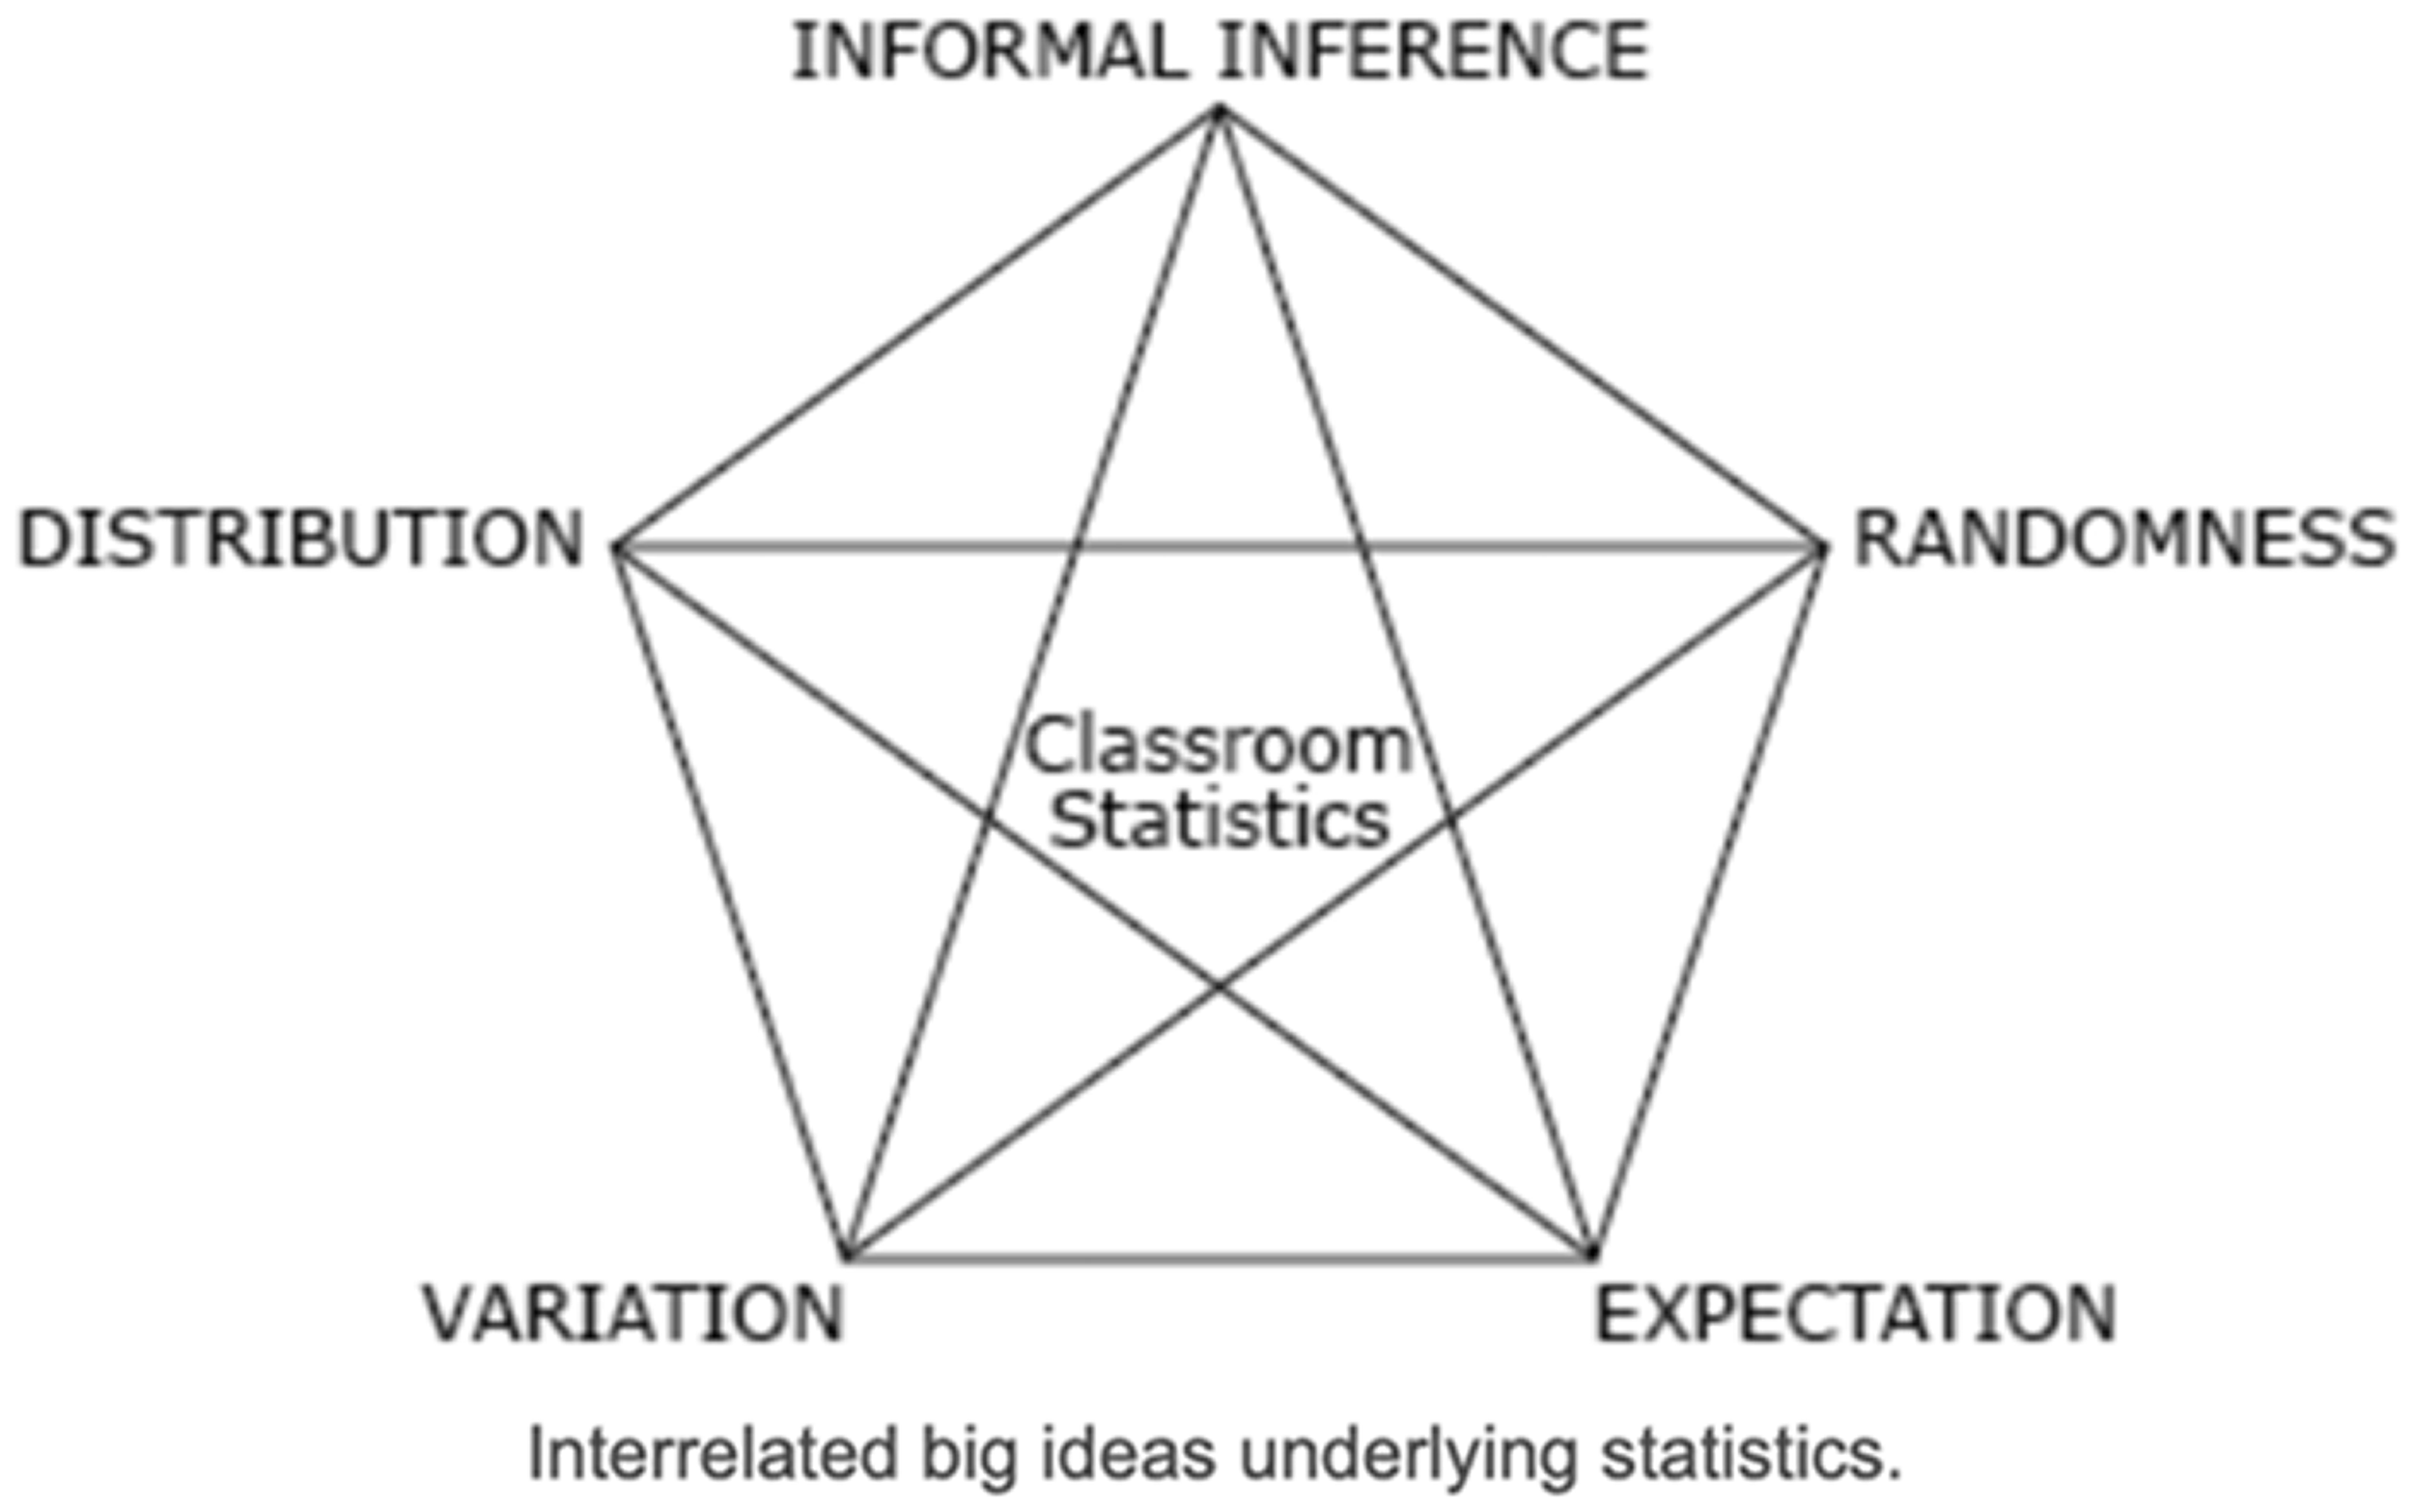
The Big Ideas of Statistics at school (Watson et al., 2013).
The description of the interactions of the Big Ideas in classroom activities was described as follows: Variation is the term that describes the differences we observe around us in every aspect of life. Expectation arises when we wish to harness variation and summarise data, e.g. by finding a typical value in a data set or the chance of a random event. Distribution is the lens through which we look at variation, used to identify and describe variation and look for and confirm expectations. Randomness describes a phenomenon in which the outcome of a single repetition is uncertain, but there is nonetheless a regular distribution of relative frequencies in a large number of repetitions. Informal Inference is the evidence-based process balancing the variation and expectation found in sample data when answering a meaningful population-based question, acknowledging uncertainty. (Watson et al., 2013).
The relationships among these Big Ideas became important in the development of the Statistical Reasoning Learning Progression (Callingham et al., 2019) and the focus of the Reframing Mathematical Futures II (RMFII) project (Siemon, 2013), as described in the next section.
The explicit connection between these Big Ideas and the reasoning proficiency is clear, but they are also linked to the other proficiencies: informal inference is the application of statistical problem solving, understanding is the focus of the four other Big Ideas, and fluency comes in recognising the connections among them. However, as noted earlier, the place of the proficiencies in the AC: M is somewhat ill-defined and considerably under-represented (McCluskey et al., 2016), with an over-emphasis on content in its structure. Atweh and Goos (2011) concluded that … the identification of content into the traditional mathematical fields of mathematics may be convenient in a syllabus, but it does not lend itself to dealing with real-world applications that often require cross-disciplinary approaches. With the increasing focus on overall capacities in thinking about preparing students for future, it is left to teachers to see how the content can be used to develop the cross-curriculum competencies, and the higher order proficiencies identified in the Australian Curriculum: Mathematics. (p. 223)
McCluskey et al. (2016) conducted a content analysis to identify the incidence of key proficiency terms (KPTs) embedded in the content descriptions from Foundation (the first year of full time schooling) to Year 9 of the AC: M. Their analysis revealed a much lower representation of “actions” relating to the reasoning proficiency than to the other three proficiencies. They proposed that “all four proficiency strands of understanding, fluency, problem solving, and reasoning in the AC: M can naturally work together as an integrated whole, in a cyclic structure, building and deepening generalised patterns of mathematical understanding” (McCluskey et al., 2016, p. 453). Such an integrated whole is consistent with the development of the learning progressions and building the relationships among the Big Ideas on which they are founded. As students move along the progressions, there is an increasing sophistication in students’ reasoning, with corresponding “fluency in recognising and engaging with similar problems, strengthened [over time] with an increasing capacity to transfer understanding to new contexts” (McCluskey et al., 2016, p. 453).
Learning progressions
Learning progressions (trajectories) as ‘road maps’ for teaching are gaining traction as one way of providing information to teachers. Although there are various definitions of learning progressions, here the phrase is taken to mean an evidence-based sequence of key concepts in mathematics, supported by suggested approaches to learning and teaching that are tailored to different stages of the sequence. It is akin to ideas about developmental progressions (Clements & Sarama, 2004) but, unlike earlier notions of development such as those of Piaget (Huitt & Hummel, 2003), it is recognised that progression towards full understanding is not invariant. Indeed, Confrey et al. (2019) use the metaphor of climbing a wall …for which a variety of starting points are likely and expected, and multiple paths, containing predictable obstacles and footholds, are possible for successfully ascending the wall. Some paths may be more challenging and lead to more obstacles than others and some footholds may be more difficult to reach than others. However, these paths are predictable, and when used to formatively assess students’ understanding, can inform teachers’ instruction and guide students’ learning. (p. 79)
Confrey et al. (2014) demonstrated how several different learning progressions could be brought together and mapped onto the Common Core State Standards for Mathematics (CCSS-M) curriculum (Common Core State Standards Initiative, 2010). Siemon et al. (2006) took a different approach, identifying Big Ideas in multiplicative thinking and developing both a measurement scale and teaching advice for teachers to support the growth of multiplicative thinking across the middle years of schooling. Both approaches have promise for curriculum development.
In relation specifically to chance and data, Watson and Callingham (2003) developed an empirical hierarchy of statistical literacy. They used archived responses to survey items from over 3000 Australian students in Year 3 to Year 8 to explore a hypothesised construct using Rasch analysis, identifying a “complex hierarchical construct” that could be segmented (Wilson, 1999) into six levels of complexity. Using the same approach, and a subset of the initial 80 items, the construct was verified and validated with a new group of students (Callingham & Watson, 2005). Furthermore, using data collected some 10 years after the original analysis, an empirical approach again verified the original construct (Callingham & Watson, 2017), suggesting that the underlying construct was stable across time.
The Reframing Mathematical Futures II (RMFII) project (Siemon, 2013) used some items from the earlier studies (Callingham & Watson, 2005, 2017; Watson & Callingham, 2003) in chance and data and additional items developed specifically to address identified gaps. The focus in RMFII was mathematical reasoning in the domains of algebraic, geometric and statistical reasoning (Siemon et al., 2018). The scale produced from the statistics items was divided into eight “zones” to meet the requirements of the project and interpreted as Statistical Reasoning. Additionally, Watson et al.’s (2013) characterisation of five Big Ideas (Figure 1), Variation, Expectation, Distribution, Randomness and Informal Inference, were consolidated into three clusters: Variation with Expectation and Randomness (VER), Variation with Distribution and Expectation (VDE) and Variation with Informal Inference (VII). These three clusters acknowledged the importance of variation underpinning statistical reasoning and Watson et al.’s (2013) Big Ideas, along with the content demands of the AC: M.
Statistical reasoning learning progression
The development of the Statistical Reasoning Learning Progression has been detailed elsewhere (Callingham et al., 2019). The eight zones describe the increasing sophistication with which students reason in statistical and probabilistic contexts. These zones were developed using responses from students across the middle years of schooling (Years 7 to 10), but earlier work on statistical literacy included younger students. Hence, the learning progression itself is suitable as a basis for developing a curriculum across Years 5 to 10 that is not grade or year level based. Rather, it provides a starting point for teaching at a level that students can understand.
Figure 2 presents the Statistical Reasoning Learning Progression using the three clusters of VER, VDE and VII. Students in Zone 1 have only a limited understanding of statistical ideas, although they do have some mathematical skills, such as simple graph reading, and can provide familiar examples of real-world variation. By Zone 4, students have developed some understanding of variability and can express likely outcomes from straightforward frequency counts such as a ‘one in six’ chance of rolling a three on a die. They may recognise the impact of a large sample size by using language such as ‘ask everyone’. They use graphs and compare two graphs but focus on one variable at a time. In Zone 8, students have developed a sophisticated sense of variation and construct sound arguments based on statistical evidence. They acknowledge uncertainty in the inferences they draw and make decisions based on evidence rather than opinion. This progression acknowledges the skill development needed, such as using measures of central tendency, but places these within a reasoning framework where students have to apply their knowledge to make decisions and draw inferences from data.
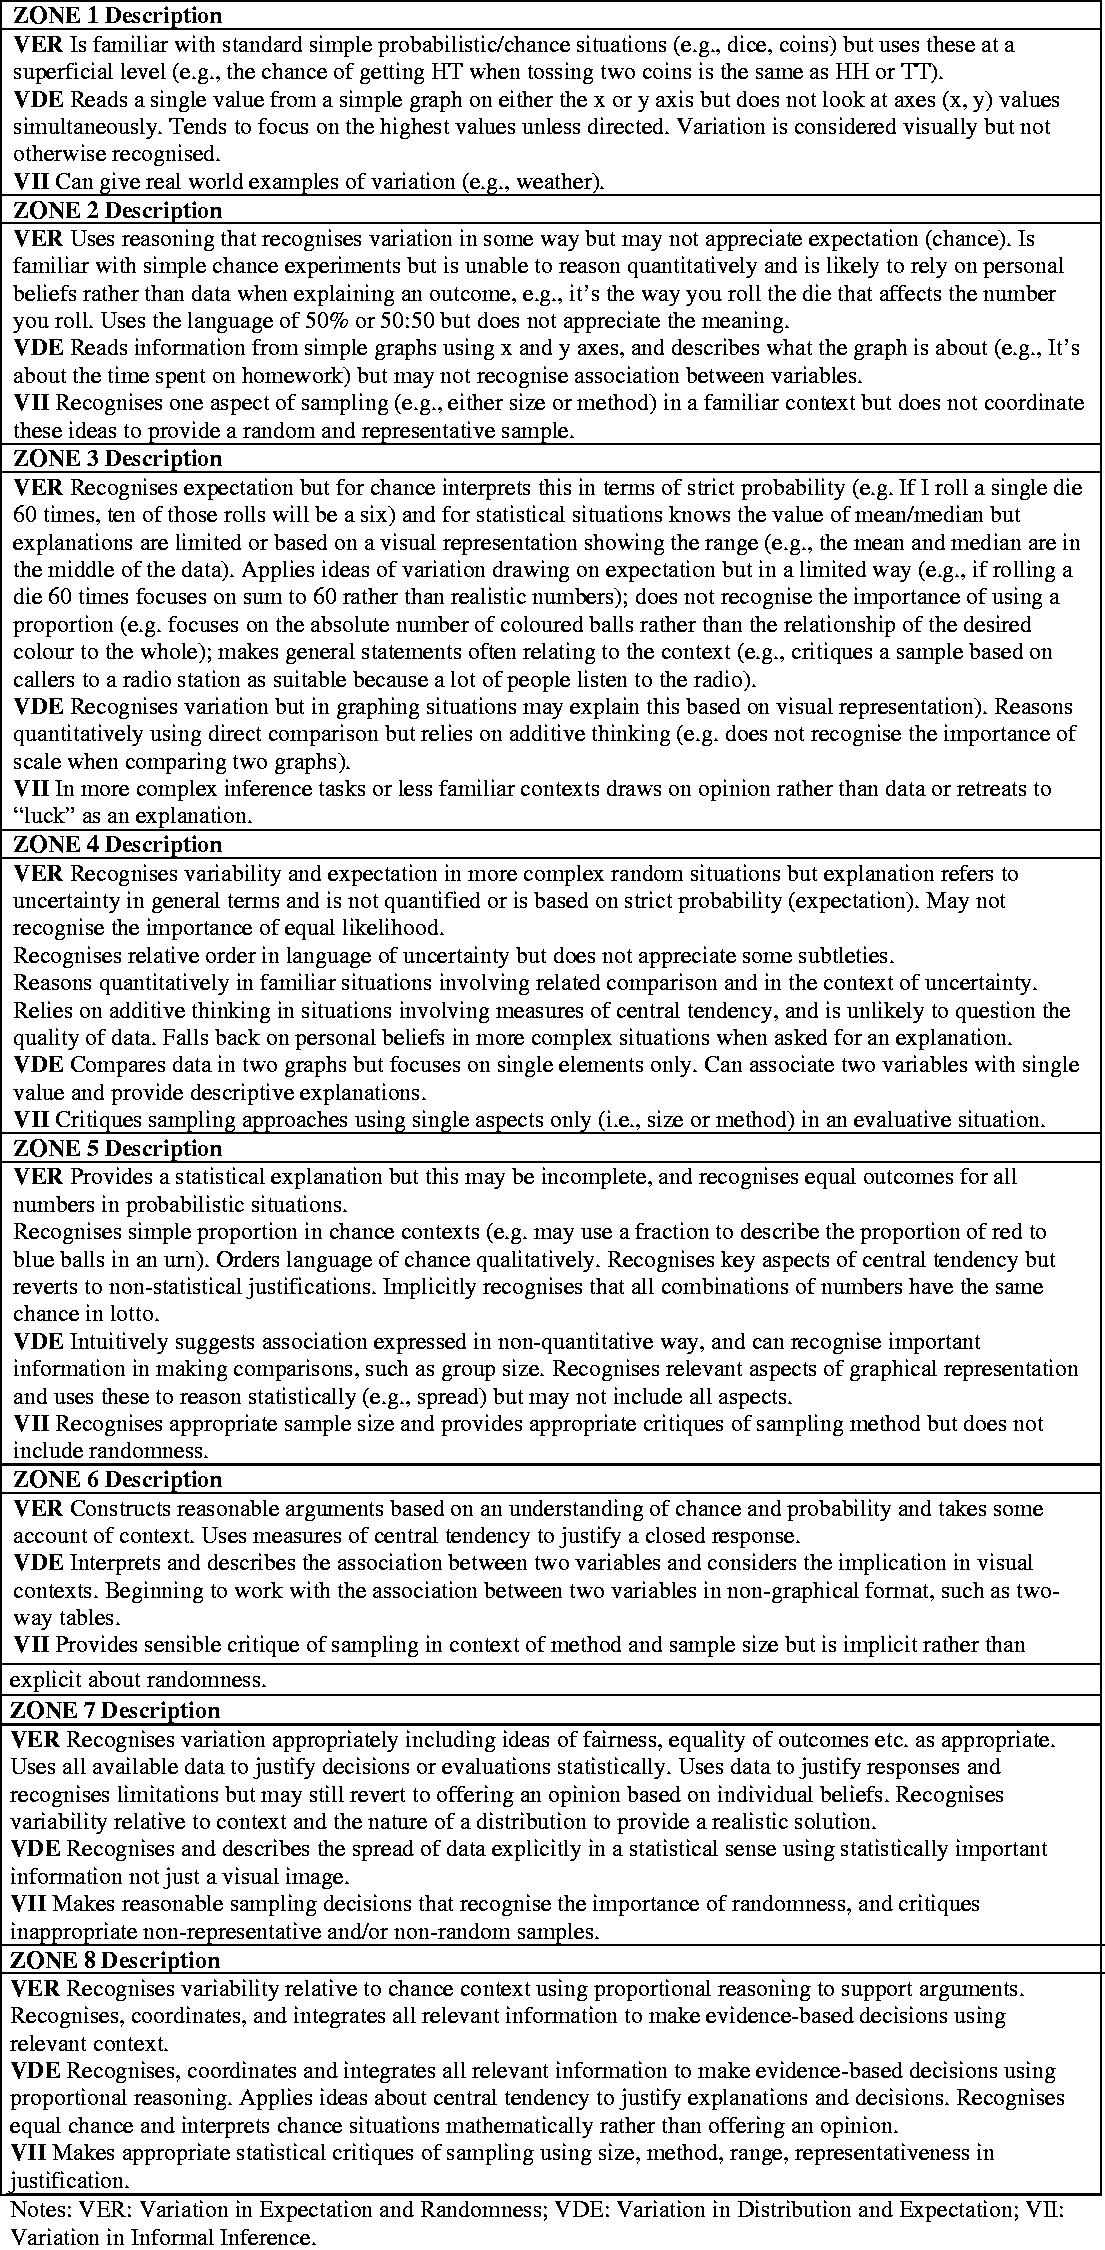
The Statistical Reasoning Learning Progression showing eight zones with the three Big Ideas.
Any curriculum developed from the Statistical Reasoning Learning Progression should take account of the interplay of content knowledge with cognitive processes, such as the proficiencies. Statistics, however, is always situated within a context (Rao, 1975). Hence, any pedagogical approach must include opportunities for students to think about statistics in appropriate contexts. The PPDAC (Problem, Plan, Data, Analysis, Conclusion) cycle (Wild & Pfannkuch, 1999) has been widely adopted by schools in New Zealand. This cycle is similar to that suggested by GAISE (Bargagliotti et al., 2020; Franklin et al., 2007), and provides a framework for teaching. Through careful choice of contexts and problems, teachers can plan learning and teaching activities that address the required content knowledge as well as developing conceptual understanding through the proficiencies. Teaching through statistical investigations in contexts that are of interest to students is likely to support development of the “productive dispositions” advocated by Kilpatrick et al. (2001).
A learning progression curriculum for statistics and probability
Figure 3 provides examples of a possible curriculum exemplified in Zones 1, 4, 7 and 8 of the Statistical Reasoning Learning Progression (SRLP). For space reasons, the full progression cannot be presented. The left-hand column presents suggested curriculum statements based on the learning progression shown in Figure 2. Some of the current content descriptors from the AC: M, along with the year level from which they are taken, aligned with these suggested concepts are shown in the right-hand column. Although the AC: M content descriptions are associated with specific year levels, this curriculum is zone based and intended to be delivered as students are ready. The zone descriptors may cover broader concepts than the relatively narrow content descriptors, but the current AC: M content outcomes can be met through activities intended to develop statistical reasoning.
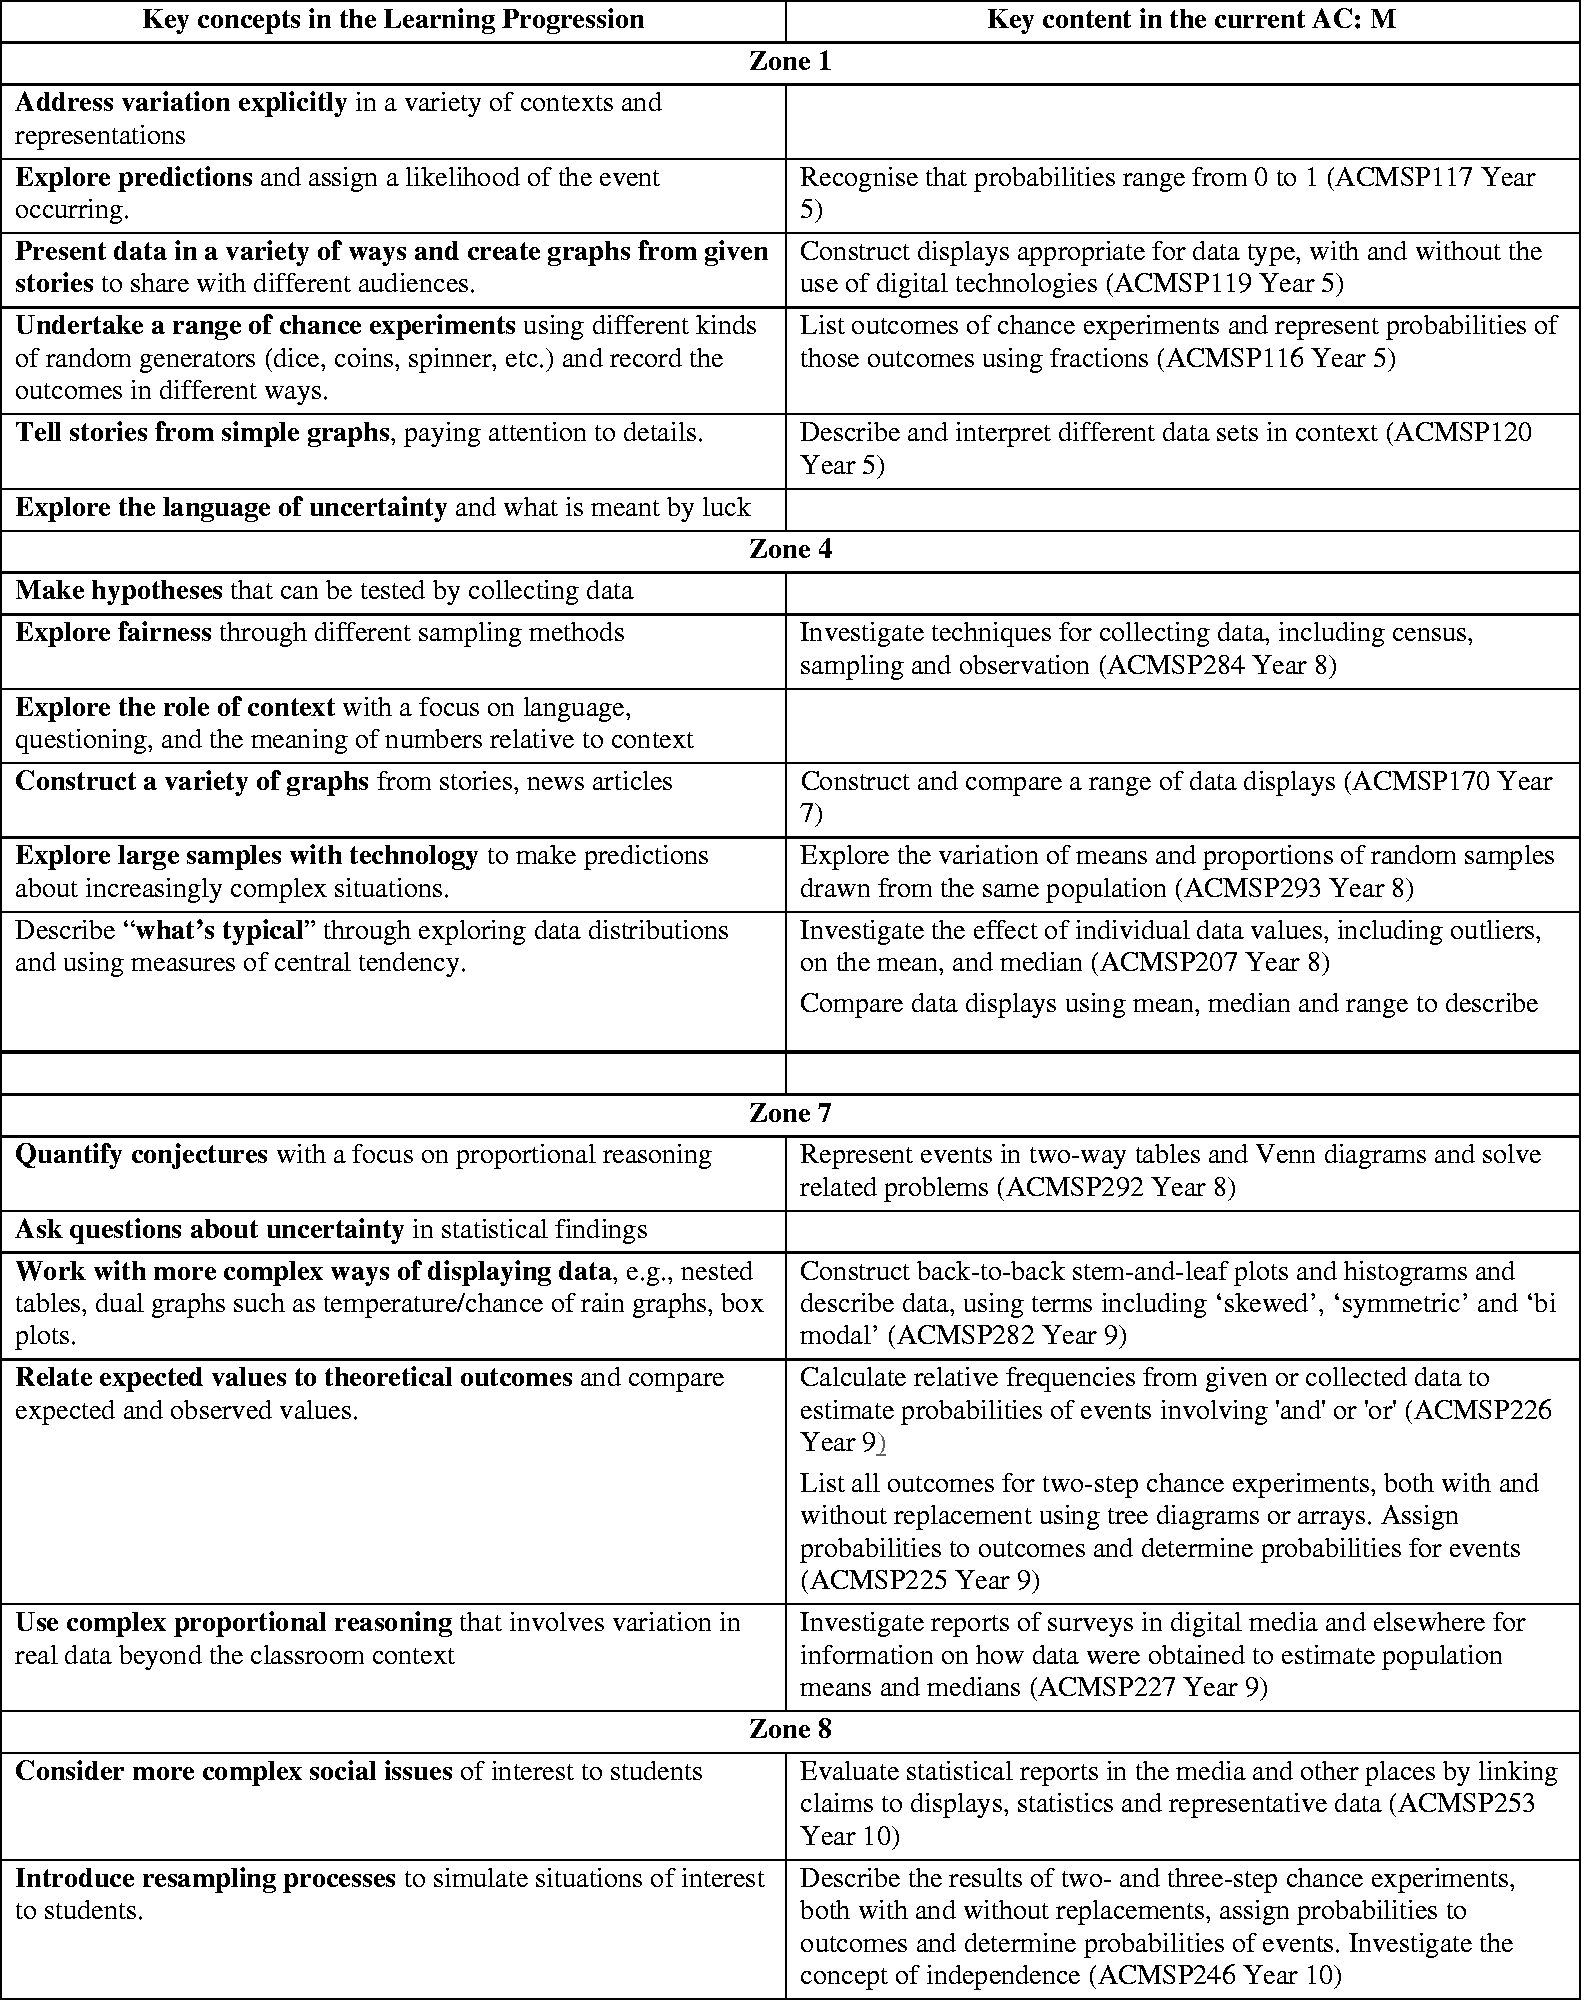
Examples of a suggested curriculum based on the Statistical Reasoning Learning Progression.
In the higher zones, the links between statistics and probability are emphasised. At present, there is no recognition in the AC: M of ideas such as observed and expected values, but these are fundamental to statistical techniques and address the variation inherent in data, ultimately leading to ideas such as confidence intervals. Although formal teaching of confidence intervals in the middle years would be inappropriate, laying the foundation for such ideas is critical.
Similarly, the role of context is not addressed in the current AC: M. Although the current AC: M neglects context in relation to Statistics and Probability, the rest of the Australian Curriculum (ACARA, 2020) does not. Reference to data in the contexts of other subjects occurs at least 15 times in Science, 39 times in Geography and 14 times in F-6/7 Humanities and Social Sciences. As one example from the Sequence of Content for Economics and Business, the Sub-strand, ‘Questioning and research’, at Year 9/10 requires students to, “Gather relevant and reliable data and information from a range of digital, online and print sources”, and the related Sub-strand, ‘Analysis, synthesis and interpretation’, requires, “Analyse data and information in different formats to explain cause-and-effect relationships, make predictions and illustrate alternative perspectives.”
The suggested SRLP curriculum descriptors include explicit acknowledgment of the importance of context. They indicate that students may need to use different approaches, for example when displaying data to convey meaning to a range of audiences. Students are expected to explore, conjecture and predict, which helps them to make connections among the Big Ideas. The SRLP curriculum is underpinned by the proficiencies and demands that teachers move beyond procedural mathematical statistics, such as computation of the arithmetic mean.
The AC: M content descriptors shown here are considerably more limited and procedural than the suggested curriculum statements based on the Statistical Reasoning Learning Progression. Although the AC: M currently acknowledges the importance of the proficiencies, it does not provide help for teachers to develop them. Rather it focuses on the development of procedural mathematical statistics. A curriculum such as the one proposed in this article places the proficiencies at the centre, without downplaying the content knowledge or prescribing the approach to teaching.
Figure 3 also shows the decoupling of the SRLP curriculum from year-level statements. In Zone 4, for example, there are descriptors from the AC: M from Years 7, 8 and 9. The finer grain of the SRLP curriculum, with the eight zones covering six year levels (Year 5 to Year 10) gives teachers greater information about the building blocks needed for students to progress.
One advantage of a curriculum based on a learning progression is that it can link to classroom teaching in ways that make sense to teachers. Students in classrooms are rarely at the same points in their learning and may not be ready to learn or may already understand the curriculum content. A learning progression curriculum provides a way for teachers to accommodate students operating at several different levels through a single activity. Callingham et al. (2019) provide examples of a process for such an endeavour, and Watson (2017) and Watson and Fitzallen (2019) describe an approach to professional learning based on the use of rich classroom tasks that accommodate a range of students’ reasoning.
Concluding remarks
A curriculum based on a learning progression with foundations in mathematical proficiencies requires a shift in mindset. Instead of a focus on curriculum content, the emphasis is on students’ progression from their current identified knowledge of key concepts to a deeper knowledge, built on use of the mathematical proficiencies that underpin the current AC: M. Such a curriculum goes beyond a scope and sequence of mathematical content, and emphasises the thinking required to develop deep mathematical knowledge. It can be applied in a variety of subject contexts, meeting not only mathematical outcomes but also some of those indicated in other subject areas. The use of rich classroom tasks allows teachers to meet a range of student learning needs without having to individualise the curriculum.
The Statistical Reasoning Learning Progression is explicitly underpinned by the AC: M reasoning proficiency. Such a targeted approach is consistent with the overall intent of the AC: M proficiencies, with students developing understanding and fluency through building connections and identifying the relationships among the Big Ideas of statistics, and in explaining and justifying reasoning in authentic problem-solving contexts. Further, the proposed curriculum links the content elements of the curriculum in an integrated manner that draws on the key concepts of the learning progression. Using such a targeted approach explicitly acknowledges the connections between the content and the interrelationships intended by the proficiencies, and in doing so, provides a means for students to systematically develop their reasoning at their own level of conceptual understanding.
Footnotes
Declaration of Conflicting Interests
The author(s) declared no potential conflicts of interest with respect to the research, authorship, and/or publication of this article.
Funding
The author(s) disclosed receipt of the following financial support for the research, authorship, and/or publication of this article: The Statistical Reasoning Learning Progression was developed during the Reframing Mathematical Futures II Project funded by the Australian Government Department of Education through the Australian Mathematics and Science Partnership Program 2014–2017.