
Abstract
Homework has been associated with a range of academic and cognitive benefits for secondary students. Research has also revealed that students’ homework behaviours can vary with demographic traits. An important factor that may account for some of this variation is the role played by teachers and schools in homework allocation. It is hypothesised that some of the demographic variables that have been found to predict individual students’ homework practices are also related to teachers’ practices in terms of the frequency and volume of homework allocated at the classroom level. To test this hypothesis, Australian data from the 2015 Trends in International Mathematics and Science Study are analysed in the current study. Results show that the frequency of mathematics homework allocated by teachers is related to some variables that have commonly predicted the differences in student achievement such as socioeconomic status, valuing of and confidence in mathematics, teaching experience and school location. The implications of these findings for schools and education systems are explored as suggestions for ensuring that homework policies and practices do not exacerbate demographic differences in school outcomes.
Keywords
Introduction
Positive correlations between homework practices – whether measured by time spent on homework or the frequency of homework tasks – and student achievement, particularly for secondary school students, have been found in previous research (Cooper, 1989a; Daw, 2012; Hattie, 2013; Horsley & Walker, 2013; OECD, 2014, 2016). The identified benefits of homework also include increased time-on-task, improved self-regulation and other meta-cognitive capacities, and providing more opportunities for parental involvement (Bempechat, 2010; Cooper, 1989b; Patall et al., 2008; Ramdass & Zimmerman, 2011). However, there has been less focus on the demographic and other student-level factors that may promote or inhibit homework (Horsley & Walker, 2013; New South Wales Department of Education and Communities, 2012). This relative lack of research is surprising given the potential an understanding of these factors may offer to inform the development of policies and practices that may improve student learning. Large-scale studies like the Program for International Student Assessment (PISA) and Trends in International Mathematics and Science Study (TIMSS) provide an opportunity to gain a better understanding of which factors predict differences in students’ homework practice, and how to effectively address what are sometimes identified as negative equity effects for homework (Lamkin & Saleh, 2010; OECD, 2014; Rønning, 2011).
PISA data from 2012 revealed that students’ reported homework time was negatively correlated with socioeconomic status (SES; OECD, 2014). Gender has also been found to influence homework, with girls generally reporting more homework time (Mau & Lynn, 2000) although this may be moderated by school subject, as Kitsantas et al. (2011) found boys reported more homework time than girls for mathematics. Examining 2012 Australian PISA data, Bowd et al. (2016) found that variables often associated with variation in achievement also predicted the amount of time students reported spending on homework as well as how often they reported completing mathematics homework on time. These variables included measures of student SES, gender, previous achievement, students’ language background, school location (metropolitan compared to non-metropolitan) and school type (government compared to non-government).
An important factor that was not examined in the research described above was the relationship between student demography and teachers’ practices in allocating homework. Whilst previous research has included teachers’ homework practices as predictors of students’ homework output, they have tended not to examine the determinants of those practices which were often measured by students’ perspectives rather than teachers’ reports. For example, in Trautwein et al. (2006), teachers’ practices were indicated by students’ perceptions of homework quality and perceived level of teacher control, aggregated at the classroom level, and not defined by teachers themselves; a similar approach was employed by Rosário et al. (2018). Similarly, Fernández-Alonso et al. (2015) based their teacher-level measures of homework frequency and homework time on students’ questionnaire responses aggregated at the classroom level.
It is possible that demographically patterned differences in students’ homework practices are a result of similarly patterned differences in the way teachers, schools or systems allocate homework. Research around the effects of teacher expectations on practice may offer a useful explanation for demographic differences in teachers’ homework practices and are discussed below.
Teacher expectations and differential teaching practices
Research on the effects of teachers’ expectations on teaching practices and student achievement has a long history (Johnston et al., 2019; Jussim et al., 2009; Weinstein, 2018). Johnston et al. (2019) defined teacher expectations as ‘inferred judgments that teachers base on their knowledge of students about ‘if, when, and what’ students can achieve at school’ (p. 2). This is quite a general definition, although they also noted that teacher expectations have been operationalised in a wide variety of ways by researchers in the field. Frequently, teacher expectations are defined as teachers’ potentially biased perceptions of ‘students’ future ability to succeed’ (Brault et al., 2014, p. 149). The theoretical processes through which teachers’ expectations generate student outcomes were initially outlined by Brophy and Good (1970). Briefly, in this process: (1) teachers formed expectations of their students’ capacities which, (2) manifested as differential treatment in response to those expectations which lead to, (3) students’ reacting to differential treatment causing, (4) differential outcomes which, (5) ‘show up in the achievement tests given at the end of the year, providing support for the “self-fulfilling prophecy” notion.’ (Brophy & Good, 1970, p. 366).
Johnston et al. (2019) noted that much of the research addressing teacher expectation effects has focused on the first and last steps of the process described above and has ‘glossed over the complex processes through which teacher expectations impact upon student outcomes’ (p. 7). However; Jussim et al. (2009) described many of the ways in which teacher practices may vary in line with their high or low expectations of their students, noting that … teachers often provide greater input into high expectancy students’ education, they spend more time with and provide more attention to high expectancy students. They also may teach more material to high expectancy students (and) often provide more high expectancy students with more opportunities for output. (p. 364) Studies that investigate teacher expectations of individual students ask the question, what is it about students that mean their teacher may have high or low expectations for them? In contrast, studies that examine expectations at a class level, ask the question, what is it about teachers that mean they may have high or low expectations for their students? (2010, p. 123)
Research has suggested that students’ demographic characteristics may influence teachers’ expectations of their students and, subsequently, their classroom practices. Jæger and Møllegaard’s (2017) twin study suggested that teachers’ expectations about their students were influenced by measures of student cultural capital. Van Houtte (2006) found that teachers had different expectations and employed different practices for Dutch students in academic tracks and streams that were highly correlated with student SES. Johnston and Wildy (2018) observed similar effects for streamed secondary classes in Western Australia. Lee and Ginsburg (2007) found that even in preschools, teachers employed different approaches to literacy and mathematics for low and high SES students.
The questions asked in this article were whether the demographic traits of students that predicted students’ homework practices in previous research could plausibly be due to their effect on their teachers’ homework allocation practices. Of interest is whether teachers’ homework practices reflect their assessments of their student’s motivation levels and capabilities. The degree to which any relationships between homework practices and demography are mediated by students’ self-reported dispositions may offer some support to the idea that teachers’ expectations are largely accurate (Jussim, 2017).
Given that variations in teachers’ homework practices are likely to be greater between, rather than within classes, it makes sense to use student traits aggregated at the classroom level as predictor variables (e.g., see Friedrich et al., 2015). Australian TIMSS 2015 data allow such analysis. For simplicity, and due to the fact that domain-level variation in students’ homework practices has been identified by some researchers (Trautwein et al., 2006), the analysis conducted here was restricted to Year 8 mathematics classes.
Research questions
Homework practice and student demographics
We expected to find that relationships between demography and homework behaviours for students reported in the studies cited above reflected in teacher practices. The demographic predictor variables examined in the current study include a measure of classroom-level student SES, geographic location, the proportion of male students and the proportion of students from English-speaking backgrounds in classes. We predicted that teachers would allocate less homework – as measured by the amount of time they estimated to be required for completion by the ‘average’ student in their class – and less frequent homework assignments for low SES and non-metropolitan classes. Classroom gender balance was not expected to affect teachers’ mathematics homework practices as classes tend to be relatively gender balanced except for single sex schools which are more frequently found in the non-government sector or in selective schools. These schools tend to have higher SES profiles (Bonnor & Shepherd, 2016). We predicted that classes with lower proportions of students from English-speaking backgrounds would be allocated less homework time with lower homework frequency.
Homework practice and teacher expectations
In line with the process outlined by Brophy and Good (1970) we expected that teachers’ homework practices would be predicted by their perceptions of the degree to which their teaching strategies were limited by their students’ capacities and attitudes toward mathematics within their classrooms. We predicted that teachers who felt that they were more limited by these classroom traits would allocate lower volumes of homework and allocate homework less frequently.
Homework practice and students’ attitudes towards mathematics
The accuracy of teacher expectations has been measured in a variety of ways but a common method is to compare expectations for student outcomes with prior achievement (Timmermans et al., 2015). The expectation indicators used in the present study relate explicitly to relationships between teachers’ assessments of their students and implications for their practices at the classroom level. We used students’ own assessments of their mathematics confidence and the degree to which they value mathematics to assess the accuracy of teachers’ assessments of these traits of their students averaged at the class level although we acknowledge that they may not be completely independent constructs. We predicted that teachers would allocate more homework, and homework more frequently to students who attached more value to mathematics and were more confident in their skills.
It has been reported that teachers’ expectations for low-SES students are often inaccurate and downwardly biased (Barbarin & Aikens, 2015; Rubie-Davies, 2018). If, as suggested by Jussim (2017), teachers’ expectations are based on accurate assessments of their students, we would expect the relationship between TIMSS’ measure of student SES (aggregated at the classroom level) and teachers’ homework practices to be mediated by measures of students’ self-reported attitudes towards mathematics aggregated at the class level.
Homework practice and teacher traits
Finally, relationships between Australian teachers’ experience (measured in years) and a range of classroom practices have been found for Australian secondary schools in data from the OECD’s Teaching and Learning International Survey. Thomson and Hillman (2019) reported that novice teachers (i.e. teachers with five years of experience or less) were concentrated in government schools and rural schools, both of which were associated with lower reported homework time in the studies described above. On this basis we predicted that less experienced teachers would allocate less homework. We also included the degree to which teachers felt that they had too much material to cover in class as it has been observed that curriculum overload may lead to excessive study time, including homework (OECD, 2020). We predicted that teacher experience and perceptions of curriculum overload would vary with teachers’ homework practices.
Method
TIMSS data
The units of analysis in this research were individual teacher/class combinations from the 2015 Australian TIMSS data which is a large-scale international survey conducted every four years by the International Association for the Evaluation of Educational Achievement (IEA, 2016). In 2015, TIMSS recorded data for 10,338 Australian Year 8 students in 285 schools, with data collected from 854 mathematics teachers across 645 classes (Thomson et al., 2017).
TIMSS samples classes within schools with equal probability. Hence, in order to ensure a sufficient number of students in the sample, small classes are combined into pseudo classes which are then dissolved back into their original classes after their selection. To validly link teacher practices and aggregated student characteristics, only teachers with 10 or more students in their class were included in the analysis in the current study, leaving 429 teacher/class combinations with an average class size of 21.9 students. 1
TIMSS samples are designed primarily to provide population estimates of mathematics and science performance of students in Grades 4 and 8 in participating countries. Teacher responses are obtained from those who teach the students in the sampled classes. As the IEA states: ‘It is important to note that the teachers in the teacher background data files do not constitute a representative sample of teachers in a country, but rather are the teachers who taught a representative sample of students’ (Foy, 2017, p. 60).
Hence, results of this study, which treated teachers as the primary units of analysis, have to be considered to be indicative rather than representative of all teachers in Australia.
Teacher homework practice variables
Homework time. The TIMSS 8th Grade Teacher Questionnaire asked: ‘When you assign mathematics homework to the students in this class, about how many minutes do you usually assign? (Consider the time it would take an average student in your class.)’. Response options were: ‘15 minutes or less’, ‘16–30 minutes’, ‘31–60 minutes’, ‘61–90 minutes’ and ‘More than 90 minutes’. No teachers in the data set generated for the current study selected the ‘More than 90 minutes’ option. Due to the low number of teachers selecting the ‘61–90 minutes’ category (less than 0.6% of non-missing responses), these were combined with the ‘31–60 minutes’ category.
Homework frequency. For homework frequency, the questionnaire asked teachers: ‘How often do you usually assign mathematics homework to the students in this class?’ Response options were ‘I do not assign mathematics homework’, ‘Less than once a week’, ‘1 or 2 times a week’, ‘3 or 4 times a week’ and ‘every day’. Teachers who selected the ‘I do not assign mathematics homework’ option here were assigned to the ‘15 minutes or less’ category in the homework time variable where a teacher’s response was missing in that category as they logically allocated zero minutes of homework. For the homework frequency variable, the ‘every day’ and ‘3 or 4 times a week’ were merged into a ‘more than 2 times a week category’ due to the low number of teachers selecting the ‘every day’ option (around 8% of non-missing responses). The least frequently used response category, ‘I do not assign mathematics homework’ was merged with the ‘Less than once a week’ category due to a low number of teachers indicating that they did not assign homework (around 5%).
The teacher homework variables described here were the dependent variables for the ordinal logistic regression models analysed below. Independent variables for those models are described in the next section.
Teachers’ perceptions of students’ capacity and engagement levels
Teaching limited by students lacking prerequisite knowledge or skills and uninterested students. In relation to students in their classrooms, teachers were also asked the degree to which how teaching in their class was limited by ‘Students lacking prerequisite knowledge or skills’ and ‘Uninterested students’. Responses to each of these questions were ‘Not at all’, ‘Some’ and ‘A lot’. Respectively, these variables measured teachers’ perceptions of their students’ capabilities and engagement within their classes although the ‘prerequisite knowledge or skills’ statement would seem to refer to students’ capabilities in relation to curriculum expectations, rather than their inherent capabilities. Class level variables as indicators of teachers’ expectations were different from those used in other studies (e.g. Friedrich et al., 2015; McKown & Weinstein, 2008) in that they were framed in the context of how students’ attributes affected teaching practices for a particular class, rather than in isolation. These differences aside, these variables satisfied the definition of teachers’ expectations provided by Johnston et al. (2019), quoted above, in reflecting ‘judgements based on their knowledge of students about “if, when and what” their students can achieve at school.’ (p. 2)
Aggregated student-level variables
Students value mathematics. The degree to which individual students valued mathematics was measured by a scale derived from responses to nine questionnaire items relating mostly to the instrumental benefits of succeeding in mathematics studies. The resulting score was rescaled so that across participating countries the mean score was 10 with a standard deviation of two. For the Australian Year 8 sample the mean score on this scale was 9.9 (SE = 0.04; Cronbach's α = .90; Martin et al., 2016; Mullis et al., 2016). Below, this variable will be referred to as ClassVal.
Mathematics confidence. The mathematics confidence score was derived from nine items with four-point scales and rescaled in the same ways as the ClassVal scale. The Australian mean score for the confidence scale was 9.7 (SE = 0.03; Cronbach's α = .90; Martin et al., 2016; Mullis et al., 2016). The means of these scores were calculated for each teacher/classroom combination containing 10 or more students. Below, this variable will be referred to as ClassConf.
Home educational resources (HERs). The TIMSS HER Scale was derived from three questions assessing the number of books in students’ homes, other educational supports such as internet connections, and the highest educational attainment of either parent. For the Year 8 Australian sample, the mean score on this scale was 11.1 (SE = 0.04; Cronbach's α = .40; Martin et al., 2016; Mullis et al., 2016). Again, the means for these scores were calculated for teacher/class combinations meeting eligibility criteria. It is important to note that the scale statistics presented above accounted for sampling weights and replicate weights for students whereas the analysis conducted below did not.
School location. School locations were collapsed into a two-level variable (metropolitan and non-metropolitan).
Language spoken at home. The percentage of students from homes where English was ‘Always’ or ‘Almost always’ spoken was calculated for each teacher/class combination within the scope of the current study.
Percentage of male students. The percentage of male students was also calculated for each teacher/class combination within the scope of the study.
Teacher-level variables
Teacher experience. Years of teaching experience were also captured with the Australian average being 16 years (SE = 0.70; Mullis et al., 2016). This variable was included as a control because of research findings suggesting that teaching practices may differ with levels of experience, described above.
Too much material to cover in class. Teachers also indicated the extent to which they agreed with the statement: ‘I have too much material to cover in class’. Responses to the latter question were on a four-point scale ranging from ‘Agree a lot’ to ‘Disagree a lot’ but were collapsed into two groups of ‘Agree’ and ‘Disagree’ to increase cell sizes for this variable.
All variables are summarised in Table 1 and all independent variables are summarised across levels of the homework time and homework frequency variables in Tables 2 and 3.
Data summary.
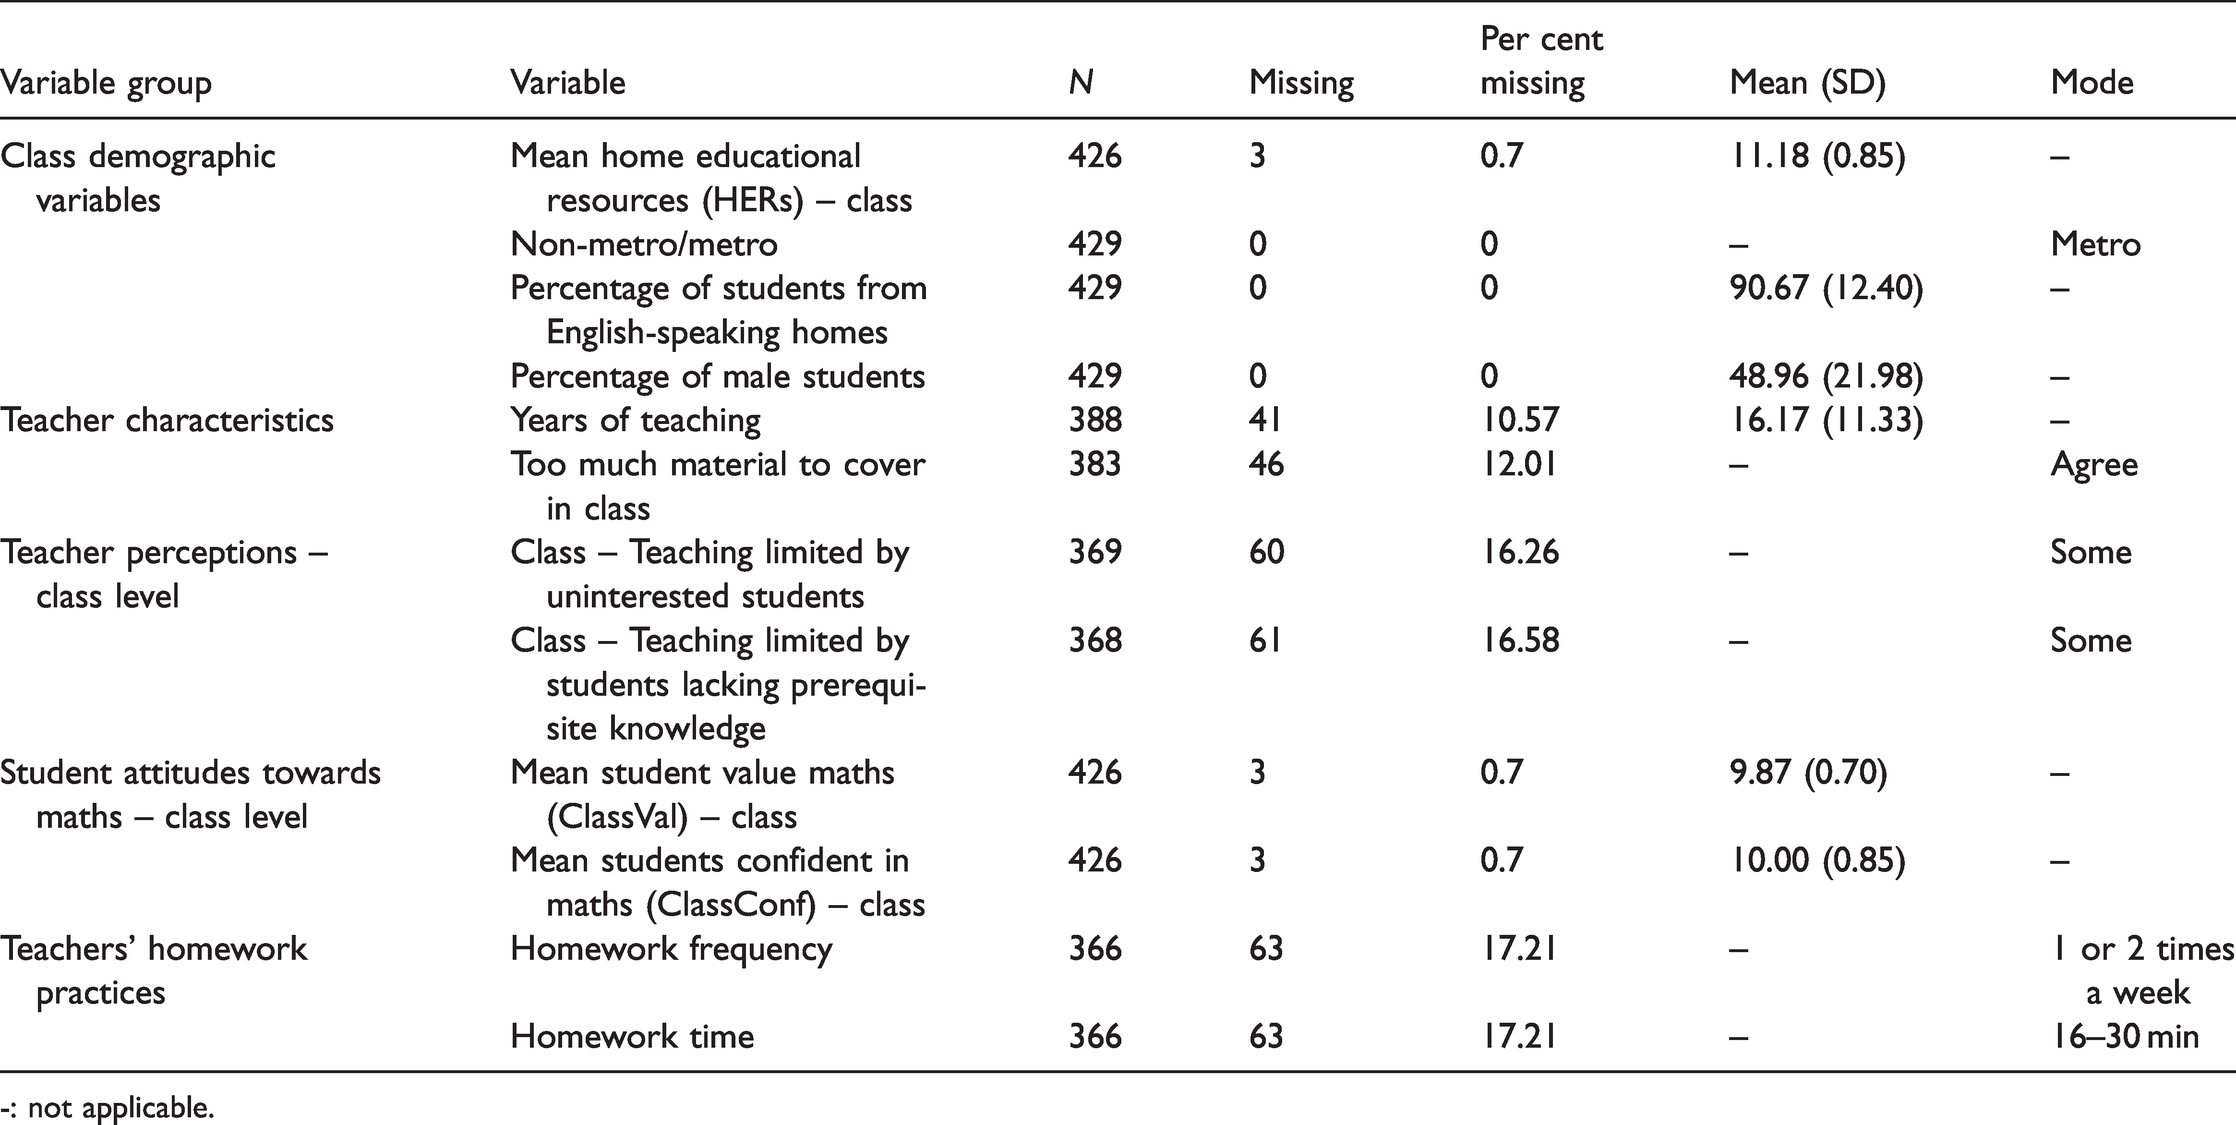
-: not applicable.
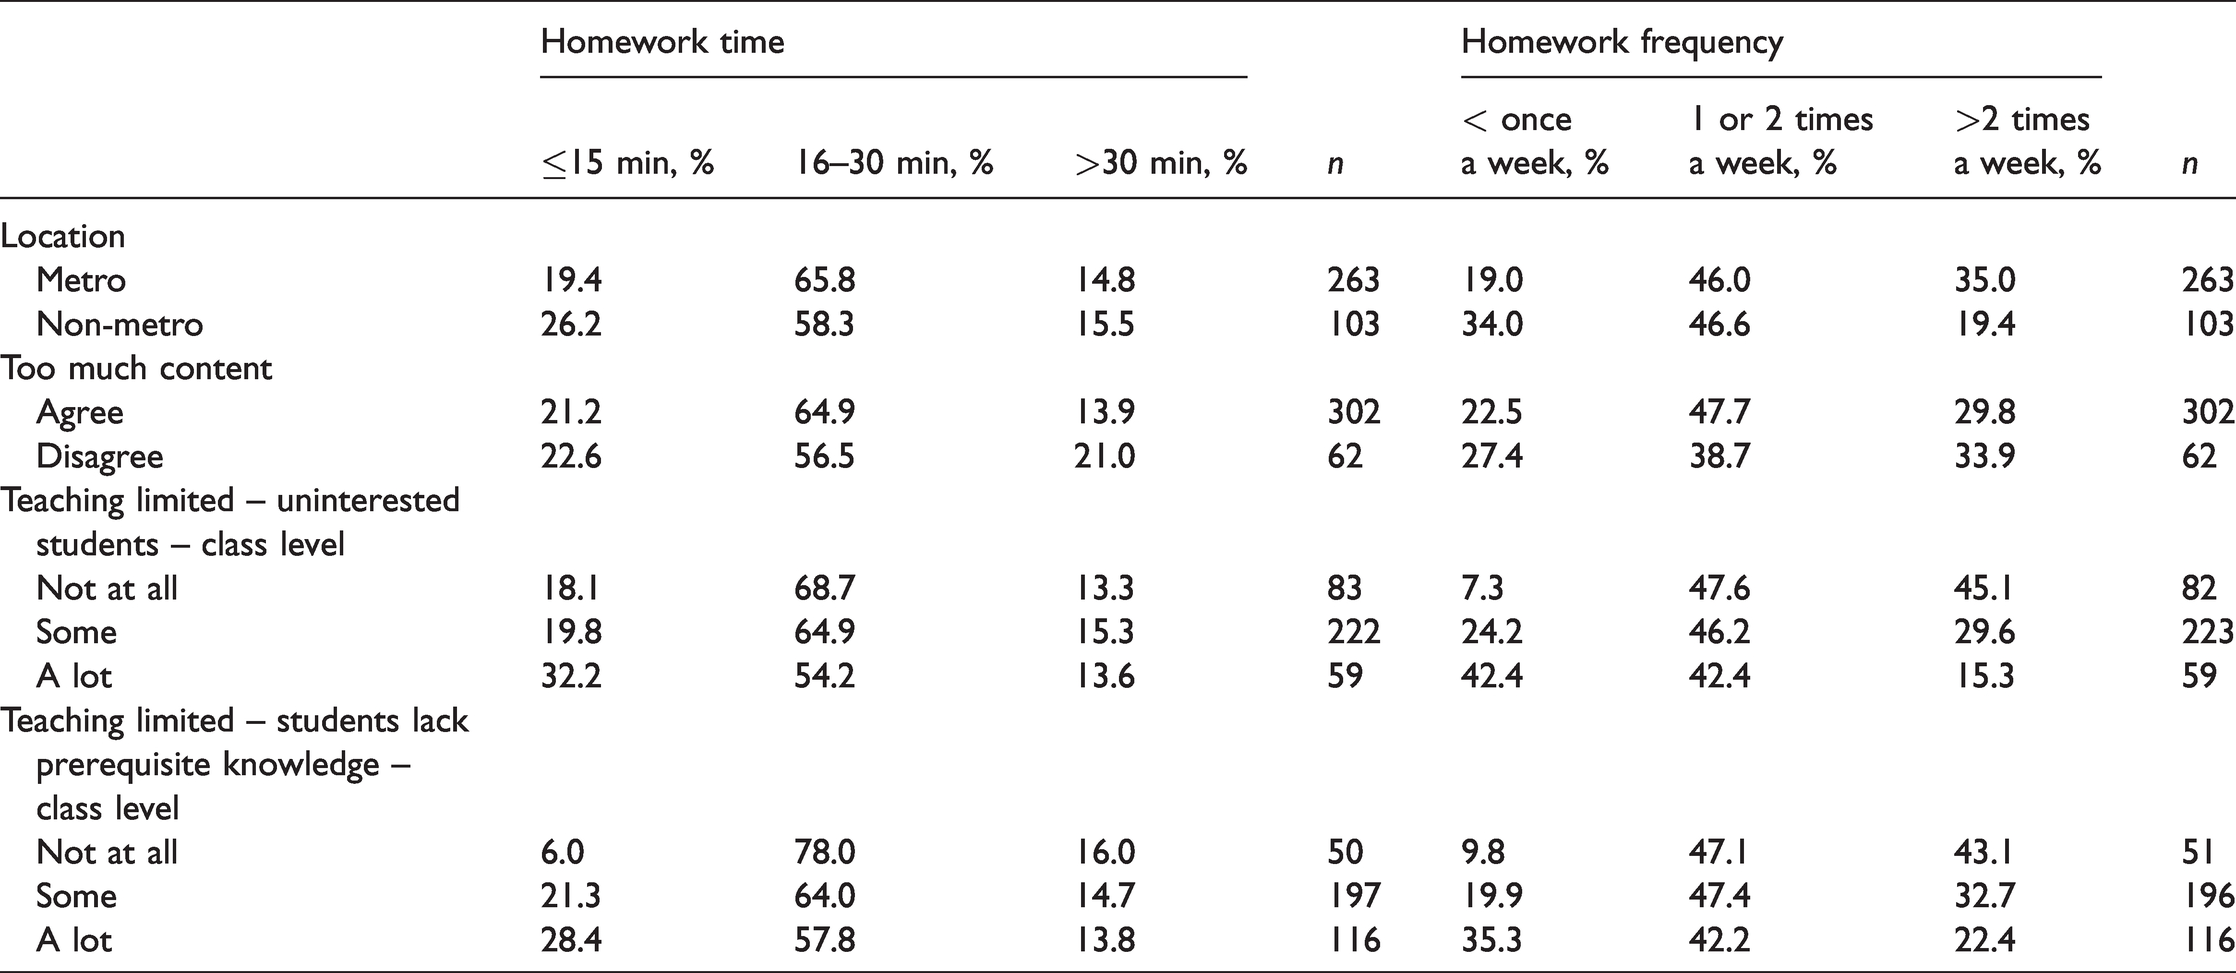
Frequency table for levels of homework allocation variables across levels of ordinal, class-level independent variables (row percentages).
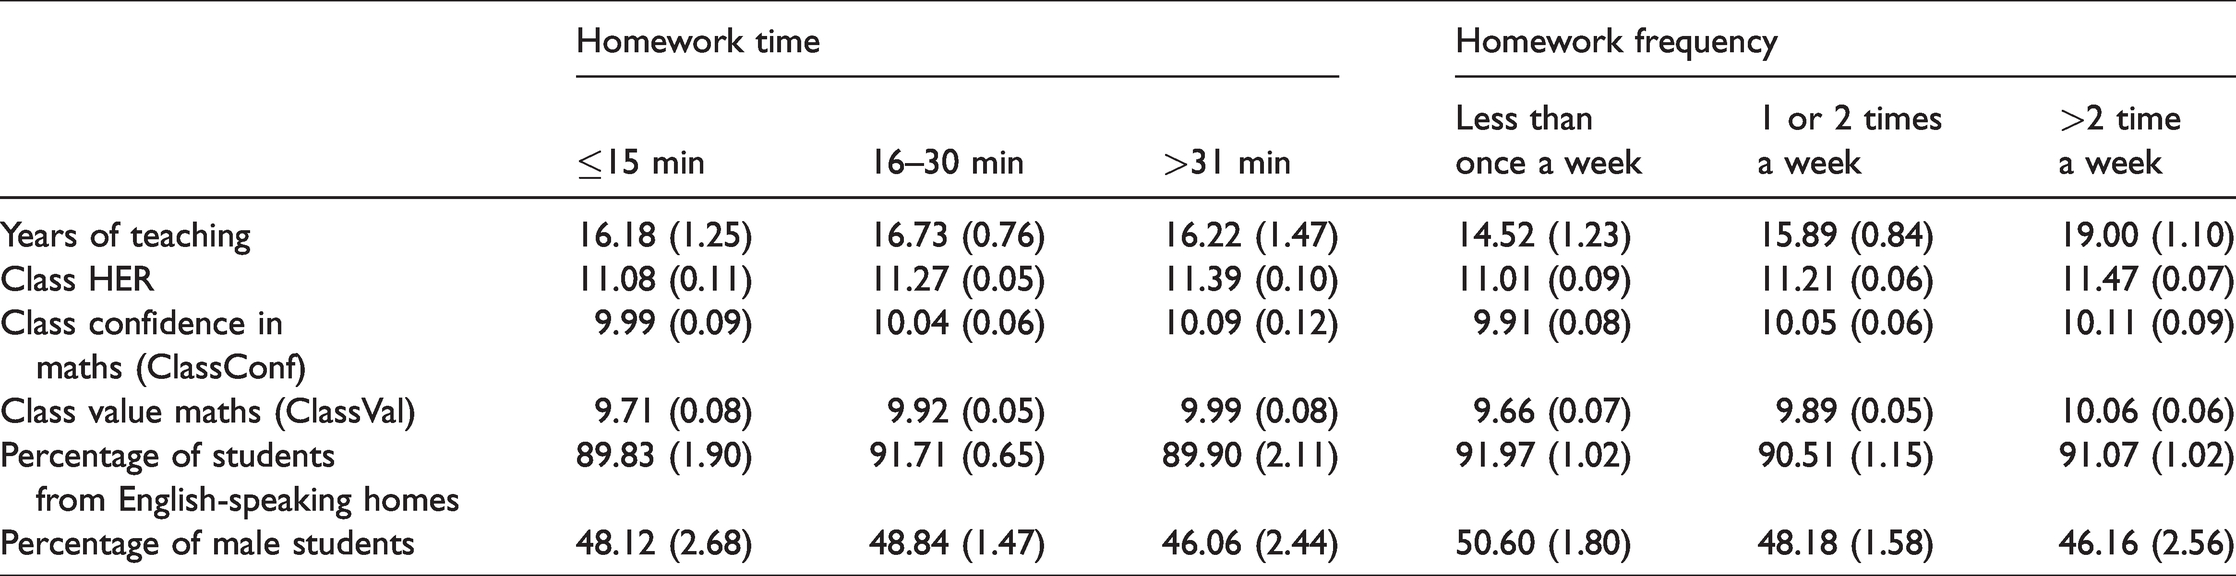
Means and standard errors (in parentheses) for continuous, class-level independent variables across three levels of homework time and homework frequency.
Analytic approach
Ordinal/dichotomous variables
Ordinal/dichotomous variables across levels of the homework time and frequency variables are summarised in Table 2.
Continuous variables
Table 3 shows means and standard errors of the numeric independent variables across levels of the homework time and frequency variables.
Ordinal logistic regression models
Two ordinal logistic regression models were fitted for each of the dependent variables to ascertain the magnitude and direction of the effects of individual independent variables. As shown in Table 1 there was a high number of missing values (around 17%) meaning that a listwise deletion approach to these models would have resulted in substantial information loss and potential for bias. To counter information loss, cumulative link models with logit links were generated with multiple imputation using the mice statistical package in R (Van Buuren & Groothuis-Oudshoorn, 2020) from 30 imputed datasets under the assumption that data was missing at random (MAR). The models are fit to each of the 30 imputed data sets and pooled according to Rubin’s (1987) rules. To support the plausibility of MAR assumptions, auxiliary variables were included in the imputation model, including teachers’ perceptions of students’ ‘desire to do well in school’ and ‘ability to reach goals’ at the school level (Fox & Weisberg, 2018). Numeric variables were standardised before inclusion in the models. Means and distributions of imputed variables were similar to those for observed variables and the final pooled models were similar to those produced from complete records only. Total variance due to missing data (Lambda) statistics and fraction of missing information (FMI) proportions shown in Tables 4 and 5 were acceptable (Van Buuren & Groothuis-Oudshoorn, 2011; White et al., 2011). Imputed values were generated by the default algorithms appropriate for each variable type. The proportional odds assumptions of both models (observed data only) were confirmed by application of the nominal_test function from the Ordinal package (Christensen, 2019).
Ordinal logistic regression results – homework time.
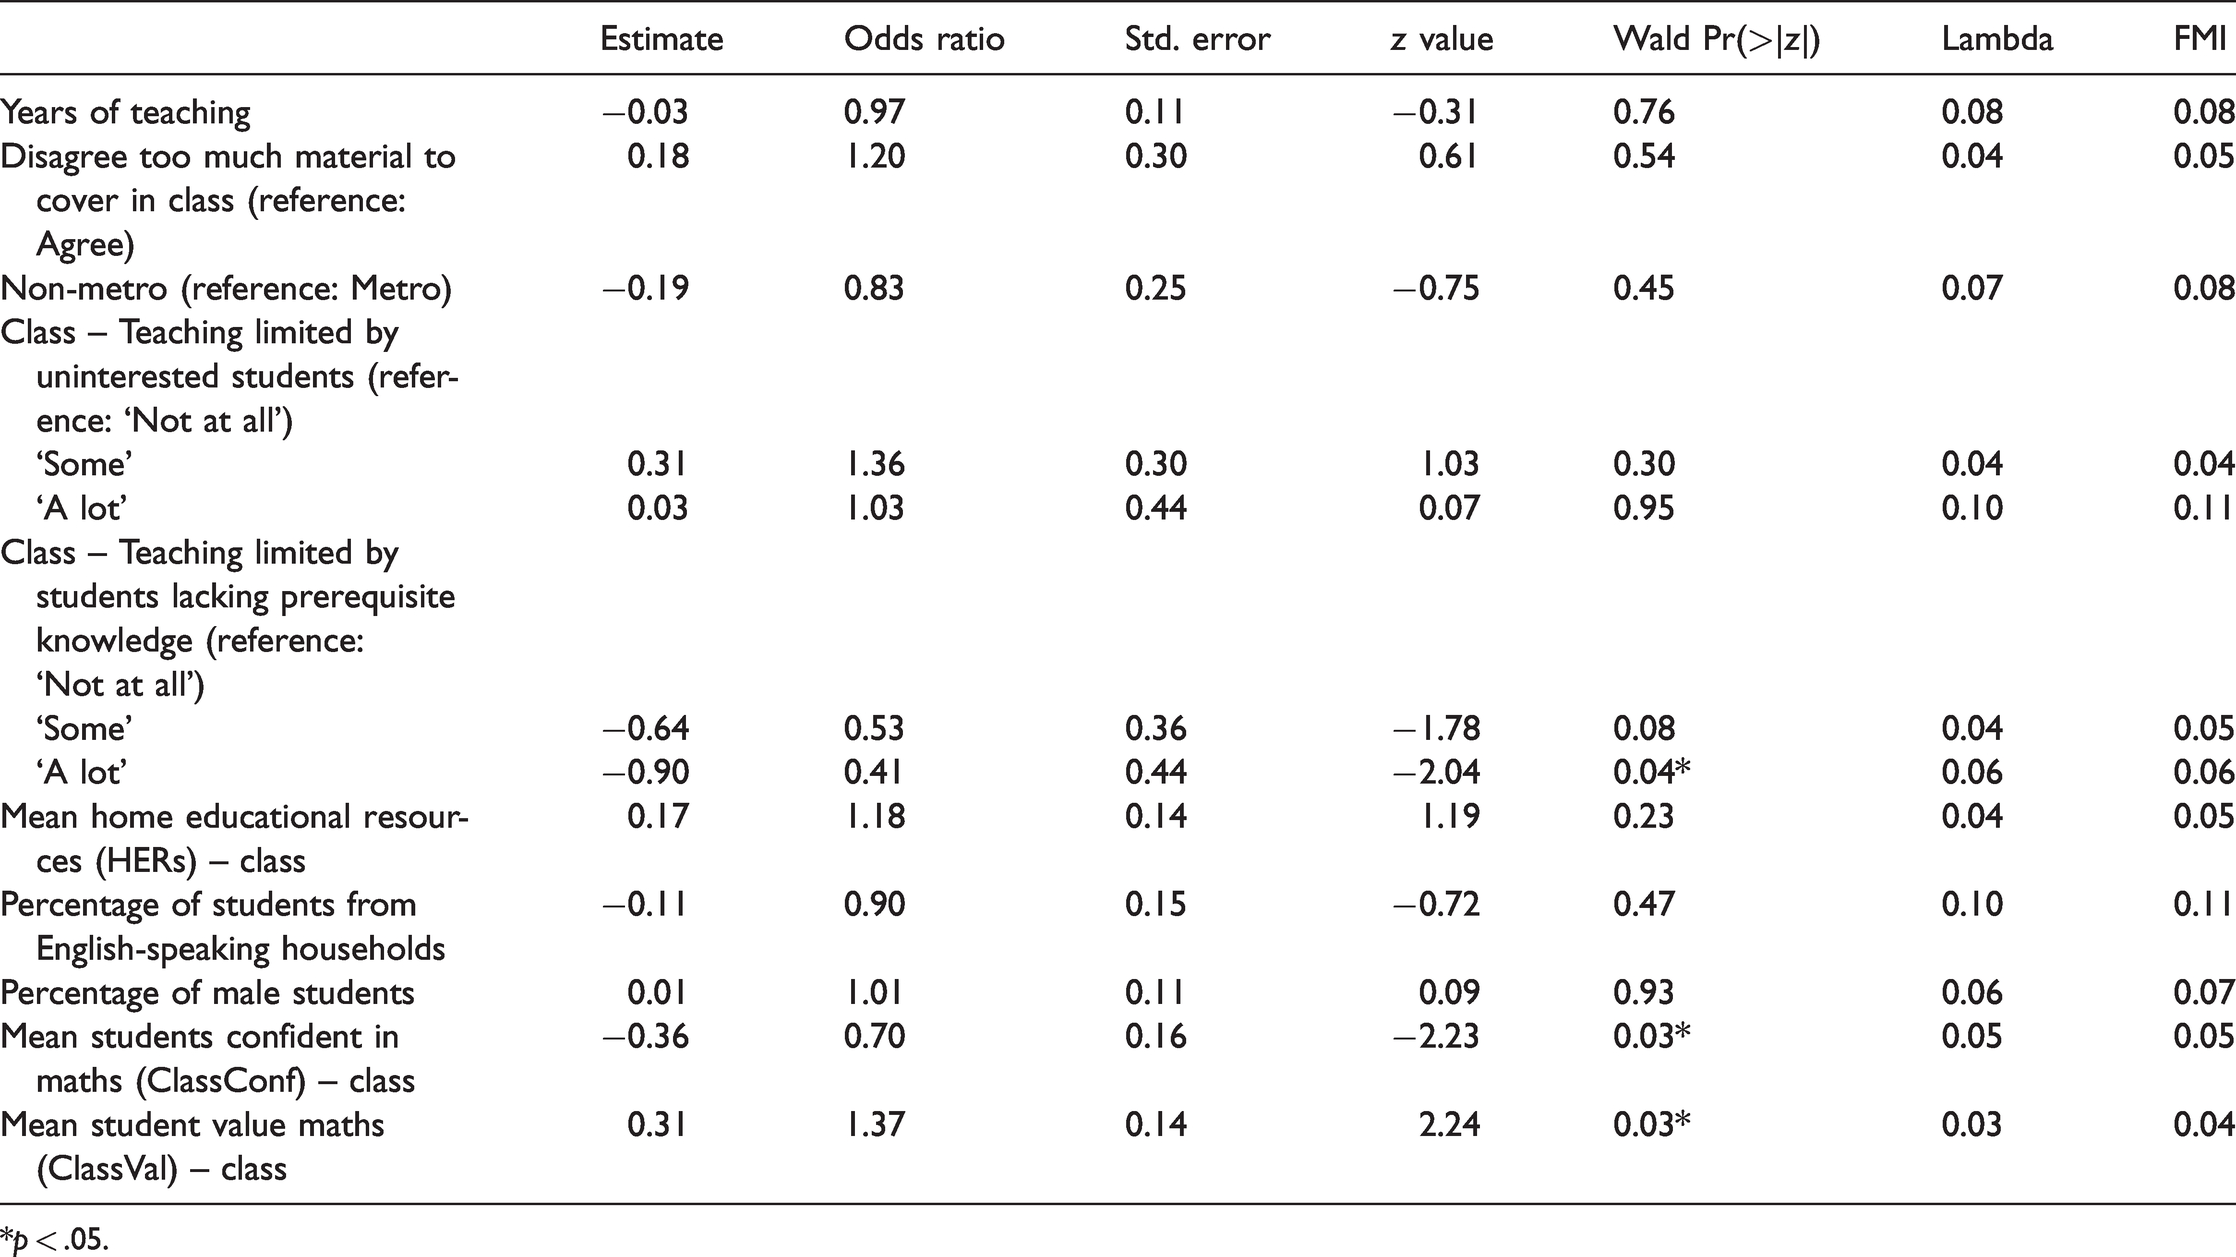
*p < .05.
Ordinal logistic regression results – homework frequency.
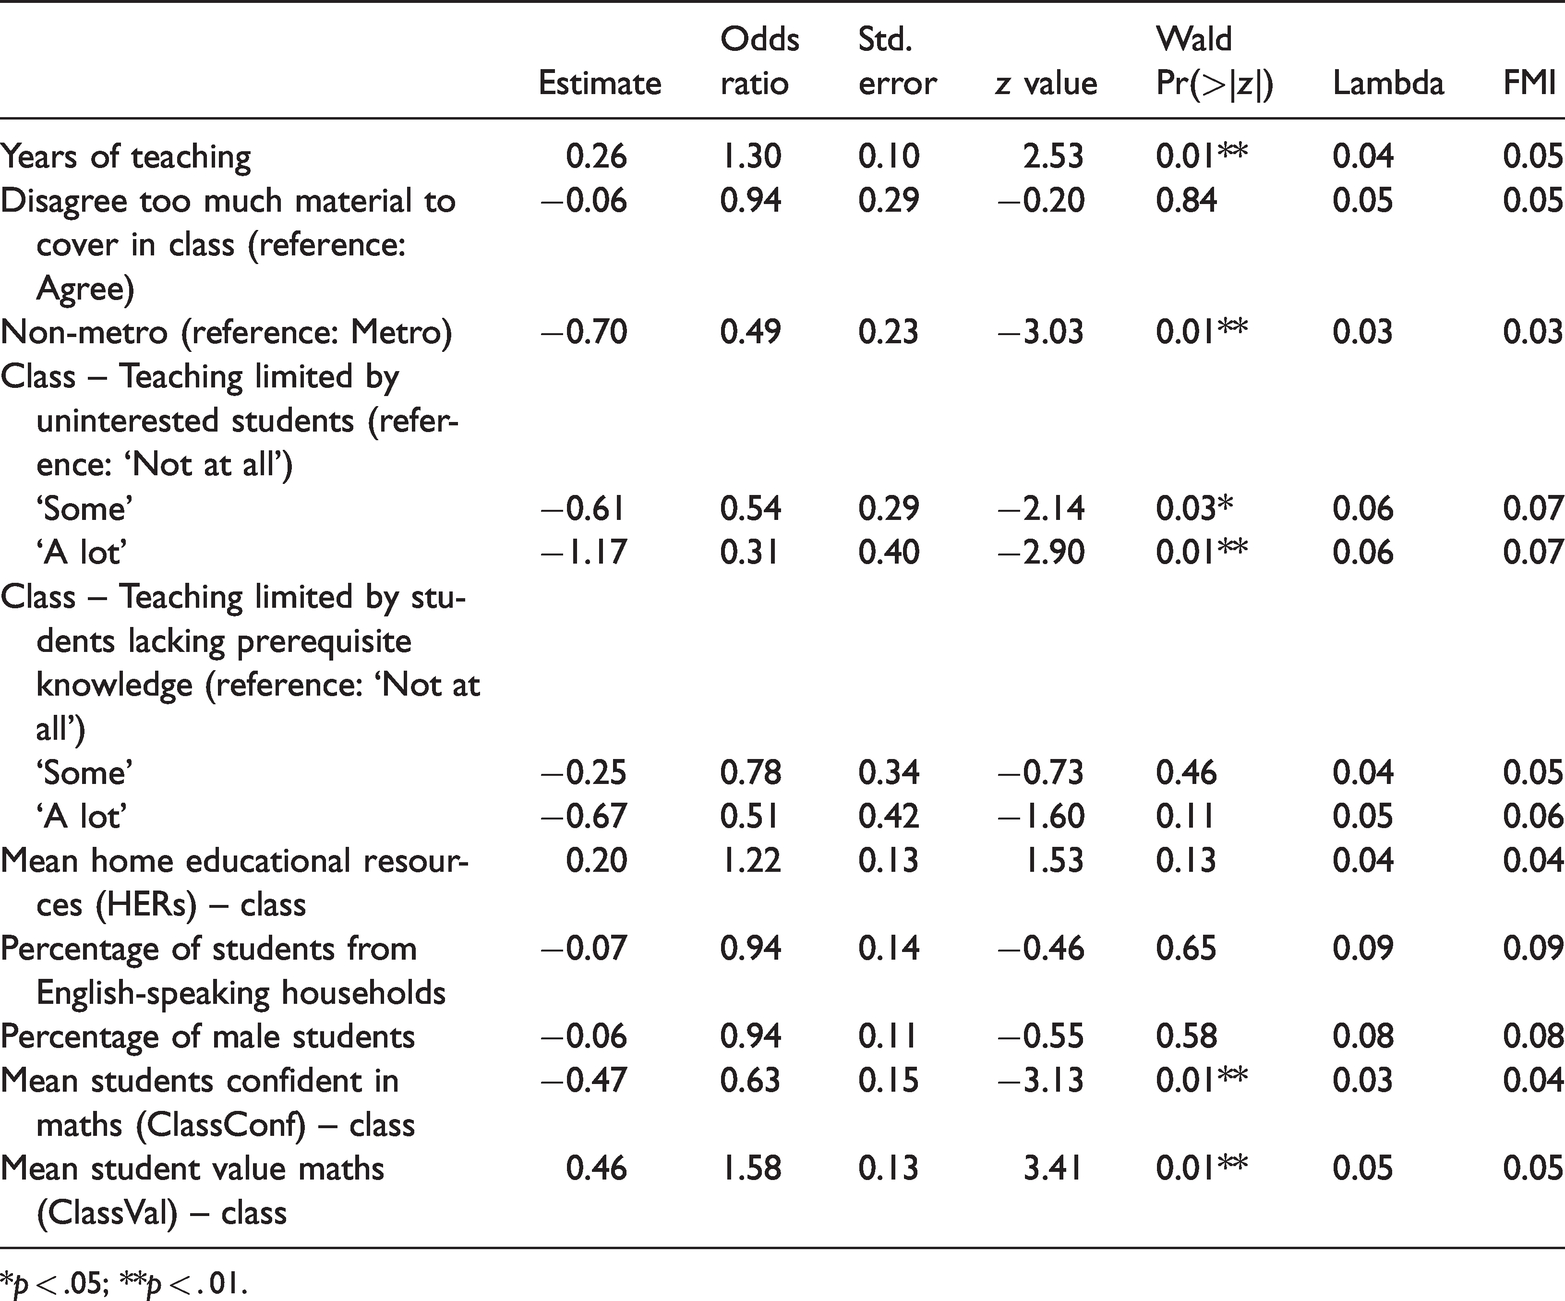
*p < .05; **p < . 01.
Although the teacher/class combinations were clustered within schools, the large proportion of clusters (schools) with single observations (classes) meant that mixed effects’ models were not used. Of the 257 schools with classes reporting homework frequency data, 137 had data for just one class. Adjusted intraclass correlation for an intercept-only mixed model of homework time was 0.27. Of the 258 schools with classes reporting homework time data, 158 had data for just one class. Adjusted intraclass correlation for an intercept-only mixed model of homework frequency was 0.42. Applying the formula from Maas and Hox (2005) produced a design effect for each dependent variable that was smaller than two, justifying the use of single level data analysis.
Results
A correlation matrix was constructed for continuous independent variables which suggested a moderate correlation between class mean HER and ClassConf (r = 0.44). A similar relationship was found between class mean HER and ClassVal (r = 0.35). There was a stronger relationship between ClassConf and ClassVal (r = 0.63) which has been found in previous research on expectancy-value measures of student motivation (Guo et al., 2017; Nagengast et al., 2013). It should be noted, however, that these variables had opposite relationships with homework time and allocation frequency. Despite the risks associated with multicollinearity these three variables have been left in both models and the implications of the interactions between them will be discussed below. To further test for multicollinearity, the vif function from the caret statistical package in R (Khun, 2020) showed that none of the independent variables from either model had a variance inflation factor greater than 2.15 indicating that multicollinearity was not affecting the models.
Mediation analysis
Testing for mediation between the variables of interest here was complicated by the fact that the independent and mediating variables were a mixture of ordinal and continuous measures, whilst the outcome variable was ordinal. As a result we have applied the methods described by Iacobucci (2012) with improvements suggested by Mackinnon and Cox (2012), and implemented by the RMediation package (Tofighi & MacKinnon, 2016). The models below are based on observed values only. Class means of the ClassConf scale did not mediate the relationship between HER and homework time or homework frequency, so these models are not shown.
Homework practice and student demographics
Location
As shown in Table 2, homework frequency was greater in metropolitan classes than non-metropolitan classes although the effect size was small, χ2 (2, N = 366) = 13.01, p < .01, V = .19. This was still the case when other variables were held constant in Table 5 with the odds of metropolitan classes being in higher homework frequency categories nearly twice that of non-metropolitan classes (b = −0.70, SE = 0.23, OR = 0.49, p < .01). Teachers’ estimates of allocated homework time did not differ significantly between metropolitan and non-metropolitan classes.
Home educational resources
As shown in Table 3, teachers allocated homework more frequently to classes with higher aggregated HER scores, F(2,360) = 7.92, p < .001, η2 = .04. The effect size for the difference between HER means in the top and bottom homework frequency categories was medium (ds = 0.56) using Cohen’s formula and interpretations from Lakens (2013). HER scores were higher in the top homework time category although a comparison of top and bottom time ranges found only a low difference between HER scores (ds = 0.34). HER did not predict homework frequency or time when other variables were held constant in Tables 4 and 5.
Percentage of students from English-speaking households and percentage of male students
The proportion of students from English speaking household and the proportion of male students in classes had no effects on either measure of teachers’ homework practices.
Homework practice and teacher expectations
Teaching limited by students lacking prerequisite knowledge
It can be seen in Table 2 that homework time varied by the degree teachers felt their teaching was limited by a lack of students’ prerequisite knowledge in their classes, χ2 (4, N = 363) = 10.56, p < .05, V = .12. The situation was similar for homework frequency, χ2 (4, N = 363) = 17.95, p <. 01, V = .16. Teachers who felt how they taught was affected ‘a lot’ by this variable were more likely to be in the lowest homework time and frequency categories than the highest. The effect on homework frequency disappeared when other variables, including HER and student-level motivation measures were controlled for (Table 5). As can be seen in Table 4, teachers who thought their teaching strategies were limited ‘a lot’ by their class’ lack of prerequisite knowledge had lower homework time estimates than those whose teaching was not limited (b = −0.90, SE = 0.44, OR = 0.41, p < .05) when other predictor variables were controlled for.
Teaching limited by uninterested students
Table 2 shows that the degree to which teachers felt that their teaching was limited by uninterested students was not associated with any statistically significant variation in homework time estimates although this was not the case with homework frequency, χ2 (4, N = 364) = 28.66, p < .001, V = .20. Teachers who felt that they were limited ‘not at all’ were most likely to allocate homework more than twice a week. Table 5 shows that when other variables were held constant, these teachers were more than three times more likely to be in a higher homework frequency category than those whose teaching was affected ‘A lot’ (b = −1.17, SE = 0.40, OR = 0.31, p < .01).
Homework practice and students’ self-reported attitudes towards mathematics
Students’ confidence in mathematics (ClassConf)
Although classrooms with more frequent homework assignments and greater homework time also had higher ClassConf scores, the difference was not statistically significant (Table 3). However, in the regression models, the relationship turned negative and was statistically significant indicating that the effect may have been moderated by other variables. Table 4 shows an increase of one standard deviation on the ClassConf scale is associated with an increase in the odds of being in a lower homework time category (b = −0.36, SE = 0.16, OR = 0.70, p < .05). Table 5 shows an increase in the ClassConf scale is associated with an increase in the odds of being in a lower homework time category (b = −0.47, SE = 0.15, OR = 0.63, p < .01).
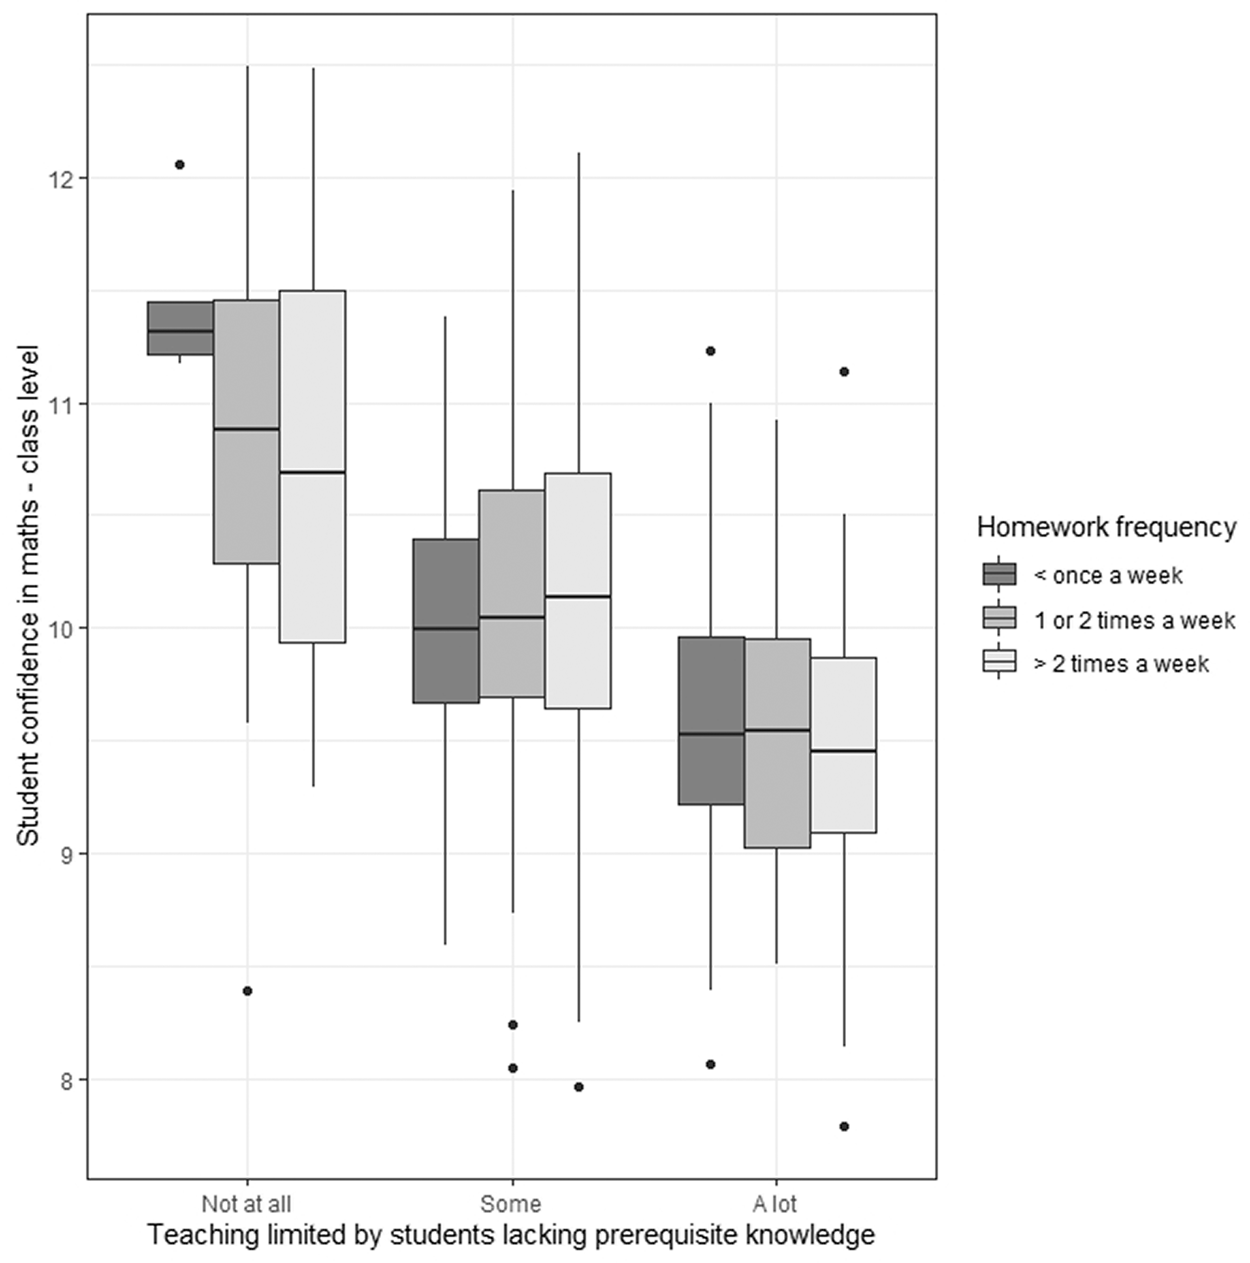
Post hoc analysis in the box plot displayed in Figure 1 suggests that the degree to which teachers felt that teaching was limited by students lacking prerequisite knowledge in their classrooms may have had a moderating effect on the relationship between the ClassConf scale and homework frequency estimates in the regression model as the relationship between homework frequency and ClassConf is notably different in the reference level of knowledge variable. It is also possible that other variables had a moderating effect on the relationship between ClassConf and teachers’ homework practices.
Distributions of classroom maths confidence by homework frequency across levels of teaching limited by students lacking prerequisite knowledge.
Students’ valuing of mathematics (ClassVal)
ClassVal differed significantly across levels of the homework time variable, F(2,360) = 3.12, p < .05, η2 = .02, and levels of the homework frequency variable, F(2,360) = 8.17, p < .001, η2 = .04. Although eta squared indicated only a small amount of explained variance, an examination of the standardised mean difference between the ClassVal means of the top and bottom levels of the homework time variable revealed a small effect (ds = 0.39). Using the same approach for ClassVal means in the highest and lowest homework frequency levels produced a medium effect (ds = 0.59).
Tables 4 and 5 show that the ClassVal scale was positively related to both homework time and homework frequency when other predictor variables were held constant. An increase of one standard deviation on the ClassVal scale was associated with greater odds of being in a higher homework time category (b = 0.31, SE = 0.14, OR = 1.37, p < .05) and odds 1.58 higher of being in a higher homework frequency category (b = 0.46, SE = 0.13, OR = 1.58, p < .01).
Students’ attitudes mediate the relationship between HER and homework practices
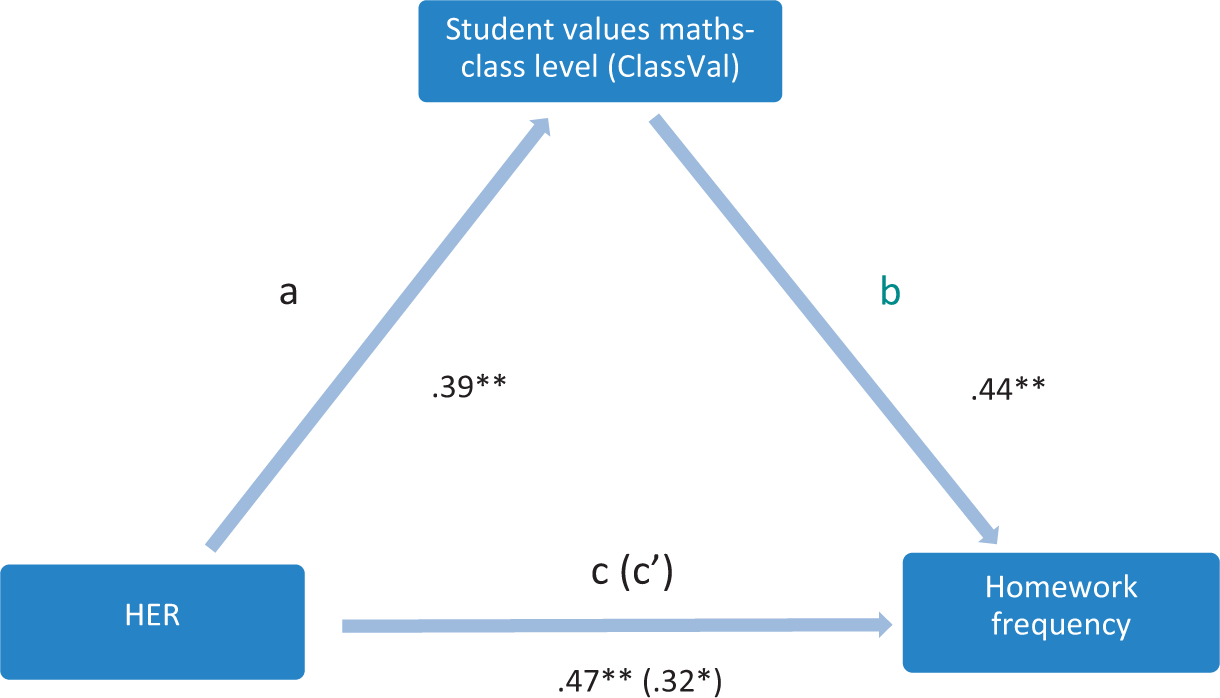
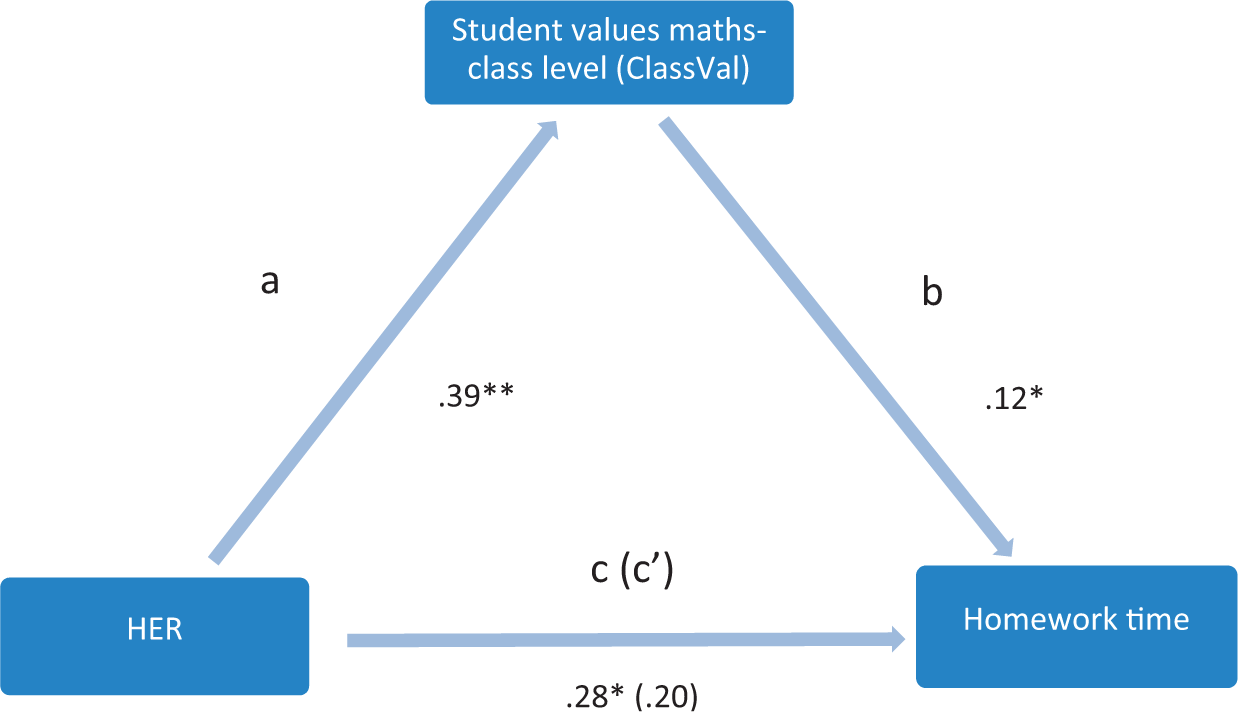
Figures 2 and 3 showed the relationships between class average HER scores and teachers’ homework practices (frequency and time) were mediated by scores on the ClassVal scale although not by scores on the ClassConf scale. Results showed that scores on the scale measuring the degree to which students valued maths, averaged at the class level, partially mediated the relationship between HER and homework frequency as the standardised product of the indirect path coefficients was significant (B = .147, SE = .062, 95% CI = .048, .147; Figure 2). Figure 3 shows that ClassVal also mediated the relationship between HER and homework time but only when a larger alpha was applied (B = .1, SE = .065, 90% CI = .019, .184).
Standardised regression coefficients for the relationship between HER and homework frequency as mediated by the class level student values maths scale. The standardised regression coefficient between HER and homework frequency, controlling for the ClassVal scale, is in parentheses. *p < . 05, **p < . 01.
Standardised regression coefficients for the relationship between HER and homework time as mediated by the class level student values maths scale. The standardised regression coefficient between HER and homework time, controlling for the student values maths scale, is in parentheses. *p < .05, **p < .01.
Homework practice and teacher traits
Teacher experience
Whilst years of teaching had no effect on homework time, teachers allocating homework most frequently were, on average, four and a half years more experienced than teachers who were in the lowest homework frequency category, F(2,362) = 4.31, p < .05, η2 = .02 (Table 3). An examination of the standardised mean difference between the years of teaching of the top and bottom levels of the homework frequency variable revealed a small effect size (ds = 0.39). The positive association between teaching experience and homework frequency remained when other variables were controlled for in Table 5 with an increase of one standard deviation in teaching years associated with a 1.30 increase in the odds of being in a higher homework frequency category (b = 0.26, SE = 0.10, OR = 1.30, p < .01).
Too much material to cover in class
There was no difference between the homework practices of teachers who felt that they had too much material to cover in class and those who did not.
Discussion
An issue that complicates the analysis of estimates of allocated homework time is the degree to which this variable is solely determined by teachers’ choice (Fernández-Alonso et al., 2015). In a situation where a certain amount of the curriculum is to be ‘covered’ in a limited amount of time, teachers may be constrained to allocate a specific quantity of material regardless of their students’ aggregated capacities. In this scenario, the estimation of homework time becomes, to a greater or lesser degree, a reflection of student capacities within a constrained environment, rather than teacher preferences. There is still possibly differential treatment, but the degree to which teachers’ practices here reflect their expectations rather than environmental conditions beyond their control is unclear. Rosário, Cunha, Nunes, Moreira, et al. (2019) found that similar constraints affected teachers’ ability to follow up on homework. Having said that the degree to which teachers agreed that there was too much material in class did not affect the estimated time or frequency of allocated homework. In comparison to teachers’ estimates of homework time, the frequency of homework allocation is more purely the result of the actions of teachers and schools.
Demography
The results described above show homework practices varied with demographic variables although the effects for estimates of homework time and homework frequency differed, with Location and HER being stronger predictors of homework frequency than homework time. Classrooms in non-metropolitan areas were more likely to be in higher homework frequency categories than those in large cities (Table 4) although location had no effect on estimates of homework time. Unlike HER, geographic differences in homework frequency were statistically significant in Table 4 even when other student attitude and teacher expectation variables were included. This finding will be of interest to researchers and policy makers addressing persistent achievement gaps between metropolitan and non-metropolitan students (e.g. see Cuervo, 2016; Halsey, 2018). Gender and language background aggregated at the classroom level did not affect teacher’s homework practices suggesting that differences in homework practices found in previous studies (Bowd et al., 2016; Kitsantas et al., 2011) may be due to differences at the student level.
Teacher expectations
One of the challenges for quantitative research examining the effects of teacher expectations is the operationalisation of the expectation construct, particularly when the goal is to measure the effects of those expectations on teachers’ behaviours rather than student outcomes. Research in the latter case often involves a two-stage process where teacher expectations are manipulated (e.g. Rosenthal & Jacobson, 1968) or measured (e.g. Friedrich et al., 2015) at one point, and the effects of those interventions/observations on achievement are measured at a later point in time. Here, measures of teachers’ expectations and teachers’ homework practices were collected at the same point of time, towards the end of the school year. Those measures – teachers’ perceptions about the degree to which their class’ lack of prerequisite knowledge and motivation levels affected how they taught – were broadly similar to those used by Brault et al. (2014) but applied to the class rather than school level, and related specifically to teaching strategies.
Teachers who felt that their teaching was limited by uninterested students ‘a lot’ were also more likely to be in the lowest homework frequency category (Table 2) and this effect remained once other variables were controlled for (Table 5). Homework time estimates also tended to be lower for teachers who answered ‘a lot’ for this category although the differences across categories were not statistically significant. Teachers who felt their teaching was limited by their students’ lack of prerequisite knowledge and skills were in lower homework time and frequency categories (Table 2) although when other variables were controlled for, this relationship was only significant for homework time (Table 4).
Together these finding suggest, perhaps unsurprisingly, that teachers varied their homework practices in accordance with their expectations as outlined by Brophy and Good (1970) and described above, although it is important to remember that these indicators of teacher expectations relate specifically to teaching practices at the classroom level rather than teachers’ aggregated assessments of student capabilities as in Friedrich et al. (2015).
Students’ attitudes
Classrooms with students who valued maths more highly received greater volumes of homework and more frequent homework allocations. The class-level measure of students’ maths confidence was associated with less homework time and less frequent allocation but only when the other variables in the models from Tables 4 and 5 were held constant. It was suggested above that the teacher expectation variables moderated the relationship between the class confidence variable and homework practices. From a teacher’s perspective, it could be argued that it is appropriate to allocate less homework to classrooms with students who are already confident in maths and more for students who value maths more highly when the level of confidence is controlled. Similarly, it may seem appropriate to allocate less homework in classes of students lacking prerequisite knowledge if those students require more immediate feedback from a teacher to learn the maths concepts they have not yet mastered, especially where those students also experience lower levels of motivation (Kitsantas et al., 2011).
That student disposition indicators reflected students’ own assessments of these traits suggests that homework was allocated in line with actual student characteristics and not merely teachers’ perceptions, offering circumstantial support for the findings of some researchers suggesting that teachers’ expectations do not entirely lead to self-fulfilling prophecies (Brault et al., 2014; Jussim, 1989; Jussim & Eccles, 1992). The analysis presented here, however, does not guarantee that the direction of causality between students’ motivational indicators and teachers’ homework practices is only one way; it is also possible that teachers’ homework practices influence indicators of student motivation.
Mediation analysis found the relationships between mean class HER and teachers’ homework time and frequency estimates were mediated by the ClassVal scores. This and the fact that that class-level student disposition measures were associated with teachers’ homework practices even when other demographic and other teacher expectation variables were held constant suggests that teachers’ self-reported homework practices are responsive to their students’ traits averaged at the classroom level. The degree to which these practices are generating these traits (if at all) is difficult to assess in cross-sectional, quantitative analysis (Gustafsson, 2013).
Study limitations and suggestions for further study
As is often the case with non-experimental quantitative analysis, although relationships between variables can be identified, it is difficult to definitively identify causation, either because of unobserved variables or model endogeneity (Gustafsson, 2013). Qualitative studies have the potential to reveal the processes involved in generating the relationships observed in the present study, particularly the degree to which teachers’ choices around their homework practices are constrained by their contexts. Such studies could also determine whether differences in homework frequency estimates are related to different timetable structures in schools which might raise a range of other issues around demographically structured timetabling patterns. The present study did not examine how homework practices vary within classrooms as they were treated as primary units of analysis. Qualitative homework studies may also illuminate the diversity of homework practices, in terms of structure and content, within classrooms and schools, and across and within different subject areas. The TIMSS data include some questions on mathematics homework content and functions that could complement such research.
Conclusion
The present study showed that teachers’ homework practices systematically varied in response to actual and perceived differences in student characteristics aggregated at the classroom level and varied with teachers’ level of experience. The results also showed that the effects of HER were mediated by students’ self-reported dispositions in terms of students valuing mathematics. This finding proffers some circumstantial support for the view that teachers’ practices reflect actual student characteristics rather than merely stereotypes. Whether variations in teaching practices generated, reflected, or ameliorated the relationship between students’ dispositions and students’ backgrounds is one of the central questions addressed by research on teacher expectations. This is a question that education policy makers and practitioners need to consider.
Education systems have a role in ensuring that differences in homework practices are not due to compromises forced by a lack of resources in schools. Increasing ‘homework support to assist students with homework and assignment completion’ within schools may be an effective way to improve access to the benefits of homework (Horsley & Walker, 2013, p. 203). Increasing the number of free periods in junior secondary school may facilitate this but there would be a trade-off with instruction time.
Whilst we examined class-level determinants of variations in homework practice, there is some evidence that practices targeted at individual students or groups within classes may be of benefit for students (Azzam & Pink, 2014; Hong et al., 2004; Minotti, 2005). Further, qualitative research might assess the degree to which teachers are able to differentiate their homework practices within classes. Some of the barriers to differentiated teaching practices identified by Prain et al. (2013), and quoted above, may be just a question of adequate resources, particularly resources related to time for lesson planning and class sizes. A one-size-fits-all approach to homework provision within classes may satisfy some conceptions of educational fairness but may not maximise educational outcomes for all students. Despite this, blanket homework policies are sometimes applied across schools or even systems (Horsley & Walker, 2013).
As Horsley and Walker note, ‘The responsibility for promoting equity and reducing disadvantage in relation to homework practices ultimately rests with schools and teachers, and how they structure, manage and organise homework and associated homework practices’ (2013, p. 196). They also note the importance of including the whole school community in formulating school homework policies.
Homework research, including research on how homework practices and functions vary for different students, teachers, schools and families has the potential to ensure that homework policies and practices are formed in response to a wider range of evidence informed by and informing actual practices and teachers’ rationales for pursuing those practices.
Footnotes
Declaration of Conflicting Interests
The author(s) declared the following potential conflicts of interest with respect to the research, authorship, and/or publication of this article: Main author is an employee of the Australian Education Union (Vic) who have had commercial relationships with ACER on occasion.
Funding
The author(s) received no financial support for the research, authorship, and/or publication of this article.