
Abstract
Declines in the scores of Australian 15-year-old students from the Programme for International Student Assessment are a matter of policy interest. Some of the declines may have resulted from shifts in the age-grade distributions of students in the Programme for International Student Assessment samples. We use multiple regression methods to model the student-level effects of grade for each Programme for International Student Assessment cycle allowing for the effects of student characteristics (e.g. socioeconomic background and gender) and jurisdiction. We estimate an average net effect of grade over the Programme for International Student Assessment cycles since 2006 as 42 scale points with no difference between reading and mathematics. We explore the extent to which differences between grades in achievement and changes in the grade distributions of students contributed to changes in average Programme for International Student Assessment achievement scores. We conclude that the relatively greater decline in Grade 11, compared to Grade 10 achievement, contributed to the overall decline and that shifts in distributions may have also contributed a little to those declines.
Keywords
Introduction
Every three years, a sample of Australian students are chosen to participate in the Programme for International Student Assessment (PISA), a large-scale assessment (LSA) conducted by the Organisation for Economic Co-operation and Development (OECD). A key feature of the study design is that scores are equated over time so that scores in any given cycle are represented on the original scale. For PISA this is achieved through common-item equating in which a number of items in any cycle are not released publicly and included in the next cycle. The common items that behave in a consistent manner in both cycles are then used as link items to equate scores to the original scale (OECD, 2014, pp. 143–164). Following the publication of the Australian results from the PISA cycle in 2015 (Thomson et al., 2017) and 2018 (Thomson et al., 2019) there has been a great deal of discussion about possible causes of the apparent decline in the achievement of 15-year-old students in Australia. One investigation of the declines in PISA mathematics scores in Australia through to 2015 concluded that the declines could not be attributed to changes in student characteristics, changes in the time allocated to teaching mathematics or changes in the characteristics of mathematics teachers (Morsy et al., 2018). The study did not include student grade in its investigation.
We noticed that over the same period that achievement scores declined there had been a shift in the distribution of 15-year-old students across grades (we have used the term grade rather than year level throughout this paper because of the varied use of the term ‘year’ in a paper based on time series analyses) with fewer of these students being in Grade 11 and more being in Grade 9. In addition, we noticed that this shift was greater in some jurisdictions than others. That prompted us to investigate whether the grade in which a student was enrolled was associated with their achievement on PISA reading and mathematics assessments and whether shifts in the age-grade distribution of students might have been associated with declines in average PISA reading and mathematics achievement.
Background
The core of the PISA assessments concerns reading, mathematics and science but some cycles of PISA have assessed domains such as financial literacy and collaborative problem solving. The first cycle of PISA was conducted in 2000 and it has been conducted every three years since then. PISA assesses whether students can apply what they have learned to solve ‘real world’ problems. In its first international report on PISA, the OECD (2001) articulated that PISA was concerned with the ‘ability to use (their) knowledge and skills to meet real-life challenges, rather than on the extent to which they have mastered a specific school curriculum’ (p. 14). It used the term literacy to encapsulate this broad conception of knowledge and skills. To achieve this, PISA utilises an age-based sample of 15-year-old students, an age-group who are nearing the end of compulsory schooling in most participating countries (OECD, 2001; Thomson et al., 2017). It argued that an age-based sample provides ‘a fair comparison’ that is not biased by differences in the structure of school systems, the meaning of grades and grade retention policies (OECD, 2019a, p. 48). PISA is not only concerned with student achievement but also gathers data about student background, attitudes, learning contexts and other non-cognitive aspects of learning through a student questionnaire and about learning contexts through a school questionnaire completed by principals.
In addition to reports about student achievement in PISA in each cycle and over time (e.g. OECD, 2019a), the OECD publishes reports concerned with relationships of achievement with student characteristics such as gender, socioeconomic and immigrant background (e.g. OECD, 2019b) and student attitudes or dispositions and perceptions of school climate (e.g. OECD, 2019c) as well as thematic reports on issues of policy interest.
PISA data are publicly available and a considerable body of research has been published from analyses of those data (Hopfenbeck et al., 2018). Many of these analyses have focused on the relationship of achievement with student background characteristics such as socioeconomic background (Davoli & Entorf, 2018), gender (Baye & Monseur, 2016; Lietz, 2006), immigrant and language background (Arikan et al., 2017) and geographic location (Sullivan et al., 2013) as well as Indigenous status in some countries (De Bortoli & Thomson, 2010; Song et al., 2014). Other analyses have investigated associations of PISA achievement with student attitudes or dispositions and with measures of school climate (Pitsia et al., 2017). Several studies have investigated the relationship between inquiry-based teaching and student achievement (Jerrim et al., 2020).
Despite the abundance of research publications based on PISA, there appear to be relatively few investigations of associations of PISA achievement with grade. This is surprising because in many countries the PISA samples of 15-year-old students are spread across several grades (OECD, 2019a) and higher achievement appears to be associated with higher grades (OECD, 2013). A multilevel regression estimation of grade effects in mathematics in PISA 2012 estimated an OECD average grade coefficient of 41 scale points (equivalent to approximately two-fifths of an international student standard deviation) after allowing for the effects of the socioeconomic (educational social and cultural status (ESCS)) and immigrant backgrounds and gender of students and the average socioeconomic background and immigrant backgrounds of their schools (OECD, 2013). The effect of grade appeared to be quite consistent across the OECD countries: 20 of the 32 countries in the analysis had a grade coefficient between 30 and 50. The grade coefficient for Australia was 35. One study suggested that reading achievement in PISA does not appear to be associated with school entry age (Suggate, 2009). It is possible that these effects of grade might arise from differences in characteristics other than the socioeconomic and immigrant background of the students and their schools in higher compared to lower grades or from the student experience of enriched learning environments and more advanced curricula in higher grades.
In terms of the focus of this paper, it seems possible that differences between education systems in the distributions of 15-year-olds across grades might contribute to differences in average achievement and shifts in those distributions over time might contribute to overall trends in PISA scores.
Context
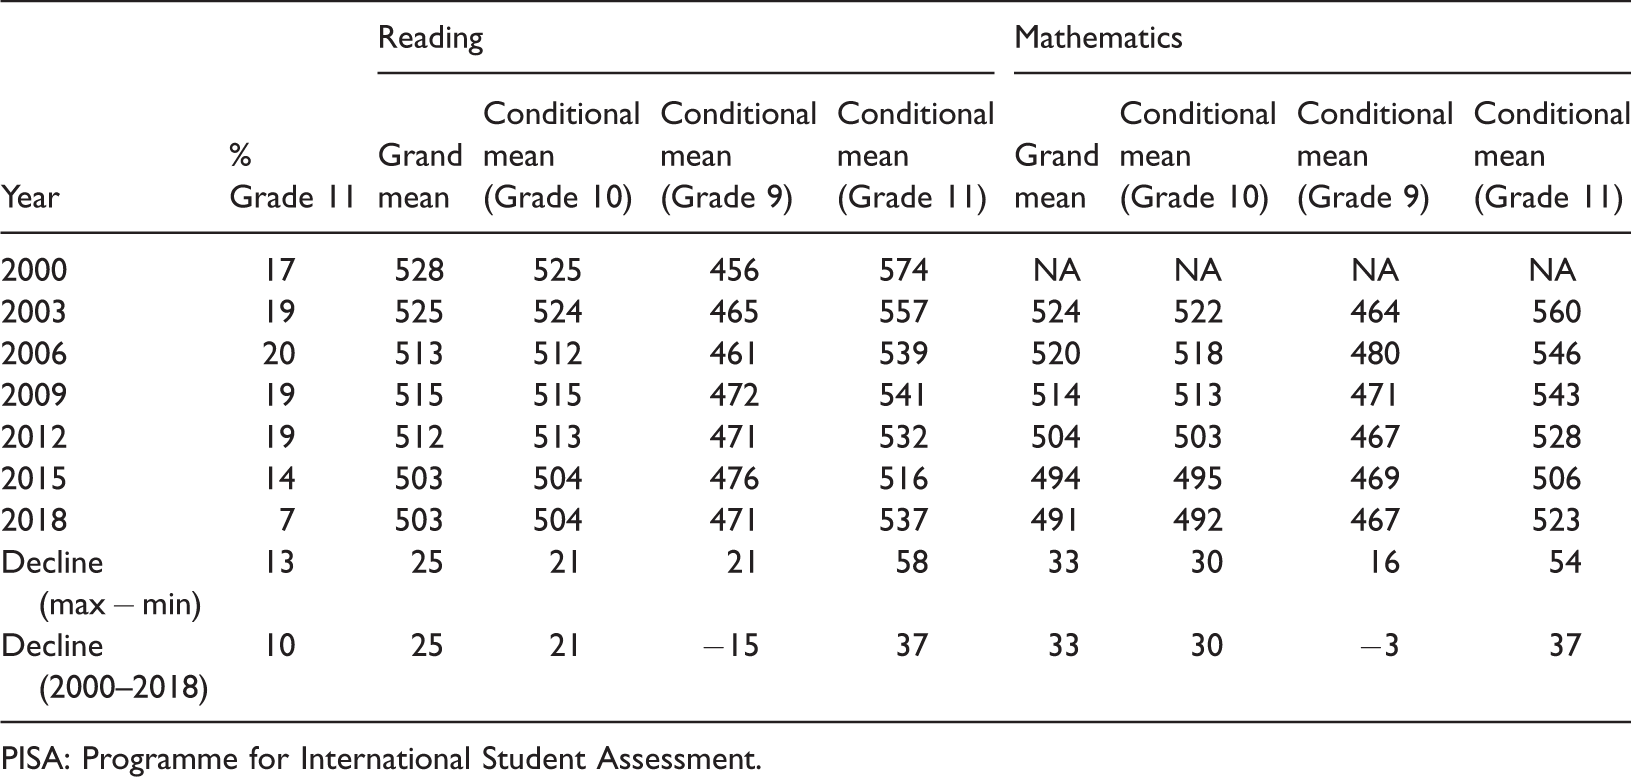
In Australia, 6% of the 15-year-olds who participated in PISA 2000 were in Grade 9, 77% were in Grade 10 and 17% were in Grade 11 (Table 1). 1 Similarly, in PISA 2003, 8% of 15-year-old Australian students were in Grade 9, 72% were in Grade 10 and 19% were in Grade 11. In PISA 2018, the corresponding figures for Australia were 12, 81 and 7% (Table 1). Thus, between 2000 and 2018, there was a decline of 10 percentage points in the percentage of Australian 15-year-olds in Grade 11, an increase of four percentage points in Grade 10 and an increase of six percentage points in Grade 9. Between 2003 and 2018, across Australia, there was a decline of 12 percentage points in the percentage of 15-year-old students in Grade 11 with increases of nine percentage points in Grade 10 and four percentage points in Grade 9.
Percentage distributions of PISA 15-year-old students across year levels nationally and for each jurisdiction.
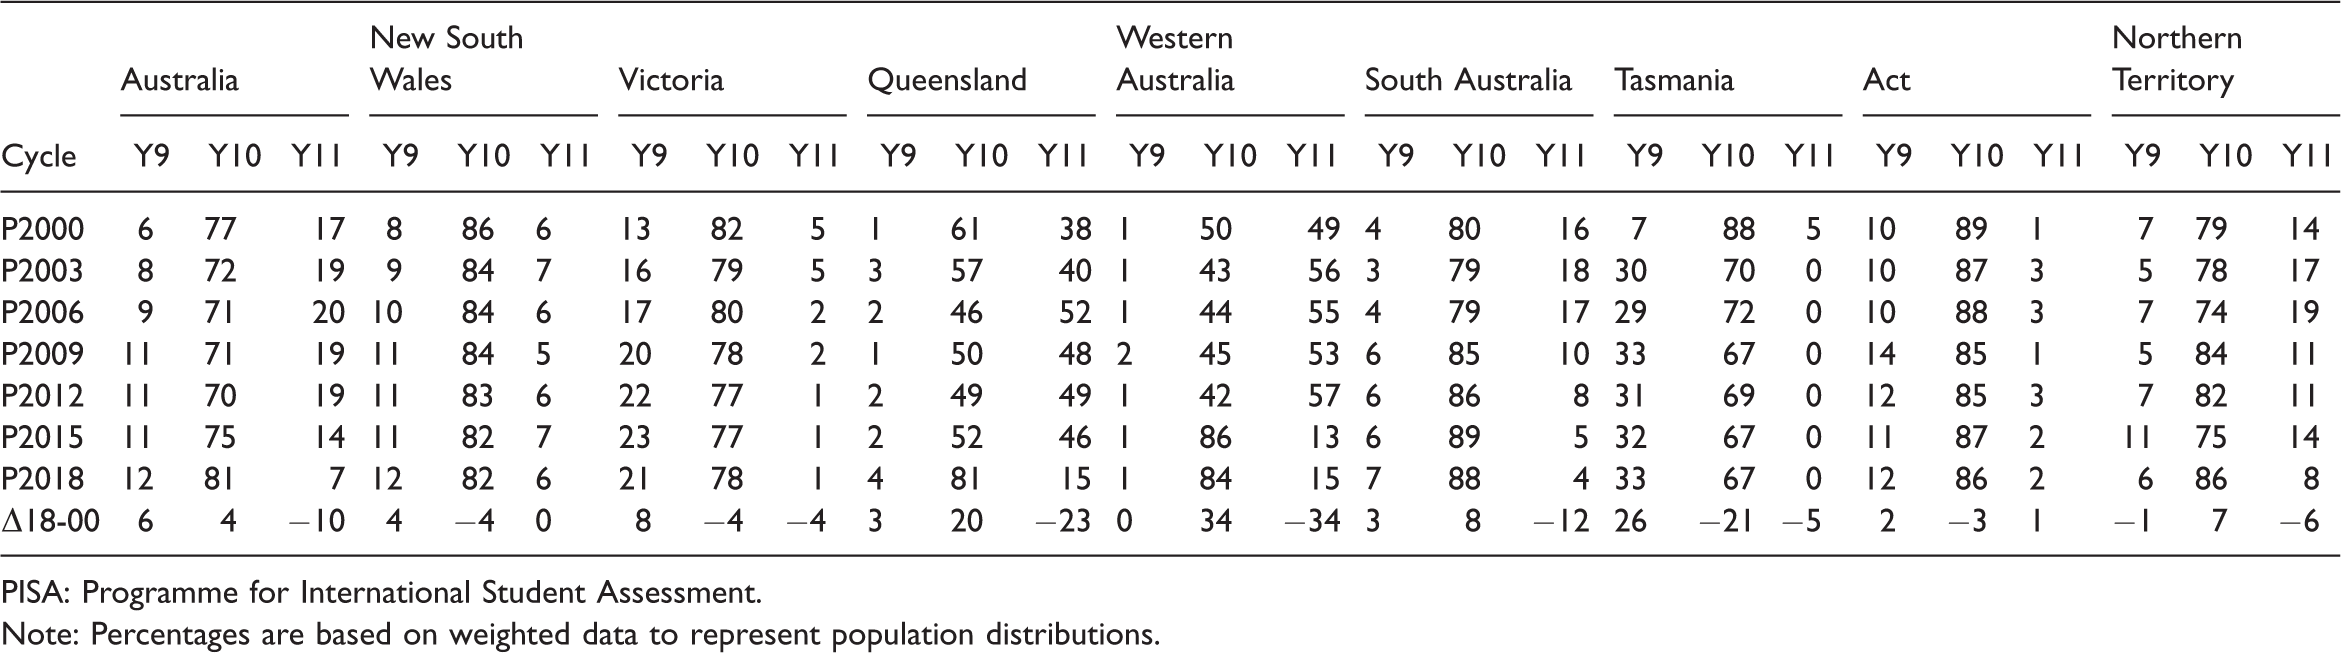
PISA: Programme for International Student Assessment.
Note: Percentages are based on weighted data to represent population distributions.
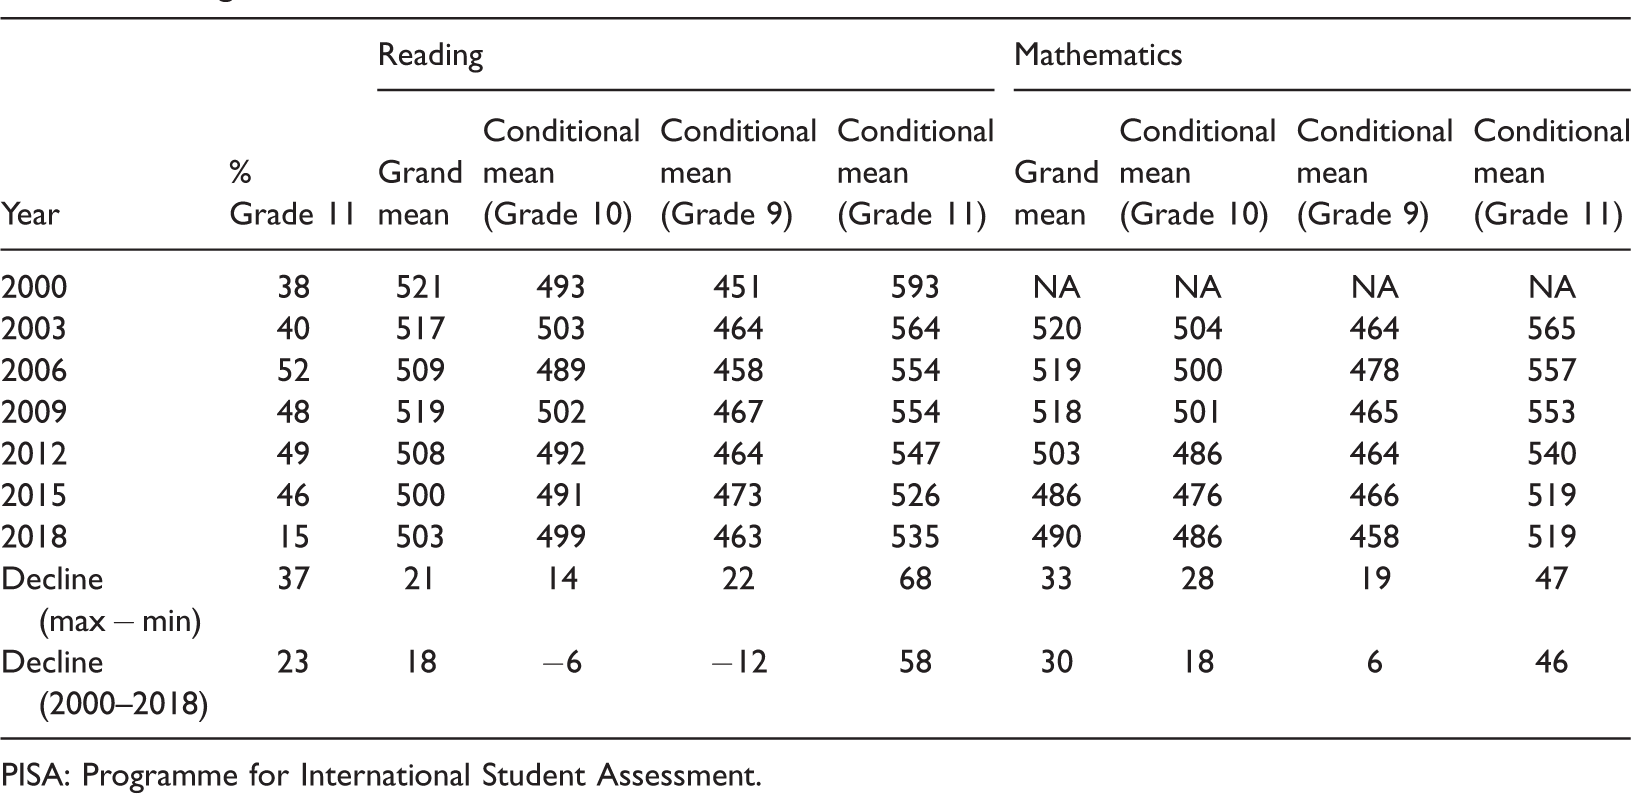
There were also some large shifts in two jurisdictions in the distribution of 15-year-olds across grades between PISA 2000 and PISA 2018 that appear to have been associated with changes in school entry policies and the introduction of a year of schooling prior to Grade 1. In Queensland, the percentage of 15-year-old students in Grade 11 dropped from 38% in 2000, and 40% in 2003, to 15% in 2018 (Table 1). The drop in the percentage of 15-year-old students in Grade 11 was mostly between 2015 and 2018 (from 46 to 15%). This was possibly attributable to the introduction of a foundation (preparatory) year in 2007 and 2008 (Australian Bureau of Statistic (ABS), 2008). In Western Australia, in 2000, 49% of the 15-year-old students in PISA were in Grade 11 (the figure was 56% in 2003) compared to approximately 15% of the 15-year-olds being in Grade 11 in 2018 (Table 1). The drop was mostly between 2012 and 2015 from 57 to 13% and possibly attributable to the introduction of a foundation year (called pre-primary) in 2002 as a half-year cohort with full coverage introduced from 2003 onwards (ABS, 2004). This change flowed through the system impacting on the age-grade distribution in Grades 10 and 11 in 2013 and 2014. Even though there was not necessarily a change in the age distribution of students in Grade 1 there was a tendency for students to be older when they enrolled in Grade 1 and this flowed through to a shift in the grade distribution of 15-year-old students.
In two other jurisdictions there were less dramatic shifts in age-grade distributions that were not associated with structural change. In South Australia, 16% of the 15-year-old students in PISA 2000 were in Grade 11 (the figure was 18% in 2003) compared to approximately 4% of the 15-year-olds being in Grade 11 in 2018 (Table 1). This shift began between 2006 and 2009 and continued steadily since then. In Victoria, the shift in the year-level distribution of 15-year-old students resulted in an increase in the percentage in Grade 9 from 13% in PISA 2000 (and 16% in PISA 2003) to 21% in PISA 2018 (Table 1). These shifts appear to have been steady perhaps reflecting parental decisions about delaying the age at which their children start school.
In New South Wales there was a small increase in the percentage of 15-year-old students in Grade 9 from 8 to 12% between 2000 and 2018 and a corresponding decrease in the percentage in Grade 10. In Tasmania there was an increase in the percentage of 15-year-old students in Grade 9 from 7 to 30% between 2000 and 2003 but thereafter the percentage remained constant at about 30%. There was a negligible shift in the percentage of 15-year-old students in Grade 9 from 2003 to 2018.
In Australia, the achievement difference associated with one grade has been estimated as 33 score points for reading and 28 points for mathematics (Thomson et al., 2019). We recognise that these differences associated with one grade refer only to 15-year-old students and should not be generalised to grades as a whole (OECD, 2019a). From our review of the shifts in the grade distributions of 15-year-old students in PISA between 2000 and 2018, together with the estimated contribution of those shifts to changes in average scores in reading and mathematics, we hypothesize that there may have been a moderate impact of changes in grade distributions in Queensland and Western Australia and small impacts in South Australia, Victoria, Tasmania and Australia as a whole.
Research questions
The research reported in this paper focuses on four research questions.
Research Question 1: Is the grade of 15-year-old students in PISA related to PISA achievement in reading and mathematics after allowing for the effects of differences in student characteristics (age, gender), household characteristics (immigration status, socioeconomic status (ESCS) and jurisdiction?
Research Question 2: Are the changes in PISA achievement in reading and mathematics similar for grades 9, 10 and 11?
Research Question 3: To what extent do changes over time in the grade distributions of 15-year-old students in PISA contribute to changes in average PISA scores in reading and mathematics nationally and for jurisdictions?
Research Question 4: To what extent do differences among jurisdictions in the grade distributions of 15-year-old students in PISA contribute to differences in average achievement across jurisdictions in any specific PISA cycle?
Method
To undertake this study, the PISA data from the OECD PISA website are analysed. These data are publicly available for the following years: 2000, 2003, 2006, 2009, 2012, 2015 and 2018. For PISA 2000 there is a difference between the OECD data files, which we used, and the Australian national data files in the inclusion of the oversample of Indigenous students and therefore in the sample weights. There may be small differences in the estimates based on each data set. For the study years 2000–2015, the EdSurvey package (Bailey et al., 2020) in R (R Core Team, 2019) was used to download the data, read in appropriate variable labels and create data objects for secondary analyses. For 2018, the data were downloaded manually (as the functionality was not available in the EdSurvey package at time of writing) and the SPSS files were read into R using the Haven library (Wickham & Miller, 2019). Only data from Australian students were included in the analyses.
Samples
The samples in each PISA cycle are designed to be representative of 15-year-old students. Specifically, the target population is ‘students who are aged between 15 years 3 months and 16 years 2 months at the time of the assessment’ (OECD, 2001, p. 18). Countries, such as Australia, may choose to oversample specified strata (including jurisdiction) so as to improve the precision of strata estimates. Weights are computed accounting for differential sampling and the effects of non-response to ensure unbiased estimates of national statistics. 2 PISA sampling is conducted as part of a two-stage clustered design in which schools are sampled with probability proportional to size (enrolment) followed by a random selection of a sample of 15-year-old students in each school. For details, see the respective technical manual for each study year (e.g. OECD, 2014) and also Australian country reports (e.g. Thomson et al., 2019). Sample sizes have changed over time from 5176 students from 231 schools in PISA 2000 (Lokan et al., 2001), through 12,551 students from 321 schools in PISA 2003 (Thomson et al., 2004) to 14,273 students from 734 schools in PISA 2018 (Thomson et al., 2019).
Analytic approach
This study estimates population-level statistics, for example the mean reading achievement in Australia in 2018, or the regression coefficient for the effect of grade on mathematics achievement in Australia in 2003. In order to interpret these statistics, standard errors are estimated. We used the EdSurvey package (Bailey et al., 2020) in R to calculate parameter estimates for years 2000–2015 and the authors adapted sections of the intsvy (Caro & Biecek, 2017) package for 2018 data. The quality of the estimates is checked by conducting parallel analysis of selected models in the intsvy package (Caro & Biecek, 2017) in R and through cross-referencing PISA reports (e.g. Thomson et al., 2019). Graphical representations of data are generated using ggplot2 (Wickham, 2016).
To address the research questions two methods are used. First, simple means are calculated for reading and mathematics achievement for both Australia and each jurisdiction over time. Second, multivariate regression is used to regress the reading and mathematics plausible values (PVs) onto student (grade, age, gender), household (immigration status, socioeconomic status (ESCS)) and jurisdiction (state) variables. Each regression model is built up sequentially, commencing with (1) intercept-only models; (2) adding grade effects; (3) adding student, household, and jurisdiction effects; and (4) adding jurisdiction by grade interactions. Higher-order effects, including polynomial terms, are considered but removed due to being inconsistently related to the outcomes over study years and, at best, reflecting very small effects.
Variables
The dependent variables in the regression analyses were the PISA PVs in reading and mathematics (e.g. OECD, 2009). For PISA 2000 through PISA 2012, five PVs were generated for each estimate of performance, but for PISA 2015 and PISA 2018, 10 PVs were used to generate performance scores (OECD, 2017, p. 147). We used all available PVs for each cycle. For reading, we used data from PISA 2000 through to PISA 2018. For mathematics, we used data from PISA 2003 through to PISA 2018 because mathematics did not become a major domain until 2003. The independent variable that was the focus of our interest was student grade. This was represented as a set of dummy variables with Grade 10 as the reference category and parameters estimated for Grade 9 or below and Grade 11 or above. Hence, the results reported for Grade 9 and Grade 11 are relative to the scores for Grade 10 holding other variables in the analyses constant.
We also included in the regression analyses a number of other independent variables representing student characteristics that previous research had indicated as associated with achievement or which represented education systems.
Socioeconomic background is represented by the variable ESCS which is a composite score based a principal components analysis of parents’ education, parents’ occupations, home possessions that reflect material wealth, and the number of books and other educational resources in the home (OECD, 2014). It has been set by PISA to an international mean for OECD countries of zero and a standard deviation of one. This measure was not available in the international data set for PISA 2000 and PISA 2003 and was not included in these years. Student gender was a dichotomous variable with results recorded for male students relative to female students. Student age in months, mean-centred, was included, even though all the students were 15 years old, to control for the possibility that older 15-year-old students were more likely to be in the higher grades and that relative age might be associated with achievement. Immigrant background was included as a set of two dummy variables with non-immigrant being the reference category and coded as zero for each of the dummy variables. The two dummy variables, each coded as either zero or one, were being a first-generation immigrant (i.e. the student was born overseas) and being a second-generation immigrant (i.e. a parent born overseas). Educational jurisdiction was represented as a set of seven dummy variables with New South Wales being the reference category. We chose New South Wales as the reference category because it was the largest jurisdiction (based on student population) and because there had been very little change in the distribution of 15-year-old students across grades over the period from 2000 to 2018 (Table 1). This facilitated interpretations of changes over time. We also included a set of dummy variables to represent interaction effects of grade and jurisdiction. These allowed us to test whether there were different effects of grade in particular jurisdictions.
Results
The decline in PISA achievement in Australia is well documented (Thomson et al., 2019). This decline is recreated in Figures 1 and 2 using means taken from an intercept-only regression model. The solid line in both figures represents the Australian mean trend and the dashed line represents the conditional mean, controlling for grade. In this case, the dashed line is the mean with grade held constant at Grade 10. Of note, it can be seen that the dashed line begins below the Australian mean in the first three or four cycles of PISA but in later cycles is above the mean. This provides some insight into the effect of the reduced proportion of Grade 11 students in the national sample (and therefore their contribution to the national mean).
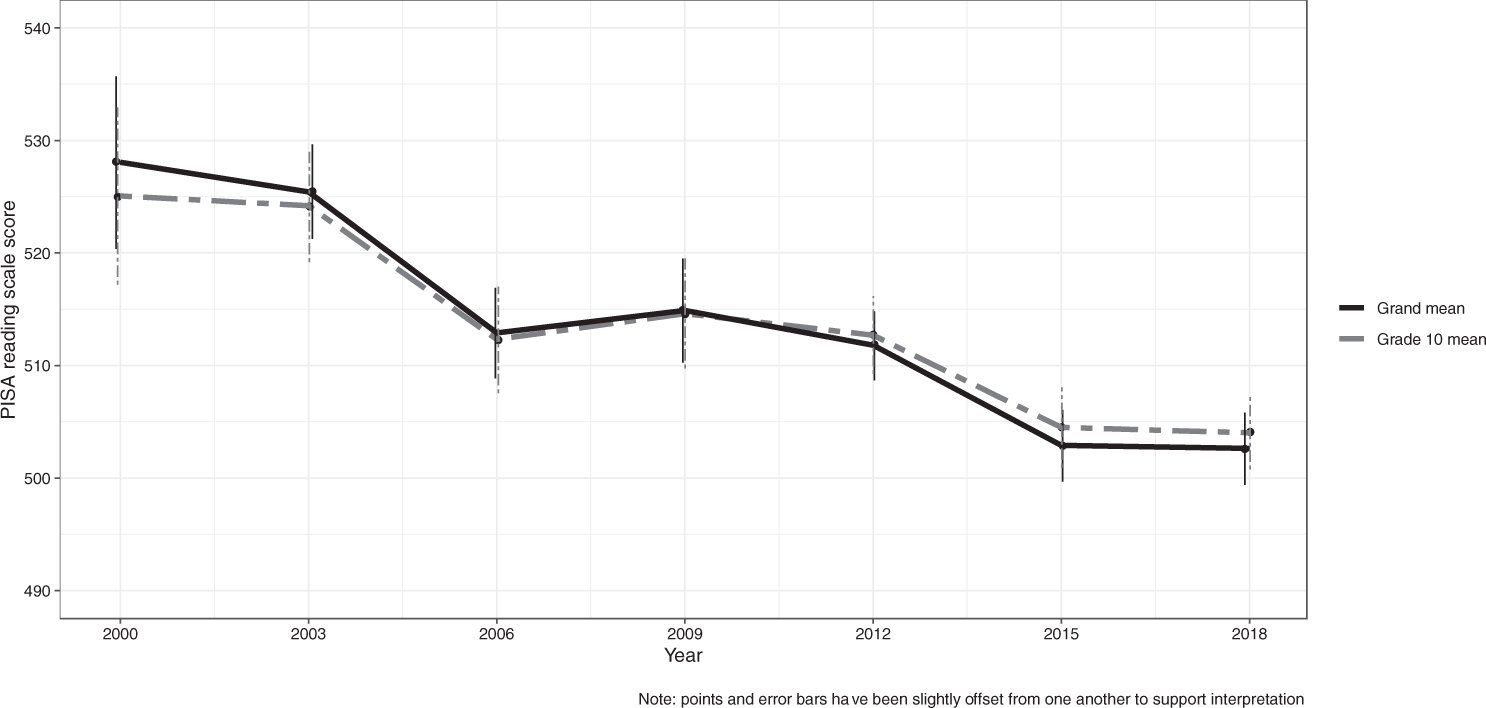
Means for PISA reading for 15-year-old students in Australia: 2000–2018. Note: Points and error bars have been slightly offset from one another to support interpretation. PISA: Programme for International Student Assessment.
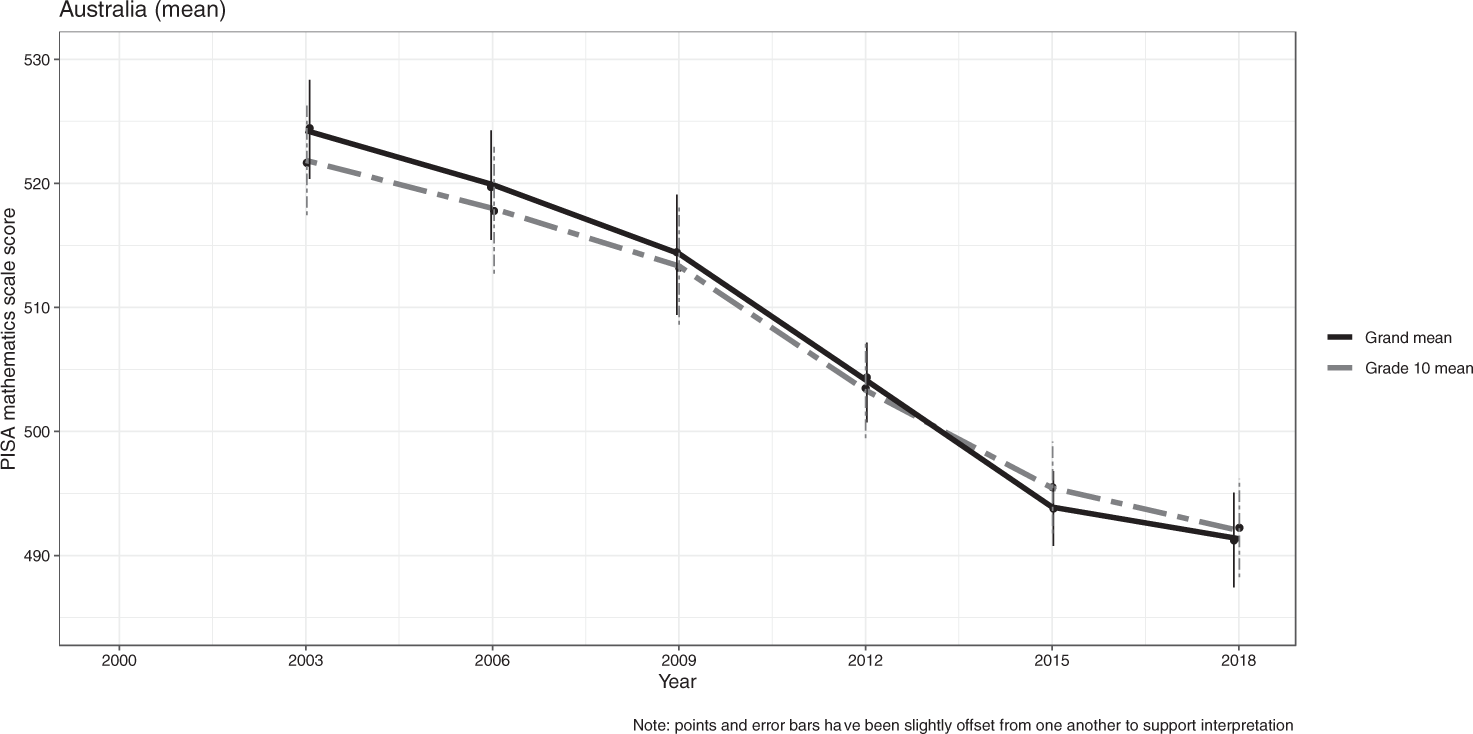
Means for PISA mathematics for 15-year-old students in Australia: 2000–2018. Note: Points and error bars have been slightly offset from one another to support interpretation. PISA: Programme for International Student Assessment.
Differences over time by grade
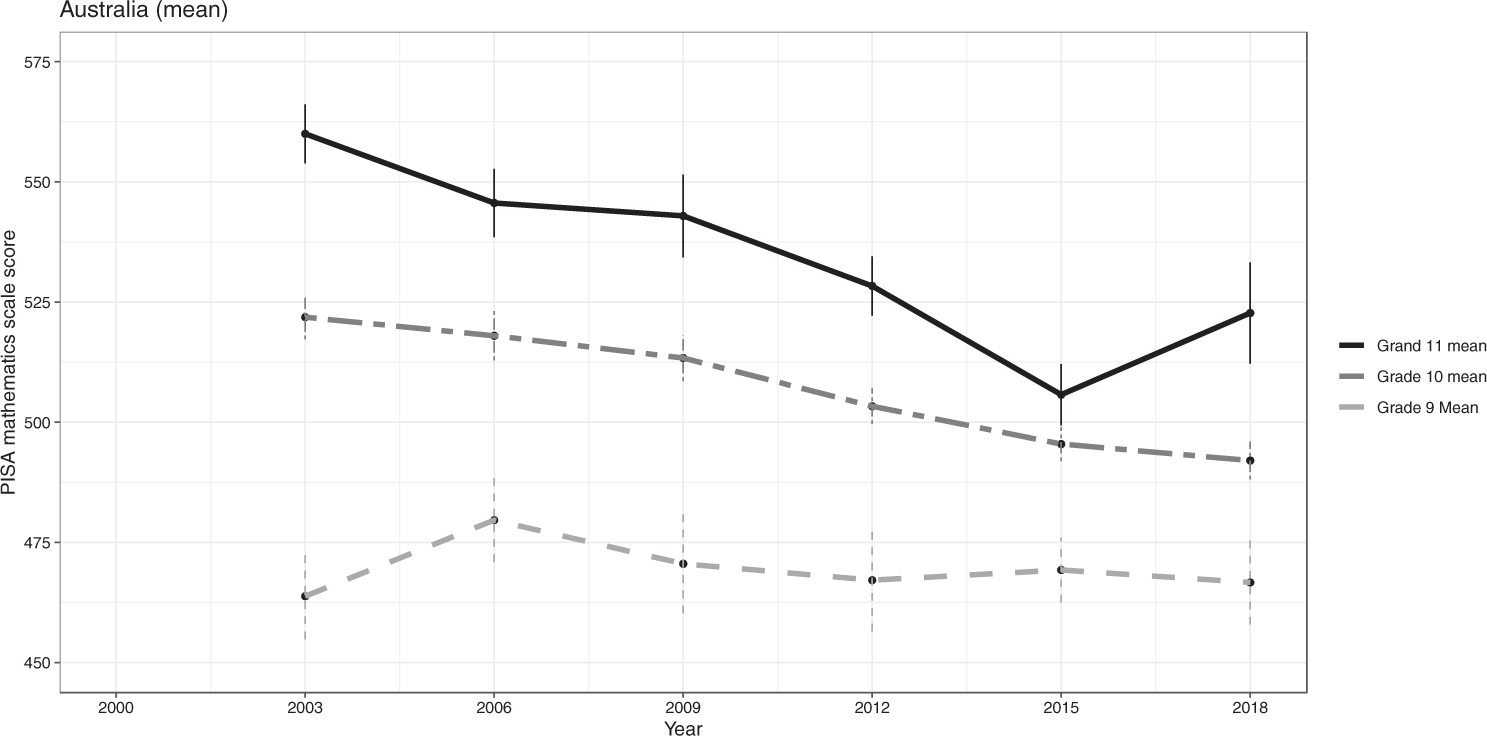
Table 2 presents the national mean achievement in reading and mathematics over successive PISA cycles for 15-year-old students in Grade 9, Grade 10 and Grade 11. These data are also represented in Figures 3 and 4. In all cycles Grade 11 means were significantly greater than Grade 10 means and Grade 10 means were significantly greater than Grade 9 means. In reading, there was an overall decline in average achievement of Grade 11 students from 2000 to 2018 of 37 scale points. The decline was marked from 2000 to 2006 followed by no significant change except for a drop in PISA 2015. The overall drop in reading achievement for Grade 10 students was 21 points. Even though the overall drop for Year 11 appears to be higher than that for Year 10, the difference is not statistically significant. For Grade 9 students there was no significant change in reading achievement between 2000 and 2018.
Mean national reading and mathematics achievement of PISA 15-year-old students in Years 9, 10 and 11.
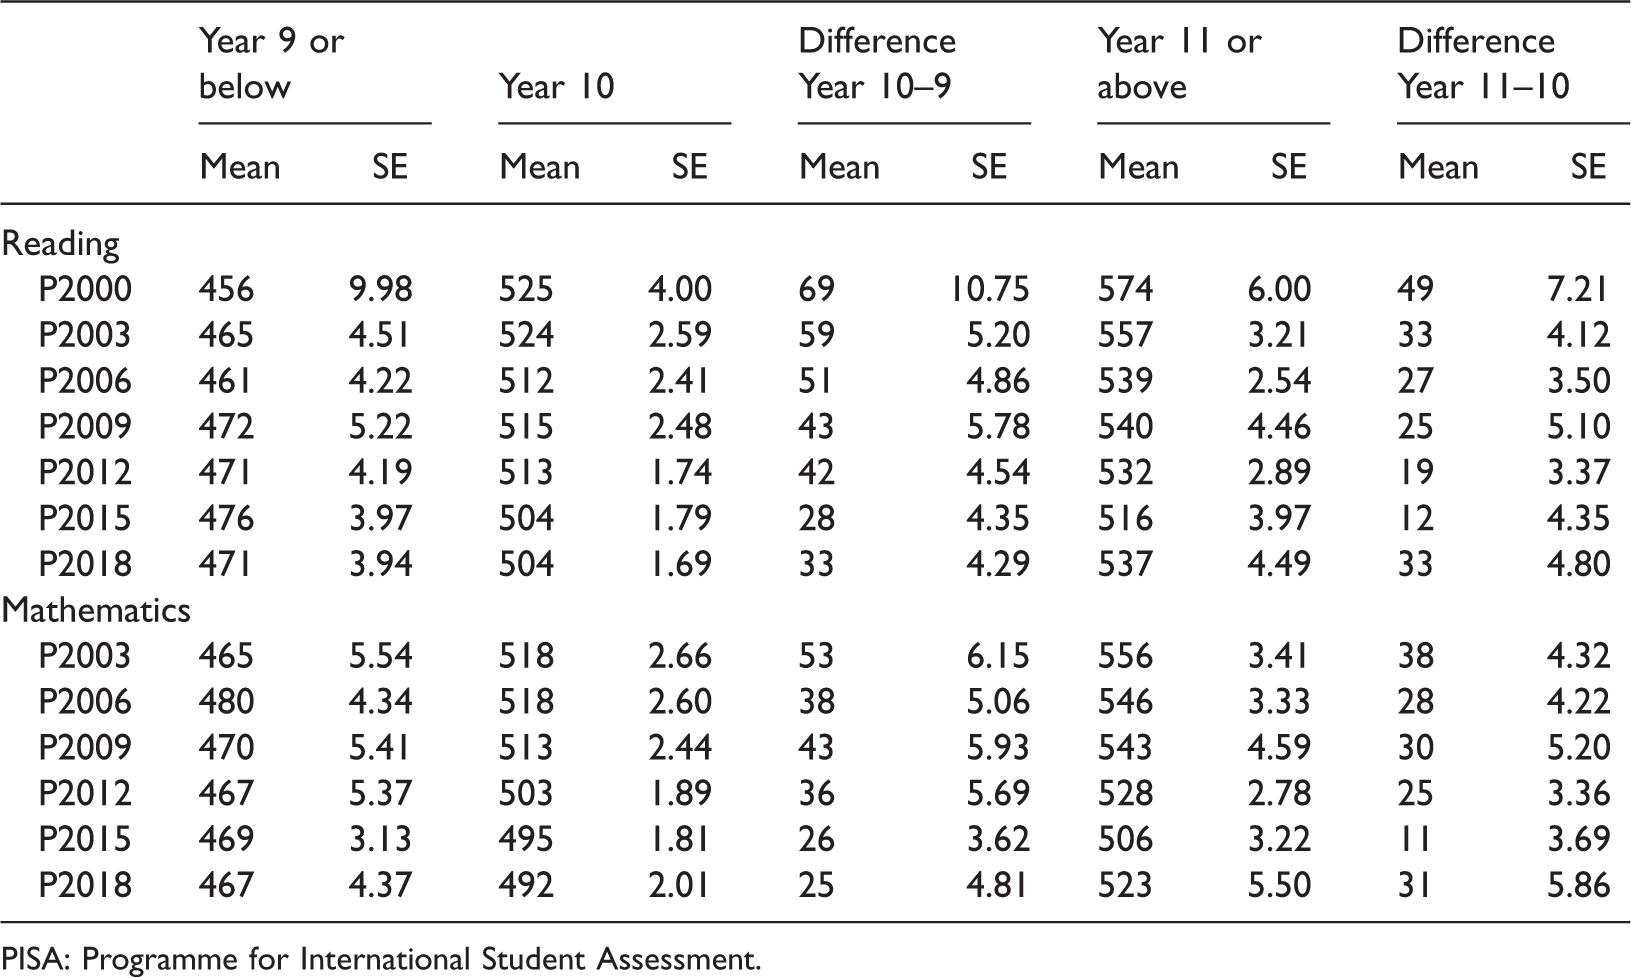
PISA: Programme for International Student Assessment.
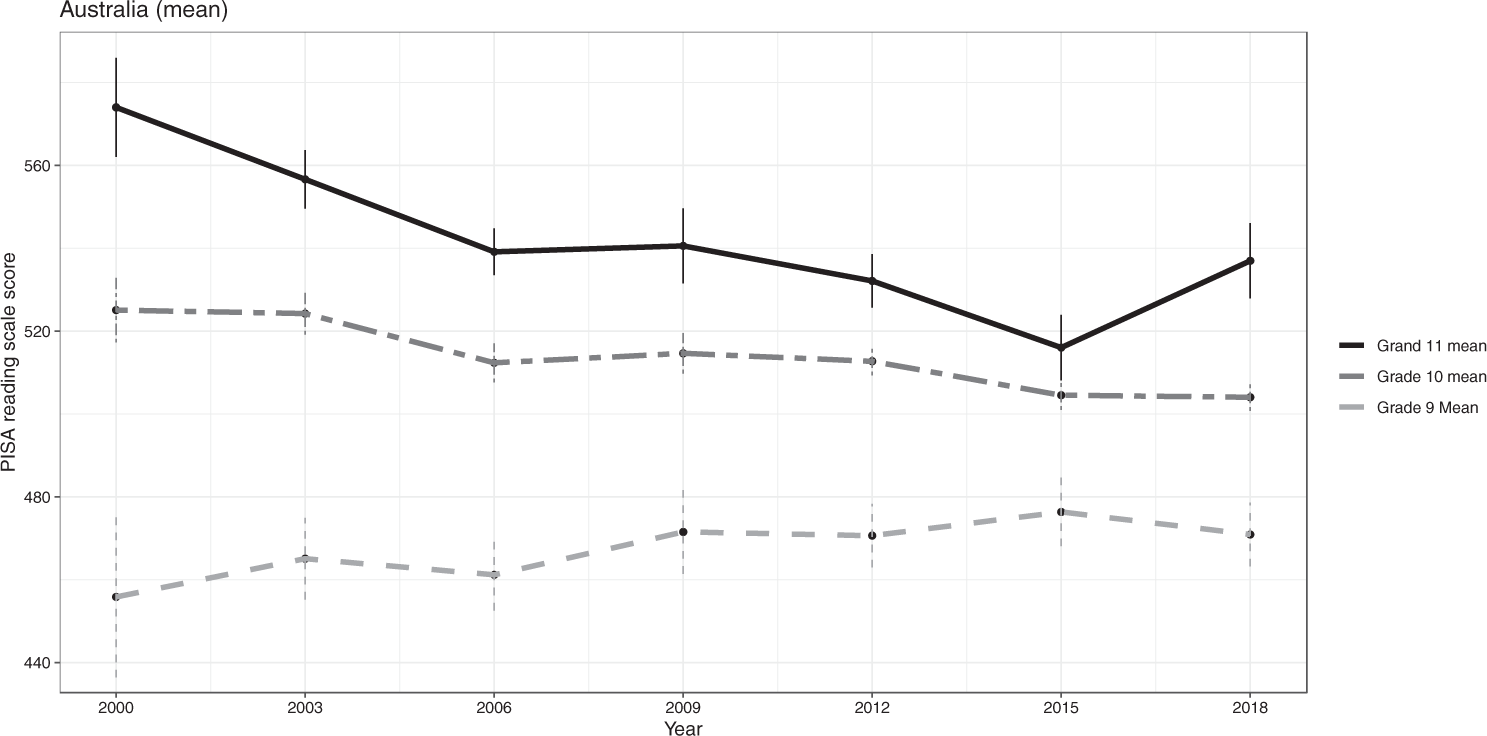
Means for PISA reading for students in Years 9, 10 and 11: 2000–2018. PISA: Programme for International Student Assessment.

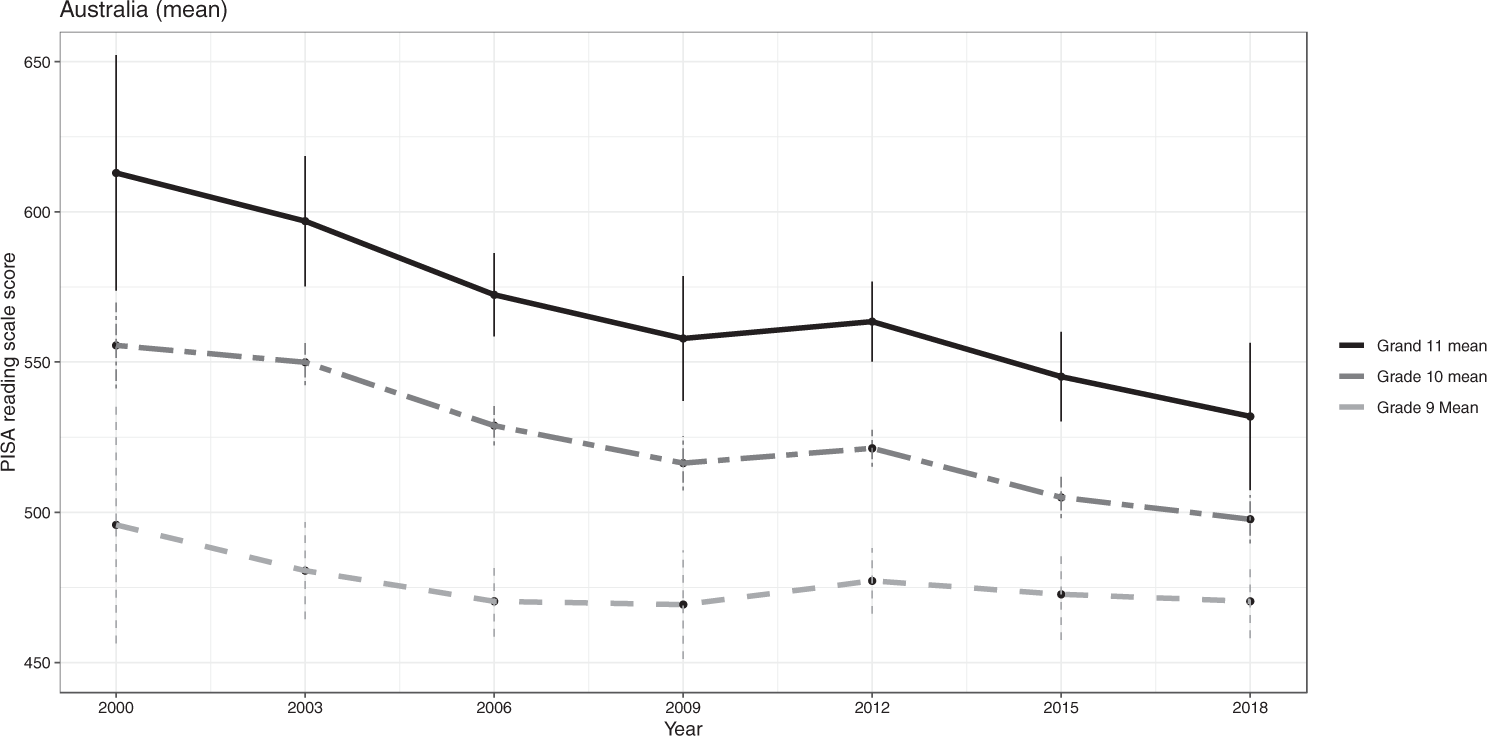
Means for PISA mathematics for students in Years 9, 10 and 11: 2000–2018. PISA: Programme for International Student Assessment.
In mathematics, the overall decline between 2003 and 2018 in the average achievement of 15-year-old students in Grade 11 (33 points) was similar to that for 15-year-old students in Grade 10 (26 points) although with a drop in 2015. For Grade 9 students there was no significant change in mathematics achievement between 2003 and 2018.
Multiple regression
Overall, the model explained approximately 15% of the variance in achievement scores in both reading (Table 3) and mathematics (Table 4). The percentage of variance explained by the model was greatest in PISA 2006 reading (21% of the variance) and least in PISA 2003 mathematics (8%). It should be recognised that even though we used statistical modelling in which predictor variables are used to ‘explain’ variation in dependent variables, our results should not be interpreted as indicating causality. Given that international LSAs are cross-sectional, it is not possible to reach firm conclusions about causal relationships from the findings of our analyses. It is preferable to regard these results as associations between achievement and relevant independent variables.
Regression analyses for PISA reading on year level, student characteristics and jurisdiction: 2000–2018.
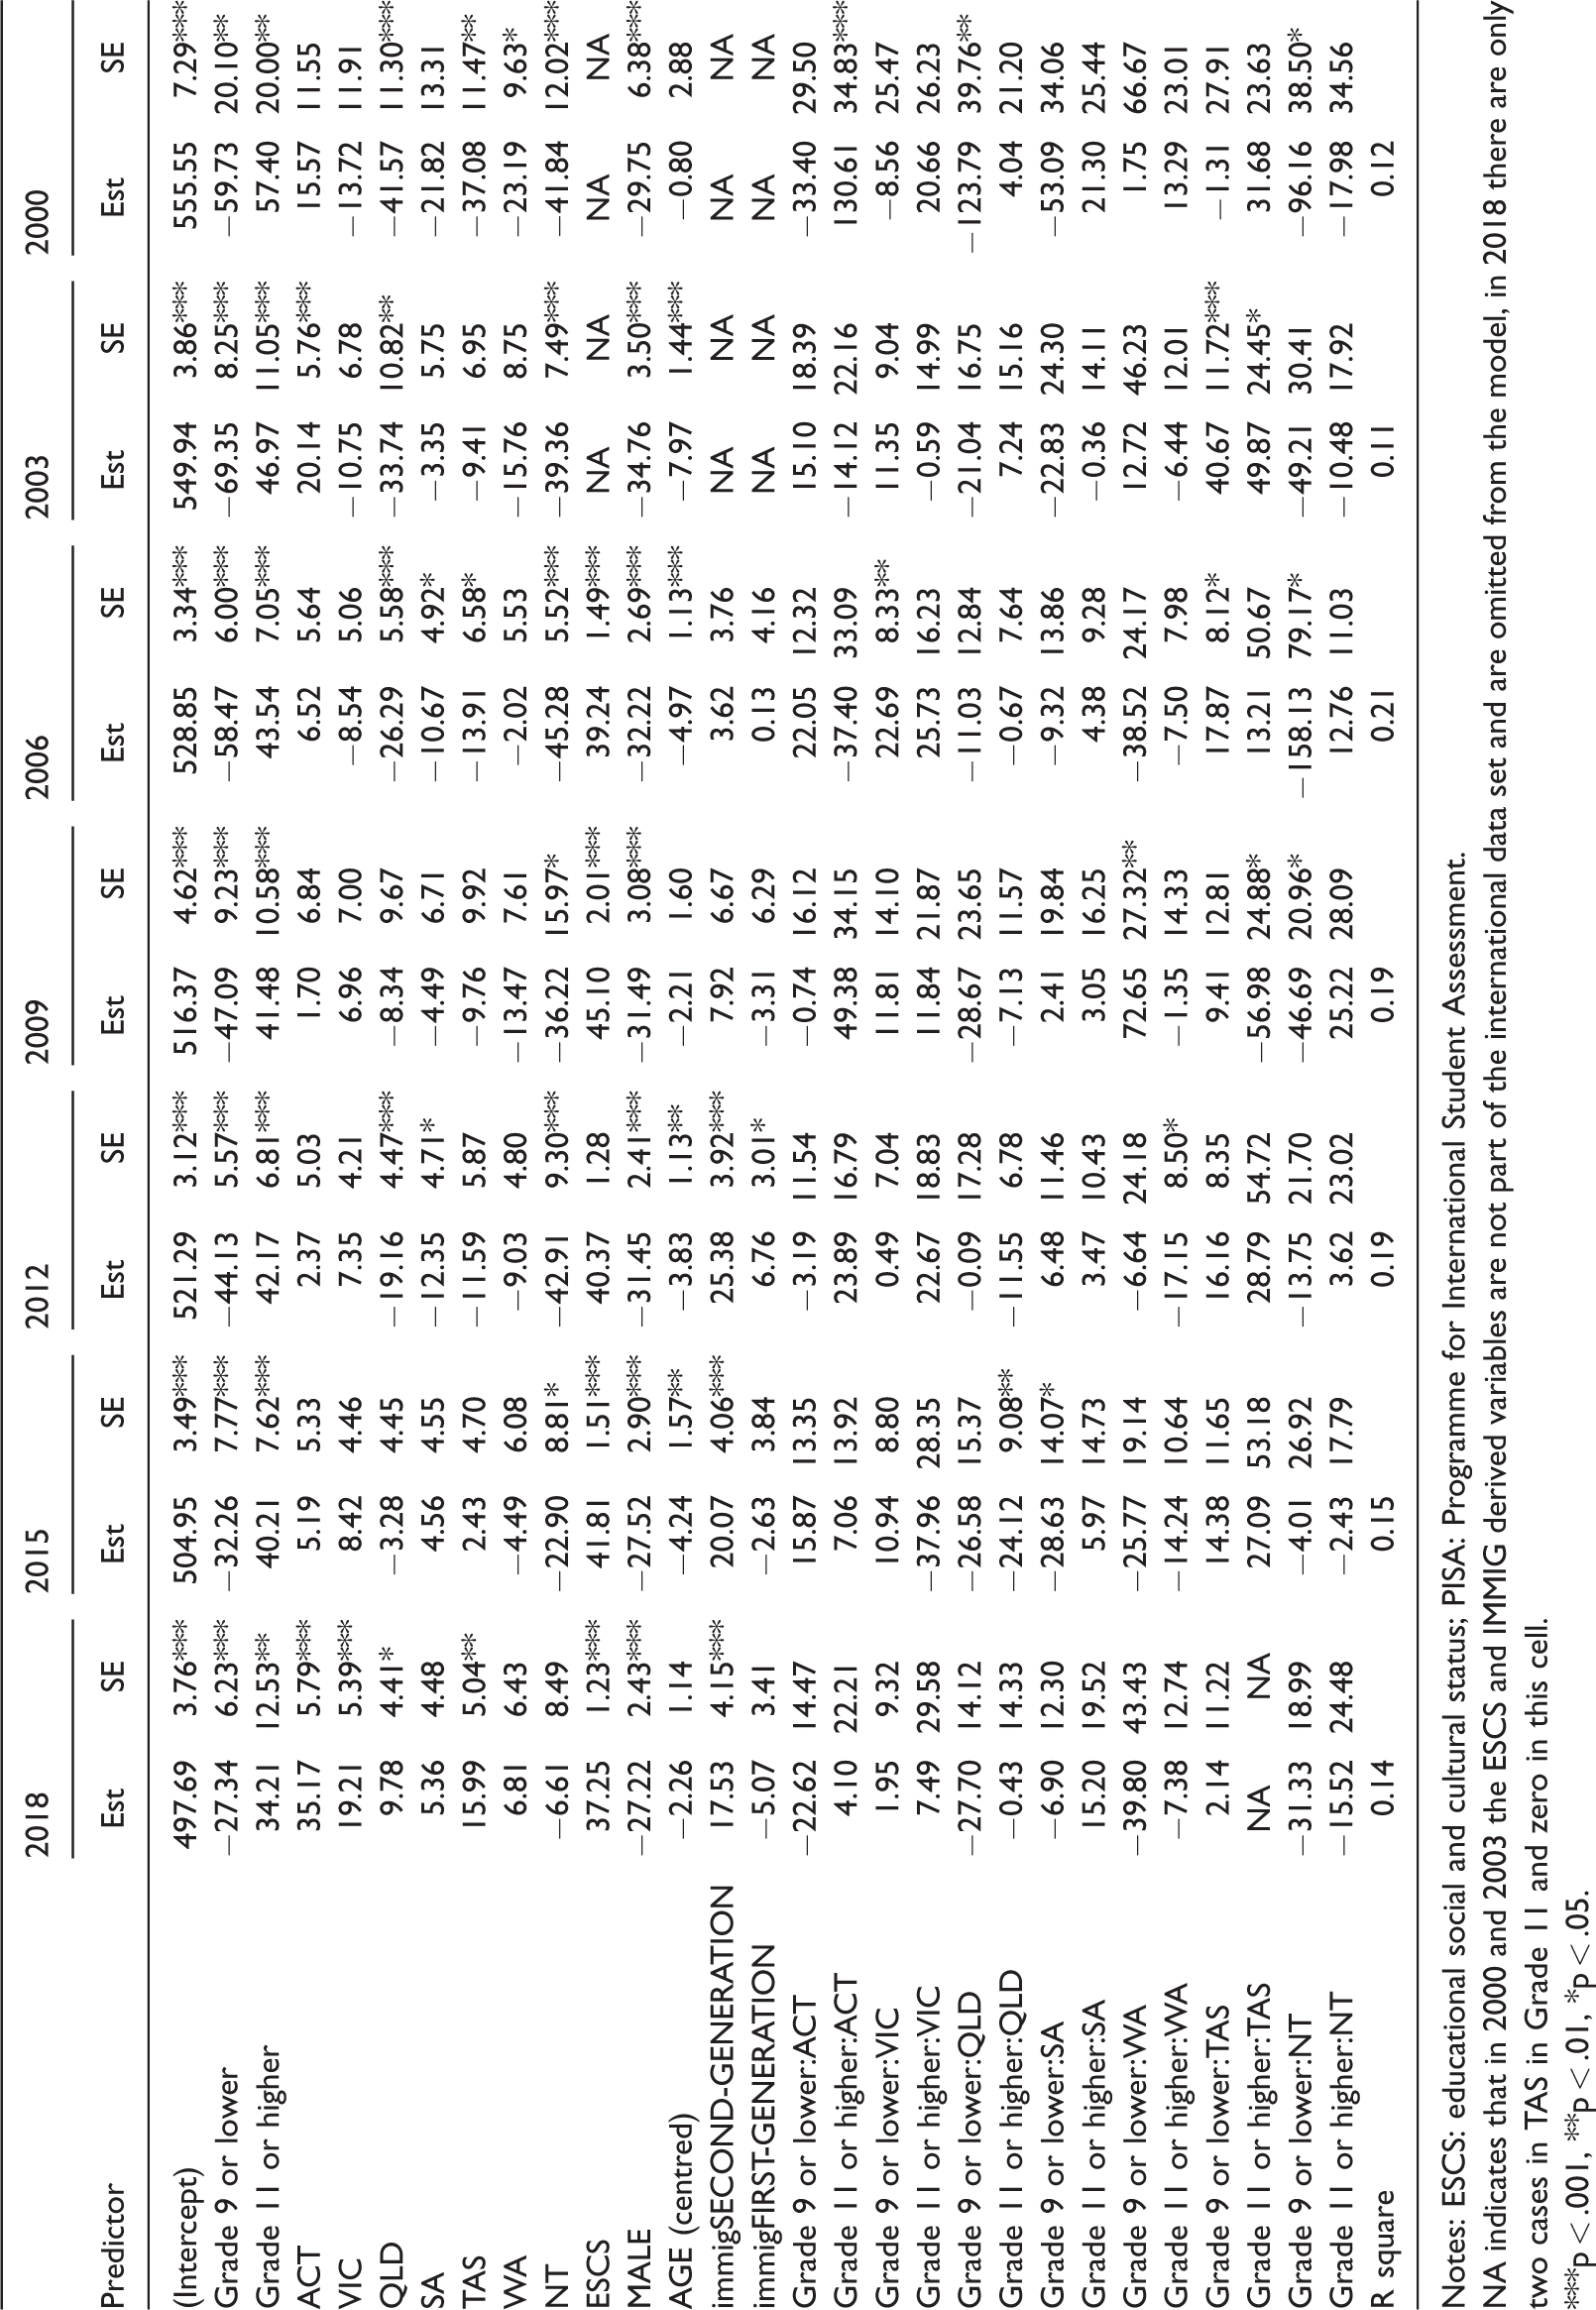
Notes: ESCS: educational social and cultural status; PISA: Programme for International Student Assessment.
NA indicates that in 2000 and 2003 the ESCS and IMMIG derived variables are not part of the international data set and are omitted from the model, in 2018 there are only two cases in TAS in Grade 11 and zero in this cell.
***p < .001, **p < .01, *p < .05.
Regression analyses for PISA mathematics on year level, student characteristics and jurisdiction: 2003–2018.
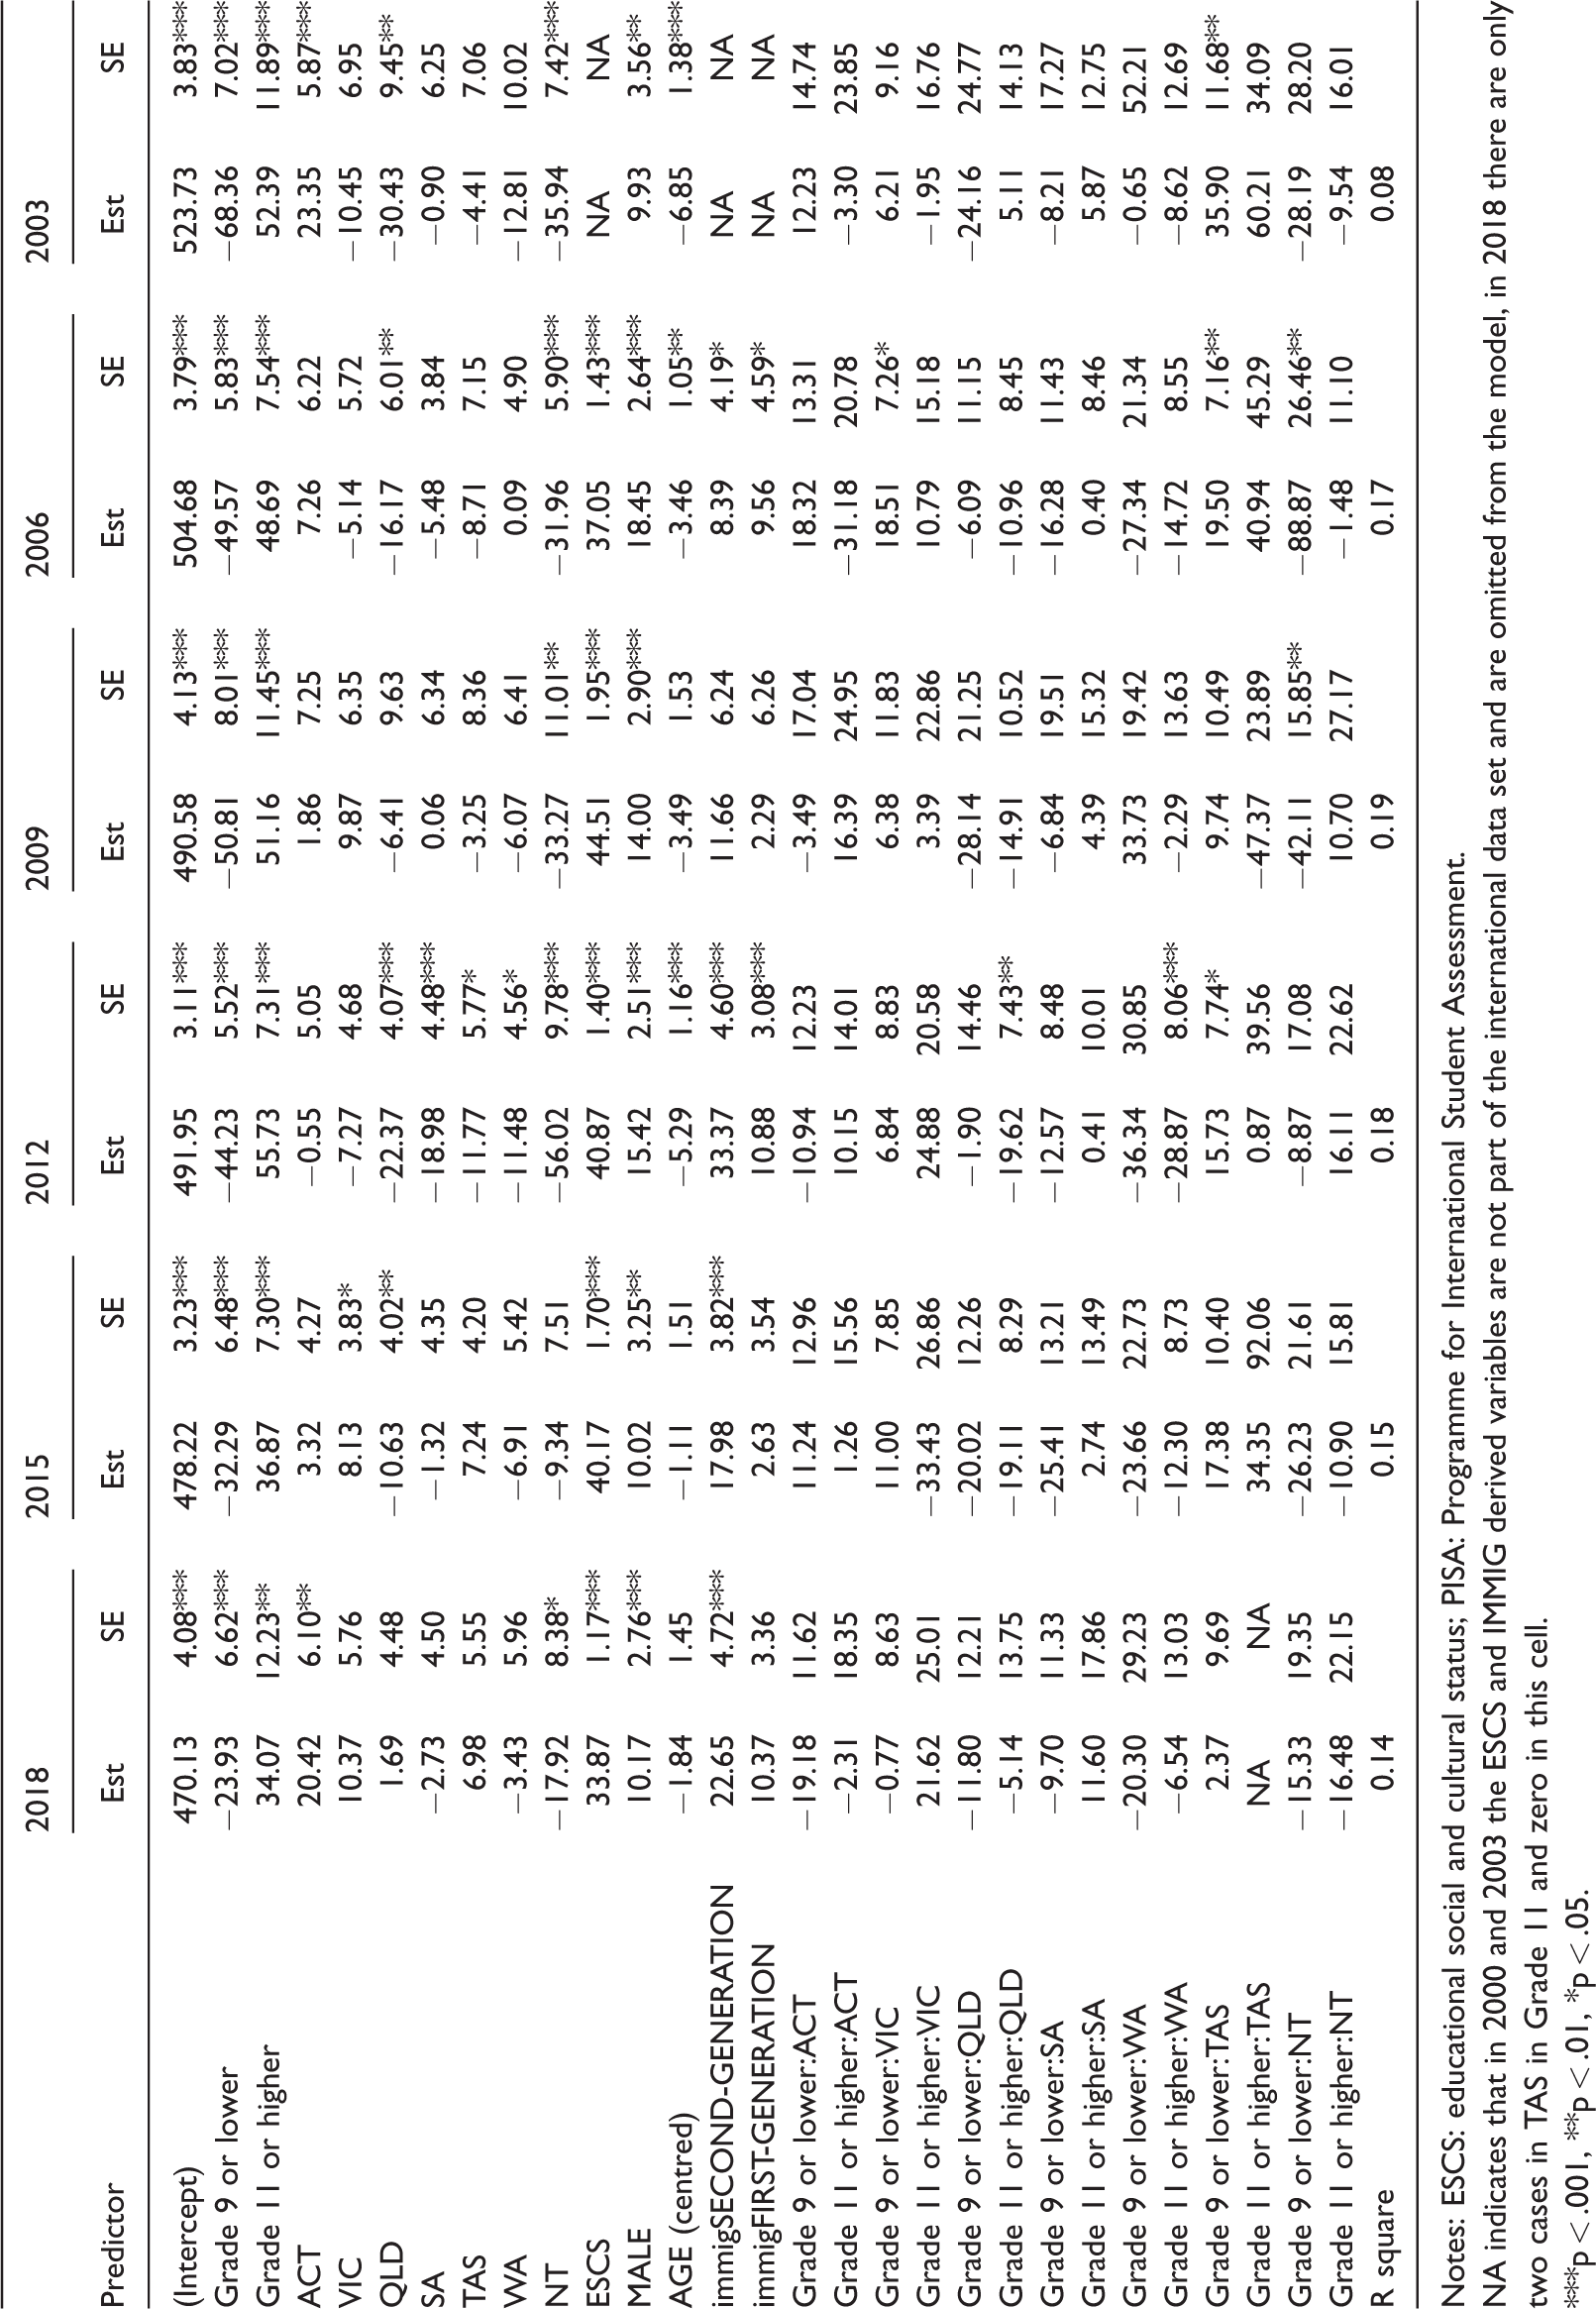
Notes: ESCS: educational social and cultural status; PISA: Programme for International Student Assessment.
NA indicates that in 2000 and 2003 the ESCS and IMMIG derived variables are not part of the international data set and are omitted from the model, in 2018 there are only two cases in TAS in Grade 11 and zero in this cell.
***p < .001, **p < .01, *p < .05.
In terms of our investigation, the achievement of Grade 11 students was higher than the achievement of Grade 10 students and the achievement of Grade 9 students was lower than the achievement of Grade 10 students, net of the influences of other variables in the analyses (Tables 3 and 4). The sizes of the effects of grade were not significantly different for reading and mathematics and the sizes of the effects of being in Grade 9 compared to Grade 10 were not significantly different from the size of the effects of being in Grade 11 compared to Grade 10. The effects of Grade 11 compared to Grade 10 were of moderate size (approximately two-fifths of a standard deviation) and were similar in size to the effects of one standard deviation on the ESCS scale of socioeconomic background (Tables 3 and 4). A number of other associations between achievement and other variables were also noted.
Student age had a very small but significant negative association with PISA reading achievement (Table 3) but no significant association with PISA mathematics (Table 4). We therefore concluded that any differences in the age of 15-year-old students did not contribute greatly to observed differences in achievement between grades. Student gender (male compared to female students) was negatively and moderately related to reading achievement (i.e. males scored lower) (Table 3) but positively and slightly related to mathematics achievement (i.e. males scored higher) (Table 4). Student socioeconomic background (ESCS) was moderately to strongly related to both reading and mathematics achievement. A difference of one standard deviation in ESCS was associated with a difference in achievement of about two-fifths of a standard deviation, other things being equal. Being a second-generation immigrant was associated with higher achievement in both reading and mathematics to a small extent. The net difference in achievement between second-generation immigrant students and non-immigrant students was approximately one-fifth of a standard deviation, although the size of the effect varied across PISA cycles (Tables 3 and 4). There was no significant difference between first-generation immigrant students and non-immigrant students in either reading or mathematics achievement.
We used the results of the regression analyses to generate conditional means (i.e. adjusted for the effects of the independent variables other than grade in the model) (Figures 5 and 6). These results indicated that the national declines in the conditional means for reading achievement were similar for Grade 11 and Grade 10 (although appearing to be a little greater for Grade 11 than Grade 10) but that there was no significant decline for Grade 9. The trends were similar for the conditional means for mathematics achievement. The trends in the conditional means for mathematics achievement were similar for Grade 11 and Grade 10 (although appearing to be a little steeper for Grade 11 than Grade 10) but there was no significant change in the conditional mean for Grade 9.
Conditional means for PISA reading for students in Years 9, 10 and 11: 2000–2018. PISA: Programme for International Student Assessment.
Conditional means for PISA mathematics for students in Years 9, 10 and 11: 2000–2018. PISA: Programme for International Student Assessment.
There were some significant differences between the conditional reading and mathematics achievement measures for jurisdictions (i.e. the achievement measures after allowing for the effects of student characteristics) and New South Wales (which was the reference jurisdiction). In exploring these differences, we have not considered results for PISA 2000 and PISA 2003 because we were not able to include socioeconomic background in the equations for those cycles. Conditional reading achievement in the Northern Territory was significantly lower than in New South Wales for all cycles except PISA 2018 (e.g. the unstandardised regression coefficients for the Northern Territory ranged from −45.28 (SE = 5.52) in 2006 to −22.90 (SE = 8.81 in 2015), see Table 3). Reading achievement was lower than for New South Wales in PISA 2006 in Queensland, South Australia and Tasmania as well as in PISA 2012 in Queensland and South Australia. In PISA 2018, reading achievement was higher than New South Wales in Victoria, Queensland, Tasmania and the ACT (Table 3).
Conditional mathematics achievement in the ACT was significantly higher than conditional mathematics achievement in New South Wales (by three-tenths of a standard deviation) in PISA 2018 and in Victoria (by a little less than one-tenth of a standard deviation in PISA 2015). Conditional mathematics achievement in the Northern Territory was significantly lower than New South Wales in PISA 2018, 2012, 2009 and 2006 (e.g. the unstandardised regression coefficients for NT ranged from −55.02 (SE = 9.76) in 2012 to −17.92 (SE = 8.38 in 2018), see Table 4). Conditional mathematics achievement was also significantly lower than New South Wales in Queensland, Western Australia and Tasmania in PISA 2012 (Table 4).
There were only a few instances of the interaction effect of grade by jurisdiction being different from New South Wales. We observed that the effects of grade on achievement were fairly uniform across jurisdictions.
Correspondence between shifts in grade distribution and achievement declines in PISA
Following the multiple regression analyses we returned to an examination of the correspondence of shifts in the grade distribution of 15-year-old students with average achievement in PISA reading and mathematics. We conducted this investigation for Australia using both unconditional and conditional grade means with the percentage of 15-year-old students in Grade 11 as an indicator of grade distribution (Table 5).
Correspondence between percentage of 15-year-old students in Grade 11 and mean achievement in PISA reading and mathematics for Australia.
PISA: Programme for International Student Assessment.
Between 2000 and 2018, there was a decline of 10 percentage points in the percentage of 15-year-olds in Grade 11, an increase of six percentage points in Grade 10 and an increase of four percentage points in Grade 9. At the same time there was a decline of 26 scale points in average reading achievement (Thomson et al., 2019). Similarly, between 2003 and 2018, there was a decline of 12 percentage points in the percentage of 15-year-old students in Grade 11 and a decline of 33 scale points in average mathematics achievement (Thomson et al., 2019).
The declines in PISA achievement currently observed in Australia cannot be wholly explained by decreasing proportions of students in the higher-achieving Grade 11 group. As a thought experiment, consider the three grade groups as sub-populations with unchanging true means and variances on the PISA scale with independent samples drawn at each cycle. Given the shifts in proportionality described in the previous paragraph, the expectation would be that the three sub-populations would have estimated means that are equal between cycles (and therefore the grade differences would also be constant between sub-populations/grade groups), with some variance due to sampling error: the trajectory for each sub-population/grade group would have gradient of zero and the grand mean would have a small negative gradient proportional to the changing percentage of Grade 11 students (reducing) and Grade 10 and 9 students (increasing) (see Table 1). Without a simulation study, it is not possible to quantify this expectation for the magnitude of negative slope, but through simple analysis it could be assumed that this would be in the order of magnitude of 5–10 scale points.
Correspondence between percentage of 15-year-old students in Grade 11 and mean achievement in PISA reading and mathematics in Queensland.
PISA: Programme for International Student Assessment.
Correspondence between percentage of 15-year-old students in Grade 11 and mean achievement in PISA reading and mathematics in Western Australia.
PISA: Programme for International Student Assessment.
What is also true, however, is that the story is more complex. The gradient of Grade 11 students is negative and steeper than the generalised (unconditional) decline (e.g. average mathematics achievement of students in Grade 11 has declined by 37 scale points compared to the decline in the grand mean of 33 points). This no doubt contributes to diluting the effect of the shifting proportions of students in each grade (because it is the reducing proportion of higher-achieving Grade 11 students in the sample that is driving the effect). This said, 15-year-old Grade 11 students still achieve, on average, significantly higher than both Grade 10 and Grade 9 15-year-old students in both reading and mathematics.
For Australia the largest shifts in the percentages of 15-year-old students in Grade 11 took place after PISA 2012 (Table 1). Between PISA 2000 and PISA 2012 there was a decline in mean reading achievement even though there was very little change in percentage of students in Grade 11. Between PISA 2012 and PISA 2015 there was a decline in reading achievement and a concomitant drop in the percentage of 15-year-old students in Year 11. Between PISA 2015 and PISA 2018 there was a drop in the percentage of 15-year-old students in Year 11 but no decline in reading achievement. For mathematics, there was a decline in mathematics achievement between PISA 2003 and PISA 2012 even though there was little change in the percentage of 15-year-old students in Year 11. Between PISA 2012 and PISA 2015, and between PISA 2015 and PISA 2018, there were declines in mathematics achievement at the same time as there were drops in the percentages of 15-year-old students in Grade 11. That said, as a whole, the change in the percentages of 15-year-old students in Grade 11 and the decline in mean achievement scores in PISA reading and mathematics were not synchronous.
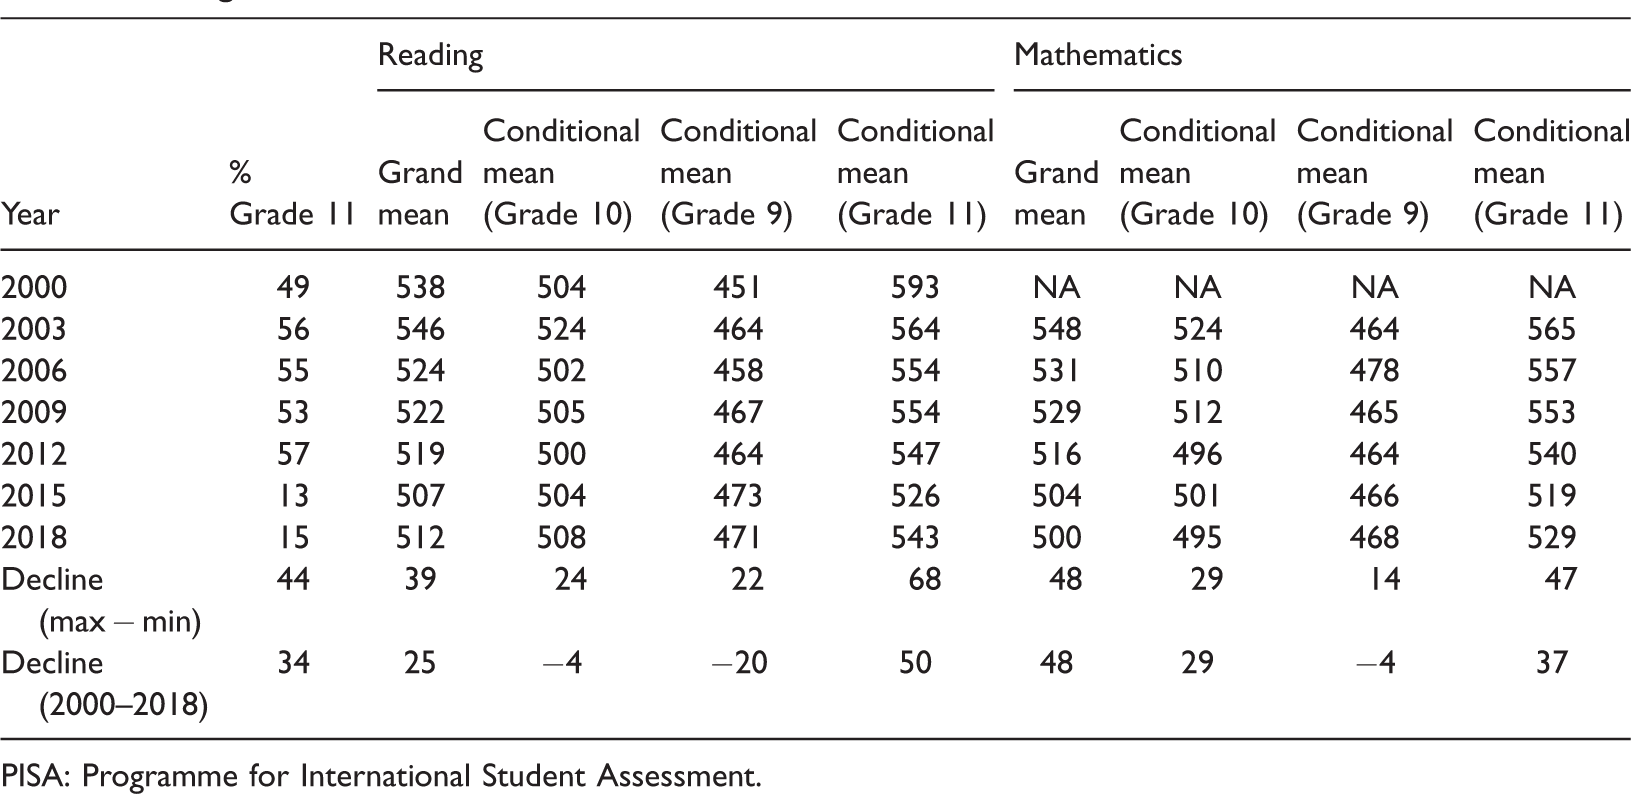
We also explored the correspondence between mean achievement and grade distribution in the two jurisdictions with the largest shifts in the distribution across grades: Queensland (Table 6) and Western Australia (Table 7). In Queensland, the percentage of 15-year-old students in Grade 11 dropped by 23 percentage points between 2000 and 2018, mostly between 2015 and 2018. Between PISA 2000 and PISA 2018 the average score for reading achievement in Queensland dropped by 18 scale points and the average score for mathematics declined by 30 scale points (between PISA 2003 and PISA 2018) (Table 6). However, the detail is more complex. Between PISA 2000 and PISA 2006 the percentage of 15-year-old students in Grade 11 increased from 38 to 52% but reading achievement declined and mathematics achievement remained unchanged. Between PISA 2006 and PISA 2015 the percentage of 15-year-old students in Year 11 was steady (between 52 and 46%) but reading achievement rose between PISA 2006 and PISA 2009 before falling between PISA 2009 and PISA 2015. After PISA 2015, there was substantial drop in the percentage of 15-year-old students in Grade 11 in Queensland, but average reading achievement did not change significantly. Over the period from PISA 2006 to PISA 2015 average mathematics achievement declined substantially and steadily by 33 scale points. Between PISA 2015 and PISA 2018 mathematics achievement did not change significantly. As with the patterns noted with the Australian averages, there is a strong trend for flatter trajectories in Grade 9 and Grade 10, and more significant declines in Grade 11.
In Western Australia, the percentage of 15-year-old students in Grade 11 dropped by 34 percentage points between 2000 and 2018, mostly between 2012 and 2015. Over the period from PISA 2000 to PISA 2012, reading achievement declined by 19 scale points even though the percentage of students in Grade 11 did not change substantially. Between PISA 2012 and PISA 2015 there was a sharp drop in the percentage of 15-year-old students in Grade 11 in Western Australia and a concomitant decline of 12 scale points in average reading achievement in this jurisdiction. After PISA 2015 reading achievement rose slightly in PISA 2018. Mathematics achievement followed a similar trend. There was a decline of 32 scale points over the period to PISA 2012 when there was little change in the percentage of 15-year-old students in Grade 11. Between PISA 2012 and PISA 2015, there was a decline of 12 scale points at the same time as there was a drop from 57 to 13 in the percentage of 15-year-old students in Grade 11. Between PISA 2015 and PISA 2018 there was no significant change in average mathematics achievement. As with the national data, there is a strong trend for flatter trajectories in Grade 9 and Grade 10, and more significant declines in Grade 11. As above, this suggests a complex story for the inputs into the aggregate decline above-and-beyond grade demographics.
Discussion
The first research question concerned whether the grade of 15-year-old students is related to PISA achievement in reading and mathematics after allowing for the effects of differences in student (age, gender), household (immigration status, socioeconomic status (ESCS)) and jurisdiction (state) variables. We concluded that the reading and mathematics achievements of 15-year-old students in Grade 11 were higher than those in Grade 10 and the achievements of 15-year-old students in Grade 10 were higher than those in Grade 9. The magnitude of these effects was similar to the magnitude of the effects of one standard deviation difference in the measure of socioeconomic background (ESCS).
Nationally, the differences in reading and mathematics achievement between Grade 11 and Grade 10 and between Grade 10 and Grade 9 were not significantly different. These effects on achievement that were associated with grade are net of any effects of a range of student characteristics previously found to be associated with achievement. We cannot be sure of the source of these differences among grades but it does seem worth pursuing whether they might be associated with factors such as teacher support and classroom climate which might be more positive in higher compared to lower grades. It might also be possible that students in higher compared to lower grades might experience richer more complex curricula that foster the types of skills measured by PISA. These remain possibilities for further investigation.
The second research question concerned whether the changes in PISA achievement in reading and mathematics were similar for Grades 9, 10 and 11. In both reading and mathematics, the decline in the conditional mean achievement of 15-year-olds in Grade 11 tended to be a little greater than the decline in the conditional mean achievement of 15-year-olds in Grade 10. The achievement of 15-year-olds in Grade 9 did not change appreciably. The greater decline in achievement for Grade 11 compared to Grade 10 contributes partly to the overall decline in PISA achievement in reading and mathematics, even though over time there is a smaller percentage of 15-year-olds in Grade 11. Importantly, these relative trends suggest that when exploring factors associated with the decline in achievement in PISA reading and mathematics it might be fruitful to examine Grade 11 curricula and teaching.
The third research question concerned the extent to which grade effects on achievement might have combined with shifts in the distributions of 15-year-olds students across grades to contribute to declines in average PISA scores in Australia. Overall, it appeared that shifts in age-grade distributions might have contributed to changes in PISA achievement scores over time. However, when the changes were examined in detail there were ambiguities in the timing of the changes. The changes in achievement did not always correspond to the times when there were shifts in the grade distributions of students. When focussing on the two jurisdictions that recorded the largest changes in achievement, the correspondence was stronger in Western Australia than in Australia as a whole and weaker in Queensland than Australia as a whole. That suggests that other factors such as curriculum changes and changes in approaches to teaching may have taken place around the time of changes in the grade distribution of students. Sometimes these changes may have been part of school reform initiatives. Our conclusion is that there is a great deal more to understand about grade effects on learning outcomes than we have been able to uncover.
The fourth research question concerned whether differences in the grade distributions of 15-year-old students in PISA contributed to differences in average achievement between jurisdictions. We conclude that this was the case in the period up to PISA 2015 when there were noticeable differences among jurisdictions in the age-grade distributions. Our analyses suggest that there were moderate effects of grade on achievement net of any effects of a range of student characteristics known to be associated with achievement. In exploring differences in achievement among jurisdictions over the period from 2000 to 2018, it was important to allow for the contribution of differences in age-grade distributions as well as differences in student characteristics. By PISA 2018 differences in age-grade distributions had largely disappeared (except for Tasmania), and in future analyses we expect that differences in age-grade distributions will not have a great influence on jurisdictional differences in PISA achievement. However, grade will remain an important element of student-level analyses of influences on PISA achievement and should be incorporated in models of achievement.
Future research
This study aimed to describe the contribution of the shifting grade-demography of 15-year-old students in Australia to the observed decline in PISA achievement since 2000. The analysis has demonstrated that, on average, Grade 11 students record higher achievements on the PISA domains, after controlling for age, gender, household socioeconomic status and immigration background. The fact that there are fewer students in Grade 11 (or higher) as the cycles of PISA progress implies that the higher proportion of (lower achieving) lower grade children has contributed to the mean decline in PISA achievement. This study, however, has also demonstrated that the story is more complex and warrants further exploration. For example, it is not possible with a series of cross-sectional multiple regressions to know with certainty if the implied trajectory is statistically significant. If, instead, each cycle of PISA was treated as an independent sample and the data were ‘stacked’ in long format, it would be possible to estimate (as either a fixed- or random-effect) a cycle effect under the expectation that the magnitude of the cycle effect would be minimised when grade is controlled for (e.g. under the expectation that the within-grade decline is lower than the between-grade change in proportions). This would allow for a statistical estimate and test of the magnitude of the influence of the changing composition. Further, there remains a negative slope in the grade-conditioned trend. There is potentially benefit in considering models that include other explanatory variables at the student, household, classroom and school level to explain this as it is without doubt an intriguing policy question. In addition, simulation studies could be undertaken to put plausible boundaries on the likely magnitude of the decline by generating data not influenced by other factors or by a limited set of factors.
Footnotes
Declaration of Conflicting Interests
The author(s) declared no potential conflicts of interest with respect to the research, authorship, and/or publication of this article.
Funding
The author(s) received no financial support for the research, authorship, and/or publication of this article.