
Abstract
Recently, several countries have attempted to encourage life-long learning and to widen university accessibility to include a wider mix of students. In Australia, numerous new pathways with the Vocational Education and Training sector have been established for these purposes. This study reports on the effects that two variables, gender and age, had on the university academic performance of students who had taken a Vocational Education and Training pathway to an Australian university using whole cohort data (n = 542) for Vocational Education and Training pathway students enrolled between 2005 and 2012; two-way between-group analyses of variance were conducted to assess the effects of both gender and age on undergraduate academic achievement. Age and gender were both related to students’ academic performance, with higher performance among female students and groups of older students. There were also differences in the effects that gender had on academic performance depending upon age group.
Keywords
Introduction
Understanding factors of performance is of vital interest to educational academics and administrators alike. This is particularly important at a time when university enrolments have been expanded to include a more diverse and inclusive group of students (Barber, Netherton, Bettles, & Moors-Mailei, 2015; Diamond & O’Brien-Malone, 2018). Additionally, in terms of its predictor role for other vital concepts such as self-efficacy (Bandura, 1997), subsequent academic attainment (Hoffman & Lowitzki, 2005) and academic persistence (Tinto, 1993), academic performance has consistently been considered a central factor to understanding overall academic success (Bean & Metzner, 1985; Cabrera, Castaneda, Nora, & Hengstler, 1992; DesJardins, Ahlburg, & McCall, 1999; Pascarella, Duby, & Iverson, 1983; van Rooij, Jansen, & van de Grift, 2018). Academic performance, itself, has been linked to perceived future success in various aspects of life, including occupational attainment (Kuncel & Hezlett, 2004). Performance at the university level has been reported to affect self-belief, allowing students to navigate through different pathways and facilitating access to post-educational opportunities (Dixon Rayle, Arredondo, & Robinson Kurpius, 2005).
This research centred on the effects of age and gender on the undergraduate academic performance of students that had entered an Australian university using a pathway designed to expand access to non-traditional students. With the increasing pressures on individuals to continually up-skill throughout their lives, a better understanding of how these two baseline variables interrelate adds to the debates concerning access and lifelong learning. This study took the opportunity to focus on students taking a university pathway established to deal with issues of inclusiveness, those entering on the basis of a completed Vocational Education and Training (VET) qualification between 2005 and 2012, that naturally included students of a wide variety of ages and that could, thus, more comprehensively assess the effects of age and gender. Concentrating on VET pathway students also allowed a more isolated assessment of the two independent variables, free of added influences that may have been involved had other traditional and non-traditional pathway students been included.
Gender and age as predictors of academic performance
Academic performance has been measured in a number of different ways. Often, this concept has been used as an independent variable that can lead to undergraduate student attrition in the first year of undergraduate studies (Lovat, 2017; Tinto, 1993; Yorke & Longden, 2004) and thus measured using performance markers in the first year of undergraduate enrolment. First-year undergraduate performance itself has been measured in a variety of ways, including a weighted average first-year measure (Diamond & O’Brien-Malone, 2018) and first-semester grade point average (GPA) scores (Lovat, 2017; McKenzie & Schweitzer, 2001).
There is a statistical advantage in using institutional GPA scores, when they are available, as these provide a scale of actual scores in comparison to a set of self-reported interval grades that may have been over or underestimated by the student. Additionally, as first-year attrition remains a stubbornly persistent issue for many university undergraduate students, especially for older students (Leppel, 2002) and for those achieving low first-year GPA scores (Lovat, 2017; Tinto, 1993), using a ‘first-available’ institutional measure for academic performance, in this case first-semester GPA, maximises the sample size and allows for a more valid set of assessments to be made.
Despite various theoretical underpinnings, the individual attributes of age and gender have persistently been at the forefront of academic performance investigations. While they may often be considered as having a minor effect (Jost, Rude-Parkins, & Githens, 2012; Peterson, 1993), Bean & Metzner (1985) describe them as vital background variables. Studies that have involved a more comprehensive set of predictors have tended to disregard such factors. Yet, these two variables are arguably the two most basic biological attributes for any individual. While one can argue that a multitude of factors need to be taken into account simultaneously, another view can also be expressed. When many factors are involved, some underlying trends may be difficult to ascertain, as contributing effects from a multitude of variables override subtle underlying influences. This is particularly the case when statistical techniques, such as stepwise multiple and logistic regression, are used which seek to highlight direct effects on any outcome variable. In any case, understanding how these two fundamental variables impact on first-year academic achievement, irrespective of other factors, can inform a better understanding of how a group of ‘non-traditional’ students, VET pathway entrants in this case, naturally perform. Notwithstanding important cross-gender considerations, these factors are also readily identifiable and easily measured.
Gender and the female advantage
Gender is of interest in regards to educational access, with females often being the subject of discrimination. Theorists have identified that there are different pressures on the different genders in educational contexts. Tinto (1993, p. 77), for example, recognised that females were much more likely to face external social pressures constraining educational involvement. Generally, however, females have been found to perform better academically than males at the university (Buchmann & DiPrete, 2006; Craft, 2019; McKenzie & Schweitzer, 2001; Sheard, 2009). Even in fields of study traditionally biased towards males, French, Immekus and Oakes (2005), for example, found that females statistically outperformed males, as measured by their cumulative GPA scores, in engineering subjects in two cohorts at a large US university. The relative female advantage seen in the majority of studies has been investigated. Buchmann and DiPrete (2006) have concluded that the female dominance in academic performance was a relatively recent occurrence, which could be partly explained by the advent of gender equality initiatives introduced by governments and universities.
Age group as a defining variable for non-traditional students
With the reported enrolment growth among older students in the last 30 years in a number of English-speaking countries (Bean & Metzner, 1985; Craft, 2019; Justice & Dornan, 2001; McKenzie & Schweitzer, 2001; Sheard, 2009), much attention has been placed on the potential contributing effect of student age on performance. Age has been identified as one of the ‘major defining variables’ of non-traditional students and one that should ultimately always be controlled for (Bean & Metzner, 1985). Researchers (Craft, 2019; Hoskins, Newstead, & Dennis, 1997; Leppel, 2002) have found that mature-aged students gain higher grades than younger ones. Such tendencies seem, however, to be inconsistent, with others reporting either no significant differences or opposite findings (Clark & Ramsay, 1990; McKenzie & Schweitzer, 2001). One British study (Hoskins et al., 1997) combined age and gender attributes, similar to this current study, and found that mature-aged females were the best performers, thus suggesting some interaction between these two variables.
Students on VET pathways to university
VET pathways to university have been supported in Australian universities in order to help widen participation through federal funds such as the Higher Education Participation and Partnerships Program and in response to the comprehensive 2008 review of the Australian higher education system (Bradley et al., 2008). The rationale behind the idea that the VET entry pathways allowed greater access to a wider set of the Australian society came from previous analyses of the Australian VET sector. Researchers argued that the VET sector colleges were more successful in attracting disadvantaged and low SES school leavers (Curtis, 2008; James, 2002), and those coming from non-urban, regional areas of Australia (Foley, 2007).
Typically, if school leavers chose to take up an apprenticeship through a VET college, they would leave secondary school at an earlier age level than a student wishing to go on to university (Curtis, 2008). Thus, in the past, and for many of the participants in the current study, VET students and even VET graduates may not have obtained the secondary school Year 12 prerequisite qualification traditionally used for university entry (James et al., 2008). While students taking these VET pathways to university may have often lacked secondary school academic performance markers, they have also formed a more diverse entrance group, particularly in terms of age (Diamond & O’Brien-Malone, 2018).
Due to the vocational nature of courses offered, VET colleges in Australia attract students of a wider age group. An individual may undertake a VET course at any age and may often do so to upgrade vocational skills after an extended period in the workforce. The cumulative nature of VET qualification levels in Australia also allows students to stagger their VET studies and gradually build progressively higher-level VET qualifications by undertaking several courses of study separated by periods away from any formal education. As such, VET pathway university entrants may have a very wide range of ages.
Rationale for study
Federal funds such as the Higher Education Participation and Partnerships Program have been made available to Australian universities to expand their access to include disadvantaged students. This push to educate a wider section of the Australian community has meant that more and more females and mature-aged students have been participating in higher educational studies (Barber et al., 2015; Bradley et al., 2008; McKenzie & Schweitzer, 2001; Sheard, 2009). Many such Australian students have taken advantage of educational pathways that have been put in place between the vocational education and university sectors (Commonwealth of Australia, 2009; Curtis, 2007; Diamond & O’Brien-Malone, 2018; Lomax-Smith, Watson, & Webster, 2011, p. 123). This study, being part of a larger investigation of factors of attrition for VET pathway students, looked at these variables in the context of an Australian university.
The research question addressed was:
Are age group and gender associated with the undergraduate academic performance of non-traditional students that have been accepted at an Australian university on the basis of a VET qualification?
Method
Sample student population
This study used secondary university data gathered from the total population of 542 domestic students that had entered an Australian university (between 2005 and 2012) on the basis of a completed VET qualification. Students had entered a wide variety of both single- and double-degree undergraduate programs. These students ranged between 18 and 77 years of age. At the time, the university had a student population of around 25,000 students, around 5000 of which were first-year enrolments. The majority of its students were school leavers of traditional age (18–21 years). There were also a large number of international students mainly deriving from the Asian continent. The focus group of VET entrants were a minority group within this middle-sized university making up only an average of 68 entrants or around 1.4% of the yearly enrolment during the period of study.
Variables of interest – age, gender and academic performance
Age and gender, the two independent variables in this study, were routinely identified by the educational institution during the study period. This present study made use of data that had been gathered for a doctoral research project (Lovat, 2017), which then surveyed the VET pathway student population in order to assess motivational factors of first-year retention among a subset of these pathway students.
Students’ ages, gender and academic performance were retrieved from the university data warehouse records. Students’ gender was retrieved and coded, 0 for females and 1 for males. In total, 286 of the 542 students were males and 256 were females. Academic performance was measured as each student’s GPA, a numerical scale ranging from a minimum of 0 to a maximum of 7, accumulated in their first semester of study. The age of each of the 542 students was taken from their birth date recorded in the data warehouse and calculated as their age as of the first of January in the year of their first enrolment. The students were then grouped according to their ages.
Two age groupings were used in two separate analyses. The first age grouping consisted of four categories: 18–21, 22–23, 24–25 and >26 years. The boundaries between the age categories were demarcated along lines commonly used in similar educational studies (Bean & Metzner, 1985; Craft, 2019; Grimes & Antworth, 1996; Grosset, 1991; Hoskins et al., 1997; Justice & Dornan, 2001; Sheard, 2009; Sorey & Duggan, 2008).
For the second, more refined, analysis, the age grouping consisted of seven categories: 18–21, 22–23, 24–25, 26–34, 35–44, 45–54 and >55 years. In this second, more detailed, analysis, the largest of the age categories adopted in the first analysis, the 26+ years of age category, was split into four categories, based roughly on 10-year intervals. These additional categories allowed useful comparisons to be made with the results obtained from the Organisation for Economic Co-operation and Development’s Survey of Adult Skills (PIAAC) undertaken at a similar time to this study in 2011–2012 (OECD, 2013). Following the concept that age and gender are baseline biological variables, the last boundary, at 54–55 years of age, was also based on the notion that it is around this age when an individual student’s brain is at their literacy peak. Neurological studies have shown that brain development directly linked to literacy skill formation peaked in the mid-50 age group (Ravid & Tolchinsky, 2002; Sowell et al., 2003). Farsides and Woodfield (2003) have also shown that verbal intelligence was positively associated with undergraduate academic success. The highest academic achievements could, therefore, be expected when an individual’s literacy skills are at their highest.
To simultaneously assess the associations with academic performance, the dependent variable, and age group and gender, two separate two-way analyses of variance (ANOVA) were performed, one for the four-category age grouping, and another for the seven-category age grouping. Each analysis assessed two main effects, one for age group and one for gender, and the possibility of an interaction effect, that is the effect of age group on performance, depends on whether the student is male or female.
Results
Four age groups versus gender effects on academic performance
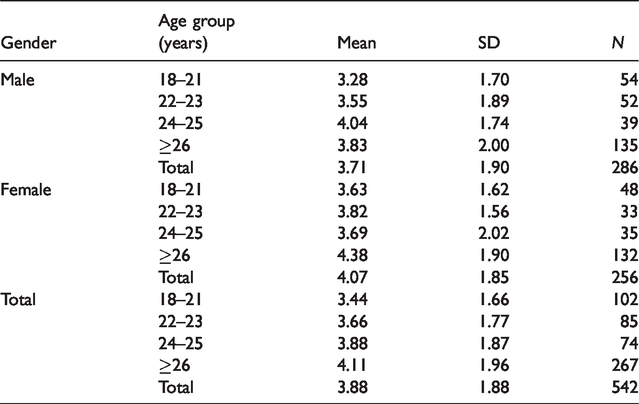
The first ‘two-way between-group ANOVA’ was conducted to explore the impact of gender and age on academic performance, as measured by GPA during the first semester of study. Participants in this first analysis were divided into four groups according to their age (Group 1: 18–21 years, N = 102; Group 2: 22–23 years, N = 85; Group 3: 24–25 years, N = 74 and Group 4: >26 years, N = 267). The results are presented in Tables 1 and 2. For this first analysis, the interaction effect between gender and (4) age group was not statistically significant, F (3, 532) = 1.14, P = 0.33. There was a statistically significant main effect for (4) age group, F (3, 532) = 3.45, P = 0.02; however, the effect size was small (partial eta squared = 0.02). Overall R2 for the corrected model was 0.03, indicating that 3% of the variation was explained by the four-age-group model. Post-hoc comparisons using the Tukey’s HSD test indicated that the mean GPA score for the 18–21 age group (M = 3.44, SD = 1.66) was significantly different from the 26+ age group (M = 4.11, SD = 1.96). The 22–23 age group (M = 3.66, SD = 1.77) and the 24–25 age group (M = 3.88, SD = 1.87) did not differ significantly from the other groups. The main effect for gender, F (1, 532) = 1.25, P = 0.26, did not reach statistical significance. A plot of the four-age-group GPA means for male and female students is shown in Figure 1.
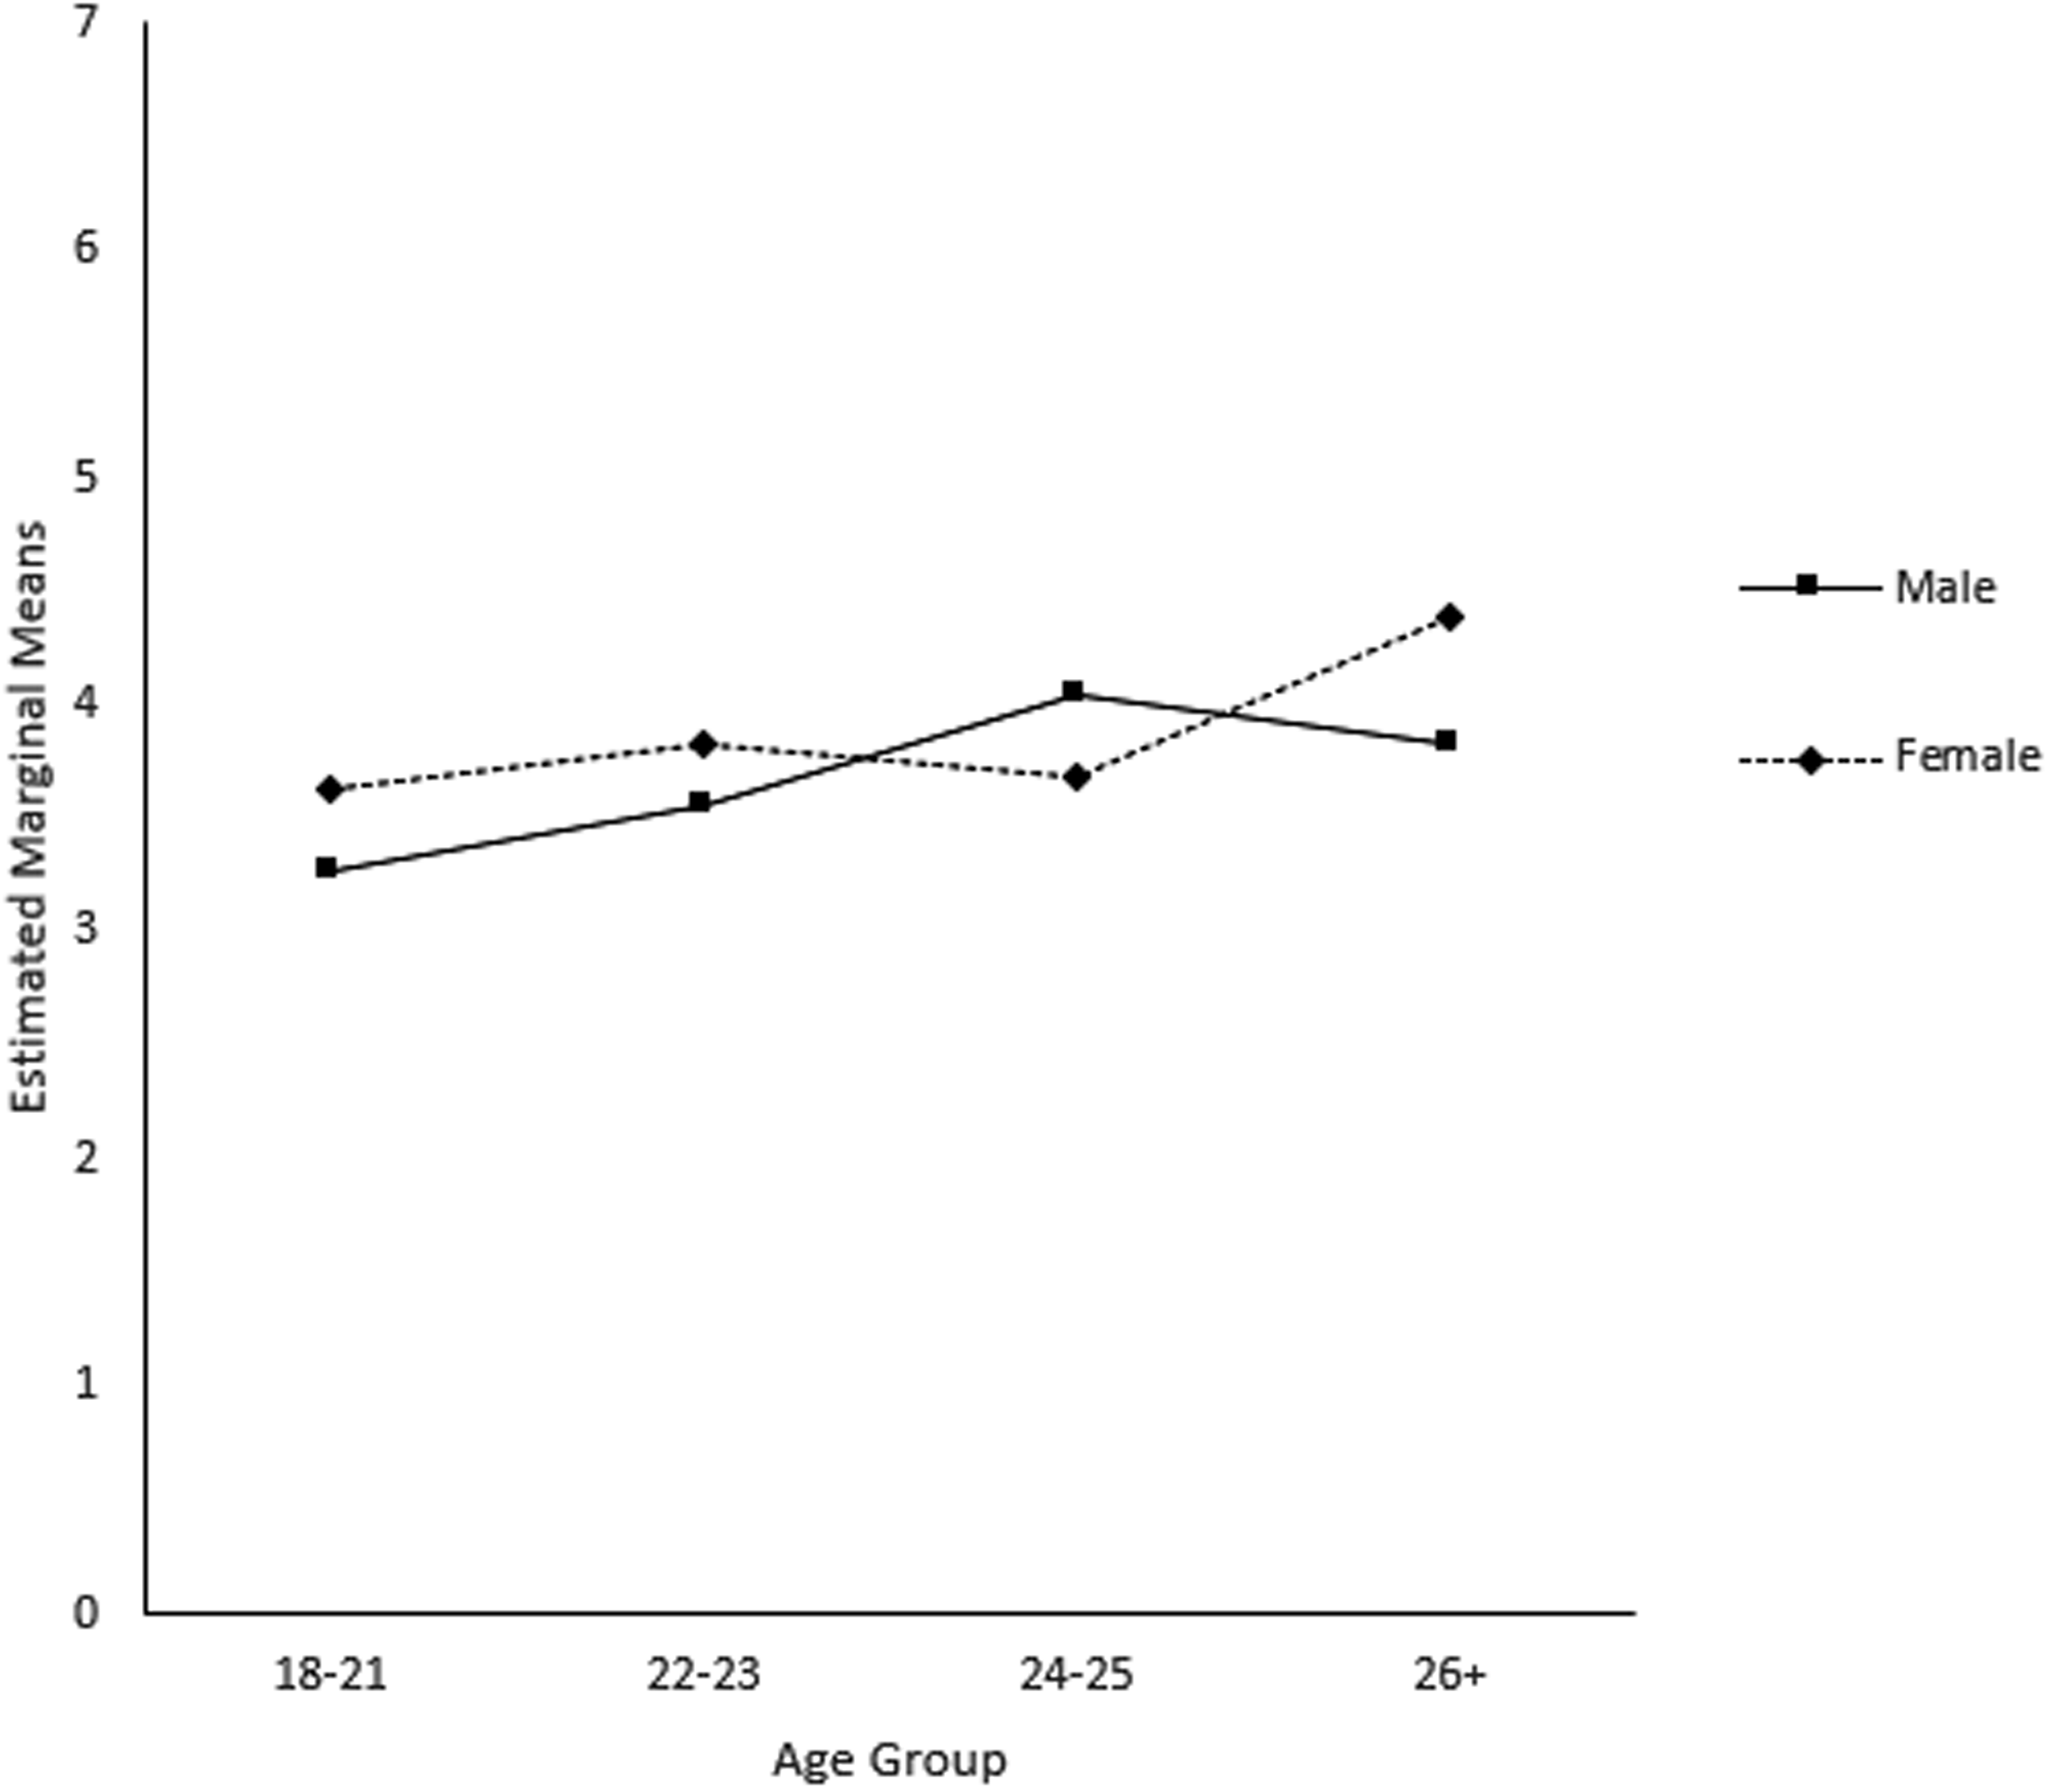
Estimated marginal grade point average means for the four age groups separated by gender.
Descriptive statistics by gender and age (four groups).
Two-way analysis of variance results: gender and age (four groups).
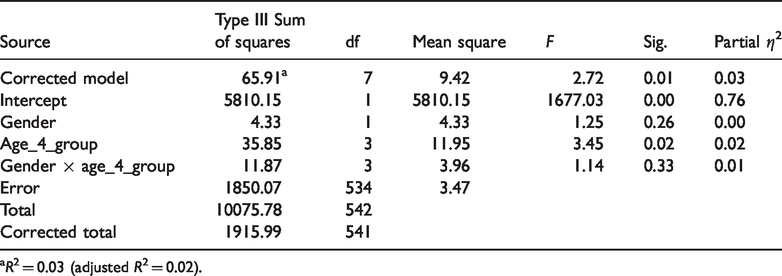
aR2 = 0.03 (adjusted R2 = 0.02).
Seven age groups versus gender effects on academic performance
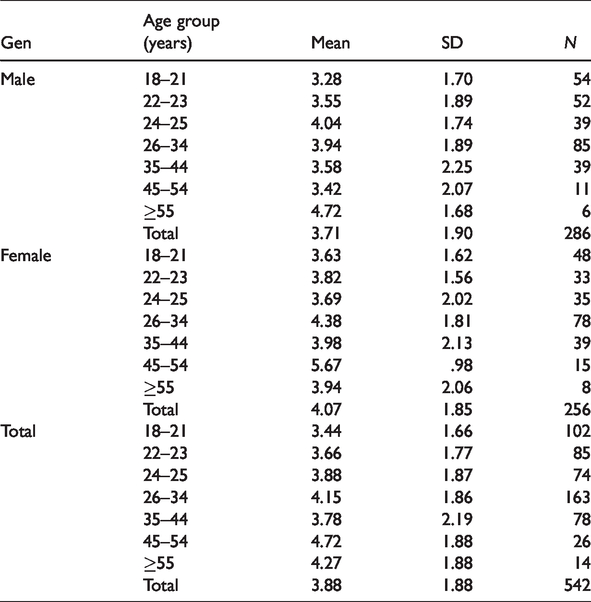
The second ‘two-way between-groups ANOVA’ was conducted to further explore the impact of gender and age on academic performance, as measured by GPA during the first semester of study. Participants in this second analysis were divided into seven groups according to their age (Group 1: 18–21 years, N = 102; Group 2: 22–23 years, N = 85; Group 3: 24–25 years, N = 74; Group 4: 26–34 years, N = 163; Group 5: 35–44 years, N = 78, Group 6: 45–54 years, N = 26 and Group 7: 55 years and above, N = 14). The results are presented in Tables 3 and 4. For this second analysis, there was a statistically significant main effect for (7) age group, F (6, 532) = 2.37, P = 0.03. The main effect for gender, F (6, 532) = 2.94, P = 0.09, did not reach statistical significance at the 5% level. Similarly, the interaction effect between gender and (7) age group was not statistically significant at the 5% level, F (6, 532) = 1.80, P = 0.10. Once again the effect sizes were small (partial η2 = 0.03, 0.01 and 0.02 for age, gender and the interaction of gender and age, respectively).
Overall R2 for the corrected model was 0.06, indicating that 6% of the variation was explained by the seven-age-group model. Post-hoc comparisons using the Tukey’s HSD test indicated that the mean GPA score for the 18–21 age group (M = 3.44, SD = 1.66) was significantly different from the 26–34 age group (M = 4.15 SD = 1.86) and from the 45–54 age group (M = 4.72 SD = 1.88). The 22–23 age group (M = 3.66, SD = 1.77), 24–25 age group (M = 3.88, SD = 1.87), the 35–44 age group (M = 3.78 SD = 2.19) and the 55+ age group (M = 4.27, SD = 1.88) did not differ significantly from the other age groups with the 22–23, 24–25 and 35–44 age groups having values similar to other groups and the 55+ group having a small sample size (N = 14). A plot of the seven-age-group GPA means for the two genders is shown in Figure 2.
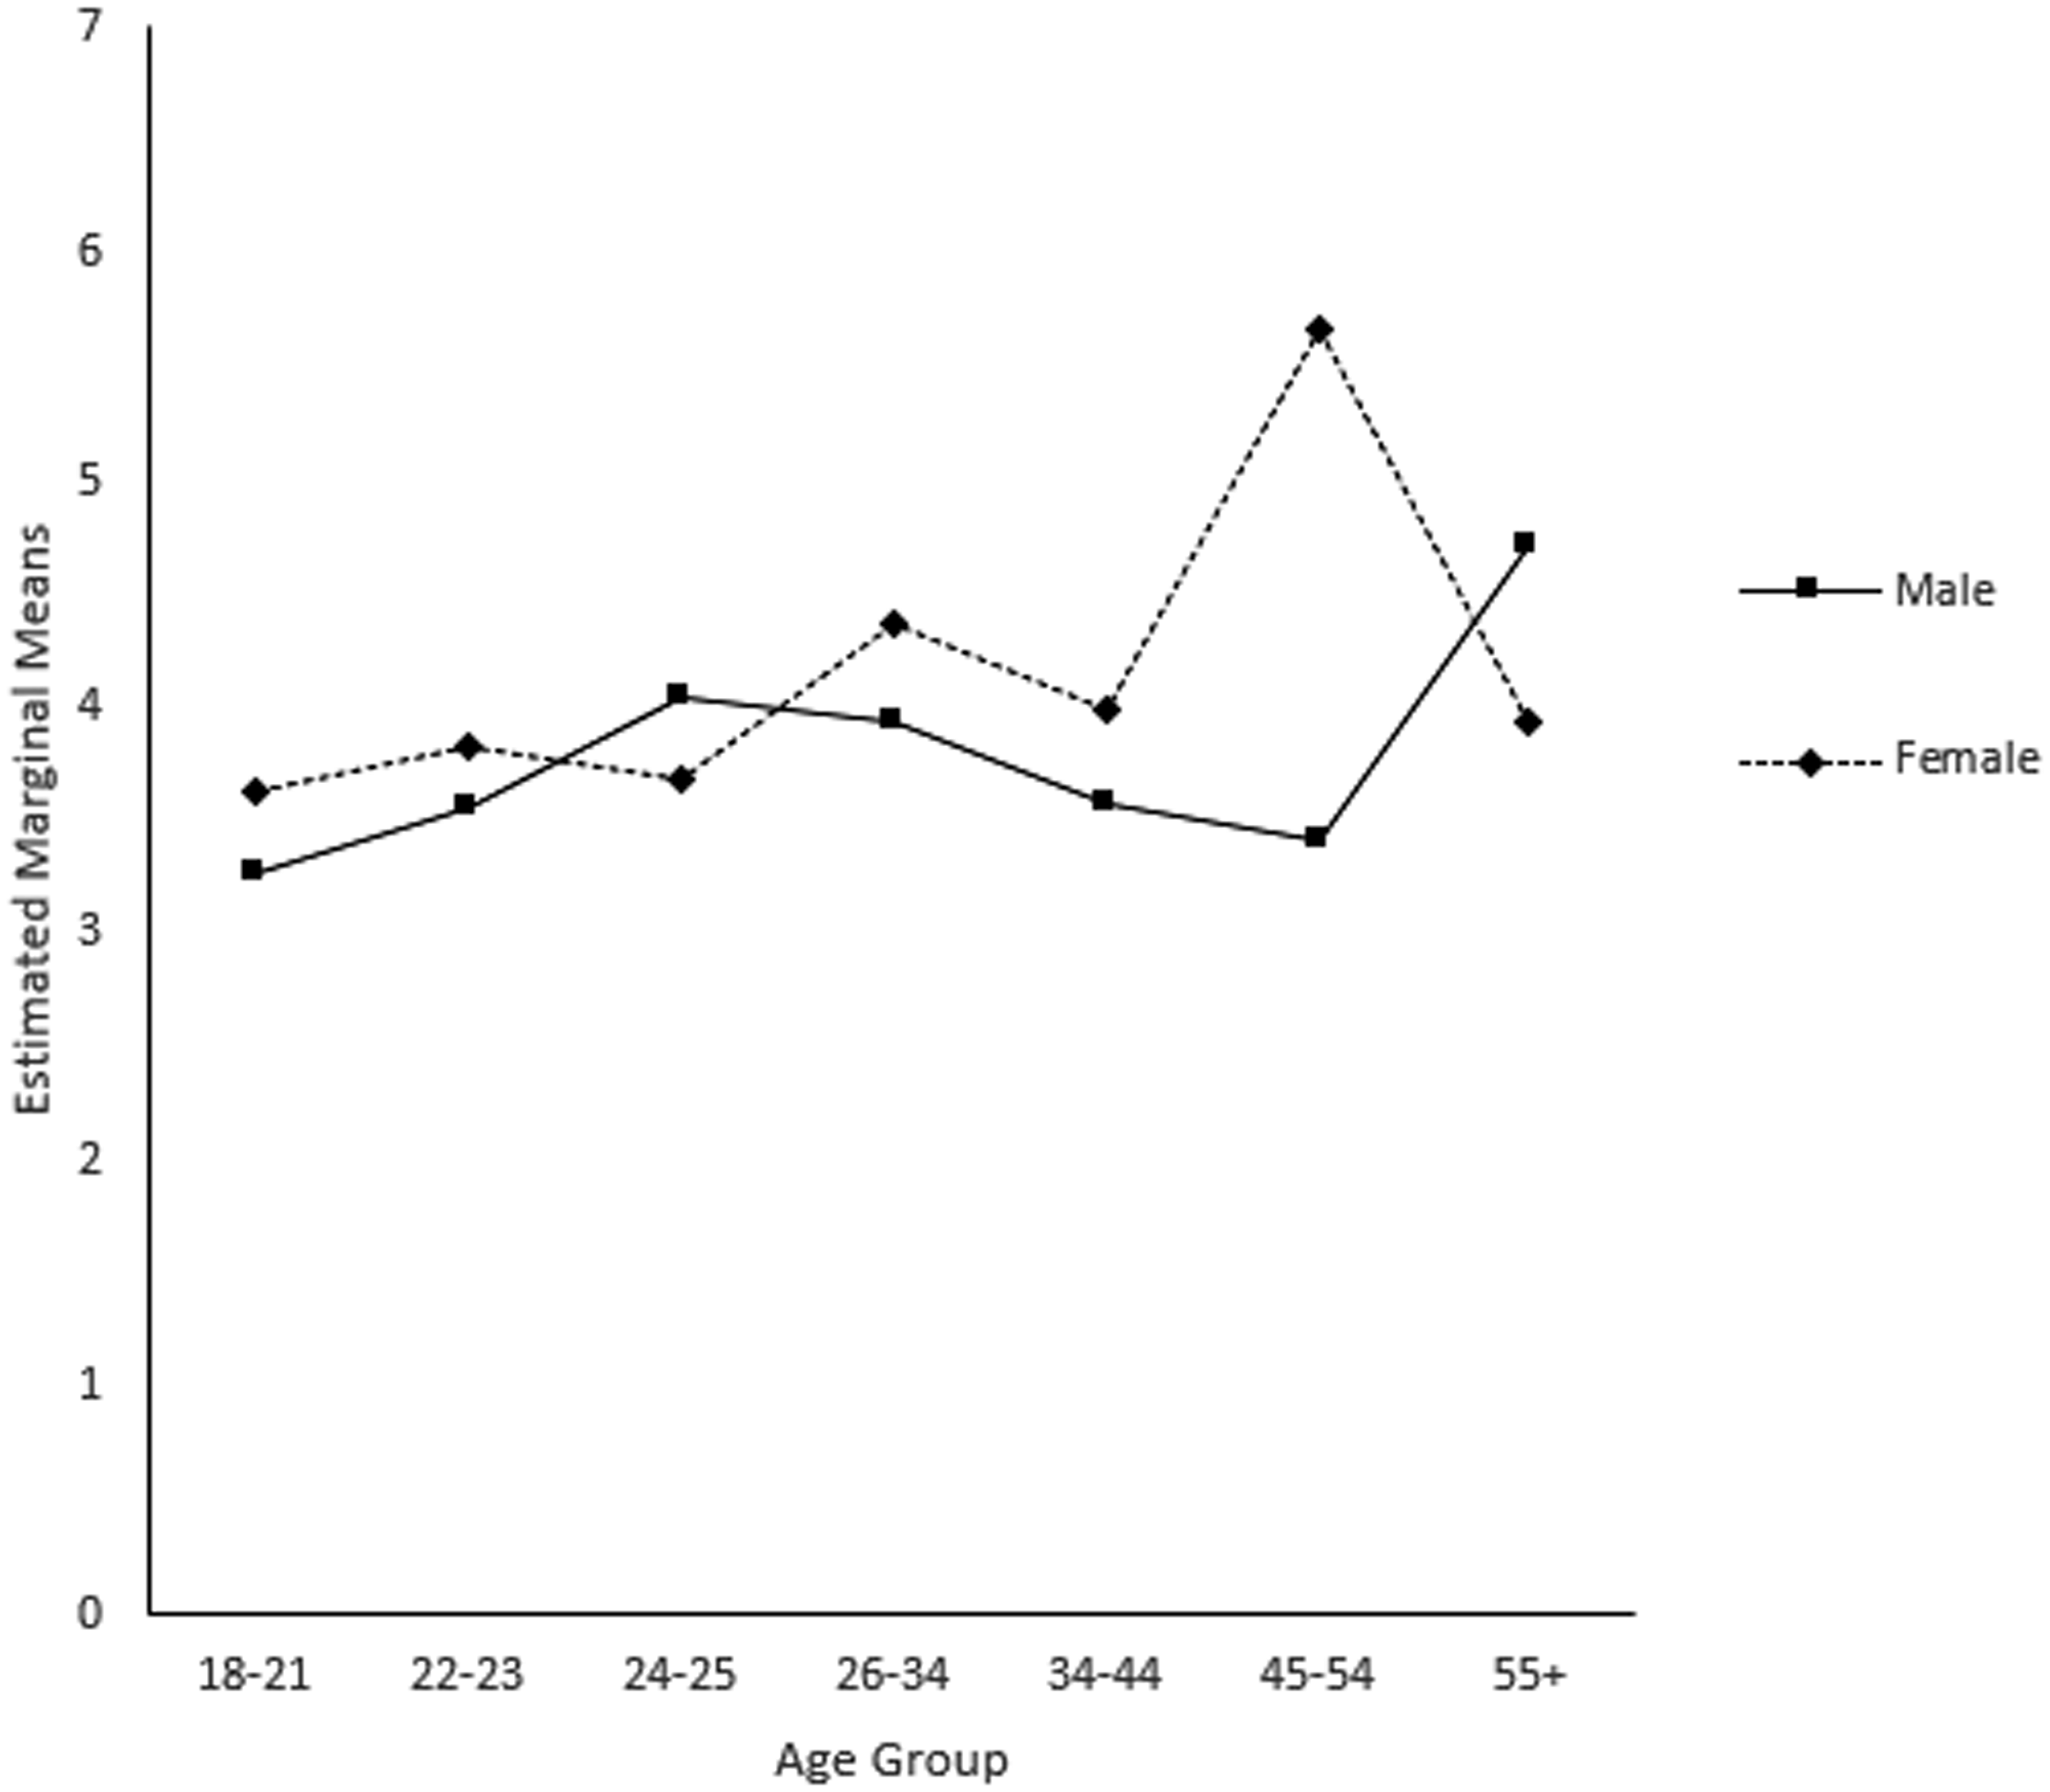
Estimated marginal grade point average means for the seven age groups separated by gender.
Discussion
Significance of the study
First-semester academic performance is a vital measure for any undergraduate student, including one who has entered using a VET pathway. Apart from its use as a measure of academic success, it may affect a student’s confidence and academic self-efficacy (Chemers, Hu, & Garcia, 2001; Dixon Rayle et al., 2005). It also may have an influence on future academic achievement (Hoskins et al., 1997; McKenzie & Gow, 2004; McKenzie & Schweitzer, 2001) and can be seen to be a major predictor of a student’s persistence within an academic institution (Tinto, 1993). The cohort studied in this instance, that is students entering an Australian university on the basis of a completed VET qualification, was of particular interest in terms of age and gender. The gender ratios for this cohort, 286 males to 256 females, were almost identical when compared to the overall numbers for all domestic students at the university during the study period between 2005 and 2012, i.e. female-to-male ratio was around 9:10 for both the study group and the overall gender ratio for the university. With reference to age, the VET entrant cohort had a wide range, 18–77, thus allowing for a comparison to be made of this type which compared performance across the different age groups of students that were all entering using a VET pathway
General trends for gender and age group
Comparisons between groups of younger and mature-aged students may differ depending upon where demarcation lines are decided upon. Two different age groupings of female and male VET pathway students are plotted against academic performance in Figures 1 and 2. The groupings in the first analysis follow demarcations employed in past educational studies which focus on the 18–25 age group and combine all mature students above this age into a single group. In the second analysis, this age group is further refined into four separate groups to gain a better understanding of the situation. Older VET pathway students appeared to outperform younger students. First-semester performances were an average of around 3.5 for the younger groups and above 4.0 for the older groups. This can best be seen in Figure 1, by the general trend upwards for both males and females, and as evidenced by the significant effect of age group on first-semester GPA recorded in both analyses. This age trend of higher performance at university with increasing age has consistently been reported (Hoskins et al., 1997; Justice & Dornan, 2001; Sheard, 2009).
Gender differences within this cohort are more difficult to interpret. Of particular interest is the female advantage seen in the traditional age group of 18–21, both in this investigation and in other studies. Females were, until recently, discouraged and disadvantaged when entering higher educational studies with unsurprisingly deleterious effects on their academic performances (Buchmann & DiPrete, 2006; Dixon Rayle et al., 2005; Leppel, 2002). Even though the main effect of gender and the interaction effect between gender and age group is not significant at either the 5% or 10% levels in the four-age-group analysis, the gender and age interaction can be considered significant at the 10% level in the seven-age-group analysis. These results at the 10% level indicate that females outperformed males not only in the younger 18–21 and 21–22 age groups but also when this VET entrant cohort is taken as a whole. However, across the older age groups, the female advantage was not as consistent. Males outperformed females in the 24 to 25 age group and in the 55+ group as shown in Figures 1 and 2.
In terms of gender, females are often reported as outperforming males (French et al., 2005; Hoskins et al., 1997; Sheard, 2009). Other studies have shown no significant differences between the sexes (McKenzie & Schweitzer, 2001). The findings from this study may help explain some of these inconsistent results. When entering university at a ‘traditional’ school leaver age of 18–21, females tend to outperform males. Studies have shown that non-cognitive, maturity factors rather than cognitive factors appear to explain gender differences in attainment and higher education entry for the traditional ‘teen’ entry group (Calvin, Fernandes, Smith, Visscher, & Deary, 2010; Jacob, 2002). This early maturity among female students may partly explain why they enter university with better high school achievements and continue to outperform males in the traditional younger age groups (Cho, 2007). However, as mentioned earlier, this initial advantage wanes as students reach their mid-20s and high school performance becomes less predictive for these older students, who, in turn, generally outperform younger students (Diamond & O’Brien-Malone, 2018; McKenzie & Schweitzer, 2001).
This study confirms the following effects. Within this ‘non-traditional’ VET entry group, females outperformed males in terms of GPA in the younger age groups of 18–21 and 22–23. This could partly be explained by females’ advantage in non-cognitive skills at these younger age groups. As males’ non-cognitive skills mature, their academic performance improves, as was noted in the 24- to 25-year age group. In general, all VET entrant students’ performance increased in line with their age group.
Comparisons to the general population
The results in the seven-age-group analysis allows a view of the effect of a range of age groups that can be compared to the results obtained from the OECD’s Survey of Adult Skills that assessed literacy, as well as numeracy and problem-solving skills, among the general populations of participating OECD countries (OECD, 2013). PIAAC was undertaken in Australia by a sample of 7430 respondents in 2011 and 2012, at a time which matched closely to the time when many of the participants in this current investigation were undertaking their first year of university studies and obtaining a first-semester GPA score.
The results shown in Figure 2 and Table 3 reflect a relatively higher first-semester GPA score (M = 4.15) obtained by the 26–34 age group of VET entrants that can be viewed as a minor peak in performance for this cohort. The peak in performance can be seen for the similar 25–34 age group in the OECD results. Literacy levels were found to peak at this 25–34 age group among the samples of the general populations of most of the OECD countries (excluding Australia) which undertook the PIAAC survey. Considering the large sample sizes involved with the OECD study, these results may indicate that it is at this mid-life age range when individuals peak in terms of potential academic performance.
Descriptive statistics by gender and age (seven groups).
Two-way analysis of variance results: gender and age (seven groups).
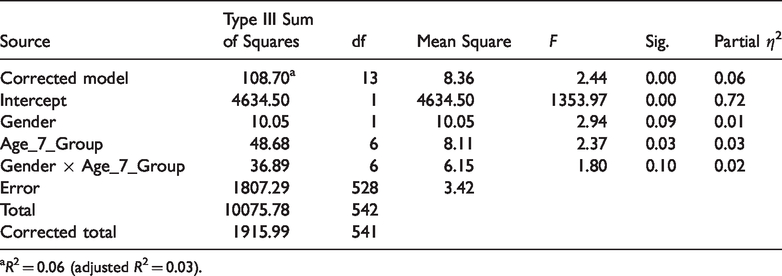
R2 = 0.06 (adjusted R2 = 0.03).
However, there are some stark differences in the results of the PIAAC survey and this investigation. In terms of age, in this current study, the lowest mean first semester GPA scores belong to the youngest 18–21 age group for the group as a whole (M = 3.44), as well as for both male (M = 3.28) and female (M = 3.63) VET entrants. In contrast, the OECD results show the lowest literacy scores at the opposite end belonging to the oldest 55+ age group of the general population throughout the OECD countries, including Australia. Conversely, in this current study, the highest performances are associated with the older age groups, within the 45–54 age group as a whole (M = 4.72) and for males, in particular, within the 55+ age group of VET entrants (M = 4.72). The results of the current study, thus, appear to support the neurological findings that literacy skill linked brain development peaks in the mid-50 age groups (Ravid & Tolchinsky, 2002; Sowell et al., 2003). As noted earlier, this age effect result was also reflected by the significant positive effect on first-semester GPA from the different age groups. It must be noted that the 55+ age group in this current study had a small sample size.
Another noteworthy difference between the OECD results and those from this investigation are the gender associations. In the OECD examinations, males outperformed females in literacy (and numeracy) achievements as assessed by the PIAAC literacy-based test. This gender effect was the opposite result to the current study, where, in general, female VET entrants outperformed male VET entrants, at the 10% level as shown in the seven-group analysis. This female advantage in undergraduate academic performances has also been noticed in other investigations focusing on undergraduate student academic performance (Buchmann & DiPrete, 2006; Sheard, 2009).
These seemingly contrasting results are not altogether unexpected. As this current study reports, the gender and age group effects only account for a minor (3% to 6%), yet significant, portion of the variance in the first semester GPA results for the students involved in the study. The OECD results, which show variance across the OECD countries and within each country’s demographic groups, attest to (literacy) performance, being influenced by a myriad of other potential factors. Indeed, it could be argued that the male dominance shown in the PIAAC survey results across the OECD countries can be partly explained by the lack of the kind of gender equality initiatives that have recently redressed the gender balance in university undergraduate academic performance results in countries such as Australia.
Limitations of the study
This study focused solely on students that entered an Australian university on the basis of a completed VET qualification. This cohort could be seen as a minority group within the overall student population at this university. Making inferences may thus be restricted to similar cohorts within other contexts. The method of analysis was two-way ANOVA, which measures and compares groups using calculations based on variance and assesses possible direct main effects of the two variables tested as well as any possible interaction effects. The forming of age groupings for the purposes of this study was made along the lines of previous educational studies and to make comparisons with a large-scale general population investigation held at around the same that this investigation took place. The accuracy of these demarcations and whether they reflect actual stages of neurological, sociological or some other physiological development could be debated. We have attempted to add one more demarcation on neurological grounds. In general, age could also be considered as a continuous variable devoid of meaningful demarcation points. Any groupings made may thus also be seen as simplifying some of the variability. An alternative method of comparison may be to employ path analysis methodologies where variables are not necessarily grouped and can also be viewed in terms of their mediating effects on the outcome. Our analyses also considered only two factors on one dependent outcome variable, that being academic performance as measured by first-semester GPAs. Overall, only around 3%–6% of the total variance for this outcome was statistically explained by the two factors tested, i.e. gender and age group. If a more comprehensive set of factors were to be measured, a more complete picture could be obtained. Nevertheless, a significant direct effect of age group at the 5% level was detected in both analyses. The direct effect of gender on academic performance was only detected at the 10% level in the more refined group analysis, for this cohort of university students, a group where, because of its range, such an effect could be better assessed. Similar results were also detected for the interaction effect of gender and age group on academic performance.
Footnotes
Declaration of Conflicting Interests
The author(s) declared no potential conflicts of interest with respect to the research, authorship, and/or publication of this article.
Funding
The author(s) received no financial support for the research, authorship, and/or publication of this article.