
Abstract
Although the teaching of children’s oral language is critical to both their social development and academic success, the assessment of oral language development poses many challenges for classroom teachers. The aim of the study is to develop an approach that: (i) enables teachers to assess oral language in a reliable, valid and comparable manner and (ii) provides information to support targeted teaching of oral language. The first stage of the study applies the method of pairwise comparisons to place exemplars on a scale where locations represent the quality of oral performances. The second stage involves teachers assessing oral narrative performances against the exemplars in conjunction with performance descriptors. The findings indicate that the method provides a valid and reliable way for classroom teachers to assess oral language of students aged approximately four to nine years. The assessment provides teachers with information about students’ oral story-telling ability along with information about the skills that students need to learn next.
Keywords
Although the teaching of children’s oral language is critical to both their social development and academic success (Munro, 2011), the assessment of oral language development poses many challenges for classroom teachers including devising valid assessment tasks; the collection, transcription and analysis of oral performances and the reliable assessment of these performances (Justice, Bowles, Pence, & Gosse, 2010). It is particularly difficult for schools to collect the type of data needed to evaluate their oral language teaching programmes and thus meet their accountability obligations.
The present study is motivated by the challenge of developing a robust assessment of oral language that is accessible to classroom teachers. The aim is to develop an approach that: (i) enables teachers to assess oral language in a reliable and comparable manner and (ii) provides empirically derived information to support the targeted teaching of oral language. The study focuses on the assessment of oral story-telling. It builds on previous research (Heldsinger & Humphry, 2010, 2013) in which an innovative two-stage approach to assessment was employed to assess writing in the early years.
The first stage of the two-stage approach requires teachers to compare a reasonably large number of performances which, in this study, is oral story-telling. For each comparison, teachers – acting as judges look at two performances and select the performance that represents more advanced ability in terms of the construct being assessed. The analysis of their judgements facilitates the calibration of the scale. Performance descriptors and teaching points are developed from a qualitative analysis of the scaled performances, and a subset of performances is carefully selected to be used as exemplars. The second stage involves classroom teachers assessing their own students’ oral narrative performances by comparing their students’ performances to the calibrated exemplars and the performance descriptors.
Background
Analysis of oral narrative language
Approaches used to assess students’ oral language typically involve transcribing and coding students’ language. Although such approaches have been well researched and provide reliable data on students’ oral language skills, they are not particularly feasible for classroom teachers because they are time consuming. It is also often difficult for teachers to interpret the results to inform their teaching.
Assessment of children’s oral language skills using narrative tasks has frequently been used to assess oral language competence (Cowley & Glasgow, 1994; Curenton, Craig, & Flanigan, 2008; Gillam & Gillam, 2009; Hayward & Schneider, 2000; Justice et al., 2006; Pena et al., 2006; Riley & Burrell, 2007; Scott & Windsor, 2000; Westerveld & Gillon, 2008). Unlike single-word vocabulary measures, oral narratives provide the means for the educator to observe children’s ability to use language at the discourse level within a developmentally appropriate and naturalistic context. Two aspects of oral narrative performance, macrostructure and microstructure, are commonly used to examine children’s oral narrative abilities. The macrostructure of a narrative describes the structural organisation of the narrative and inclusion of story grammar elements. There are multiple clauses in a narrative and to create coherence children must temporally and causally organise a narrative into a sequence in an interrelated and meaningful way. The microstructure of a narrative is the internal linguistic structure of the text and includes vocabulary, syntax and the use of cohesive devices (Hayward & Schneider, 2000; Hudson & Shapiro, 1991; Labov & Waletzkyl, 1967).
The assessment of the linguistic cohesion and grammatical complexity of an oral narrative is useful in documenting children’s productive vocabulary and grammar (Gillam & Gillam, 2009; Justice, Bowles, Pence, & Gosse, 2010; Justice et al., 2006; Scott & Windsor, 2000; Westerveld & Gillon, 2008). Measures of productivity, lexical diversity and grammatical complexity of children’s oral narratives, as well as total number of coordinating clauses and total number of subordinating clauses, are provided by the General Language Performance Measures (Scott & Windsor, 2000) and the Index of Narrative Microstructure (Justice et al., 2006). Use of literate language features (conjunctions, mental and linguistic verbs, adverbs and elaborated noun phrases) is also assessed. The Tracking Narrative Language Progress instrument (Gillam & Gillam, 2009), designed to monitor growth in oral narrative skills, applies a criterion-referenced narrative scoring system to hand-coded transcribed oral narrative samples to assess macrostructural and microstructural aspects of school aged children’s oral narratives (including rating the complexity of story grammar elements and the use of literate language features) and to monitor oral narrative growth over the course of a pedagogical intervention (Dalton, 2011; Nelson, Hancock, Nielsen, & Turnbow, 2011). Similarly, the Narrative Assessment Protocol (NAP) (Justice et al., 2010) is designed to measure and monitor preschool children’s use of semantic and syntactic linguistic forms while retelling a story. Notably, the NAP does not require transcription of the oral narrative. Instead, the narrative is coded while listening to a child produce a spoken narrative, typically from a video recording, but possibly in real time.
Motivated in part by the challenges involved for classroom teachers in using such approaches, the present study focuses on a distinctly different approach in which a set of exemplars with empirically derived descriptors form the basis for: (a) assessing student work; (b) obtaining diagnostic information and (c) guiding teaching. The assessment process incorporates descriptors like those in holistic rubrics but places equally significant emphasis on exemplification.
Teacher judgement and pairwise comparisons
Background to the use of the method of pairwise comparisons in education and other fields is provided by Bramley, Bell and Pollitt (1998), Bond and Fox (2001) and Heldsinger and Humphry (2010). The method is based on the approach developed by Thurstone (1927) who demonstrated that it was possible to scale a collection of stimuli based on comparisons between stimuli in pairs.
Recent studies have drawn on Thurstone’s work to develop an assessment process to assess children’s writing (Heldsinger & Humphry, 2010, 2013; Humphry & McGrane, 2015). Using the method of pairwise comparisons, judges compared pairs of writing performances and decided on which performance was of a higher quality. The study found teachers were highly internally consistent in their judgements of the quality of student writing performance. Data were used to calibrate the performances of students by developing a scale of performance on which all writing performances were located.
Heldsinger and Humphry (2010, 2013) compared locations from the method of pairwise comparisons with scale locations for the same performances obtained with a rubric used in the Australian National Assessment Program – Literacy and Numeracy (NAPLAN). They found that the scale locations from the method of pairwise comparison were highly correlated with scale estimates for the same students from the large-scale testing programme, providing evidence of concurrent validity (Heldsinger & Humphry, 2010). The calibrated performances were then used as exemplars. Teachers assessed student performances simply by judging the likeness of a performance to an exemplar (Heldsinger & Humphry, 2013).
The present study
The present study examines an oral language assessment that considers both macrostructural and microstructural aspects of oral narrative performance. The first stage of the method applies the method of pairwise comparisons to develop a scale on which the locations represent the degree of quality of oral narrative performance. Drawing on the work of Thurstone (1927, 1959) and that of Heldsinger and Humphry (2010, 2013), the aim is to construct a calibrated scale as the reference against which all other performances can be assessed. Performance descriptors and teaching points are derived from a qualitative analysis of the scaled performances. In the second stage, teachers use calibrated exemplars and the performance descriptors to assess students’ work to decide where a given performance lies in relation to calibrated exemplars on the scale.
This article reports on the design and development of the oral language assessment and its application by a group of classroom teachers. The research has several aims consistent with the overarching motivation for the study of developing an approach that enables teachers to assess oral language in a reliable and comparable manner while at the same time supporting targeted teaching of oral language skills. The first aim is to establish the internal reliability of teacher judgements of children’s oral performance in a narrative context using the method of pairwise comparison. The second aim is to demonstrate the concurrent validity – the degree of agreement between results from two tests designed to assess the same construct – of the pairwise scale by cross-referencing scale locations with scores obtained using the NAP (Justice et al., 2010) for a subset of performances. Examining the concurrent validity is valuable for ascertaining similarities and contrasts with a common approach used by speech pathologists in the assessment of oral language. The third aim is to investigate the use of the assessment process by classroom teachers to obtain diagnostic information about students’ oral narrative performances. For the purpose of such investigation, a number of teachers applied and reflected on the assessment process. The article also summarises the empirically derived qualitative information available to teachers for providing feedback to students on how to improve their oral narrative skills.
Methods
Stage 1: Design and development of the oral language assessment
Collection of oral narrative performances
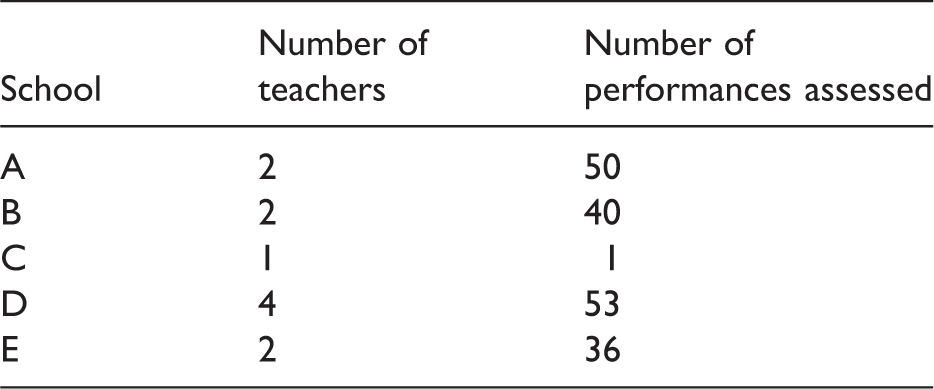
The first stage was conducted in seven government and non-government Western Australian primary schools in the Perth metropolitan area. Due to the limited number of schools in this study, it was not possible to employ a stratified random sample or other sampling design. Nevertheless, the schools were selected to reflect a mix of socioeconomic contexts, as indicated by the variation of their values on the Index of Community Socio-educational Advantage (M = 1039, SD = 74), and a mix of government and private schools. Specifically, there were three Independent schools (R-12), three Government primary schools (K-6) and one Catholic primary school (K-6).
The principal of each school called for expressions of interest from classroom teachers to participate in the study. As the assessment was designed to assess students between the ages of four and nine, expressions of interest were only sought from early childhood teachers. Principals expressed willingness to participate in the study because the teaching and assessment of oral language were considered part of their school curriculum. Sixteen teachers volunteered to participate.
Teachers collected the oral performances in term 1 from as many children in their class as was practicable; samples were collected from 144 children (gender was not identified), and principals were asked to obtain samples for students only in Kindergarten to Year 4. Children were aged from four to nine years of age (M = 6.5 years, SD = 1.7 years).
The task was administered individually by classroom teachers. Two wordless picture stories of comparable narrative complexity ‘Frog, where are you?’ (Mayer, 1969) and ‘A boy, a dog, a frog and a friend’ (Mayer & Mayer, 1992) were used as story prompts to elicit students’ oral narratives. Each child was shown one of the two picture texts and given time to familiarise themselves with the event sequence of the picture story, to facilitate more coherently structured stories. The children were then asked to tell the story while looking at the pictures, as if reading a book. Minimal prompts were given by teachers. A digital voice tracer was used to audio-record the oral narratives for later analysis.
Calibration of an oral narrative scale
Sixteen teachers, some of whom were involved in collecting oral narrative samples, as well as two researchers, participated as judges in the study. All were experienced early literacy educators. Each received 30 minutes of training in which the requirements of the task were discussed. This included clarifying their understanding of holistic judgement (macrostructural and microstructural elements) of ‘better oral performance’ (Applebee, 1978; Westby, 1985). When comparing performances, the judges were required to consider students’:
ability to tell a story sequencing and cohesiveness of ideas length of sentences and variety of sentence beginnings that they used grammatical structure of sentences, including correct use of tense use of vocabulary and descriptive language and articulation of words
The audio-recorded oral narrative samples were numbered in no particular order and uploaded as .mp3 files onto custom software that presented pairs of media files to judges. Transcripts were provided but there was no coding of the samples. Judges were given online access to the specific pairs of oral narratives to be compared. The pairs were generated randomly from the list of all pairs of performances. Judges worked individually and compared pairs of oral performances, nominating the better oral narrative for each pair. Each judge made between 6 and 200 comparative judgements. A total of 2374 pairwise comparisons were made.
The teachers’ judgements were analysed, and the scale locations were inferred from the proportions of judgements in favour of each sample versus others. If every performance were compared with every other, the strongest performance would be the one that was rated as being better than others on the highest proportion of occasions. However, in practice, scaling techniques can be used such that it is not necessary for every performance to be compared with every other.
In the present study, for the purpose of scaling, the judges’ ratings were analysed using PairWise software (Holme & Humphry, 2008) which uses the Bradley-Terry-Luce (BTL) model (Bradley & Terry, 1952; Luce, 1959). The analysis software implements maximum likelihood estimations, calculates a separation index and computes mean squared standardised residuals for the purpose of testing fit of data to the model of analysis.
Analysis of concurrent validity
In order to ascertain the validity of the scale generated from the pairwise comparisons, a subset of performances was assessed using the NAP (Justice et al., 2010). Twenty five randomly selected oral narratives were coded and scored for the presence of elements organised into five types of indicators (i.e. sentence structure, phrase structure, modifiers, nouns and verbs), by one of this article’s authors using the Long Form NAP score sheet.
Selection of exemplars and development of descriptors
The final component of stage 1 required the development of an assessment tool that could be readily used by classroom teachers.
A descriptive qualitative analysis of all 144 oral performances on the scale was undertaken to examine the features of oral narrative language development as evidenced in the empirical data from student performances. Qualitative analysis examined both the macrostructural and microstructural aspects of the performances and included an analysis of students’ ability to tell a story, sequence and link ideas, the length and variety of their sentences, the grammatical structures they used and their vocabulary and type of descriptive language they used. This work led to the drafting of performance descriptors and teaching points. From the original 144 performances, a subset of 10 oral performances was selected as exemplars. Care was taken to select exemplars that most clearly and typically captured developmental features at given points on the scale. Taken together and in order, exemplars and the performance descriptors characterised the development of oral language in a narrative context. Finally, linear transformation was applied to the scale obtained from the analysis of data produced from pairwise comparisons so that the exemplars had a range of 110 to 300 and increments of 10, making the range more readily interpretable for classroom teachers by avoiding negative numbers and decimals. This transformation is similar to that used in NAPLAN and other programmes. This resulted in an arbitrary change of the unit and origin of the original interval scale obtained by application of the BTL model.
Stage 2: Assessment of student performances against calibrated exemplars and performance descriptors
It is not practical for classroom teachers to develop a performance scale based on paired comparisons as the process is time consuming with more than a few performances. However, once a scale is developed it is available for all participating teachers as a reference against which other performances can be assessed (Heldsinger & Humphry, 2013).
Assessment in the second stage of the study involved the classroom teachers uploading audio files of their own students’ oral narratives. Transcription and coding of their own students’ performances were not required. The teacher then compared a student’s oral performance to the calibrated exemplars in conjunction with the performance descriptors. In the next step, the teacher decided to which exemplar the performance was closest to in terms of skills, or between which two exemplars it fell.
Participants in small-scale study.
Participating teachers received training to administer the assessment, make holistic judgements about students’ oral story-telling skills and use assessment and reporting software to make and record judgements. Participants were provided with ‘Administration Instructions’ and ‘Making Your Judgements’ booklets to support the assessment process in the classroom. The Making Your Judgements booklet contains transcripts of all exemplars, the performance descriptors and a close qualitative analysis of each calibrated exemplar. It was designed to help participants familiarise themselves with the exemplars and understand the particular features of each.
After a four-week period in term 2, in which participants assessed the oral language performance of students in their classrooms, the authors met with participants in a group to collect preliminary feedback on the practicability of the oral language assessment by way of semi-structured interview.
Results
Analysis of pairwise data
Pairwise locations, fit indices and statistics.
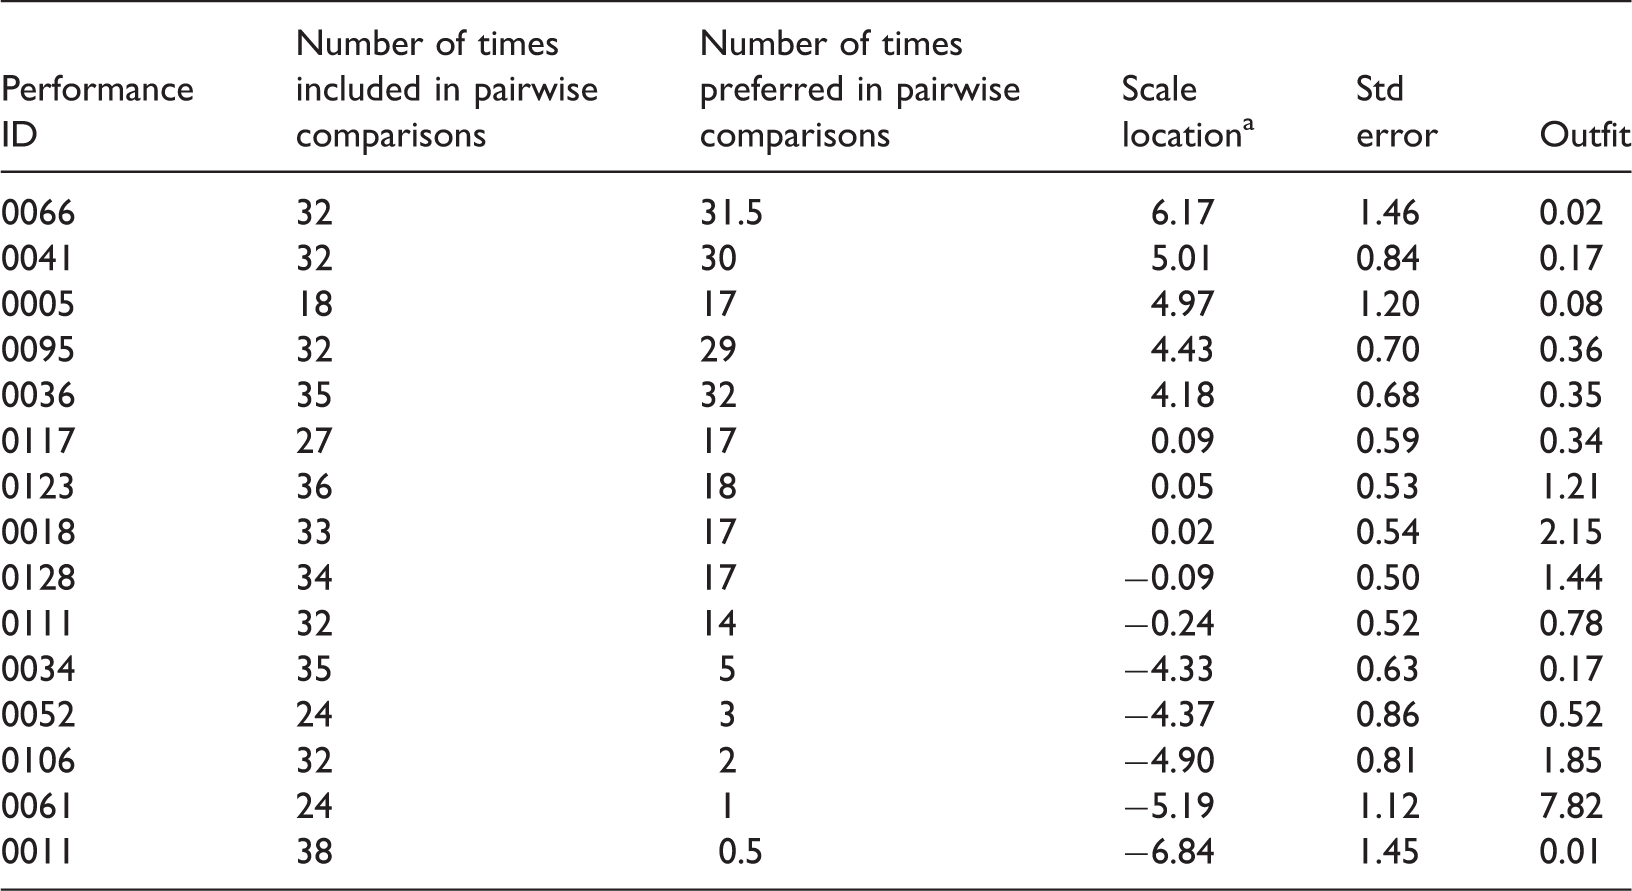
aHighest positive value (6.17) indicates strongest performance; highest negative value (−6.84) indicates lowest performance.
No constraint is imposed on the spread, and the standard deviation of the scale locations is 2.83. Performance 11 is the weakest performance as no-one judged this performance better than any other performance. Performance 66 was judged the highest quality oral narrative performance because in all comparisons it was judged to be the better performance. In the BTL model used for data analysis, where two performances are very close in standard about half the judges are expected to select one performance over the other and vice versa. This means that these performances are very close on the continuum and are of a similar level of ability. This applies to Performances 123, 18 and 128 (Table 2).
The Person Separation Index (PSI) is an index of internal reliability and directly analogous to Cronbach’s alpha (Andrich, 1988; Heldsinger & Humphry, 2010). The PSI for the pairwise comparison exercise is 0.95, indicating very high internal consistency and agreement about the relative differences of the oral language performances across the 16 judges (the minimum value of the PSI is effectively 0 and maximum is 1.0).
Validating judges’ ratings
Concurrent validity of the results from the pairwise comparison exercise was investigated by checking the pairwise scale scores against NAP scale scores. Figure 1 shows the correlation between scoring of performances using the NAP and judges’ ratings of relative differences of performance using the method of pairwise comparisons.
Correlation of pairwise locations and Narrative Assessment Protocol (NAP) scores.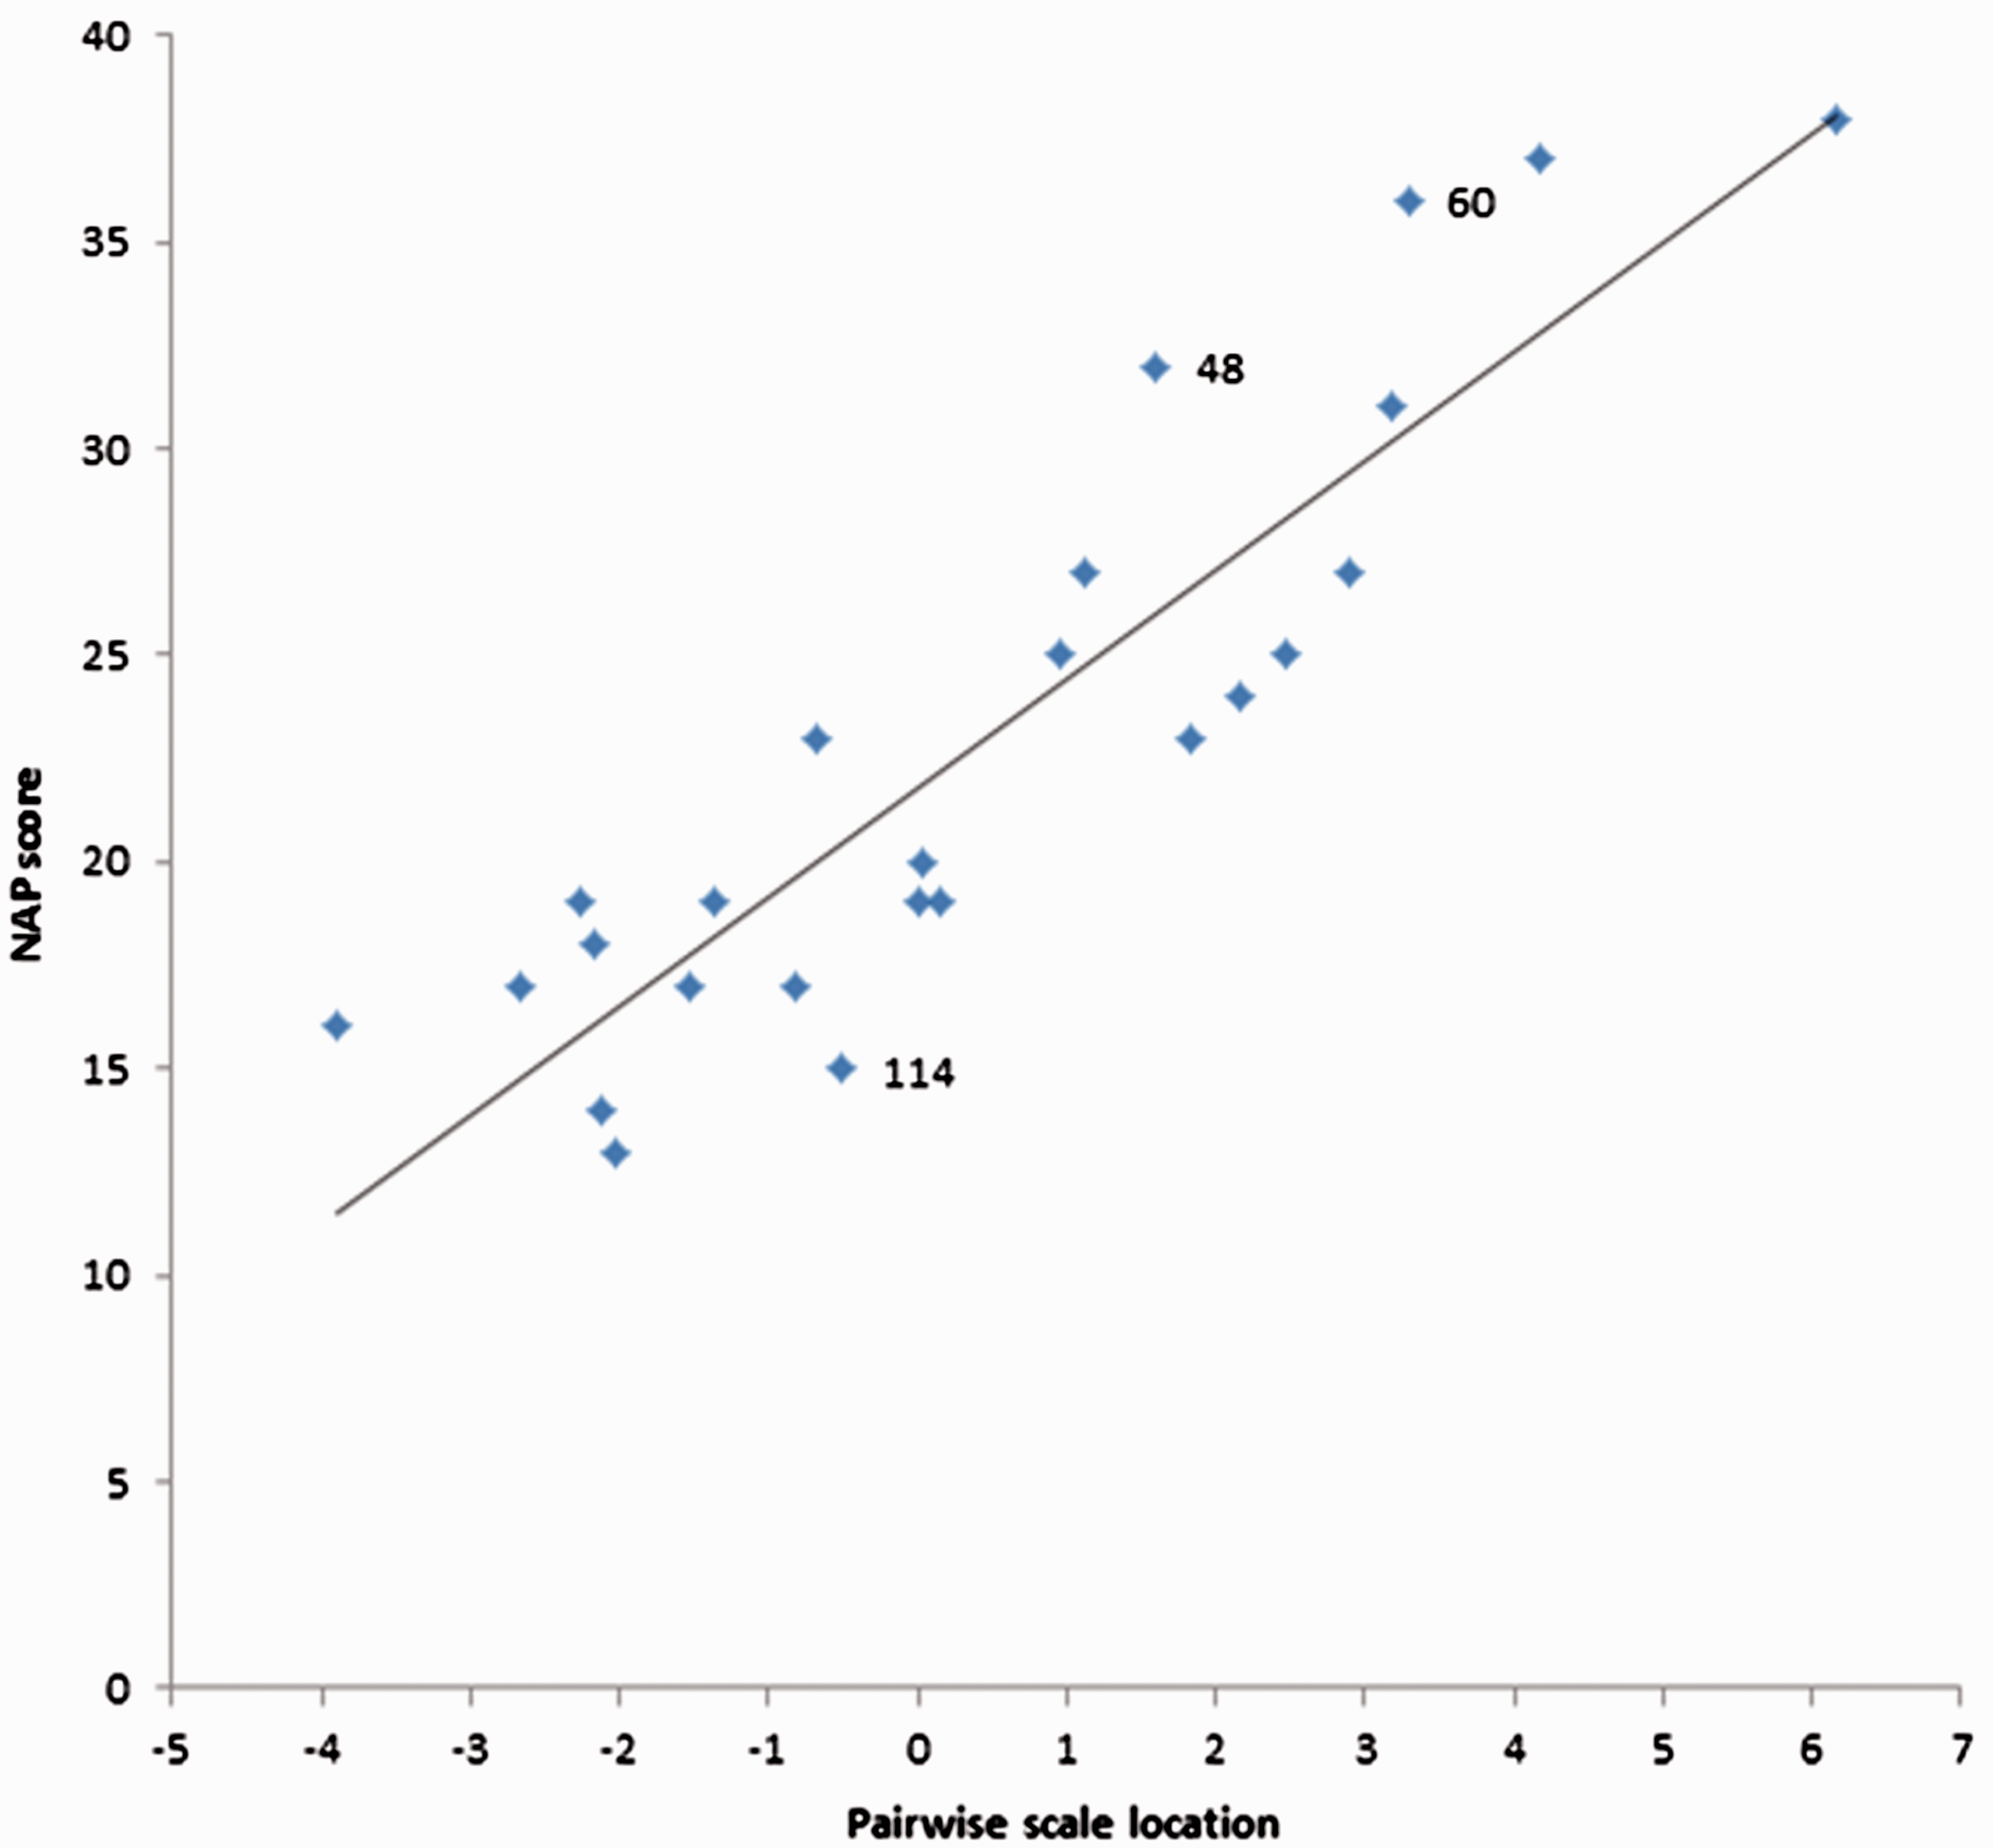
The regression line of best fit is included in the graph. The correlation (r = 0.89) is high and statistically significant (p = 0.000) even with the relatively small sample. A disattenuated correlation coefficient was also computed to estimate the true correlation having removed the attenuating effects of measurement error in each of the scales. Using the standard formula (Osborne, 2003), the disattenuated correlation between pairwise scale locations and NAP scores is approximately r = 1. Theoretically, this indicates that the correlation is effectively as high as possible given the measurement error associated with the two scales. In practice, though, this value may be somewhat inflated relative to the correlation for a random sample of performances due to the uniform sampling used to cross-reference along the range of the distribution, as discussed in the limitations section of this article. Notwithstanding this, the high correlation establishes the concurrent validity of the method of pairwise comparisons referenced to the NAP. The correlation also indicates that the method of pairwise comparisons is a reliable and valid form of teacher assessment of oral language performances.
Calibration of exemplars
Descriptive qualitative analysis
A qualitative analysis of all 144 oral performances, as located on the scale of performance, provided descriptive information about oral narrative language development. Results of this qualitative analysis show that as performances become stronger, a sense of story-telling begins to emerge. A progression is evident, from weak performances in which students simply state or describe the action in the pictures, to students providing simple explanations for characters’ actions with reference to characters’ intentions and emotions, and then to strong performances with clear evidence of narrator presence and detailed events relating to the story, leading to an ending or resolution. Vocabulary development is also evident on the scale of performance from a limited range of nouns and verbs used in those performances rated as weak to a wider vocabulary used to reflect characters’ intentions and responses in strong performances. Correspondingly, short, simple sentences found in weak performances are replaced by a range of sentence structures in performances rated as strong. In addition, those performances contain complex sentences with subordinate and embedded clauses and occasionally use adverbial clauses to begin sentences.
Exemplars, performance descriptors and teaching points
Following the linear transformation, the selected 10 exemplars cover a performance range of 120 to 300 on the calibrated scale. Part of the calibrated exemplar at scale location 220, characterising oral language development at this location on the developmental continuum and providing diagnostic information for teachers, is shown in Figure 2. The performance descriptor at scale location 170–230 describes the features of oral narrative performance at a given range of scale locations to support teacher judgement when rating students’ oral performance (see Figure 3).
Calibrated exemplar at scale location 220. Performance descriptor at scale location 170–230.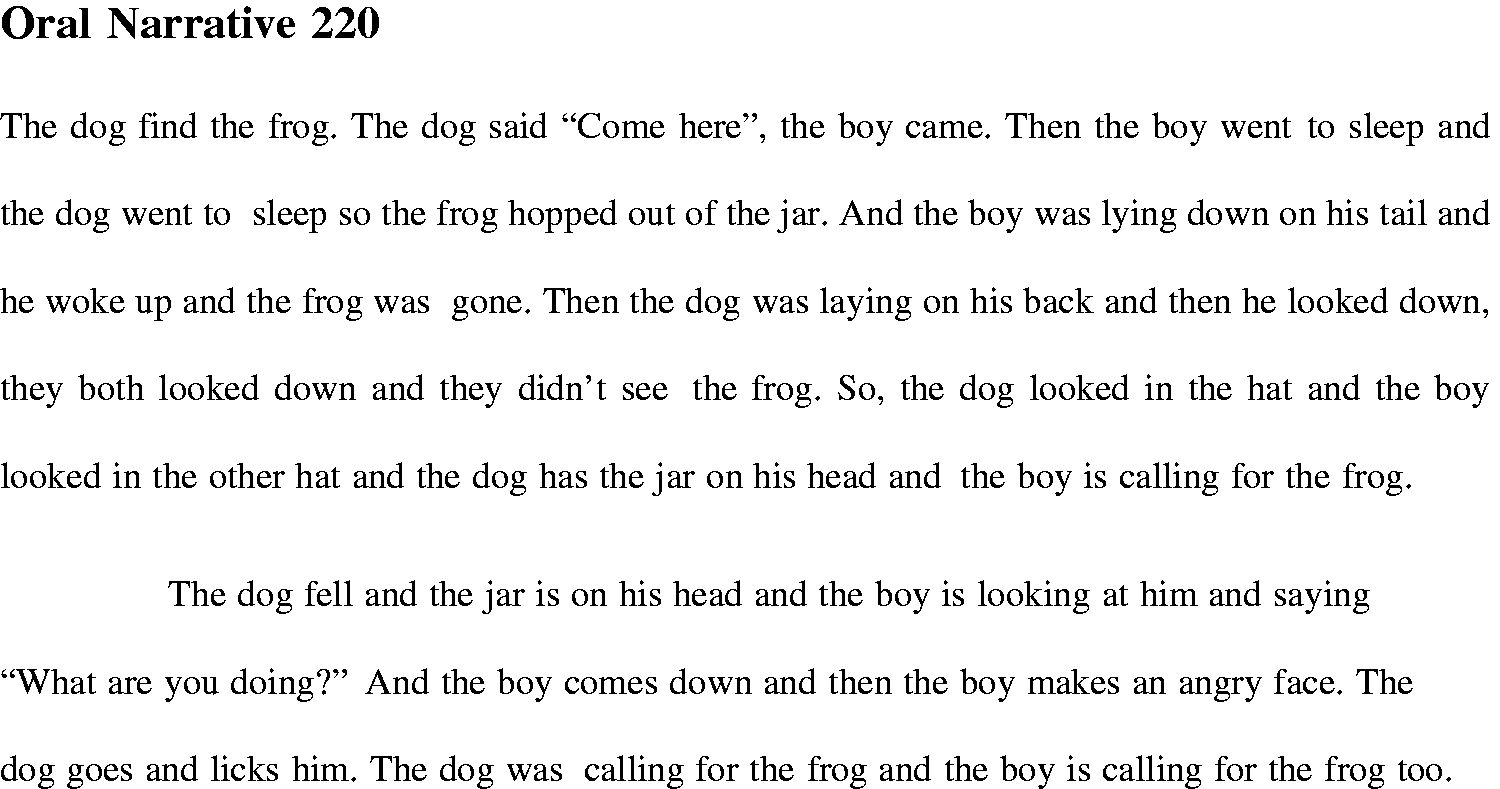
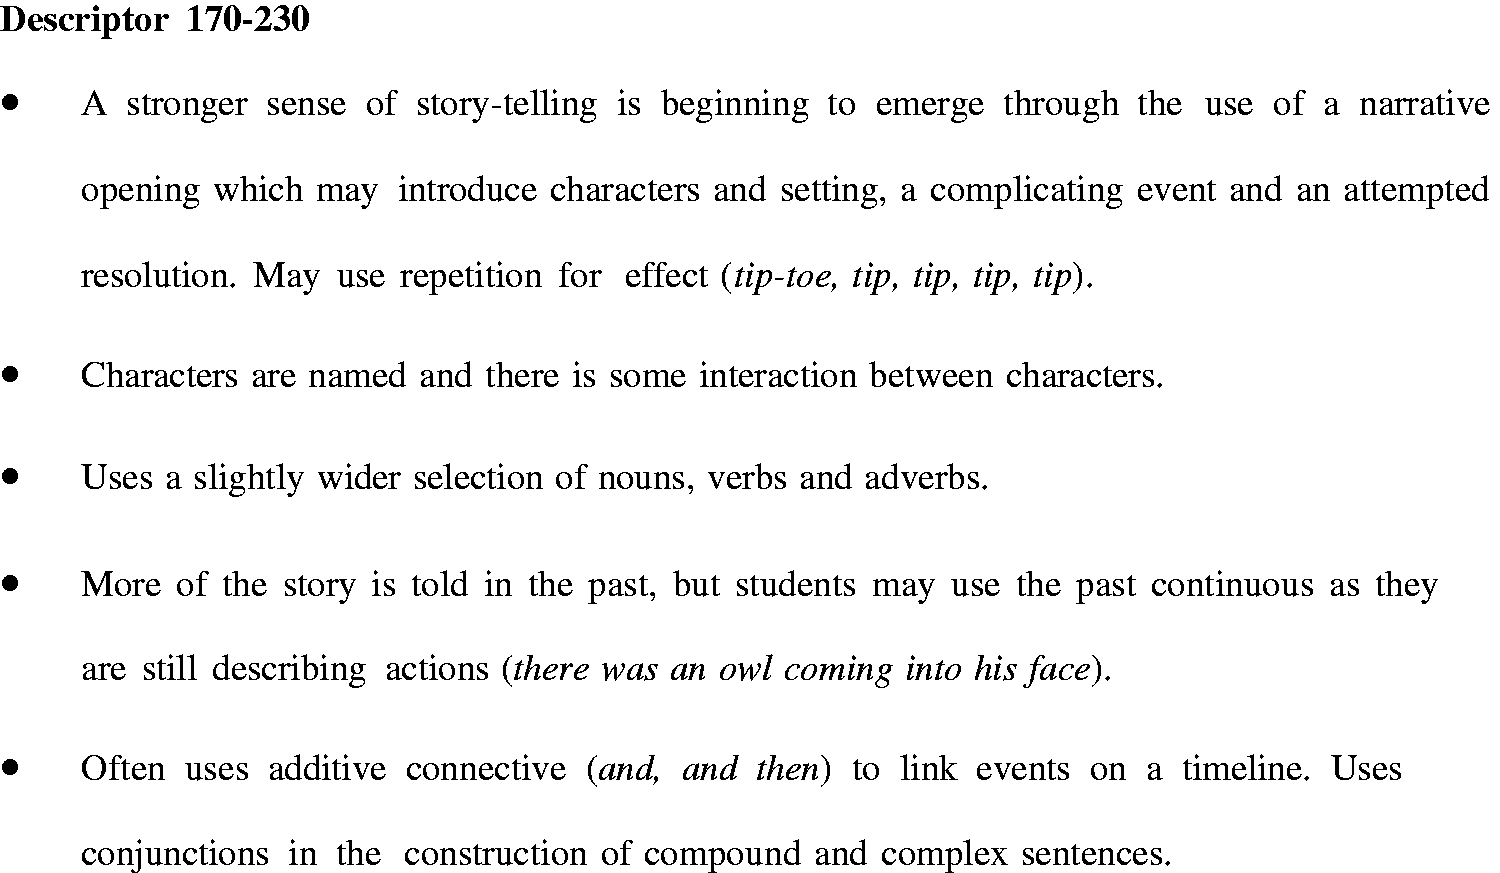
Figure 4 shows some of the teaching points at scale locations 170–230. The teaching points for students in a given range are derived from the performance descriptors for students in the next highest range on the continuum. The teaching points are designed to help teachers identify starting points and progression for instruction to support sustained incremental growth in students’ language learning.
Teaching points at scale locations 170–230.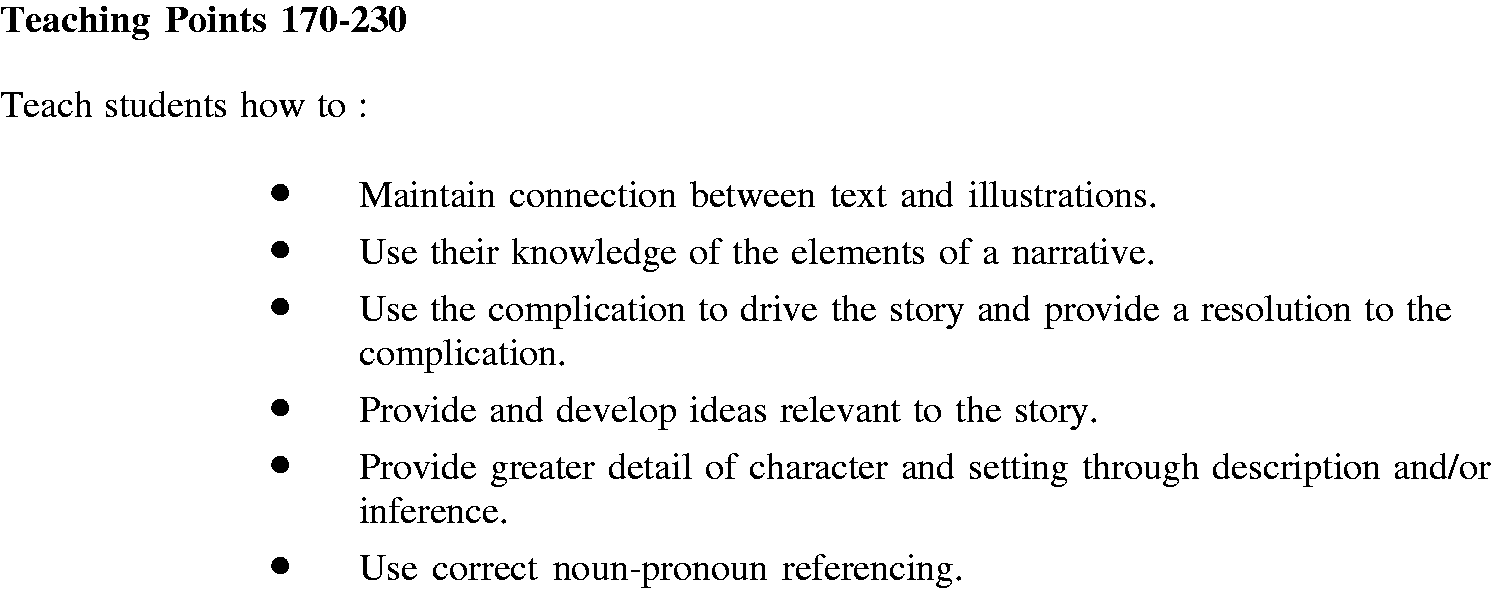
Figure 5(a) and (b) shows how the assessment and reporting software graphically displays part of the scale of calibrated exemplars, as well as performance descriptors, constructed in Stage 2 of the present study.
(a) Calibrated exemplar at scale location 220 as displayed by software and (b) performance descriptor at scale location 170–230 as displayed by software.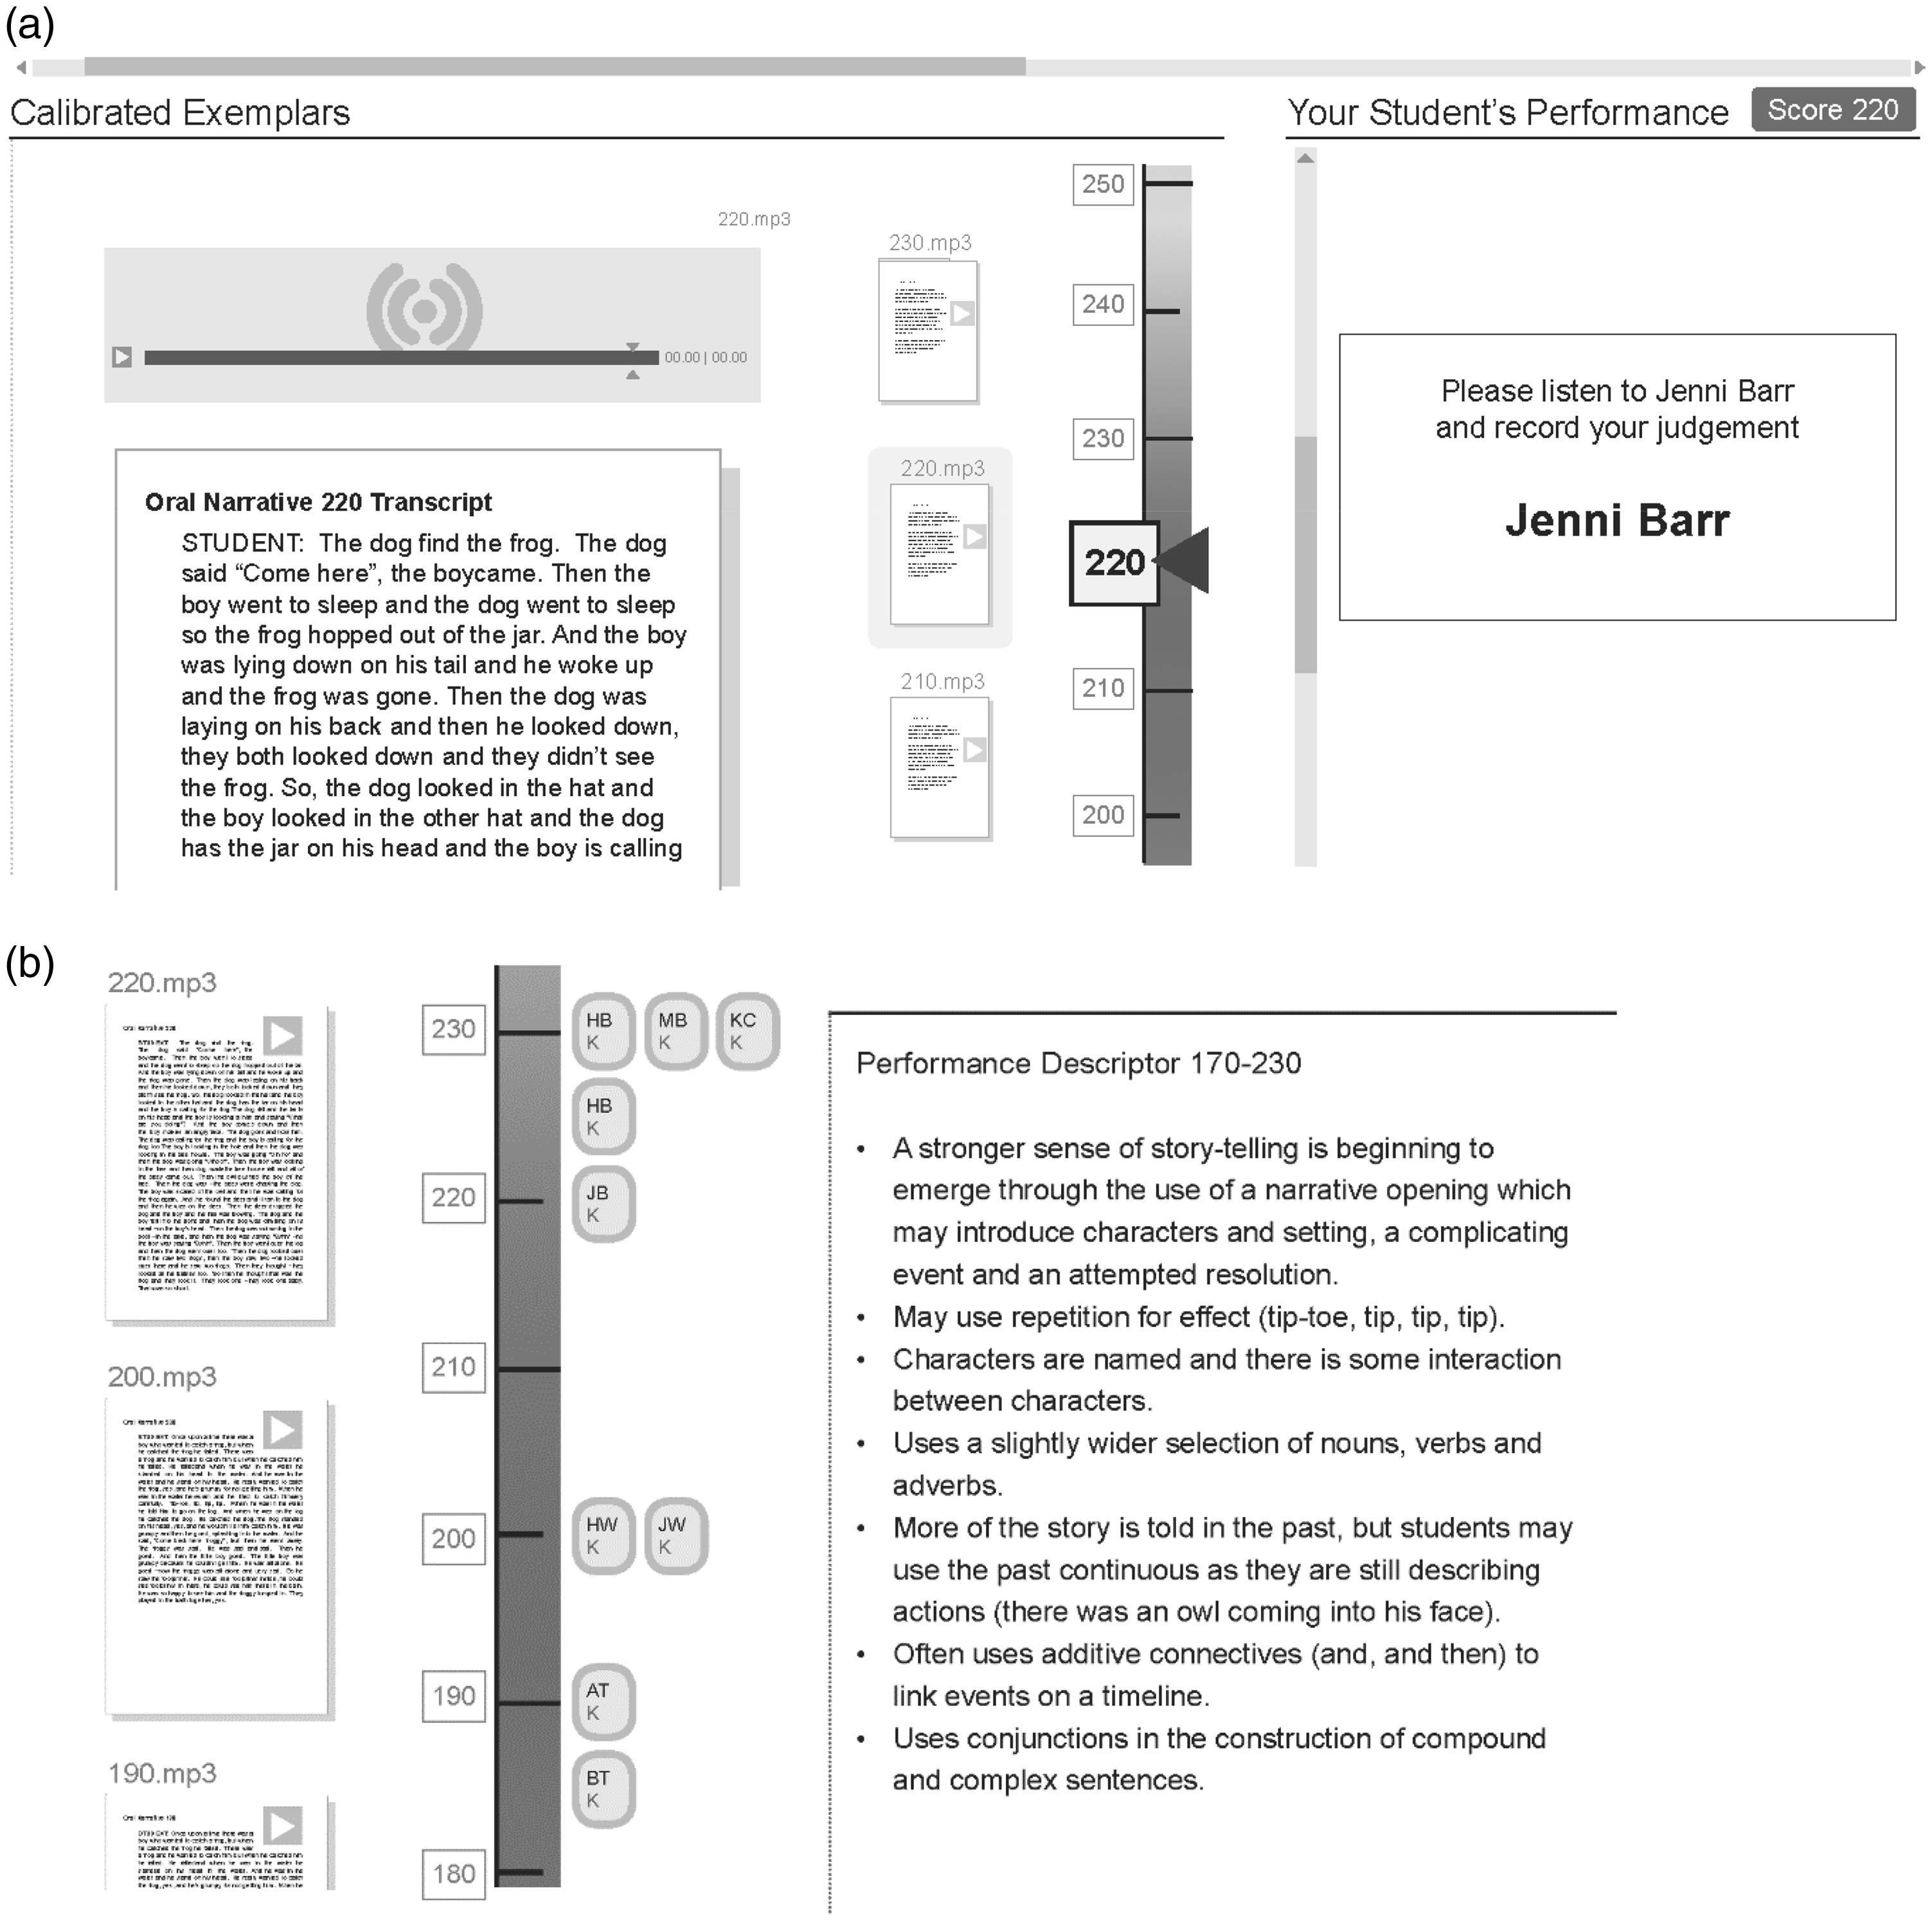
Figure 5(a) exemplifies the assessment of a student’s oral performance; the oral narrative for student with pseudonym ‘Jenni Barr’ (.mp3 file) is assessed by judging which calibrated exemplar the quality of performance is most alike. In the given example, the performance is judged to be most alike the exemplar at scale score 220. The performance descriptors (see Figure 5(b)) support the teacher’s judgement by characterising oral narrative development at this level of performance. The oral performance of the student (JB) is assigned, reported and displayed at the appropriate location on the performance scale as shown in Figure 5(b).
Feedback from teachers
Feedback from teachers involved in the study suggests that to effectively support the development of oral language educators needed to know, ‘What to listen for?’ and ‘How to respond?’ Teachers agreed that the assessment provided specific and meaningful information about oral language development in a narrative context. One teacher reported that she and her colleagues sometimes found information from speech therapists difficult to interpret and use to inform planning for teaching and learning and by contrast, this assessment provided context-specific information. Another teacher noted that ‘the assessment facilitated a better understanding that those students with less developed oral language needed explicit teaching of vocabulary and sentence formation, whereas more able students needed to be taught how to develop elements of an oral narrative’. Similarly, a third teacher reported that using the assessment highlighted the need to regularly review and refine her oral language programme.
Discussion
Reliability and validity of teacher judgements
The method and data presented suggest that the method of pairwise comparisons is an effective method for drawing on teachers’ professional knowledge to assess students’ oral language in a narrative context and to generate a scale of oral narrative performance. The study found judgements of relative differences of performances were highly consistent within and between judges (PSI = 0.95) and provide evidence of the ability of teachers to make reliable judgements about qualitative characteristics that distinguish one performance from another. The findings are consistent with those reported by Heldsinger and Humphry (2010, 2013) in their assessment of children’s writing.
Furthermore, the pairwise results have high concurrent validity (r = 0.89) referenced to the NAP (Justice et al., 2010) indicating that teachers’ judgements are valid inasmuch as the separate exercise of NAP scoring is considered an established, valid assessment. Although the correlation of pairwise locations and NAP scores is high, there are outliers. Performances 48, 60 and 114 have the three highest standardised residuals from the regression line of best fit as shown in Figure 1. A possible explanation for the discrepancies is that the NAP assesses only features of narrative microstructure whilst the process of pairwise comparison is based on holistic judgements and considers both microstructural and macrostructural aspects of the performance. Thus, when considering performance P114 (−0.5,15) although the NAP scored the inclusion of language features (microstructure) as relatively low, P114 was judged a better story than other performances with similar microstructural development as it is more coherent and includes more story grammar elements. On the other hand, P48 (1.59, 32) and P60 (3.29, 36) include well-developed sentence structure and many language features resulting in a high NAP score; however, there are fewer story grammar elements, and coherence is not as strong as that demonstrated in other performances with less well-developed microstructure and lower NAP scores.
The correlation of length of oral performance (total number of words (TNW)) and NAP score (r = 0.679) as well as length of oral performance (TNW) and pairwise location (r = 0.644) were also examined. It appears that children, who have larger vocabularies and greater command of literate language, have access to superior language resources and therefore are likely to produce longer and more interesting stories (Ukrainetz & Gillam, 2009). However, greater levels of linguistic sophistication in oral performance may also produce shorter oral narratives that include less chaining and instead, more complete sentences containing co-ordinate and subordinate clauses. The moderate correlation of both measures of performance and TNW suggests that overall length of performance is not highly related to rating of performance in either case.
Calibrated exemplars, performance descriptors and teaching points
Another broad approach to assessing students’ oral language is the use of rubrics that have grid-like structures, with or without exemplars. Although rubrics with grid-like structures have advantages, a recent study indicates rubrics with a grid-like design with same number of descriptors for each criterion can represent a threat to validity, particularly if they are poorly designed (Humphry & Heldsinger, 2014). It is relatively uncommon for researchers to investigate systematically the psychometric properties of rubrics in any form (Reddy & Andrade, 2010). Potential advantages of the approach adopted in this article over rubrics with grid-like structures are that the comparative nature of judgments is likely to mitigate rater harshness effects as explained in Heldsinger and Humphry (2010). Further, other types of rater bias are also eliminated. Nonetheless, well-designed rubrics with multiple criteria whose psychometric properties have been established may constitute another viable alternative to the assessment of oral language.
The approach adopted in this research combines advantages of pairwise comparisons and rubrics. Employed on its own purely to rank and scale performances, a limitation of the method of pairwise comparisons is that scale locations are not connected to descriptions of performance. Used in that way the method does not provide diagnostic information to classroom teachers to guide instructional planning. However, Heldsinger and Humphry (2013) demonstrated that performance descriptors can be derived from an analysis of exemplars in order on the scale. The current research follows in the same vein by applying the two-stage assessment method to the assessment of oral narrative development.
The performance descriptors were derived by analysing features of exemplars in different ranges on the continuum of calibrated exemplars. This serves a dual purpose: exemplars assist teachers to make judgements and later provide diagnostic information. The calibrated exemplars and performance descriptors characterise the developmental continuum of oral language in a narrative context in young learners.
The calibrated exemplars are used as the basis for teacher assessments of students’ oral performance. Specifically, teachers are presented with calibrated exemplars against which other performances may then be assessed by deciding which of the exemplars it is most alike on the scale. This effectively enables teachers to place separate performances in the appropriate region of the scale. Together, exemplars and performance descriptors are designed to support educators’ better understanding of linguistic development in oral language ensuring that teachers are well placed to teach to the point of need.
For this purpose, in this research, teaching points are derived from descriptors to make explicit the most direct implications for teaching. Specifically, descriptors for students at a given region on the scale provide points for teachers to target with students at a somewhat lower region of the scale. The teaching points relate closely to the developmental continuum as evidenced by the calibrated exemplars and analysis of the exemplars.
Potential limitations and future research
The purpose of this section is to discuss limitations of the study. The first limitation is that the sample size of performances for cross-referencing pairwise scale locations with NAP scores was relatively small (N = 25). Despite this low sample size, a strong correlation was evident and despite low statistical power, the correlation is statistically significant. The finding of a high correlation is consistent with evidence of concurrent validity in the form of a high correlation between pairwise scale estimates and rubric scores in studies focusing on written narrative performances (Heldsinger & Humphry, 2010, 2013; Humphry & McGrane, 2015).
Another limitation of the research is that the reported correlation coefficients between the pairwise scale locations and NAP scores are likely to be overestimates of the estimates obtained from randomly selected performances. The scope of the study only allowed a limited number of performances to be scored using the NAP. For this part of the study, the performances were intentionally selected to have a uniform distribution so that they cover the full range of performances and so that scale locations can be cross-referenced with the NAP scores across the full range. This leads to greater variance in the scale locations and scores than would be obtained using a random sample, and therefore greater explainable variance. Because the correlation reflects the proportion of variance in one set of scale locations that can be explained or predicted by the other set of scale locations, the correlation coefficients are likely to be somewhat lower if a random sample of performances were selected. Further research would be needed to establish the typical correlation between the pairwise locations and NAP scores for a random selection of students.
Another limitation of the present study is that it does not report inter-rater reliability estimates between teachers when they assess performances using the calibrated exemplars with accompanying performance descriptors. It is stressed, however, that the study does establish estimates of internal consistency for the scale on which the exemplars are located, which is analogous to standard analysis of a rubric using Item Response Theory models when only one marker has assessed any given performance. This kind of analysis is commonly undertaken for large-scale assessment programmes (e.g. Arora, Foy, Martin, & Mullis, 2009; OECD, 2014). The PSI indicates the internal consistency of individual judges and the agreement among judges during this process of constructing the scale. Further research would be useful to obtain inter-rater reliability estimates, which would be analogous to such estimates obtained when standard rubrics are used based on multiple marking of performances (e.g. double-marking).
In addition, further research is required to ascertain whether English speaking background has an impact on the validity or reliability of the method. The scope of the study did not allow for collection of data, but further research is being undertaken.
Lastly, in-depth exploration of the use of teaching points is beyond the scope of the present article. Nevertheless, the teaching points are presented in order to provide the reader with some insight into the diagnostic information made possible through this approach and how this information differs from grid-like rubrics. In the approach adopted in this study, it is intended that the descriptors are used in tandem with exemplars both during assessment and in their subsequent use in teaching.
Conclusion
Teaching of oral language is a critical component of early childhood education, yet the assessment of oral language development poses many challenges for classroom teachers. A key motivation of the present research is to develop an approach to assessing oral language that allows teachers to better understand development of students’ oral language in the context of oral story-telling so that they are better placed to teach to students’ point of need while at the same time meeting accountability and reporting objectives. Because the method described in this article enables teachers to refer to a common set of exemplars, irrespective of the teacher’s location and context, this method enables teachers to assess oral language in a comparable manner and to identify students’ level of ability.
Feedback from early childhood teachers involved in the study suggests that the oral language assessment developed in this study provides them with context-specific information and facilitates a better understanding of children’s oral language development which may be used to inform planning for teaching and learning of oral language concepts and skills.
In summary, the oral language assessment method described in this article provides a calibrated scale, comprising exemplars and performance descriptors that characterises the developmental continuum of oral language in a narrative context in young learners. The method affords a way for early childhood teachers to assess children’s emerging language skills within naturalistic and authentic contexts and provides fine-grained and empirically derived information to teachers about language development that can be used to guide instructional planning and facilitate the monitoring of student growth. Transcription and coding of language samples are not required, and assessment and reporting are facilitated by purpose-specific software. The findings of the present study indicate that within the limitations discussed, the oral language assessment has potential use in early childhood classrooms and potentially large-scale assessment programmes.
Footnotes
Declaration of conflicting interests
The author(s) declared no potential conflicts of interest with respect to the research, authorship, and/or publication of this article.
Funding
The author(s) disclosed receipt of the following financial support for the research, authorship, and/or publication of this article: The research was supported by an Australian Research Council Linkage grant with the School Curriculum and Standards Authority (SCSA) and Australian Curriculum and Reporting Authority (ACARA) as Industry Partners, with Stephen Humphry as Chief Investigator.