
Abstract
In this article, school sector differences in tertiary entrance performance were examined using longitudinal data from the state of Victoria in Australia for 2011. Analysis of students’ Tertiary Entrance Aggregate, from which the Australian Tertiary Admission Rank is derived, revealed non-trivial effect sizes of sector on performance. Results showed that students in Catholic and Independent schools performed at 0.24 and 0.38 standard deviations higher than their peers in the government sector once socioeconomic status, Year 9 performance in the National Assessments of Performance—Literacy and Numeracy, gender and language background had been controlled for. In other words, the results demonstrate “value-added effects” for the Catholic and Independent school sectors. Quantile regression showed that Independent-government school sector differences decline (moderately) with higher Tertiary Entrance Aggregate scores. For the Australian Tertiary Admission Rank, Catholic and Independent school students averaged 6 and 8 ranks higher than government school students, respectively, net of the same set of predictors. First-differences and fixed-effects models—which control for all stable (including unobserved) differences between students—estimated increments of 4.5 and 6.0 Australian Tertiary Admission Ranks, for the Catholic and Independent school sectors compared with the government sector.
Keywords
Introduction
Non-government schools are a feature of many education systems in Western countries. Among economically developed nations, Australia has one of the largest non-government school sectors. According to the Organisation for Economic Co-operation and Development (OECD, 2012, Table C1.4.), the proportion of Australian students attending government schools is 69% compared with an average of 90% for OECD and European Union countries. In 2013, 1.27 million (about 35%) of the total of 3.65 million Australian school students were attending non-government schools (Australian Bureau of Statistics [ABS], 2014, p. 6). In the final year of school (i.e. Year 12), the percentage of students attending non-government schools is substantially higher at around 42% (ABS, 2014, p. 22). Non-government schooling is increasingly popular in Australia and is likely to become the major provider of senior secondary school education (Caldwell, 2010). Of non-government school students, about 60% attend Catholic schools and 40% attend Independent schools (ABS, 2014, p. 22).
There is little doubt that for observable student outcomes, non-government schools show higher academic outcomes than government schools. Each year, newspapers in capital cities publish Year 12 results which generally show that the highest performing students are more likely to come from non-government schools than (non-selective) government schools. Similarly, non-government schools perform well in rankings based on Year 12 results. 1 It should be noted that selective government schools, which recruit high-ability students, perform equally well or better than the highest performing Independent schools (Haug & Blackburn, 2013; Tsolidis, 2009).
School sector differences in tertiary entrance performance
Summary of studies of school sector differences for ATAR (ENTER).
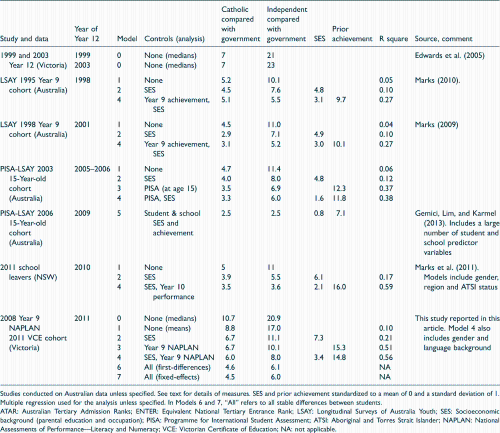
Studies conducted on Australian data unless specified. See text for details of measures. SES and prior achievement standardized to a mean of 0 and a standard deviation of 1. Multiple regression used for the analysis unless specified. In Models 6 and 7, “All” refers to all stable differences between students.
ATAR: Australian Tertiary Admission Ranks; ENTER: Equivalent National Tertiary Entrance Rank; LSAY: Longitudinal Surveys of Australia Youth; SES: Socioeconomic background (parental education and occupation); PISA: Programme for International Student Assessment; ATSI: Aboriginal and Torres Strait Islander; NAPLAN: National Assessments of Performance—Literacy and Numeracy; VCE: Victorian Certificate of Education; NA: not applicable.
Although there are sizable school sector differences in mean ENTERs or ATARs, these differences may substantially reflect differences in the intake characteristics of the students attending schools in the three sectors rather than the effects of school sector per se on performance. School sector differences may be a function of socioeconomic differences between students attending the three school sectors. Higher socioeconomic background (SES) students tend to have better educational outcomes and are more likely to attend non-government, especially Independent, schools. Similarly, sector differences could be explained by the recruitment by non-government schools of high performing/high-ability students and their smaller proportions of low-ability students. Therefore, an important research question in the debate about school sector differences is: Do non-government schools “add value” to student performance? Typically, value-added effects are estimated by controlling for SES and prior achievement.
In the studies of school sector differences summarized in Table 1, SES and prior achievement are not measured consistently. In the 1995 and 1998 Longitudinal Surveys of Australia Youth (LSAY), SES was measured by parents’ occupation and education, singly and in combination. In later LSAY studies based on the OECD’s Programme for International Student Assessment (PISA), SES is measured by the much broader Economic, Social, and Cultural Status composite. 2 In the 1995 and 1998 LSAY studies, prior achievement was measured by short (20 item) tests of numeracy and reading undertaken by students when they were in Year 9. In the LSAY-PISA studies, prior achievement was measured by student performance at age 15 in PISA tests of reading, mathematical, and scientific literacy. For the NSW school leavers study, prior achievement was measured by student performance in the Year 10 school certificate examinations.
Table 1 includes the estimates of school sector differences in tertiary entrance performance, net of SES, prior achievement, and other factors. (For comparison, it also includes the estimates from the present study, which are discussed later.) When controlling for SES, the increment associated with attending a Catholic school declines marginally. In contrast, differences between Independent and government school students decline by about one-third from about 11 to 7 ATARs. Prior achievement has a larger impact on school sector differences than SES, reducing the differences by about 40%. When taking into account both SES and prior achievement, the Catholic-government sector difference is three to six tertiary entrance ranks and the Independent-government sector difference is six to eight ranks (Table 1). So there appear to be value-added effects for the non-government sectors compared with the government sector, at least for tertiary entrance performance. However, it should be noted that earlier in the school career, value-added school sector effects are smaller and are often not statistically significant under a variety of methodological approaches (Adams, 2012; Miller & Voon, 2011, pp. 379–380; Marks, 2015b; Nghiem, Nguyen, Khanam, & Connelly, 2015; Ryan, 2014). 3
Also evident from Table 1 are the substantially stronger effects of prior achievement on tertiary entrance performance compared with that for SES. When both factors are in the same analysis, the effects of prior achievement are around 10 ATARs or more, compared with less than 4 ATARs for SES, for a comparable one standard deviation (SD) difference. The addition or subtraction of SES to these models makes little difference to the estimates of school sector differences, once prior achievement is taken into account. In contrast, the addition or subtraction of prior achievement makes a substantial difference to the estimates for school sector. Invariably, the addition of prior achievement markedly increases the variance accounted for in students’ tertiary entrance performance (indicated by the R square values). The strong effects of prior achievement most likely reflect the high correlation between student achievement and cognitive ability, and the importance of cognitive ability for educational outcomes. 4
Evaluation of the literature and contribution of this study
Interpretation of school sector effects
Although it is almost standard procedure to control for SES in studies of school sector differences, it is difficult to argue that parents’ socioeconomic characteristics directly contribute to their children’s Year 12 performance. The knowledge and skills assessed during and before Year 12 are overwhelmingly taught in schools; even the most highly educated, wealthiest, or most cultured parent would have great difficulty with the depth and breadth of a typical Year 12 student’s subjects. Also, there is little evidence of substantial indirect effects of socioeconomic status on student performance through attitudes to education, aspirations, and cultural knowledge. 5 Furthermore, the effects of SES on tertiary entrance performance are quite small when taking into account prior achievement (see Table 1). 6 These small effects run counter to the expectation of large SES effects implied from theories—such as cultural capital theory—which attempt to account for socioeconomic inequalities in student performance.
Recent analyses of the PISA data find that school-SES reduces school sector differences in student achievement to statistical insignificance (Thomson, De Bortoli, & Buckley, 2013, pp. 34–35, 144, 183; Thomson, De Bortoli, Nicholas, Hillman, & Buckley, 2010, pp. 63, 188, 232). This finding is, in part, due to the high correlation of school-SES with school sector. 7 However, analyses of Victorian longitudinal National Assessment Program—Literacy and Numeracy (NAPLAN) data conclude that the large effects of school-SES on student achievement are statistical artefacts (Marks, 2015a). School-SES effects on student achievement in the five NAPLAN domains were trivial when taking into account school or student prior ability. Fixed-effects analyses revealed very small and mostly negative effects for school-SES. Furthermore, and counterintuitively, the larger the error component in the SES measure, the stronger the effects of school-SES on students’ NAPLAN performance. 8
Estimates of school sector differences, net of SES, have no direct value-added interpretation. At best, they show that school sector differences remain when taking into account a particular measure of SES which can be easily argued as inadequate, not resolving the argument that school sector differences simply reflect SES. In contrast, school sector differences, net of prior ability or achievement, have a direct value-added interpretation: the extent to which schools in the two non-government sectors add to or detract from student performance given their students’ abilities or prior performance. School sector differences net of SES, prior achievement and other influences can be interpreted as the effects of school sector, net of the cognitive and non-cognitive factors indexed by the particular set of predictor variables in the model.
This study provides estimates of school sector differences: net of SES (for comparison with previous studies), the value-added contribution of school sector by controlling for an extensive and reliable curriculum-based measure of prior achievement, and school sector differences net of SES, prior achievement, and other variables.
Measurement and analysis
In almost all of the studies on tertiary entrance performance cited above, information on ENTER or ATAR was not obtained from administrative sources but collected from young people by telephone interview. The exceptions are the studies that utilized administrative tertiary entrance data from Victoria (Birrell et al., 2002; Edwards, 2007, p. 7; 2005, p. 10). It is unlikely that recall data from students on their tertiary entrance ranking are perfectly accurate as some students may not remember their precise rank or deliberately provide inaccurate information. Furthermore, students with ATARs lower than 30 are not informed about their actual ATAR, so the ATAR distribution obtained from telephone interviews with students is left censored at 30. This study analyses data from administrative sources and the ATAR variable is not left censored.
The more or less uniform distributions of ATAR and ENTER are somewhat problematic for statistical analyses. Although analytical techniques are available for the analysis of dependent variables with other non-normal distributions—dichotomous, ordinal, multinomial, and count 9 data which transform to a linear specification with a link function—there is no generally accepted analytical procedure to analyze uniform distributions. This is not to say that analyses of ENTER or ATAR produce biased estimates but some of the predicted values are implausibly outside the 0 to 100 percentile rank range, 10 and most statistical tests are inappropriate.
Interaction effects and differences across the performance continuum
The current literature does not satisfactorily address the question: Do school sector differences in ATAR vary by gender, SES, language background, and prior achievement? In other words: Are school sector differences stronger for boys, students from higher SES backgrounds, or non-English speaking background (NESB) students, than for students belonging to the respective comparison groups? It is difficult to perform tests for interaction effects on the uniformly distributed tertiary entrance rank with data from sample surveys. The number of cases is often not sufficient, and the uniform distribution is problematic for tests of interaction effects. 11 This study tests interaction effects with the normally distributed Tertiary Entrance Aggregate (TEA) on population data comprising over 40,000 students.
Similarly, previous published studies have not investigated if school sector differences vary along the tertiary entrance performance continuum. For example, the effects of attending a non-government school may be relatively trivial at the top end of the distribution because high-ability students perform well, no matter to which school sector their school belongs. It is also plausible that non-government schools may be less effective for students at the lower end of the performance continuum since much of those schools’ market values revolve around their Year 12 results. Similarly, socioeconomic effects on student performance may be weaker at the higher levels of student performance again because of the importance of cognitive ability. In contrast, gender differences are likely to be larger at lower levels of performance either because of the larger tails in the distribution of cognitive ability among males compared with females, or because, among low performers males are more likely to disengage. This study uses quantile regression to investigate if the effects of predictors change along the TEA continuum.
School sector movers and stayers and fixed-effects analyses
A further contribution of this study is a comparison of performance in Year 9 NAPLAN and ATAR between students who did and those who did not change school sectors between Years 9 and 12. It may be the case that particular changes in school sector are associated with larger, smaller, or trivial changes in relative performance. Students who change sectors are interesting because differences in performance can be attributed to changes in school sector. This idea is extended in the subsequent first-differences and fixed-effects analyses which utilize differences in performance only for students who change school sectors between Years 9 and 12.
Although much of students’ level of cognitive skills is captured by prior achievement, it is unlikely that all of their cognitive skills are measured by earlier achievement tests, so there is likely to be an unobserved component. Furthermore, non-cognitive factors such as perseverance, industriousness, and the big five personality traits can contribute to educational outcomes (Covay & Carbonaro, 2010; Farkas, 2003). There are other unmeasured factors that also may contribute to school sector differences, such as aspirations and parental pressure. It cannot be assumed that these unmeasured cognitive and non-cognitive factors are equally distributed among students in the three school sectors or captured by the observed measures in the final models. These additional cognitive and non-cognitive factors are typically not measured in studies of school sector differences, so they are deemed as “unobserved.” School sector differences may be smaller or of no consequence once these unmeasured cognitive and non-cognitive factors are taken into account. In this study, first-differences and fixed-effects models are employed to estimate school sector differences in tertiary entrance performance, net of all stable differences between students, not just differences in SES, prior achievement, and other variables commonly used. First-differences and fixed-effects analyses provide the least biased estimates for school sector differences since they control for the time invariant characteristics of students. The size of the unobserved components can be roughly gauged by comparing school sector differences in the first-differences and fixed-effects models to that found in models with a large suite of relevant predictor variables.
Purpose of present study
The purpose of this study is to examine school sector differences in tertiary entrance performance and influences on tertiary entrance performance through analysis of population data from Victoria.
Specifically, this study examines:
The observed (or unadjusted) school sector differences in tertiary entrance performance (i.e. TEA and ATAR). School sector differences in tertiary entrance performance, net of SES, prior achievement, gender and language background. The relative magnitudes of the independent effects of SES, prior achievement, gender and language background on tertiary entrance performance. Possible interactions of school sector with SES, prior achievement, gender and language background on tertiary entrance performance. Possible changes in the effects of school sector, SES, prior achievement, gender and language background along the TEA performance continuum. Students’ ATARs by their school sector status in both Years 9 and 12, unadjusted and net of other influences. School sector differences in ATAR, net of stable differences between students, using first-differences and fixed-effects analyses.
Data and methods
Data
The data set includes all students in the state of Victoria, Australia who were in Year 9 in 2008. It is a merged longitudinal data set of two sources of administrative data: the Year 9 NAPLAN data from the Victorian Department of Education and Training and Year 12 ATAR data from the Victorian Tertiary Admissions Centre (VTAC). The two data sources were linked by a common and unique student identification number. The data analyzed comprises information from over 40,000 students.
Measures
Univariate statistics of variables used in the analyses.
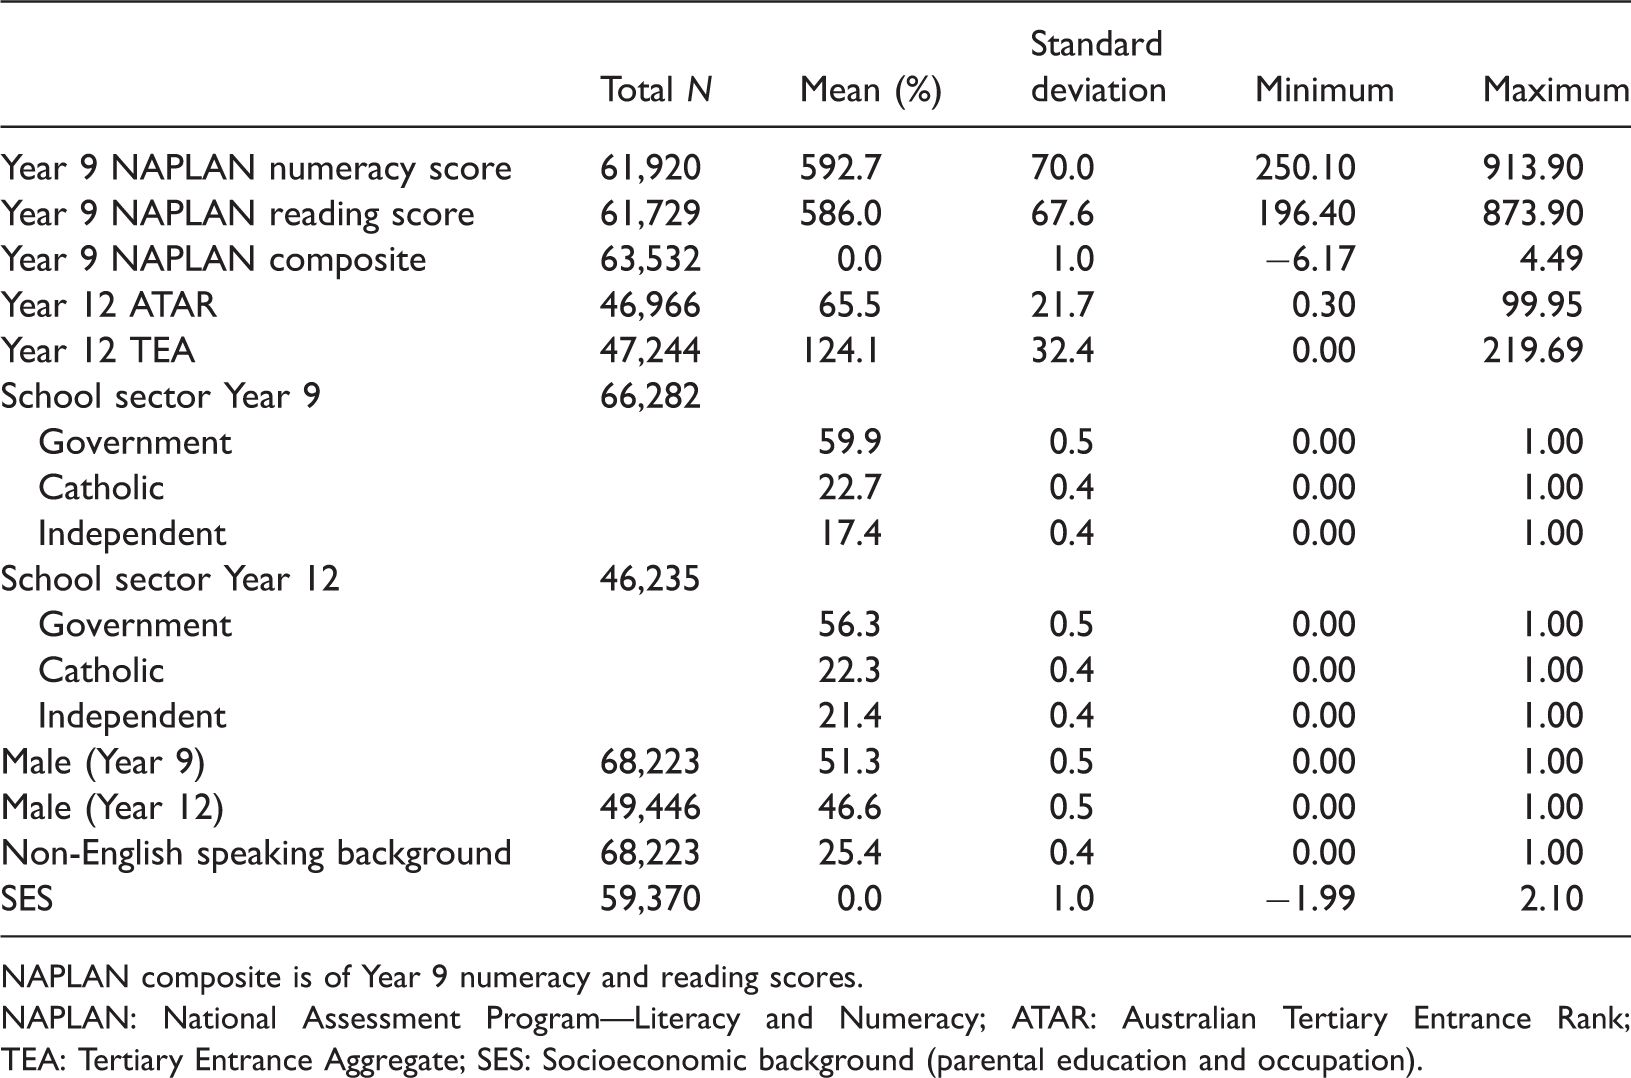
NAPLAN composite is of Year 9 numeracy and reading scores.
NAPLAN: National Assessment Program—Literacy and Numeracy; ATAR: Australian Tertiary Entrance Rank; TEA: Tertiary Entrance Aggregate; SES: Socioeconomic background (parental education and occupation).
NAPLAN Year 9 test scores
Each NAPLAN scale describes the development of student achievement from Year 3 to Year 9 by way of scores that range from 0 to 1000 (called “scaled scores”). The scaled scores in each of the five domains tested across the four year levels (i.e. Year 3, Year 5, Year 7, and Year 9) are standardized to have a mean of 500 and a SD of 100. For this study, only NAPLAN scores for Year 9 numeracy and reading were available, and students’ scores in these two domains were combined to produce the Year 9 NAPLAN composite. 12 If either score was missing for an individual student, the available score was used. No imputations were performed for students without both numeracy and reading scores. The NAPLAN composite was standardized to a mean of zero and a SD of one.
Victorian Certificate of Education study scores, ATAR study scores, TEA, and ATAR
The four measures of students' Year 12 performance are: Victorian Certificate of Education (VCE) study scores, ATAR study scores, the TEA, and finally the ATAR.
For each approved study (subject) in Year 12, students’ VCE study score is a ranking with a maximum of 50 with the mean (and median) set at 30. 13 ATAR study scores are based on the respective VCE study score. The ATAR study score adjusts (or scales) the VCE study score based on the performance of students in their other studies (VICTER, 2014, p. 55). Thus, ATAR study scores are adjusted by the overall performance of all the students in a subject. Languages, 14 advanced mathematics, physics, and chemistry are typically scaled upwards, so in these subjects students’ ATAR study scores are generally higher than their VCE study scores. For some other studies, the ATAR study score is lower than the corresponding VCE study score. For many subjects, there is little or no difference. Each year, VTAC releases scaling reports. 15
For each student, TEA is calculated by VTAC (2013, p. 56) from the addition of:
the ATAR study score in English, English as a second language, Literature or English Language. Note that it is mandatory that each student takes one of these subjects; the next best three ATAR study scores permissible (which together with the English study score make the “primary four”)
16
; 10% of any fifth and sixth permissible ATAR study scores that are available which are called increments.
TEA is then ranked to produce ATAR. ATAR is a percentile ranking for the age cohort, not just for students with a TEA. The 0.05% of students with the highest TEA scores is assigned the highest rank of 99.95. ATARs decrease in steps of 0.05. Students with an ATAR of 80 scored better than 80% of their age cohort. ATARs below 30.00 are reported to students as “less than 30” (VICTER, 2014, p. 5) but, as mentioned earlier, ATARs below 30 are available in these data.
Socioeconomic background (SES)
The measure of SES used in this study is a composite of parents’ occupation and education. Information on parents’ occupation and education was obtained from enrolment records.
17
The measures of parents’ occupation comprised the following categories:
Senior management, qualified professionals Other business managers associate professionals Tradesmen/women, clerks and skilled office, sales and service staff Machine operators, hospitality staff, assistants, labourers, and related workers Not in paid work in last 12 months Not stated or unknown (missing data)
Parental education and occupation were combined into a sheaf variable (Whitt, 1986). A sheaf variable is a combination of several variables that theoretically indicate the same concept. It is the preferred method of combining a variety of categorical and ordinal indicators to a single continuous variable which facilitates comparisons of the magnitude of the concept’s effect with other factors and allows single variable tests for interaction effects. 18 The variance explained (R square) by a sheaf variable is exactly the same as in an analysis comprising the constituent variables. The first stage in constructing the sheaf variable was to obtain estimates by regressing students’ combined Year 9 NAPLAN scores on continuous measures of father’s and mother’s education and categorical measures of father’s and mother’s occupation group—including not in paid work. Note that missing data on occupation or education were not included. The sheaf variable was calculated by multiplying the estimates by the values of parental occupation and education and summing the products for each individual student. The resulting sheaf variable was then standardized to a mean of zero and a SD of one.
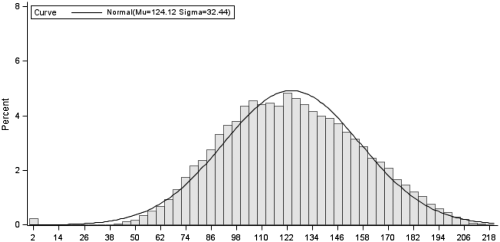
Table 2 presents the summary statistics for the variables used in these analyses. The SDs for Year 9 numeracy and reading NAPLAN test scores are nearly 70. The percentage of non-government school students increases from about 40% in Year 9 to 45% in Year 12. Between Years 9 and 12, the percentage of male students decreased from 51 to 47%. About a quarter of Year 12 students had a language background other than English. For comparison with earlier Victorian studies, the median ATARs in this 2011 data set were 59.8 for government, 70.5 for Catholic, and 80.7 for Independent school students. Figures 1 and 2 show that the NAPLAN composite and the TEA have normal distributions.
Distribution of Year 9 NAPLAN composite (before standardization). Distribution of Year 12 Tertiary Entrance Aggregate.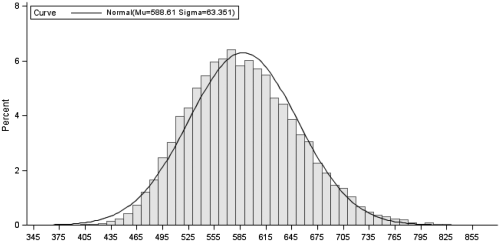
Correlations of variables used in the analyses.
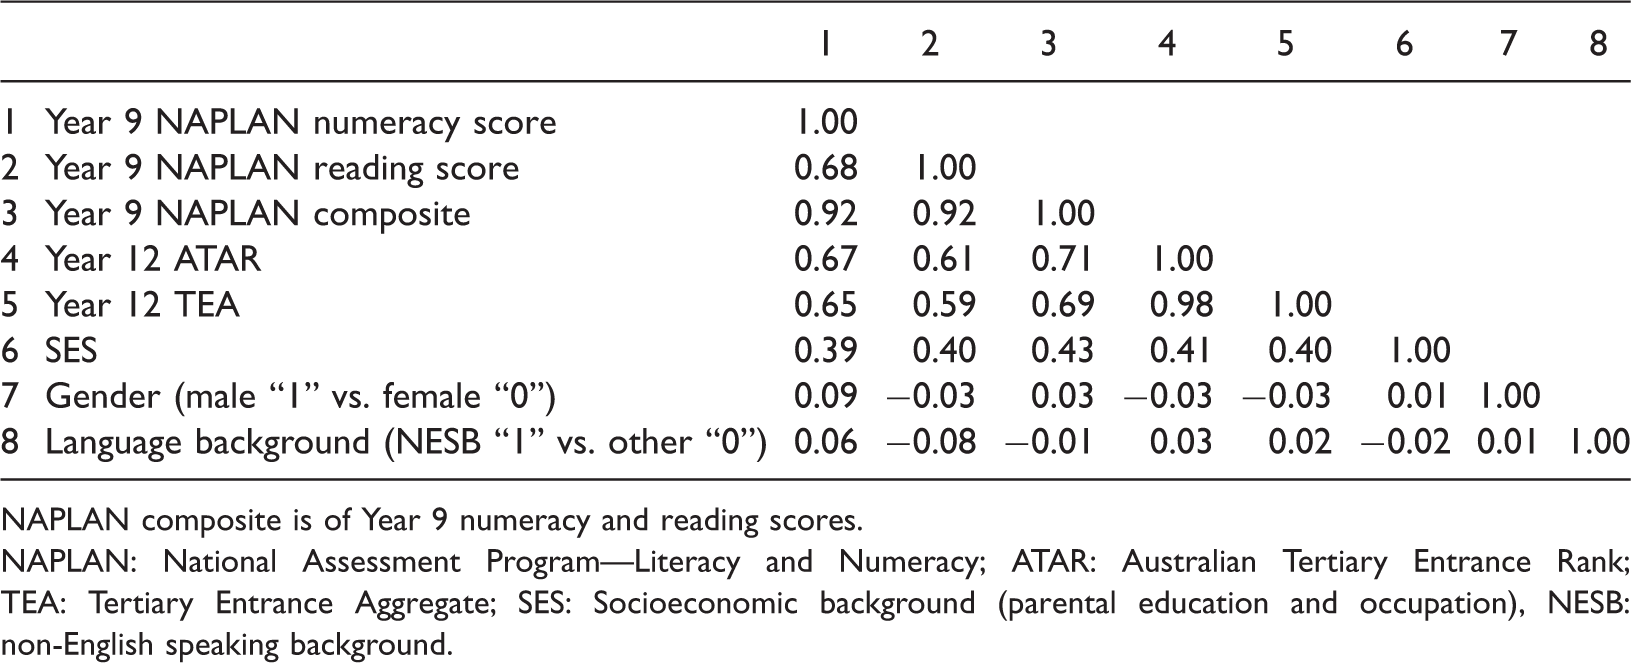
NAPLAN composite is of Year 9 numeracy and reading scores.
NAPLAN: National Assessment Program—Literacy and Numeracy; ATAR: Australian Tertiary Entrance Rank; TEA: Tertiary Entrance Aggregate; SES: Socioeconomic background (parental education and occupation), NESB: non-English speaking background.
Methods
Multiple regression
The effects of attendance at a non-government school are ascertained using ordinary least squares (OLS) regression with the standard errors corrected for the clustering of students within schools. The first (unadjusted) model comprises only the trichotomous measure of Year 12 school sector (attendance at Catholic and Independent schools contrasted with attendance at a government school) regressed with TEA or ATAR as dependent variables. The two regression estimates (in Model 1) are the differences in student performance for students attending Catholic and Independent schools in Year 12 compared with students attending government schools. The average performance of government school students is indicated by the intercept. The estimates are exactly equal to the differences in the means for TEA or ATAR for students in the three school sectors. Subsequent models include controls for SES, Year 9 performance in NAPLAN, and gender and language background. These analyses indicate the impact of the Catholic or Independent sectors on tertiary entrance performance compared with the government sector, net of the other factors included in the specific model. For TEA, the school sector effects are also reported as effect sizes which are in SD units.
In the analyses of TEA, interaction terms were included to assess if school sector differences differ by SES, gender, language background, and Year 9 NAPLAN performance. Interaction effects were examined in the usual way by adding multiplicative terms to the main effects model, for example, interaction terms were created for school sector by NESB status and school sector by SES (see Jaccard & Turrisi, 2003).
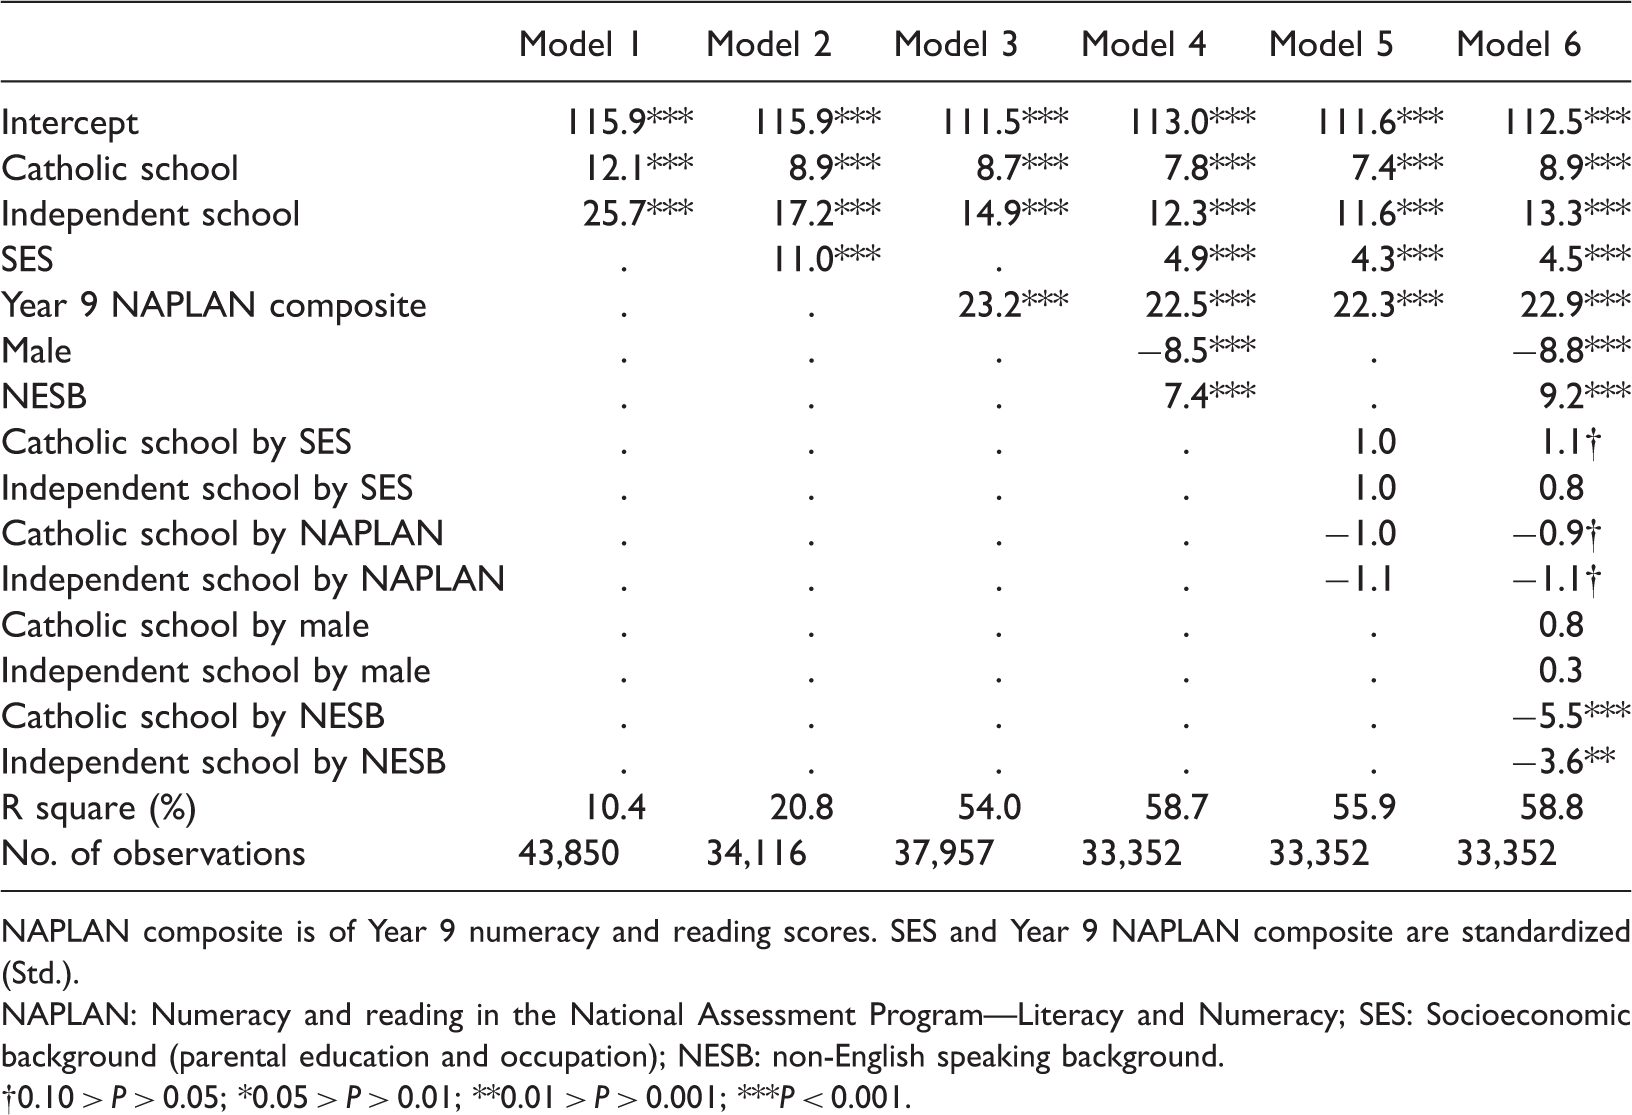
In the analyses of ATAR and school sector in Years 9 and 12, the regression estimates in Model 1 are the differences in average ATAR for eight school sector status groups compared with the ninth, students who attended a government school in both Years 9 and 12. The average performance of students who attended government schools in both years is indicated by the intercept. The estimates in subsequent models are the average school sector status differences in ATAR controlling for SES (Model 2), the Year 9 NAPLAN composite (Model 3), and both these factors (Model 4).
Quantile regression
The rationale for the use of quantile regression is that OLS regression is limited because the effects of predictor variable are conditional at the mean of the response variable (Hao & Naiman, 2007). However, it may be the case that at the mean the predictor variables have atypical effects, whereas at other parts of the distribution of the outcome variable the effects of the predictor variables are more informative. Furthermore, conditional mean approaches assume that the shape and location of the respective performance measures are the same along the performance continuum. Instead of estimating the conditional mean as is the case in OLS regression and related procedures, quantile regression is estimated at the conditional median (the 0.50 quantile) or indeed at any specified quantile. The coefficients from quantile regression are interpreted in the same manner as coefficients obtained from OLS regression.
For this quantile regression analysis of TEA, a series of coefficients are estimated for the 19 quantiles between the 0.05 (the 5th percentile) and 0.95 (the 95th percentile) quantiles in increments of 0.05 (5 percentiles). The predictor variables are school sector, SES, Year 9 NAPLAN, gender and language background.
First-differences and fixed-effects models
First-differences and fixed-effects models are used to estimate the effects of a predictor on an outcome, net of the effects of unmeasured but stable influences (Allison, 2005; Angrist & Pischke, 2009, pp. 221–246). For students, unmeasured factors typically include intelligence, personality, aspirations, and motivation. Unmeasured factors also include aspects of SES that were not measured in this study, such as family income and wealth.
First-differences model
The performance of student “i” at time “t” (
At time 1

And at time 2

Taking first-differences

Note that both
Fixed-effects model
The fixed-effects model for students includes an intercept term for each individual student across multiple time points.
Mathematically

NAPLAN and ATAR means and standard deviations by Years 9 and 12 school sector.
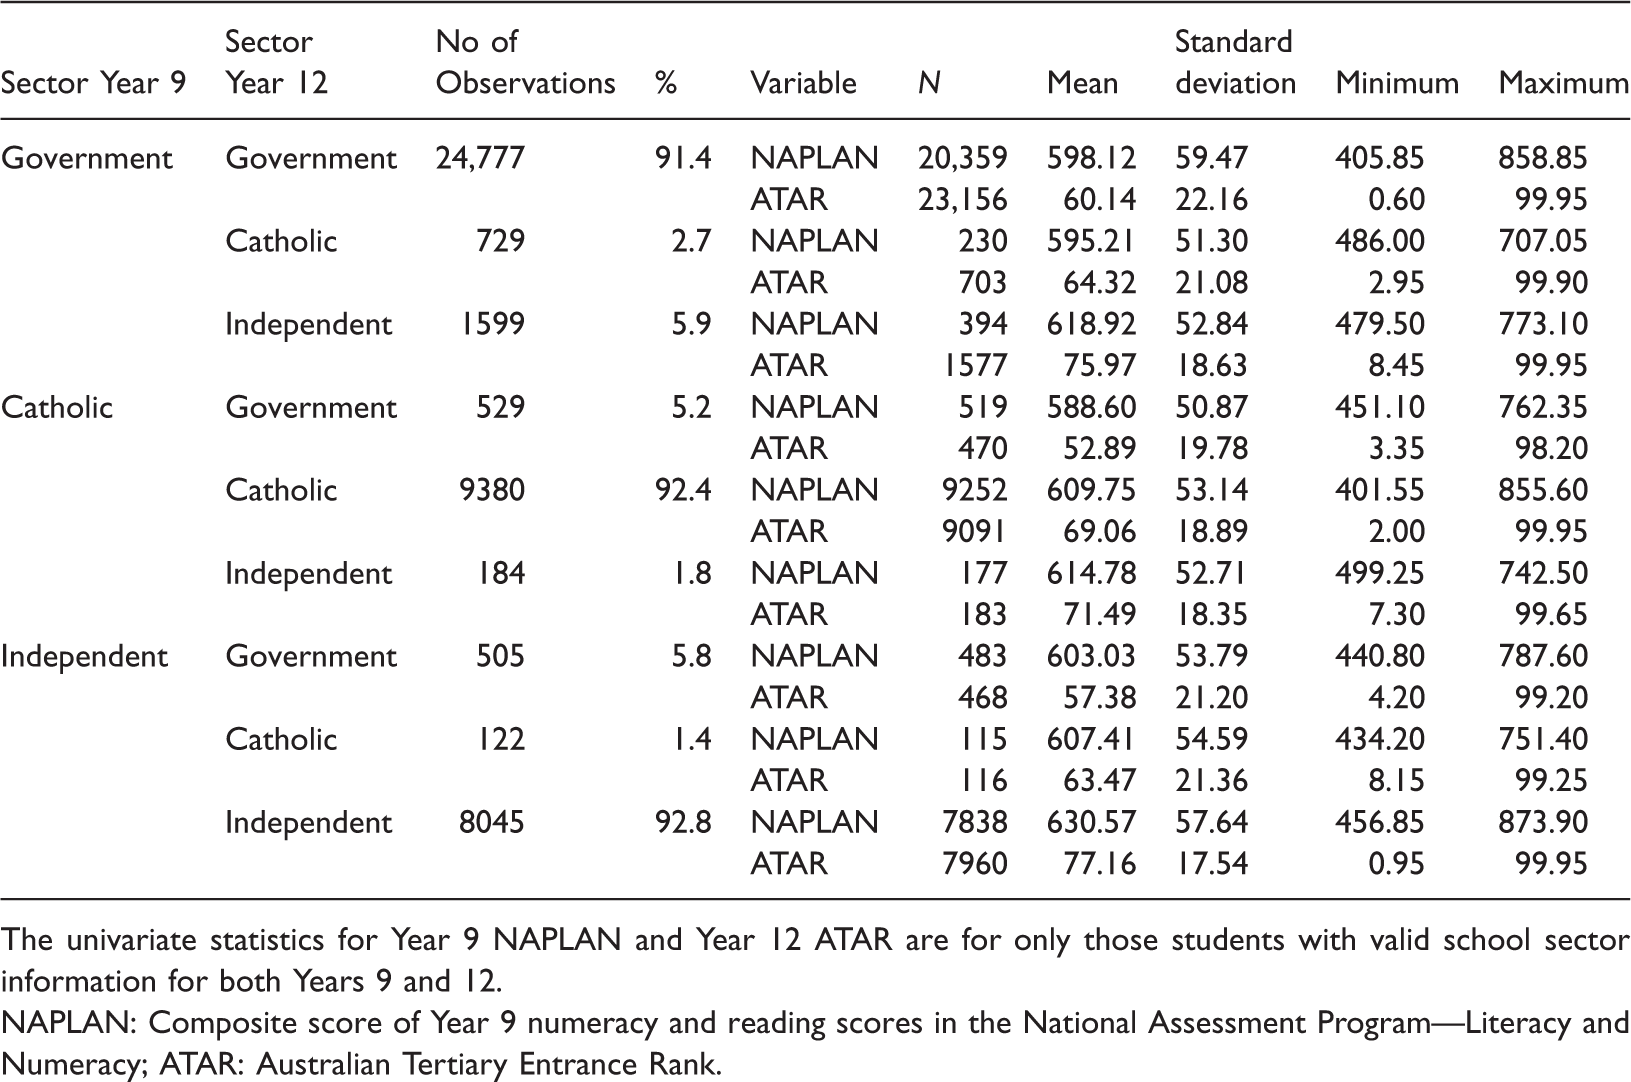
The univariate statistics for Year 9 NAPLAN and Year 12 ATAR are for only those students with valid school sector information for both Years 9 and 12.
NAPLAN: Composite score of Year 9 numeracy and reading scores in the National Assessment Program—Literacy and Numeracy; ATAR: Australian Tertiary Entrance Rank.
Student performance (or
Statistical significance
Although the data analyzed are population data, the Year 9 2008 cohort data can be considered as a sub-population of the population of Year 9 students over a longer time frame. Therefore, statistical significance levels are presented. Generally, the use of statistical inference tests in population data is justified if the population can be considered as generated probabilistically from a super population and to test that the differences observed could be due to “chance processes” (Blalock, 1979, pp. 241–243; Bollen, 1995; Rubin, 1985). These criteria apply to the population data analyzed here.
Results
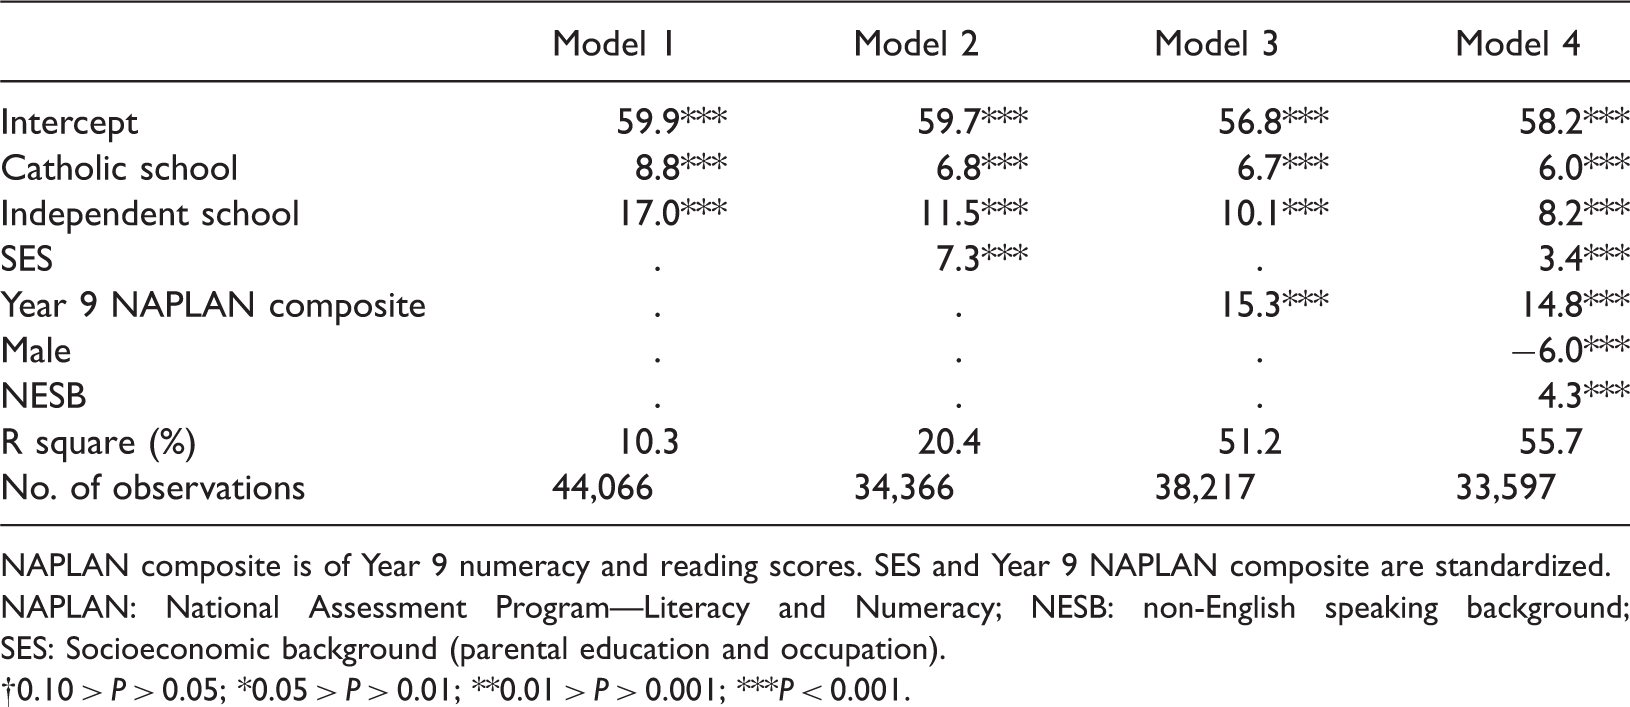
Regression analysis of TEA
Effects on students’ Tertiary Entrance Aggregate.
NAPLAN composite is of Year 9 numeracy and reading scores. SES and Year 9 NAPLAN composite are standardized (Std.).
NAPLAN: Numeracy and reading in the National Assessment Program—Literacy and Numeracy; SES: Socioeconomic background (parental education and occupation); NESB: non-English speaking background.
0.10 > P > 0.05; *0.05 > P > 0.01; **0.01 > P > 0.001; ***P < 0.001.
Performance in NAPLAN is strongly associated with TEA, with a large effect of 23 score units for a one SD difference (0.69 SD). The magnitude of its effect hardly changes with the addition of SES and other variables to the model. 20 Its standardized effect (0.69 SD) is only slightly less than its bivariate correlation with TEA. 21 This indicates that the effects of the NAPLAN composite are not a function of SES. Its addition to the analysis increases the variance explained in TEA to over 50%. With this addition, the effects of SES on TEA are reduced by more than half, from 11 to 5 TEA score units for a one SD difference (0.34 SD and 0.15 SD).
On average, male students average 9 TEA score units less than female students (–0.26 SD) and NESB students average 8 score units higher (0.23 SD), net of SES, and prior achievement. The tests for interaction effects (Models 5 and 6) show that NESB students perform relatively less well in non-government compared with government schools. The magnitudes of the other interaction effects are too small to be important.
Quantile regression of the TEA
Figure 3 displays the quantile estimates with 95% confidence limits on TEA with a model comprising the same predictor variables as in Model 4 in Table 5. The impact of attending a Catholic school (relative to a government school) on TEA is generally constant along the TEA continuum given the fairly wide confidence limits. The impact of attending an Independent school on TEA declines from 13.6 score units at the 5th percentile to about 10.4 score units at the 95th percentile. This moderate difference (a decline of 24%) is statistically significant. The effects of SES are much the same across the continuum, given the wide confidence limits. The effect of prior achievement, which has very narrow confidence limits, increases from the 5th to the 20th percentile and declines slightly after the 80th percentile. The gender difference is much larger at lower quantiles at around negative 10 TEA score points declining to negative 4 at the 95th percentile. In contrast, the NESB effect increases strongly from 4 score units at the 5th percentile to 9 score units at the 95th percentile.
Quantile regression effects of predictor variables on the Tertiary Entrance Aggregate.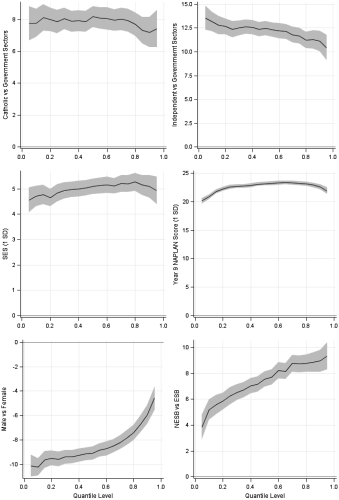
Regression analysis of the Australian tertiary entrance rank
Effects of Year 12 school sector and other factors on students’ Australian Tertiary Entrance Rank.
NAPLAN composite is of Year 9 numeracy and reading scores. SES and Year 9 NAPLAN composite are standardized.
NAPLAN: National Assessment Program—Literacy and Numeracy; NESB: non-English speaking background; SES: Socioeconomic background (parental education and occupation).
0.10 > P > 0.05; *0.05 > P > 0.01; **0.01 > P > 0.001; ***P < 0.001.
According to Model 2, a one SD increase in SES is associated with an increase of 7 ATARs but this effect is halved to a difference of 3.4 ATARs when Year 9 NAPLAN performance and other variables are included in the analysis (Model 4). The impact of Year 9 NAPLAN performance is much larger: a one SD increase in Year 9 NAPLAN performance is associated with an increase of 15 ATARs. The gender difference favouring females is around six ATARs. On average, NESB students score 4.5 ATARs higher than other students.
Effects of school sector status in Years 9 and 12 and other factors on Australian Tertiary Entrance Rank.
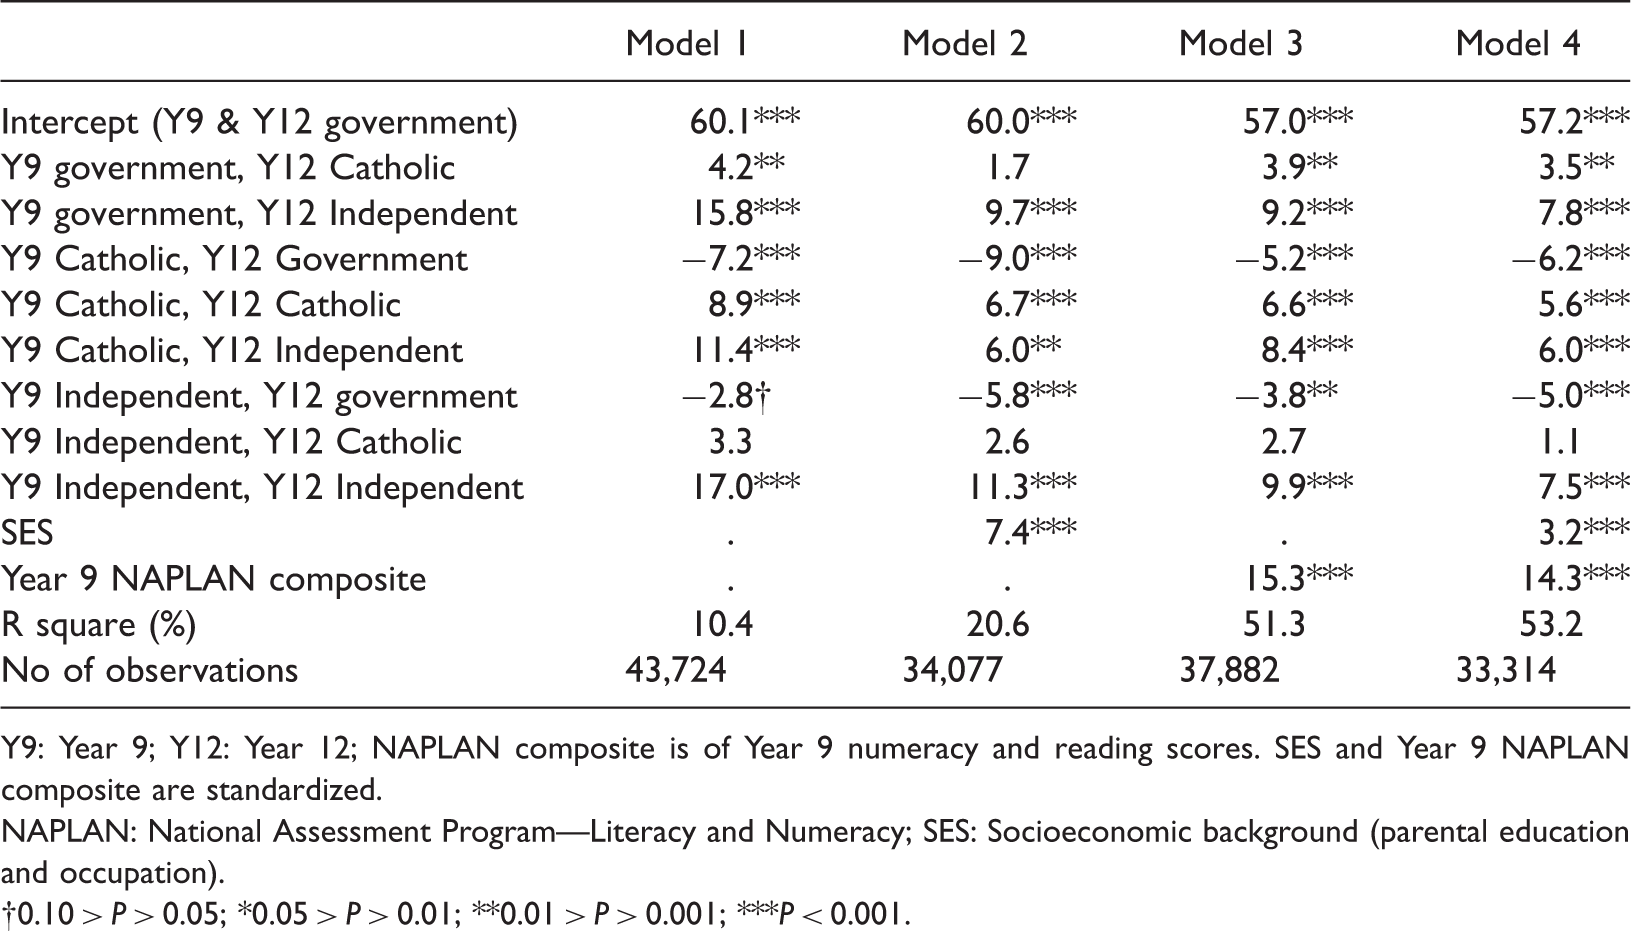
Y9: Year 9; Y12: Year 12; NAPLAN composite is of Year 9 numeracy and reading scores. SES and Year 9 NAPLAN composite are standardized.
NAPLAN: National Assessment Program—Literacy and Numeracy; SES: Socioeconomic background (parental education and occupation).
0.10 > P > 0.05; *0.05 > P > 0.01; **0.01 > P > 0.001; ***P < 0.001.
First-differences and fixed-effects analyses
First-differences and fixed-effects analyses of the effects of school sector on percentile Tertiary Entrance Rank.
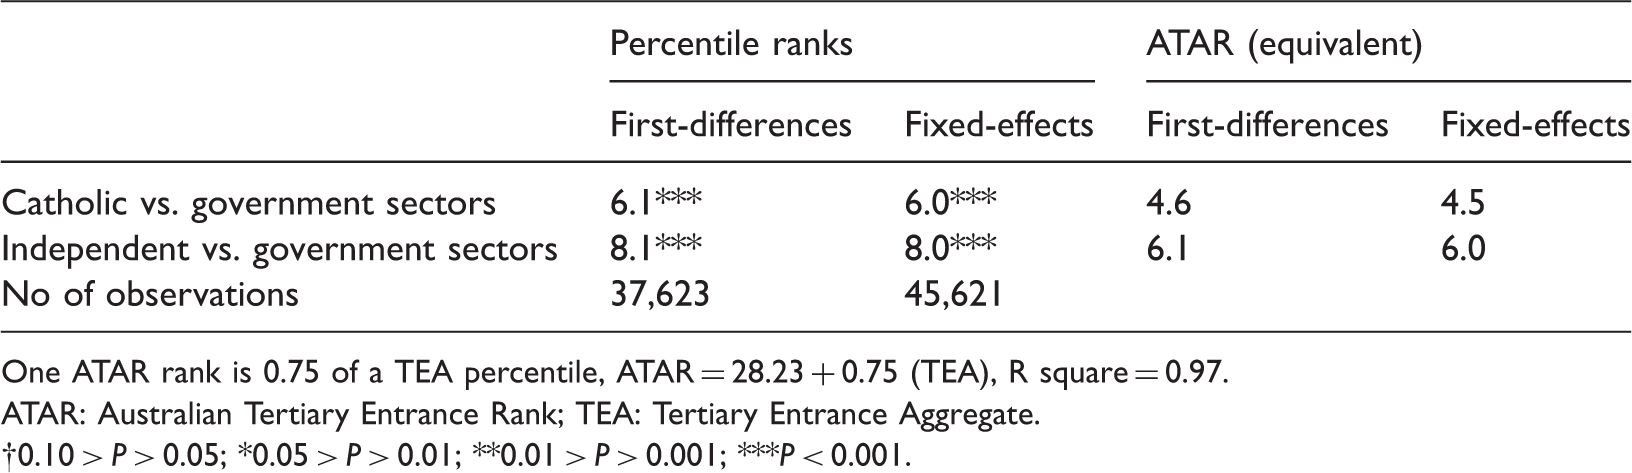
One ATAR rank is 0.75 of a TEA percentile, ATAR = 28.23 + 0.75 (TEA), R square = 0.97.
ATAR: Australian Tertiary Entrance Rank; TEA: Tertiary Entrance Aggregate.
0.10 > P > 0.05; *0.05 > P > 0.01; **0.01 > P > 0.001; ***P < 0.001.
Conclusion and comparison with previous studies
This study shows that attending a non-government school does make a difference to student performance in the final year of secondary school in Victoria. The higher performance of students attending non-government schools cannot be attributed to differences in the intake characteristics of each sector’s students. Instead, increments to performance are found net of SES and prior achievement, and net of observed and unobserved differences between students. Students who move from the government to the non-government sectors between Years 9 and 12 have higher ATARs and those who move from the Catholic and Independent sectors to the government sector tend to show lower ATARs. Unmeasured cognitive and non-cognitive factors contribute to school sector differences but do not account for unexplained school sector differences in tertiary entrance performance. These findings confirm that Catholic and Independent schools “add value” to student performance. The effects are not trivial with effect sizes of 0.24 SD and 0.37 SD, respectively, net of other influences in the multiple regression analysis and differences of 6 and 8 percentiles in the first-differences and fixed-effects analyses.
It is important to note that while this observation regarding value-added effects is made here for performance growth between Years 9 and 12; non-government schools may also add value in the Years up to Year 9. Also, the estimated effects reported here mainly are for mean differences. The independent school sector effect is smaller, but not trivial, towards the top of the performance continuum. Furthermore, the effects of individual schools are distributed around the two school sector estimates; the effects will be larger (or smaller) for some Catholic and Independent schools than the average school sector estimates.
From Table 1, it can be seen that school sector differences are larger in Victoria than in Australia and NSW. The smaller sector differences in NSW are probably due to the large number of selective government schools. NSW has nearly 20 (and in addition, many partially selective schools) compared with only 4 selective schools in Victoria. The estimates for Australia fall in-between since NSW and Victoria are the largest states. Since NAPLAN is now an ongoing feature of the Australian educational landscape, future studies could investigate value-added effects of school sector for tertiary entrance in other states and territories. Where appropriate, such studies should separate selective from non-selective government schools. A second conclusion from the comparison of this with previous studies is that little change over time can be observed in school sector differences in Victoria evidenced by comparing the school sector ENTER medians in 1999 and 2003 with the school sector ATAR medians in this data set.
Table 1 also suggests that the effects of prior achievement are stronger in the present study than in previous studies with the notable exception of the 2010 NSW study where prior achievement was measured by performance in the Year 10 school certificate. The stronger effects (and greater explanatory power) for Year 9 NAPLAN are probably due to the closer relationship between NAPLAN and the high school curriculum than the much simpler achievement tests used in the 1995 and 1998 LSAY studies or that in PISA which uses generic tests independent of the Australian curricula. Consistent with previous studies, the net effects of SES on tertiary entrance performance are very much smaller than that for prior achievement. It is not clear how to best interpret these small, albeit statistically significant, SES effects.
Further research may be able to elucidate the main factors responsible for school sector differences. They may be due to non-government schools having more resources, higher expectations, better teachers, stronger discipline, or a more rigorous curriculum in the latter years of secondary school. Unfortunately, it is likely to be a combination of these and other factors, which complicates policy initiatives designed to improve the relative performance of government school students.
Footnotes
Acknowledgments
This research uses unit record data from the NAPLAN administrative data collection, provided by the Victorian Department of Education and Training (DET). The findings and views reported in this paper are those of the author and should not be attributed to DET, the Victorian Curriculum and Assessment Authority (VCAA), any other branch of the Victorian government or the Victorian Tertiary Admissions Centre (VTAC).
Declaration of conflicting interests
None declared.
Funding
This research received no specific grant from any funding agency in the public, commercial, or not-for profit sectors.