
Abstract
Each year, all Australian students in grades 3, 5, 7 and 9 sit nationwide large-scale tests in literacy and numeracy which have their validity frequently questioned. We compared the performance of grade 3 twins on these large-scale reading tests with their performance on three individually administered literacy tests in comprehension, word reading and vocabulary within a genetically sensitive design. Comprehension, word reading and vocabulary accounted for a substantial amount of the variance in school reading tests. Performance on large-scale reading tests and individually administered tests was moderately to substantially heritable and the same genes contributed to performance in both types of test. These results confirm that large-scale school reading tests measure, at least in part, the literacy skills assessed by individual tests that are frequently considered to be the ‘gold-standard’ in testing. Also, as could be expected, the individually administered literacy tests were more closely related to performance on large-scale reading tests than to performance on large-scale school numeracy tests.
Introduction
In this paper, we intend to contribute to the debate about the validity of the so-called high-stakes testing in Australian schools by reporting on how achievement in those tests relates to performance in alternative measures of literacy. We have a database of the test results of 250 grade 3 students in New South Wales (NSW) who completed the literacy assessments of the Basic Skills Test (BST) or its successor, the National Assessment Program: Literacy and Numeracy (NAPLAN). In addition to these assessment results, we have results from a number of well-accepted individually administered (IA) tests of literacy skills for each child that can serve as a validity check for the large-scale, group-administered school results. Further, the children are all members of twin pairs, which allows us to estimate the relative influences of genes and aspects of the environment on individual differences in performance on both individual and large-scale assessments. In brief, we address issues of the validity of large-scale tests and their ‘behaviour–genetics’, meaning we explore the relative influence of genes and the environment on variation in performance – as is explained further below.
These twins were part of a large international study on literacy, for which they were administered the labour-intensive individual literacy tests. Although there are sufficient participants from each of the BST and NAPLAN years for phenotypic analyses – that is analyses of the physically expressed trait – the number of participants within each test type is small for genetic analyses. Hence, we used both tests in our measure of large-scale tests for some of the analyses (see the Method section for further details regarding the combining of these scores). We acknowledge that it would have been more desirable to use data from just one type of large-scale test. However, the availability of these twin-study data represents a unique opportunity to explore the relationship between large-scale reading tests and individual literacy tests within a genetically sensitive design.
In 2008, nationwide assessment in literacy and numeracy began in Australia (Australian Curriculum Assessment and Reporting Authority [ACARA], 2008). The NAPLAN includes standardised tests in reading, writing, language conventions (spelling, grammar and punctuation) and numeracy. Each year, students in grades 3, 5, 7 and 9 from government and nongovernment schools take these tests. For each achievement domain, performance is measured on a common scale from grade 3 to grade 9; this common scale allows for comparisons between cohorts and provides a measure of growth within a cohort over time. The tests are developed with reference to the National Statements of Learning in English and Mathematics, and state and territory curricula (ACARA, 2010a).
Prior to the NAPLAN, statewide testing in literacy and numeracy was implemented in NSW in 1989 in the form of the BST (Masters et al., 1990). Though initially the BST was administered to grade 6 students, by 1996 students in grades 3 and 5 were tested, and performance at each grade level was measured on a common scale (Wasson, 2009). Many hallmarks of the current NAPLAN were already present in the BST. These included comparing performance of a school with a similar school as measured on remoteness, socioeconomic status and percentage of Aboriginal and Torres Strait Islander student enrolments, and providing schools with data and software to link performance and test items with the curriculum and teaching strategies (Wasson, 2009). These characteristics of the assessment and feedback process were intended to identify individuals, classes or schools that were performing below a minimum standard and to assist with teaching resources and support (Masters et al., 1990; Smith, 2005; Wasson, 2009).
Even though NSW now has a 25-year history of large-scale assessment in literacy and numeracy, the NAPLAN remains a controversial topic, particularly in relation to the interpretation of results. These tests have relatively few items, and though reliable information can be obtained when the cohort is sufficiently large, results from individuals and small groups, such as classrooms, are easily misinterpreted or overinterpreted (Wu, 2010, 2011). In addition, complaints have been raised of undue pressure on students, teachers and schools, perhaps fuelled by poorly informed responses to the publicly available results online (Athanasou, 2010; Wu, 2011). Criticisms have been made of some test items and questions raised about whether the items actually test the skills intended. For example, the NAPLAN language conventions test requires students to identify and correct spelling, punctuation and tense errors, but Williams (2009) suggests that this does not assess the ability to apply grammatical knowledge in any depth. Willett and Gardiner (2009) analysed the spelling errors of students from both the NAPLAN and dictation tests and found that students scored far better on dictation tests. In NAPLAN, some spelling items present a misspelt word and students are required to write the word correctly. In contrast, to the general pattern of scoring better for diction, Willet and Gardiner found these constructed errors sometimes facilitated the correct spelling of a word. This occurred when the constructed error was not in the part of a word that students were most likely to misspell.
Similarly, question format can assist in solving numeracy problems. In a critique of the grade 9 numeracy tests in 2008, Norton (2009) noted that 57% of Queensland students correctly answered an algebraic problem in multiple-choice format, which was almost double the 29% of correct answers when a similar algebraic problem required a written solution. Continuing to identify and investigate validity errors and misinterpreted results is important to appropriately report on performance and improve future tests. These item-level flaws, assuming that is what they are, open the question of what these large-scale tests measure. Our research does not address issues of individual items, but it does explore whether the results from the large-scale tests converge with well-accepted, individual forms of assessment.
The National Statements of Learning in English describe the reading skill level of grade 3 students as follows: When students read and view texts, they identify the main topic or key information, some directly-stated supporting information, and the order of events. They can draw inferences from directly-stated descriptions and actions (e.g. infer a character’s feelings) and talk about how people, characters and events could have been portrayed differently (e.g. more fairly). They relate their interpretations to their own experiences. (Curriculum Corporation, 2005, p. 5)
Mastery of this level of reading comprehension requires the execution of a range of literacy skills. A proficient reader must have acquired the alphabetic principle, essentially that words are composed of letters that systematically represent phonemes (Byrne, 1998). The ability of a reader to decode regular words must be expanded to include the acquisition of orthographic rules and recognition of irregular words (Ehri, 2005). Skilled readers will execute these basic skills with accuracy and, eventually, fluency. Beyond this, the text must be related to meaning, a process that relies on higher level language skills such as vocabulary and syntax. Deficiencies at any of these levels will undermine reading comprehension, as captured by the Simple View of reading (Hoover & Gough, 1990). Therefore, the validity of the large-scale literacy tests could be approached by assessing the relationship of performance on the large-scale tests with performance on well-established tests of literacy skills that are administered on an individual basis. As further evidence of validity, we would expect the relationship between literacy skills and school reading to be stronger than the relationship between literacy skills and school numeracy. This is the approach we adopt here.
The data in the current analyses are part of the International Longitudinal Twin Study (ILTS), a large study that followed twins from preschool to grade 2 in four countries (Australia, Norway, Sweden and the United States). In the year prior to the start of formal schooling, the twins were tested on preliteracy skills and several aspects of language and cognition including phonological awareness, print knowledge, naming fluency, vocabulary, grammar, morphology, verbal learning and memory and nonverbal IQ (Byrne et al., 2002; Samuelsson et al., 2005). The twins were tested in subsequent years on measures including phonological awareness, word and nonword reading, reading comprehension, spelling, vocabulary and orthographic learning (Byrne et al., 2005, 2006, 2007, 2008, 2009). Along with these literacy measures, the BST data were collected from the ILTS students in NSW from 2003 to 2007 followed by the collection of NAPLAN data from 2008 to 2010, when data collection for the project ceased in Australia.
The BST and NAPLAN each include tests of reading, language conventions, writing and numeracy. We have chosen to focus on the reading and numeracy measures.
These performance data span numerous years and data for the language conventions and writing tests were not combined across the years for a number of reasons. First, from 2003 to 2010, the number of questions in the language conventions tests ranged from 26 to 50, and the number of marks possible in the writing tests ranged from 47 to 70. Second, the marking criteria for the writing tests changed considerably from BST to NAPLAN (see ACARA, 2010b; NSW Department of Education, 2006). Hence, it was inappropriate to combine the language conventions and writing tests into measures of large-scale school tests that spanned from 2003 to 2010. The appropriateness of combining the other measures is explained in the Method section.
One aim of the ILTS was to examine the genetic and environmental influences on the development of literacy from before formal instruction through the early years of school (Byrne et al., 2002). The inclusion of several countries allowed the pattern of genetic and environmental influence on literacy skills to be compared across countries (Byrne et al., 2009; Samuelsson et al., 2007, 2008). However, for the purpose of comparing achievement on large-scale tests with IA tests of literacy, only the Australian students are reported on in this article. Although much information about the relationship of school assessment and other tests of literacy skills can be obtained from a sample of unrelated children, an advantage of analysing data from twins is the ability to estimate how much of the phenotypic relationship would be due to shared genes or shared and unique environments across skills and over time.
The classical twin design compares the relative similarity of identical (monozygotic; MZ) and fraternal (dizygotic; DZ) twins on a trait. The known genetic and environmental relationships between MZ and DZ twins can be used to estimate the amount of variation among individuals that is due to genes (A), the shared or common environment (C) and the unique environment (E). In brief, MZ twins share all their genes and DZ twins share, on average, half of their segregating genes. Within each twin pair that is raised within the same family, there are some environmental influences that are shared, such as family income, common schools, teachers and friends, and some influences are unique to each twin, such as individual illnesses and accidents, different teachers (when twins are separated at school) and separate friends. By comparing the similarity of MZ and DZ twins, it is possible to derive quantitative estimates for the influence of genes, the shared environment and the unique environment on traits. The correlation of MZ twins on a trait is due to both their shared genes and their shared environment, while the correlation of DZ twins is due to a genetic influence that is half that of MZ twins and a shared environment that is the equivalent of the MZ twins. The genetic influence on a trait can be calculated as double the difference in the MZ and DZ correlations (Falconer & Mackay, 1996). The degree to which the DZ correlation is greater than half of the MZ correlation reflects the shared environment. The unique environment is the difference between the MZ correlation and unity (see Plomin, DeFries, Knopik, & Neiderhiser, 2013, for an introduction to the classic twin design methodology).
The genetic analyses from the ILTS have shown that by the time of testing in grade 2, genes explain 67–82% of the variation in performance for most of the literacy measures (Byrne et al., 2009). For the most part, the unique environment (which also includes any error in measurement) explains the remaining variation in performance, with very little influence from sources of shared environment (Byrne et al., 2009). The exception is vocabulary, where genes explain 44% of the variation in performance, with 36% due to the shared environment (Byrne et al., 2009). Given the substantial heritability of these literacy skills that contribute to mastery of reading, a substantial influence of genes on test performance in the school reading tests can be hypothesised.
Using multivariate extensions to the classic twin design, phenotypic correlations can be broken down into how much of the covariation between two traits is due to genes that affect both traits and how much is due to environmental factors (shared and nonshared) that affect both traits. The extent of genetic and environmental overlap is expressed as genetic and environmental correlations. Genetic correlations are independent of univariate heritability; two traits that are each highly heritable can be influenced by different genes and thus would show no genetic correlation. However, when related skills are measured, an overlap in the genetic and environmental factors would be expected. For example, the genetic correlations between word reading and comprehension in the grade 2 sample in the ILTS is 0.88, and the genetic correlations of those skills with vocabulary are 0.36 and 0.46, respectively (Byrne et al., 2009). These moderate-to-high correlations suggest that much of the genetic influence on literacy is shared among the component skills. The fact that these correlations are lower than 1 also suggests some independence in the genes that influence specific literacy skills (Byrne et al., 2009). In this example, the high genetic correlation between word reading and comprehension compared to that of word reading and vocabulary means that if a specific gene was identified as influencing word reading then that gene is highly likely to also influence comprehension, but is somewhat less likely to influence vocabulary. As such, if the large-scale reading tests require students to employ the same literacy skills as are tested by the IA tests, then we would expect substantial overlapping genetic influences among the literacy measures and school reading tests. The analyses reported in this article aim at testing this hypothesis.
To summarise, the first purpose of this article is to explore if the large-scale reading tests of the BST and NAPLAN show convergent validity with IA and well-established tests of literacy skills. We approach this first by analysing if literacy skills as measured by the IA tests are substantial predictors of performance on the large-scale reading tests, and we compare these results with the relationship between the test results from the IA literacy tests and the results on the large-scale numeracy tests. The second purpose is to examine whether the genes that substantially influence performance on the IA tests of literacy skill also influence performance on the large-scale tests, and we compare if this genetic overlap is greater for literacy than for numeracy performance.
Method
Participants
Means and standard deviations of the individually administered (IA) tests for participants who did and did not return results of large-scale tests.
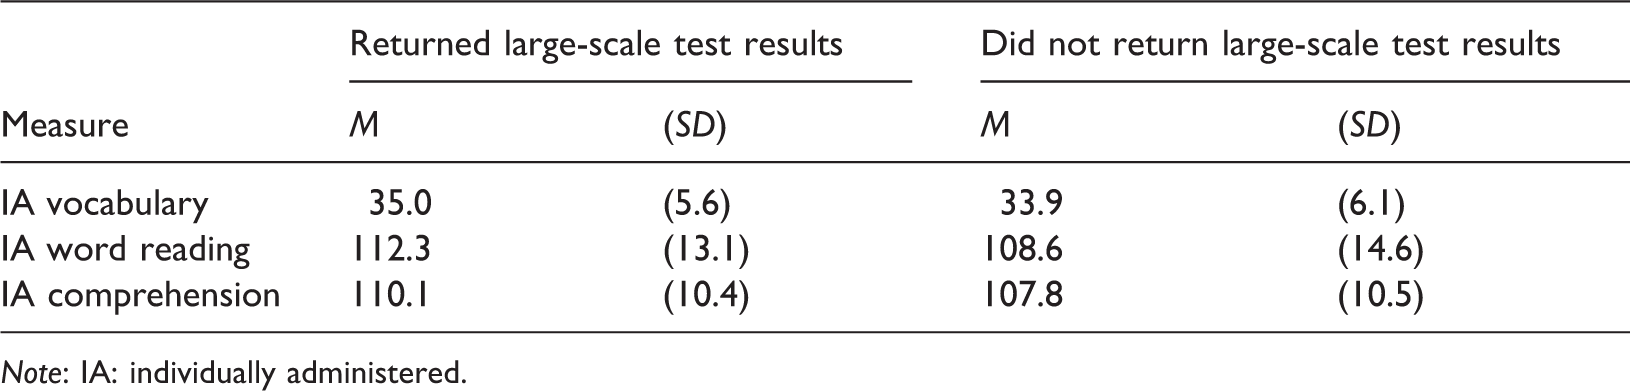
Note: IA: individually administered.
The mean age (SD) in months at the time of the IA literacy tests was 95.5 (4.2). While the BST and NAPLAN tests were administered during different months, no significant difference in the age of participants who sat the BST and the NAPLAN could be observed (mean age (SD) in months 105.5 (3.8) and 104.1 (4.0), respectively). Zygosity was determined by DNA analysis from cheek swab collection or, in a minority of cases, by selected items from the Nichols and Bilbro (1966) questionnaire.
Materials
IA test of word reading
The Test of Word Reading Efficiency (TOWRE; Torgesen, Wagner, & Rashotte, 1999) was used to test word reading efficiency and phonemic decoding. A list of words and a list of nonwords constitute two subtests. The score on each subtest is the number of correctly read items in 45 s. Each subtest has two versions, and both versions of both subtests were administered to each child. Scores were standardised (M = 100, SD = 15). The test manual reports test–retest reliability for children aged 6–9 years of .97 for word and .90 for nonword standardised scores. The average from these four lists was used to obtain a single score for word reading.
IA test of vocabulary
The Boston Naming Test (Kaplan, Goodglass, & Weintraub, 2001) was used to assess vocabulary. This test requires the viewing of 60 concrete pictures that range from common (bed) to rare (abacus) with the score being the number of items correctly named, with a maximum possible score of 60 and an internal reliability of .84 in the whole ILTS sample.
IA test of comprehension
The Woodcock Passage Comprehension from the Woodcock Reading Mastery Test–Revised (Woodcock, 1989) was used to assess reading comprehension. This test is a modified cloze procedure where a short passage with a missing word is read. The child supplies a single word that is suitable to replace the blank in the sentence. The test includes 43 items and scores were standardised (M = 100, SD = 15). The test manual reports a split-half reliability for first grade students of 0.94.
Large-scale reading tests
For both the BST and NAPLAN, students were required to read a range of specially prepared texts and answer questions that asked them to identify or interpret information contained in the texts. Responses were predominantly multiple choice with the occasional short answer. The reported internal reliability of the grade 3 NAPLAN tests in reading from 2008 to 2010 was 0.88–0.89 (ACARA, 2013). For the BST and NAPLAN, the number of questions and maximum raw scores varied from 35 to 38 over the years that these results were obtained. The scaled scores for the NAPLAN were not used, as they are not comparable with the BST scores.
Large-scale numeracy test
The numeracy test of the BST and NAPLAN include questions assessing the aspects of number, measurement and space. Responses were predominantly multiple choice with the occasional short answer. The internal reliability of the grade 3 NAPLAN tests in numeracy from 2008 to 2010 was reported to be 0.87–0.92 (ACARA, 2013). The number of questions was the same each year, with a maximum raw score of 35.
Procedure
The individual literacy skills tests were administered in the school or the home of the twins in a session that lasted about an hour. Two test administrators assessed each twin pair at the same time, one test administrator per child (Byrne et al., 2009).
The large-scale tests were administered in class in line with prescribed, standardised procedures. The BST tests were sat during the first week of August in grade 3, and the NAPLAN tests were sat during the second week of May in grade 3. The test results for each student were forwarded to the research team by parents of the participants.
Data analysis
Our data has eight cohorts of participants, and although the IA literacy tests do not vary from year to year, the large-scale tests do. For those participants who returned the large-scale tests, we have standardised the scores on both the IA literacy tests and the large-scale tests within each year. This was done to control for any cohort effects in the IA literacy tests and to control for any cohort effects or inadvertent differences in test difficulty in the large-scale assessments. This creates a cohort specific, relative score in standard deviation units for each test to be used in the correlation and behaviour genetic analyses, where it is the relationship between variables for individuals or for twin pairs that is of interest and not the mean scores. Scores were adjusted for age and sex; outliers were truncated at ± 3.
To account for nonindependence within twin pairs, for the phenotypic correlations, the Griffin and Gonzalez’s (1995) formula was implemented to adjust the degrees of freedom when evaluating significance. The regression analyses involved multilevel modelling with restricted maximum likelihood to derive the estimates. Multilevel models with dyads have the individual at level 1 and the dyad at level 2 (Kenny, Kashy, & Cook, 2006). With only two units at level 1, the slopes are constrained to be equal across dyads, while the intercepts can vary; the nonindependence within dyads is modelled in the variation of these intercepts and the variation of the slopes is part of the error variance. This leaves two random effects to be estimated, the dyad covariance (sdd) and the error variance (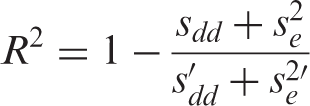
Pearson’s correlations between BST, NAPLAN and the individually administered literacy (IA) tests.
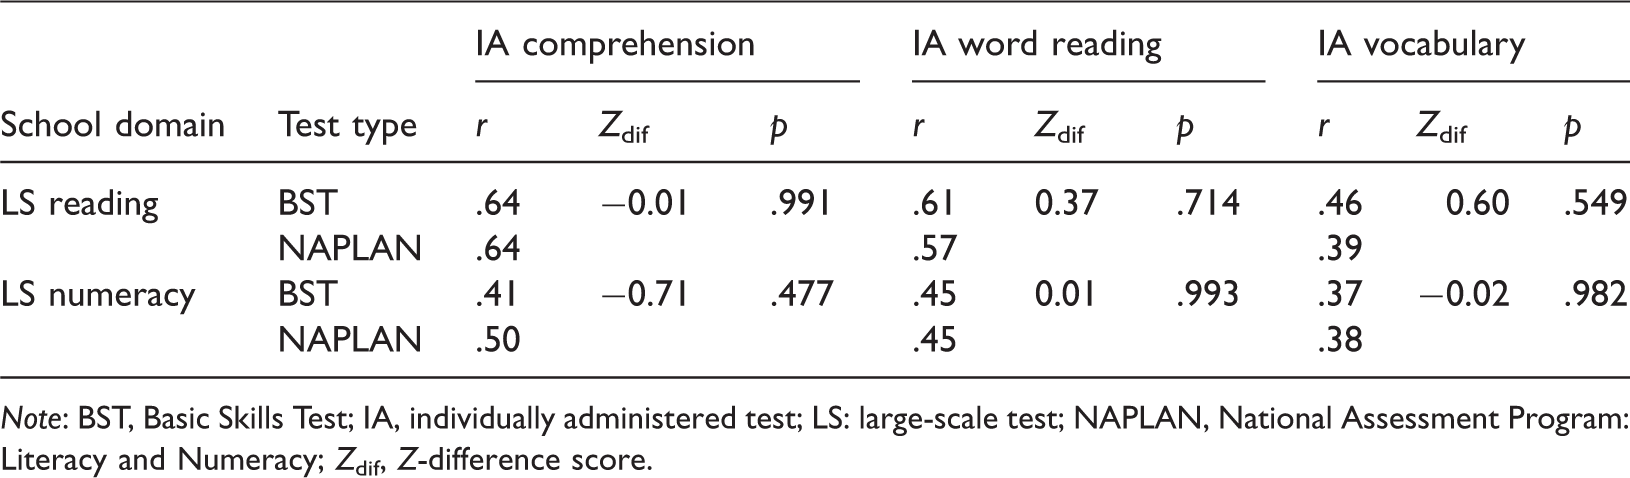
Note: BST, Basic Skills Test; IA, individually administered test; LS: large-scale test; NAPLAN, National Assessment Program: Literacy and Numeracy; Zdif, Z-difference score.
As can be seen, the correlations between the BST reading scores and the IA literacy scores were within .07 of the NAPLAN reading scores. The correlations between the BST numeracy scores and the IA literacy scores were within .09 of the NAPLAN numeracy scores. The difference in BST and NAPLAN correlations was tested using Z-difference scores (as per Field, 2013) with the degrees of freedom adjusted for nonindependence between twins (see Table 2). None of the correlations were significantly different with an alpha of .05. As well as correlations, we used multilevel models to check potential differences in the amount of variation that was explained by the three IA literacy tests in BST and NAPLAN reading. These three IA literacy tests predicted 50% and 46% of the variance in BST and NAPLAN reading, respectively. With numeracy, the three IA literacy tests predicted 26% and 30% of the variance in BST and NAPLAN, respectively. As such, the relationship between the IA literacy tests and the BST closely resembled that of those same literacy tests with the NAPLAN. Therefore, the scores (standardised within year) from the BST and NAPLAN were combined into a single score for each of the domains of reading and numeracy. At this point, any variance in scores that is systematically due to the type of test (i.e. BST or NAPLAN) will contribute to error variance in our genetic analyses. To remove this error variance from the genetic analyses, test type was covaried out.
Results
Phenotypic analyses
Phenotypic correlations among the individually administered literacy (IA) tests and the large-scale (LS) tests.
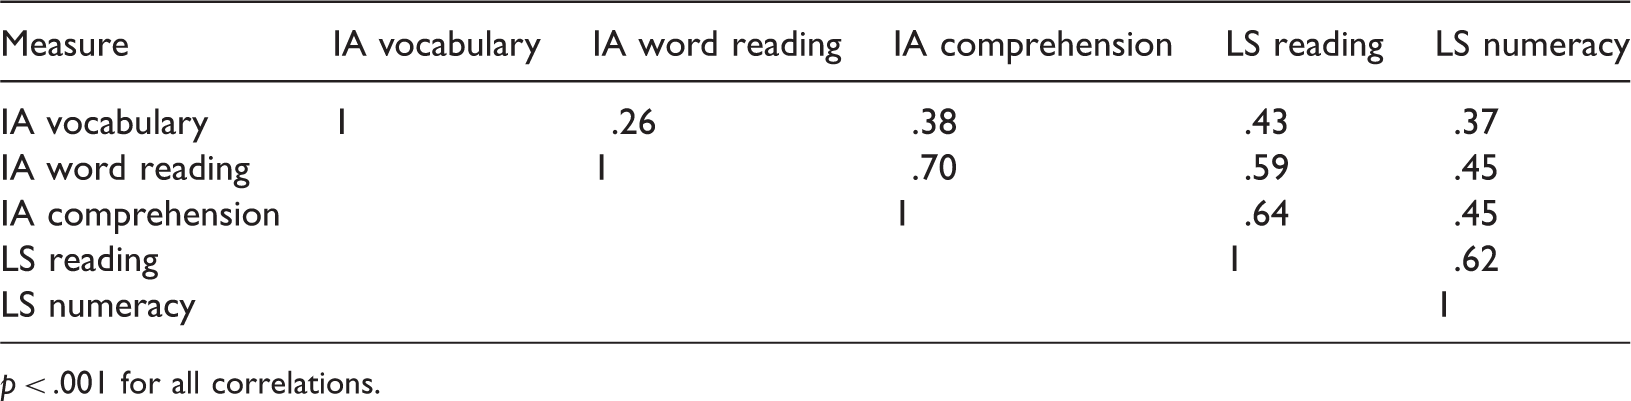
p < .001 for all correlations.
Multilevel regression model predicting performance on large-scale (LS) tests from individually administered (IA) literacy tests.
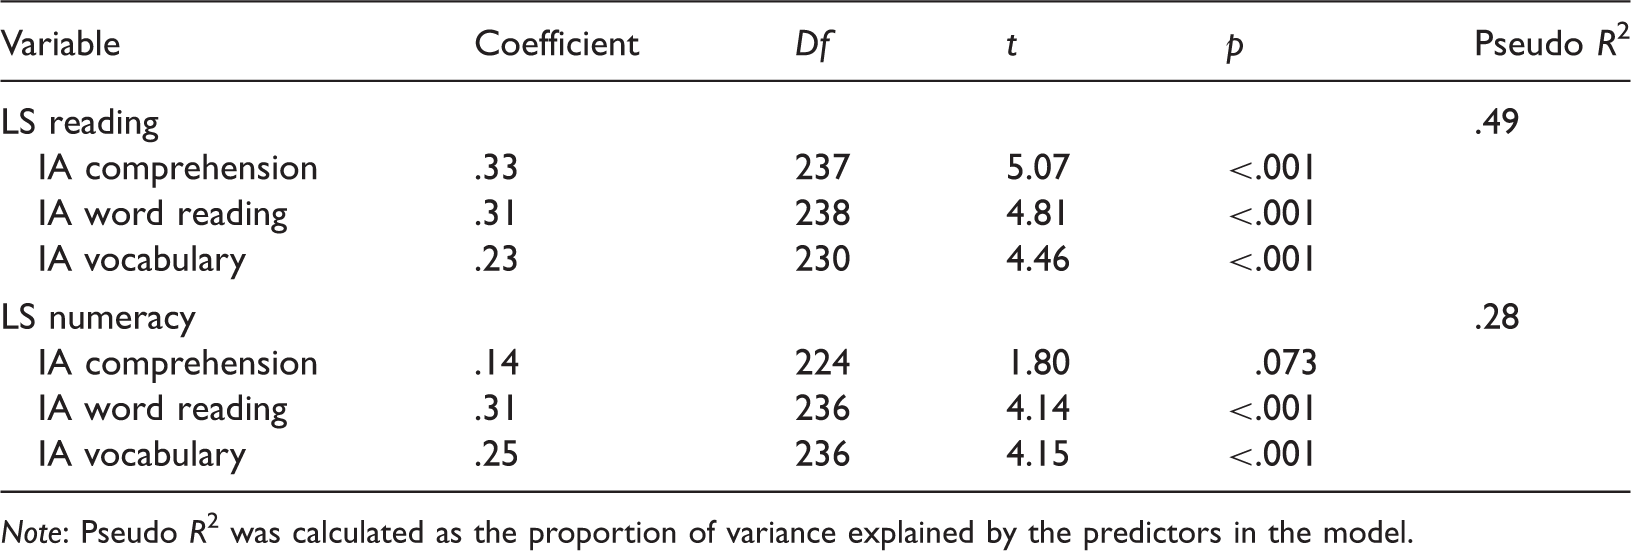
Note: Pseudo R2 was calculated as the proportion of variance explained by the predictors in the model.
Although still substantial at 28%, the IA literacy tests accounted for considerably less variation in numeracy as assessed by the large-scale tests. Interestingly, the unique contributions of IA word reading and IA vocabulary to predicting differences in large-scale numeracy performance were as substantial as their contribution to predicting performance in reading on the large-scale test.
Behaviour–genetic analyses
Intraclass twin correlations and proportion of variance due to genes, shared environment and unique environment for individually administered (IA) literacy tests and large-scale (LS) reading and numeracy tests.
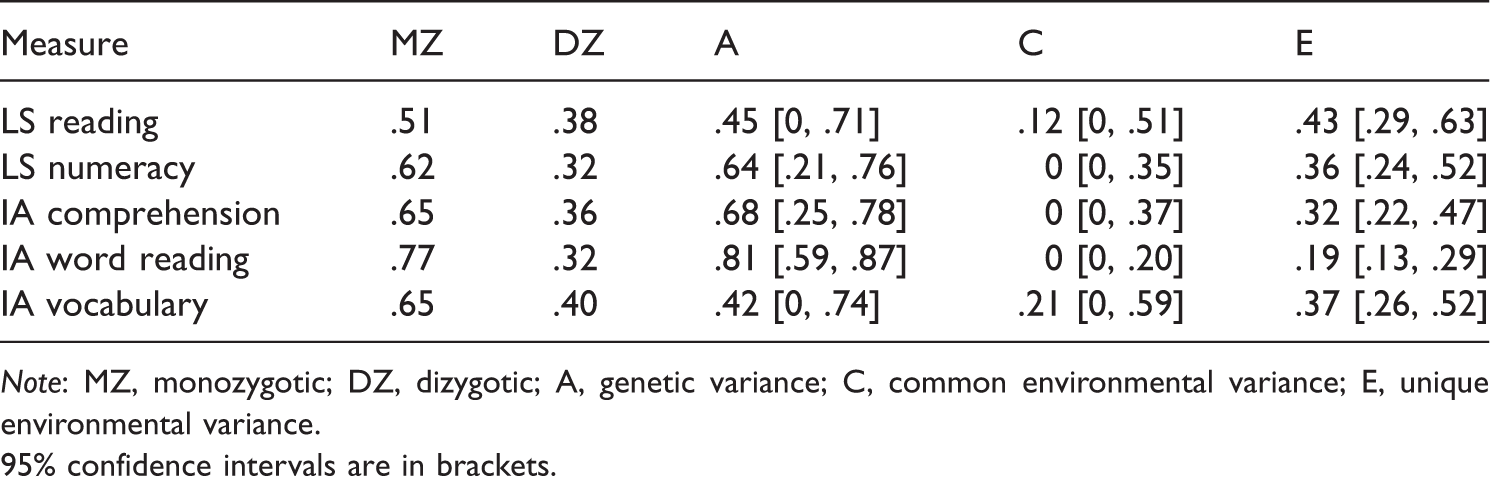
Note: MZ, monozygotic; DZ, dizygotic; A, genetic variance; C, common environmental variance; E, unique environmental variance.
95% confidence intervals are in brackets.
Genetic and unique environmental correlations between individually administered (IA) literacy tests and large-scale (LS) reading and numeracy tests.
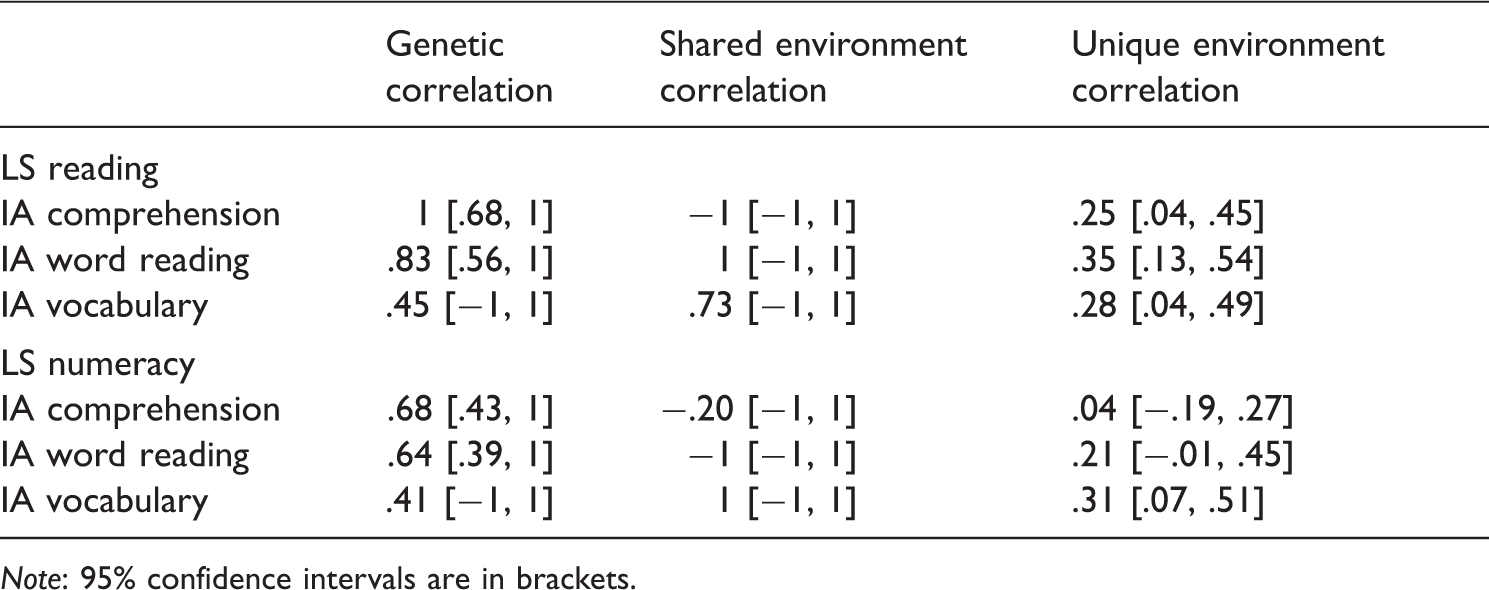
Note: 95% confidence intervals are in brackets.
The genetic correlations are high between performance on the large-scale reading tests and on the IA tests that assess the literacy skills. The genetic correlation between large-scale reading and IA comprehension is very high, being reported here at unity, essentially meaning that the genes that influence comprehension as assessed by the IA test also influence reading as assessed by the large-scale tests. The rest of the genetic correlations are high but not all-inclusive, indicating there are genes that contribute to performance on large-scale reading tests that do not also contribute to the individually assessed literacy skills of word reading or vocabulary.
The unique environmental correlations between the IA literacy skills and large-scale reading performance are considerably smaller than the genetic correlations. The unique environment variance estimates include any measurement error, which, by definition, does not correlate across measures. Therefore, unique environment correlations are evidence that the environmental variance is not solely due to measurement error. That is, the unique environmental correlations indicate specific factors in the unique environment that contribute to both performance on IA literacy tests and large-scale reading tests. However, the data analysed in this article do not allow the identification of those factors.
Similar to performance on large-scale reading tests, performance on large-scale numeracy tests also shared moderate-to-high genetic correlations with the IA literacy tests, indicating substantial overlap in the genes that influence performance on large-scale numeracy tests and on these IA tests of specific literacy skills. Again, some overlap in the environmental factors contributed to performance on large-scale numeracy tests and IA word reading and large-scale numeracy performance and IA vocabulary.
Discussion
Our principal aim in this article was to contribute to the dialogue on the validity of large-scale school assessment tests in Australia. We assessed if student performance on reading tests administered on a large scale converged with student performance on IA tests of literacy skills. We chose to explore this relationship with both phenotypic and behavioural genetic analyses.
Performance on the IA literacy skills tests accounted for 49% of the variation in performance on large-scale reading tests. Although the remaining variation in performance on large-scale reading tests needs to be explained, it is worth noting that our estimates are comparable in size to the amount of variance explained by IA word reading and listening comprehension in several widely used reading comprehension tests (Keenan, Betjemann & Olson, 2008). Furthermore, the correlations among different measures of reading comprehension are often quite modest (Cain, Oakhill, & Bryant, 2004; Keenan et al., 2008). As such, our findings are consistent in that they show that reading as assessed in large-scale tests taps into some of the same literacy skills that are measured by the IA tests. Note also that this relationship between performance on large-scale reading tests and the IA literacy skills tests is not driven exclusively by any one skill. Each of the literacy skills measured (i.e. comprehension, word reading and vocabulary) contributes uniquely to the variation in performance on the large-scale reading tests, suggesting that performance in reading tests is best predicted by a composite of the literacy skills as measured by the IA tests.
In contrast with school reading, performance on the IA literacy tests account for less variation in school numeracy. Literacy skills still do account for a substantial amount of variation in numeracy, almost 28%. A certain amount of overlap between literacy skills and numeracy is a realistic finding, given that the numeracy test requires reading of the test items and that there is extensive support in the literature for covariation in performance across academic domains (Hart, Petrill, Thompson, & Plomin, 2009; Helwig, Rozek-Tedesco, Tindal, Heath, & Almond, 1999; Kovas, Harlaar, Petrill, & Plomin, 2005). Taken together, these phenotypic results provide some evidence that large-scale reading tests preferentially assess the literacy skills that are thought to underpin reading comprehension.
The heritability estimates of performance on large-scale tests of reading and numeracy are moderate and consistent with the estimates obtained from studies conducted in the United Kingdom and the United States (Harlaar, Dale, & Plomin, 2007; Harlaar, Hayiou-Thomas, & Plomin, 2005; Hart et al., 2013; Oliver et al., 2004; Petrill et al., 2012). The heritability estimates of the literacy skills are also in line with larger studies, with a lower estimate for vocabulary than for comprehension and word reading (Harlaar et al., 2010). Moreover, the estimates of this subsample of Australian students who provided information on their large-scale test results were very close to the heritability estimates from the full ILTS sample at grade 2 for word reading (.82), vocabulary (.44) and comprehension (.67; Byrne et al., 2009).
Given that our purpose is to explore if there is convergence in performance on the IA and the large-scale tests, we need to break down the heritability and environmental variance estimates further. Specifically, if the large-scale reading test is tapping into and assessing skills that are also measured by the IA literacy tests, then this would be evidenced, in part, by common influences of genes and environmental factors. The high genetic correlations between performance on the large-scale reading test and the IA literacy tests indicate that common genes influence performance on both types of tests. This particularly applies to the correlation between the large-scale reading and IA comprehension tests. However, common genes can affect multiple academic domains. There is evidence for substantial overlap in genes across academic domains (Kovas et al., 2005; Plomin & Kovas, 2005; Plomin, Kovas, & Haworth, 2007), which was supported by the moderate-to-high genetic correlations among performance on the large-scale numeracy test and the IA literacy skills that emerged in our analyses.
Of particular interest in our data are the unique environmental correlations among the IA literacy tests and school reading. If the unique environment is genuinely influencing performance in the IA literacy tests and those same literacy skills are being tapped by school reading, then we would expect some positive unique environmental correlations. The unique environmental correlations between reading and the literacy skills indicate that there are environmental factors that contribute to both school reading and the underlying literacy skills. The substantial genetic and unique environmental correlations between school reading and the literacy skills support the phenotypic findings that a portion of performance in school reading is capturing those component literacy skills. Furthermore, this relationship between the component literacy skills is considerably stronger with school reading than school numeracy.
Limitations
The greatest limitation with our study is a consequence of using a subsample of a larger study. The sample size for our genetic analyses is small, evident in the large confidence intervals around many of the parameter estimates. However, the parameter estimates are very similar to those found in much larger studies on similar measures, such the Twins Early Development Study in the United Kingdom (Harlaar et al., 2007; Haworth, Kovas, Petrill, & Plomin, 2007), which gives us more confidence in the estimates of this small sample. The sample is also limited in its representativeness for a number of reasons. First, the students were all sampled from the Sydney metropolitan area and are from families who have registered to participate in twin studies. As such they are unlikely to be representative of Australian school students. Indeed, when compared to the national reports on the NAPLAN at least three quarters of our NAPLAN students were performing above the NSW average. Second, only those participants in the full ILTS study who sent in results of large-scale assessments were included in this paper. Those from the grade 2 ITLS assessment who returned this information and who are included in this paper performed, on average, slightly better in the IA tests than those who did not return results from large-scale tests, although given the small differences between groups, it seems unlikely that the lack of participation is driven by very poor results in the large-scale tests. Moreover, the heritability estimates at grade 2 in the full ILTS sample were very close to the estimates in this subsample of Australian students who returned results of the large-scale tests. This lends support to the subsample in these analyses being representative of the ILTS sample as a whole.
Conclusions
One key finding was that a few IA tests of component literacy skills accounted for a reasonable amount of variation in performance on large-scale reading tests. The effectiveness of these literacy skills at predicting performance on large-scale tests was greater for reading than for numeracy. These results indicate that large-scale reading tests are preferentially testing, to some extent, a student’s reading skills as assessed by well-accepted IA tests of component skills. In contrast to some reports in newspapers, these large-scale tests are not simply measures of student anxiety regarding exams, or their ability to colour in multiple-choice bubbles (Coulson, 2011).
Still, the results reported in this article are not evidence that the results from large-scale tests are sufficiently accurate for all the purposes for which parents, schools or politicians attempt to use them. As is the case with any test, the validity of large-scale tests does not rest solely on their measurement characteristics but also on an accurate and appropriate interpretation of their results.
The other key finding is that performance on these Australian large-scale reading and numeracy tests are heritable to about the same degree as other measures of literacy and numeracy, whether IA (e.g. Byrne et al., 2009) or based on teacher assessment (e.g. Harlaar et al., 2007), from a variety of studies and countries. This evidence further supports the validity of the BST and NAPLAN.
Footnotes
Acknowledgements
The Australian Twin Registry is supported by an enabling grant from the National Health and Medical Research Council. We thank the Australian Twin Registry, our testers, and the twins and parents involved.
Declaration of conflicting interests
None declared.
Funding
This work was supported by the Australian Research Council [grant numbers DP0663498, DP0770805].