
Abstract
This paper examines changes in demographic and socioeconomic inequalities in student achievement over the school career, and the extent that these inequalities are accounted for by other influences such as, region and socioeconomic background (where appropriate), school differences and prior achievement. The data analysed are from a longitudinal cohort of Victorian government school students in Years 3, 5 and 7 between 2008 and 2012. The most important finding is the dominant influence of prior achievement which substantially reduces demographic and socioeconomic differences. The strong effects of prior achievement hold even after differences between schools and socioeconomic background have been taken into account. Therefore, policy positions and theories of student performance that give primacy to the socioeconomic resources of families when students are at school, or schools themselves, are not supported. The genesis of demographic and socioeconomic inequalities in student achievement occurs prior to Year 3 and point to the importance of factors operating in the preceding years.
Keywords
Introduction
National assessments of educational achievement aim to provide evidence about the levels of student achievement in identified curriculum areas (for example, in the areas of reading and mathematics) for particular grade levels (Postlethwaite & Kellaghan, 2008). Examples include the National Assessment of Educational Progress (NAEP) in the United States, the Key Stages assessment program in the United Kingdom and the National Assessment Program (NAP) in Australia. Ideally, national assessments of student achievement allow schools, teachers and parents to monitor the performance of individual students. Furthermore, national assessments of student achievement provide data on demographic, socioeconomic, school and other differences which can contribute to policy development.
International assessments of student achievement allow comparisons between different educational systems aiming to identify what policies promote both higher achievement and equity. The major international assessments are Trends in International Mathematics and Science Study (TIMSS), Progress in International Reading Literacy Study (PIRLS) directed by the IEA (International Association for the Evaluation of Educational Achievement) and the Organisation for Economic Co-operation and Development's (OECD’s) Program for International Student Assessment (PISA). PIRLS focuses on reading in Year 4, TIMSS on mathematics and science in grades 4 and 8, and PISA on student achievement in reading, mathematics and science of 15 year olds. PIRLS has been conducted on a five-year cycle since 2001, TIMSS on a four-year cycle since 1995 and PISA a three-year cycle since 2000. In TIMSS, PIRLS and PISA, student achievement is measured on scales set at a mean of 500 and a standard deviation of 100.
Not only do national and international assessments monitor student performance and education systems, but student achievement is strongly predictive of subsequent educational and post-school outcomes. Student performance in PISA has strong effects on school completion (or the converse dropping out), student performance in the final year of schooling and post-school study (Marks, 2007, 2010b; OECD, 2010a). This is within the wider literature of the effects of cognitive test scores collected in adolescence or earlier on subsequent educational and labour market outcomes (Jencks et al., 1979; Korenman & Winship, 2000; McIntosh & Munk, 2007; McNiece, Bidgood, & Soan, 2004; Marks, 2014; Marks & McMillan, 2003).
The Australian NAP
Since 2008 the performance of Australian students across a variety of subject areas (or domains) has been measured by the NAP. The program has two components: the annual National Assessment Program in Literacy and Numeracy (NAPLAN) and triennial NAP assessments in Science Literacy, Civics and Citizenship, and Information and Communication Technology (ICT) Literacy. NAP follows separate testing programs conducted by most states and territories. NAPLAN tests, which are the subject of this paper, are conducted each year for all students across Australia in Years 3, 5, 7 and 9. Students in the same year level are assessed on the same test items in the assessment domains of numeracy, reading, writing, spelling and grammar. The assessments are undertaken every year in the second full week in May (ACARA, 2009, p. iv).
The NAPLAN tests are developed collaboratively by the Australian Curriculum, Assessment and Reporting Authority (ACARA), federal, state and territory education departments, and Catholic and independent education authorities. The test administration authority in each state and territory is responsible for delivery of the NAPLAN tests, and for test administration, data capture and reports. The content of the NAPLAN tests broadly assesses the literacy and numeracy skills intended to be developed through the curriculum within the states and territories. In addition, the types of questions and the formats used are familiar to teachers and students across Australia. Protocols for test administration ensure consistency in the administration of the tests by all test administrators and schools across Australia (ACARA, 2010a, p. iv).
The reading, language conventions (spelling and grammar) and numeracy tests consist of a mix of multiple choice items and short answer items. The multiple choice items are of standard format with a number of possible answers (usually four) which require students to select the best answer among the distractors. The short answer items are closed-constructed response items that generally involve a numeric answer, a word or a short phrase. The number of items ranges from 25 for spelling and grammar to between 30 and 40 for reading and numeracy (in Years 3 and 5); while the Year 7 and 9 tests include over 60 numeracy items and between 40 and 50 reading items. All items are dichotomously scored (correct or incorrect). For writing, students across the four-year levels need to write an essay in response to the same prompt. Persuasive writing replaced narrative writing in 2011. In 2008, the scripts were rated based on 10 criteria each comprising between three to seven categories (see ACARA, 2008).
NAPLAN tests are equated so that one year’s results can be compared with those for other years. Equating is the process by which the test items from two or more tests are placed on the same measurement scale. Equating involves selecting a sample of students who sit an additional equating test, as well as their respective grade level test, so that new items can be located on the common scale and used in subsequent years’ tests (ACARA, 2008, 2010b). The logic of modern test theory is that the probability of a student correctly answering a particular item is a function of student ability and the difficulty of the item (Hambleton, Hariharan Swaminathan, & Rogers, 1991). So if the abilities of a sample of students are known, then the difficulties of a new set of items can be calculated.
Each NAPLAN scale describes the development of student achievement from Year 3 through to Year 9 with the scale ranging from 0 to 1000 (called scaled scores). Student scores in each of the five domains across the four-year levels are standardized to have a mean of 500 and a standard deviation of 100. Lower year-level students score lower on the scale for a particular domain than higher year-level students. Scaled scores within a given domain are consistent across Year levels and over-time. For example, a scaled score of 540 in a particular domain has the same meaning in terms of skills and understanding for Year 5 students as Year 3 students, although their position relative to their peers and their expected performance are quite different. Similarly, the same score indicates the same level of skills across calendar years (from 2008). ACARA notes that the scaled scores between domains should not be compared, although the scales are standardized in the same way. Since persuasive writing replaced narrative writing in 2011, ACARA (2011, p. iv) warns that caution is required in comparing persuasive writing in 2011 or 2012 with performance in narrative writing in previous years.
Purpose of present study
The purpose of this study is to examine demographic and socioeconomic inequalities in student achievement between Years 3 and 7. Specifically, this paper examines:
Gender, Indigenous, language background, regional and socioeconomic inequalities in student achievement in Years 3, 5 and 7. The extent that gender, Indigenous, language background, regional and socioeconomic inequalities change over the school career. The extent that gender, Indigenous, language background, regional differences in achievement can be accounted for by socioeconomic background, region (where appropriate), differences between schools, and prior achievement. The extent that socioeconomic inequalities in student achievement are mediated by differences between schools. The extent that the effects of prior achievement on student achievement can be accounted by socioeconomic background and differences between schools.
There are several advantages in analysing NAPLAN data compared with data from other studies. First, student achievement is measured using item response theory techniques which ensure that the test items provide measures of student performance that are as accurate as possible (ACARA, 2008). Second, several domains are assessed for the same year level of students. Third, NAPLAN tests are administered annually to students in Years 3, 5, 7 and 9 allowing the measurement of change over time. Fourth, within each domain, the tests are scored on the same scale so student progress can be more easily ascertained. As regards data from other studies that could be analysed to address the aforementioned issues, PIRLS only assesses reading literacy at the Year 4 level TIMSS only assesses mathematics and science at both Year 4 and Year 8 levels, but scores are not on the same scale across Year levels. PISA which derives tests from a literacy perspective in terms of what students should be able to do in an applied manner rather than test the intended curriculum, tests performance in reading, mathematics and science but of 15-year-old students only. Finally and importantly, while PIRLS, TIMSS and PISA are sample studies, estimates from NAPLAN are from population data so are not subject to the uncertainties associated with sampling.
Background literature
Demographic differences in student achievement
Gender
In most countries, girls perform better than boys in reading but worse in numeracy (Marks, 2008a; Nowell & Hedges, 1998). In a meta-analysis of national and international achievement studies in reading conducted between 1970 and 2002, Lietz (2006) found that female secondary students scored, on average, 0.19 standard deviations higher than their male peers, regardless of age or language of instruction. The gender gap tended to be larger in NAEP assessments, PISA and in more recent national assessments in Australia.
Gender differences in mathematics favouring boys are generally small and declining (Baker & Jones, 1993; Friedman, 1989; Hanna, 2000). More recent comparisons of TIMSS data indicate little change in the gender gap for mathematics (Neuschmidt, Barth, & Hastedt, 2008). Analyses of the PISA data suggest an inverse relationship across countries in the gender gaps for reading and mathematics (Guiso, Monte, Sapienza, & Zingales, 2008; Marks, 2008a; Stoet & Geary, 2013). The authors of the most recent and comprehensive study on the issue conclude that across countries ‘sex differences in mathematics were consistently and strongly inversely correlated with sex differences in reading’ (Stoet & Geary, 2013, Abstract).
There is also evidence that gender gaps increase through the school career. In their review article, Buchmann, Diprete, and McDaniel (2008, p. 322) note a ‘growing male advantage in math scores and growing female advantage in reading scores as they move through school’.
In the PIRLS study of Year 4 students, the gender gap for reading in Australia favouring girls was 17 score points (or 0.17 of a standard deviation). According to the TIMSS study, in Year 4, the gap was in the other direction in mathematics (6 score points), but the difference was not statistically significant (Thomson, Hillman, Wernert, et al., 2012, pp. 19, 43–44).
According to the 2011 TIMSS study, the mean score in mathematics for boys in Year 8 in Australia was 9 score points higher than that for girls, although again the difference was not statistically significant (Thomson, Hillman, & Wernert, 2012, pp. 20–21).
The 2009 and 2012 Australian PISA studies showed gender gaps in reading (among 15-year-olds) were 35 and 37 score points, respectively, (favouring girls) which are only slightly larger than the gender gap in PISA 2000 (33 score points) but larger than that for PIRLS Year 4 students (17 score points). In mathematics, the gender gap (favouring boys) was 10 score points in 2009 and 12 score points in 2012 (Thomson, De Bortoli, & Buckley, 2013, p. 27, 176; Thomson, De Bortoli, Nicholas, Hillman, & Buckley, 2010, p. 55, 124, 181). Therefore, the gender gap in reading favouring girls is probably increasing over the school career and but little change over-time; the smaller gender gap in mathematics favouring boys appears to be stable.
Indigenous students
Indigenous students in Australia perform at a substantially lower level than non-Indigenous students. In the Year 4 PIRLS study, the mean score of Indigenous students for reading was 57 score points lower than that of non-Indigenous student. According to the 2011 TIMSS study of Year 4 mathematics, the difference was 64 score points (Thomson, Hillman, Wernert, et al., 2012, pp. 26, 50–53). A longitudinal study of Indigenous students in primary school found that Indigenous students improved at much the same rate as non-Indigenous students. The gap in average achievement between Indigenous students and their non-Indigenous peers evident at the start of Year 3 remained until the end of primary school (Purdie, Reid, & Buckley, 2011, p. 55). The gap was between 0.7 and 0.9 of a standard deviation (70–90 score points).
In the 2002 TIMSS study of Year 8 students, Indigenous students scored about 85 score points lower than non-Indigenous students in mathematics. The Indigenous–non-Indigenous gap for Year 8 had remained static or possibly increased between 1994 and 2002 (Thomson, 2007, pp. 218–220). In the most recent TIMSS study, the Indigenous–non-Indigenous gap among Year 8 students had declined slightly to 71 score points (Thomson et al., 2012, p. 29).
In the PISA 2000 study, the mean score for Indigenous students was 80 score points lower for reading and science and 85 score points lower for mathematics than non-Indigenous students (Bortoli & Cresswell, 2004, p. 10). A larger study that included Indigenous students from the 2000, 2003 and 2006 PISA studies found an average gap of 82 score points for reading, 80 to 86 for mathematics and 75 for science (Bortoli & Thomson, 2009, p. 11, 25, 41). For PISA 2012, the Indigenous–non-Indigenous gap had increased to 80 points for mathematics from 76 score points in the 2009 PISA assessment. For reading, the gap was 87 score points slightly higher than the 82 score point gap in 2009 (Thomson et al., 2013, p. 52, 185, 201).
Language background
In most countries, immigrant students perform less well than native students. However, this is not the case in Australia. 1 From middle secondary school to the final year of school, students with Language Backgrounds Other than English (LBOTE) tend to increase their performance relative to their peers (Marks, 2010a).
According to PIRLS, in Year 4 LBOTE students exhibited mean scores in reading 18 score points lower than students with an English language background. In TIMSS 2011, Year 8 LBOTE students outperformed English language background students by 17 score points in mathematics although the difference was not statistically significant (Thomson et al., 2012, p. 30). For Year 4 mathematics, the difference was 13 score points but again was not statistically significant (Thomson, Hillman, Wernert, et al., 2012, p. 27, 52).
In PISA 2009 and 2012, LBOTE students exhibited lower scores in reading (16 and 9 score points) but again the difference was not statistically significant. The two groups had similar mean scores in mathematics. Measures of immigrant status based on country of birth showed that foreign born and first generation students had higher scores in both reading and numeracy (Thomson et al., 2013, pp. 39–41, 188–189; Thomson et al., 2010, pp. 67–68, 192–193).
Region
There are also regional differences in student achievement in Australia. In the Year 4 PIRLS reading tests, the mean score for students attending metropolitan schools was 14 score points higher than that for the 27% of students attending ‘provincial’ schools and 56 score points higher than the 1% of students attending remote schools. For Year 4 mathematics in TIMSS, the results were similar. The mean score for metropolitan students was 16 score points higher than that for provincial students and 64 score points higher than for the remote group (Thomson, Hillman, Wernert, et al., 2012, p. 28, 53).
For Year 8 mathematics, metropolitan students scored 27 score points higher than students attending provincial schools and 64 score points higher than students attending remote schools (Thomson et al., 2012, pp. 31–32). In an analysis of the academic achievement in Western Australian students in Years 8 to 10, Young (1996) concluded that students attending rural schools had lower levels of science and especially mathematics achievement even after taking account socioeconomic and social background differences.
Cresswell and Underwood (2004, p. 10) found only small differences in PISA performance between students living in metropolitan and inner regional areas but larger differences (about half-a-standard deviation) between metropolitan and students living in remote or very remote regions. In the 2012 PISA study students attending metropolitan schools scored, on average, 25 score points higher in mathematics than students attending provincial schools. For reading, the difference was 30 score points (Thomson et al., 2013, p. 36, 184). Marks, Underwood, Rothman, and Brown (2011, p. 39, 44) found that students living in the northern and eastern suburbs of Sydney exhibited significantly higher Australian Tertiary Admissions Ranks than students living in other areas of NSW, although the differences declined somewhat when controlling for socioeconomic background and more substantially more when controlling for prior performance.
Socioeconomic inequalities in student achievement
The OECD’s (2007, p. 333) PISA study of 15 year olds routinely constructs broad measures of socioeconomic background denoted as the PISA index of Economic, Social and Cultural Status. For the 2006 PISA study, it comprised the highest of father’s or mother’s occupational status, father’s or mother’s educational attainment, and data from approximately 20 wealth, educational and cultural items. There were similar broad (but not identical) composite measures for the other (2000, 2003, 2009, 2012) PISA studies. In Australia, this broad measure accounted for 11.3% of the variation in student achievement in science in 2006, 12.7% in reading in 2009 and 12.3% in mathematics in 2012 (OECD, 2007, p. 184, 2010b, p. 55, 2013, p. 34). These are equivalent to (multiple) correlations of around 0.35. The magnitude of these measures of association indicate that socioeconomic background is only moderately associated with student achievement.
There are plausible arguments that the association between achievement and socioeconomic background differ by subject domain. Cultural capital theory would imply that subjects with a higher level of cultural content – literature and other humanities – would be more closely associated with socioeconomic background than mathematics or science. Coleman (1975, p. 382) argued that ‘reading achievement is more fully an outgrowth of home influences than are either of the other two subjects (mathematics and science), less a function of what takes place at school’.
The influence of socioeconomic background is not consistently stronger for one type of achievement test compared to others. Using Coleman’s achievement measures, White (1982) reported similar correlations between socioeconomic background and reading and mathematics. Sirin’s (2005, p. 433) meta-analysis reported a larger average correlation for socioeconomic background with mathematics (0.35) than for reading literacy (0.32) or science (0.27). Analysing student achievement in 30 countries using data from PISA 2000, Marks (2008b) found similar amounts of variance explained for reading and mathematics scores (for most countries) for models comprising differing combinations of father’s and mother’s educational attainment and occupational status.
Ability and student achievement
There are both theoretical arguments and empirical evidence for the contention that student performance in achievement tests is strongly related to students’ general cognitive ability.
Cognitive ability and achievement are conceptually similar. In PISA, literacy is defined generally as ‘concerned with the capacity of students to apply knowledge and skills in key subject areas and to analyze, reason and communicate effectively as they pose, solve and interpret problems in a variety of situations’ (OECD, 2007. p. 16). One prominent definition of intelligence is ‘a very general mental capability that, among other things, involves ability to reason, plan, solve problems, think abstractly, comprehend complex ideas, learn quickly and learn from experience’ (Gottfredson, 1997, p. 13). Rindermann (2008, p. 128) maintains there is no important theoretical difference between student achievement and ability tests since they both assess ‘thinking and knowledge’. Similarly, Baumert, Lüdtke, Trautwein, and Brunner (2009, pp. 3–5) points out that like intelligence tests, reading and mathematical assessments involve reasoning and making logical inferences.
There are also sizable correlations between student achievement and measures of cognitive ability. In a meta-analytic study of close to 3000 empirical studies of school learning, Walberg (1984, p. 23) computed an average correlation of 0.71 between various IQ measures and academic achievement. More recently, Duckworth, Quinn, and Tsukayama (2012, p. 443) reported correlations between 0.7 and 0.8 for IQ measured in grade 4, and grade 5 and 9 achievement tests for students attending New York public schools. For New Zealand, the correlation between IQ measured at ages 8 and 9 with academic performance at age 13 was 0.83 (Fergusson, Horwood, & Boden, 2008, p. 285). Gottfredson (2008, p. 554) concludes that cognitive ability correlates also at around 0.8 with performance in standardized academic achievement tests. The correlations between general intelligence (g) extracted from the Armed Services Vocational Aptitude Battery and the Scholastic Assessment Test and the American College Readiness Assessment (ACT) are both around 0.8. Standard intelligence tests show correlations between 0.55 and 0.81 with the ACT (Frey & Detterman, 2004; Koenig, Frey, & Detterman, 2008). Ability also tends to be quite stable across the educational career, from adolescence to adulthood and over the lifespan (see Marks, 2014, pp. 55–56). For Australia, Warren and Haisken-DeNew (2013, p. 21, 24) report that the addition of a preschool measure of what the authors refer to as ‘innate ability’, 2 increased the variance explained in Year 3 student performance (in NAPLAN) from between 11 and 15% (depending on the achievement domain) to about 25%. 3
Baumert et al. (2009) point out that large-scale assessments do not simply measure ability, although general ability is important. They make three points: there are conceptual differences between achievement and ability tests; there is some evidence for separate verbal and mathematical latent dimensions; and different achievement domains have distinct learning and developmental pathways. Carroll’s (1993) well-known hierarchical model of human cognitive ability has general ability at the apex (g), a range of broad abilities at the second level and specific subject-related abilities at the third level.
Data, measures and methods
Data
The data analysed comprise the Victorian government school sector NAPLAN data for Year 3 students in 2008, Year 5 students in 2010 and Year 7 students in 2012. Data from students attending non-government schools were not included in the data supplied. The data include NAPLAN performance, unique school and student identifiers and demographic characteristics of students from enrolment data. Years 3 and 5 are, respectively, the 4th and 6th years of primary school (there is a preparatory year) and Year 7 is the first year of secondary school. Student identification numbers allow linkage of the three data sets creating a longitudinal cohort comprising only students with valid NAPLAN data for at least two of the three years.
Achievement measures
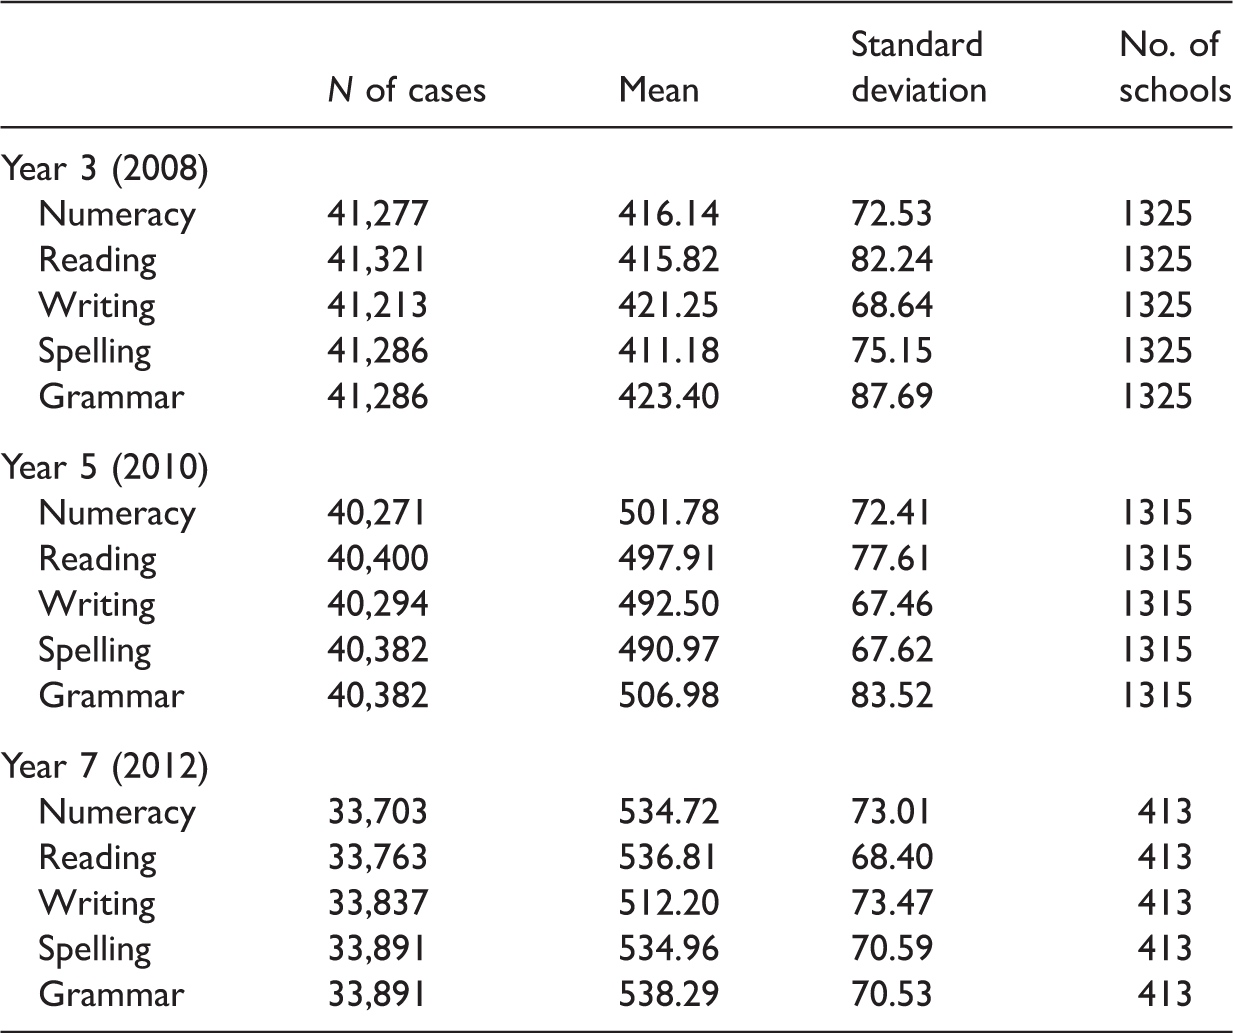
Summary statistics of the achievement domains by year level.
Inter-domain and over-time correlations for student achievement.
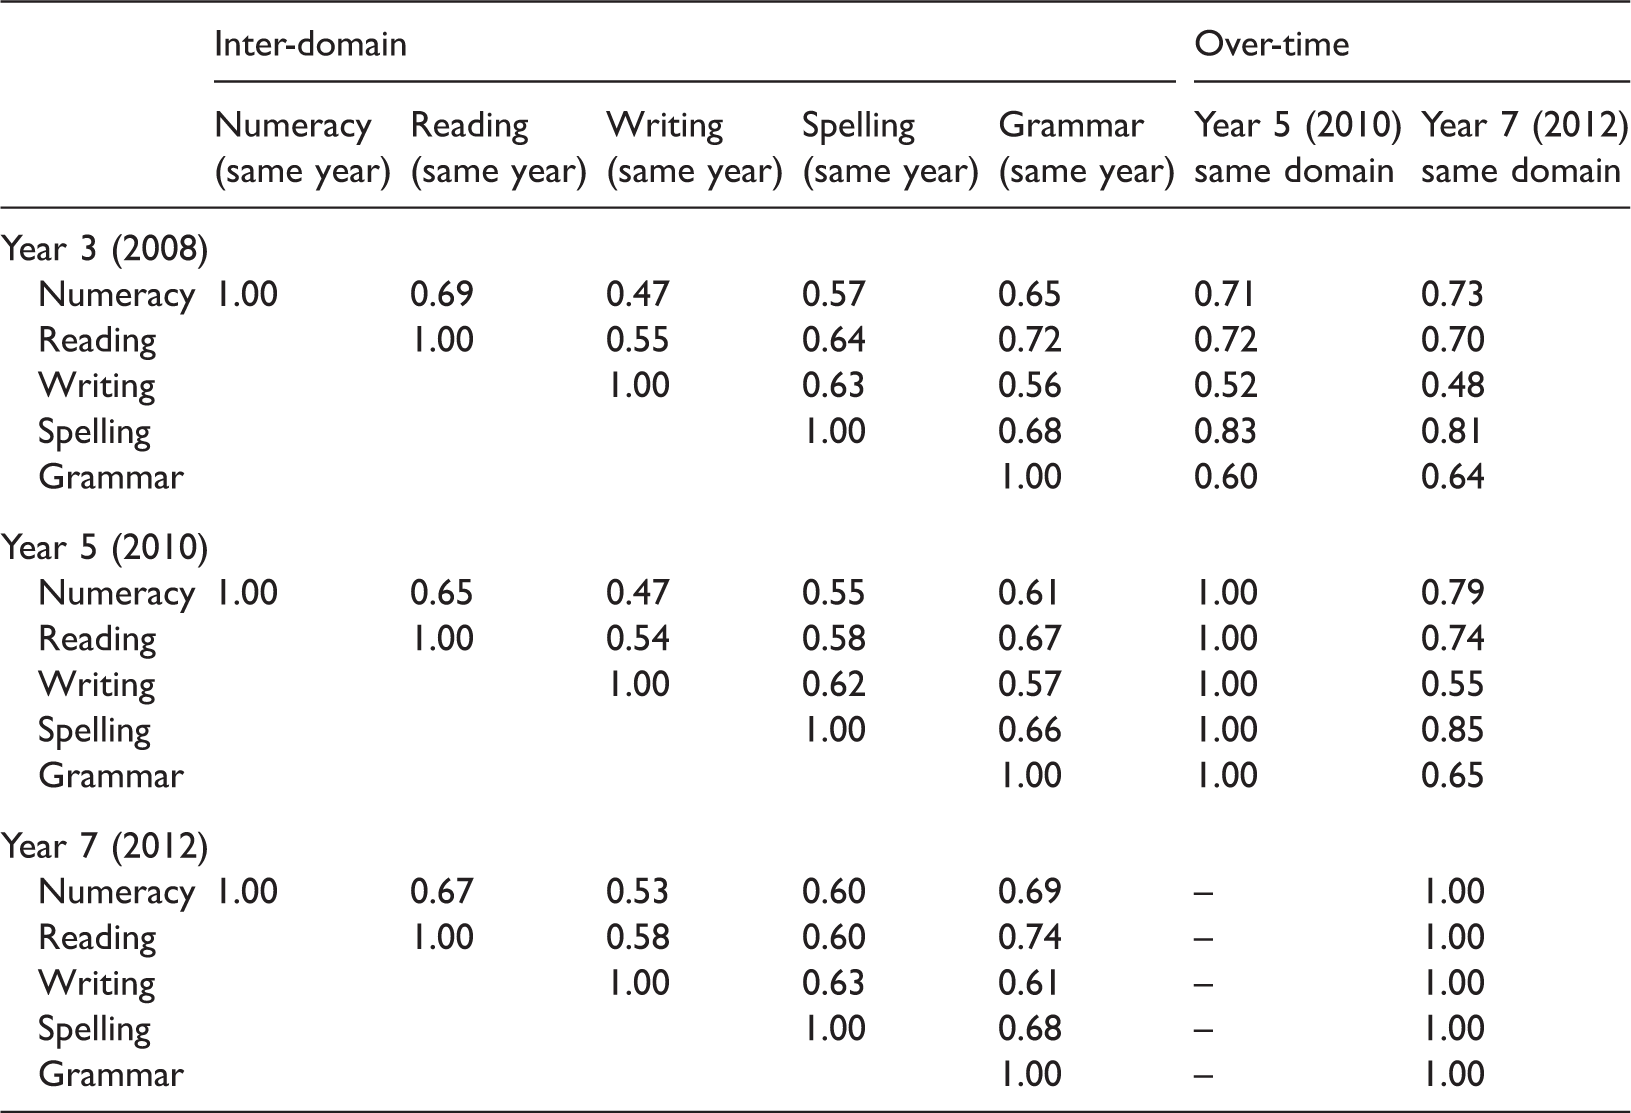
The over-time correlations are even stronger suggesting a high degree of stability in student performance. The over-time correlations for spelling are very strong (r > 0.80), followed by numeracy (0.70 > r > 0.80) and reading (0.70 > r > 0.75), grammar (0.60 < r < 0.65), and writing (0.45 > r > 0.55). There is no evidence that the over-time correlations ‘drop off’ sharply with the time elapsed between tests. The correlations in student achievement between Years 3 and 7 are comparable to, or in some cases larger than, the correlations between tests taken two years apart. The change from narrative to persuasive writing in 2011 is not reflected in lower correlations between persuasive and narrative writing tests than between different narrative writing tests. In fact, the correlation between persuasive writing for the Year 7 students in 2012 with narrative writing when they were in Year 5 in 2010 is slightly stronger (r = 0.55) than the correlation between narrative writing for the Year 5 students in 2010 with narrative writing when they were in Year 3 in 2008 (r = 0.52).
Other measures
The measure of socioeconomic background (SES) used in this study is a composite of parents’ occupation and education. Information on parents’ occupation and education were obtained from enrolment records.
5
The measures of parents’ occupation comprise the following categories:
Senior management, qualified professionals Other business managers associate professionals Tradesmen/women, clerks and skilled office, sales and service staff Machine operators, hospitality staff, assistants, labourers and related workers Not in paid work in last 12 months Not stated or unknown (missing data).
The measures of parents’ education for each parent were constructed from two variables: highest school level attained and post-school qualification resulted in the following ‘years of education’ ordinal measure:
15 Bachelor degree or above
13 Advanced diploma/diploma
12 Year 12 or equivalent
11 Year 11 or equivalent
10 Year 10 or equivalent
9 Year 9 or equivalent or below
Missing data were not included in the education measures.
Parental education and occupation were combined into a sheaf variable (Whitt, 1986). A sheaf variable is a combination of several variables that theoretically relate to the same concept. The variance explained (R square) by a sheaf variable is exactly the same as in an analysis comprising the constituent variables. The first stage in constructing the sheaf variable was to obtain estimates from a regression analysis of combined NAPLAN score on continuous measures of father’s and mother’s education and categorical measures of father’s and mother’s occupation group (including missing data for occupation). The sheaf variable was calculated by multiplying the estimates by the values of parental occupation and education and summing the products for each individual student. The resulting sheaf variables were then standardized to a mean of zero and a standard deviation of one.
Correspondence between local government areas and regions.
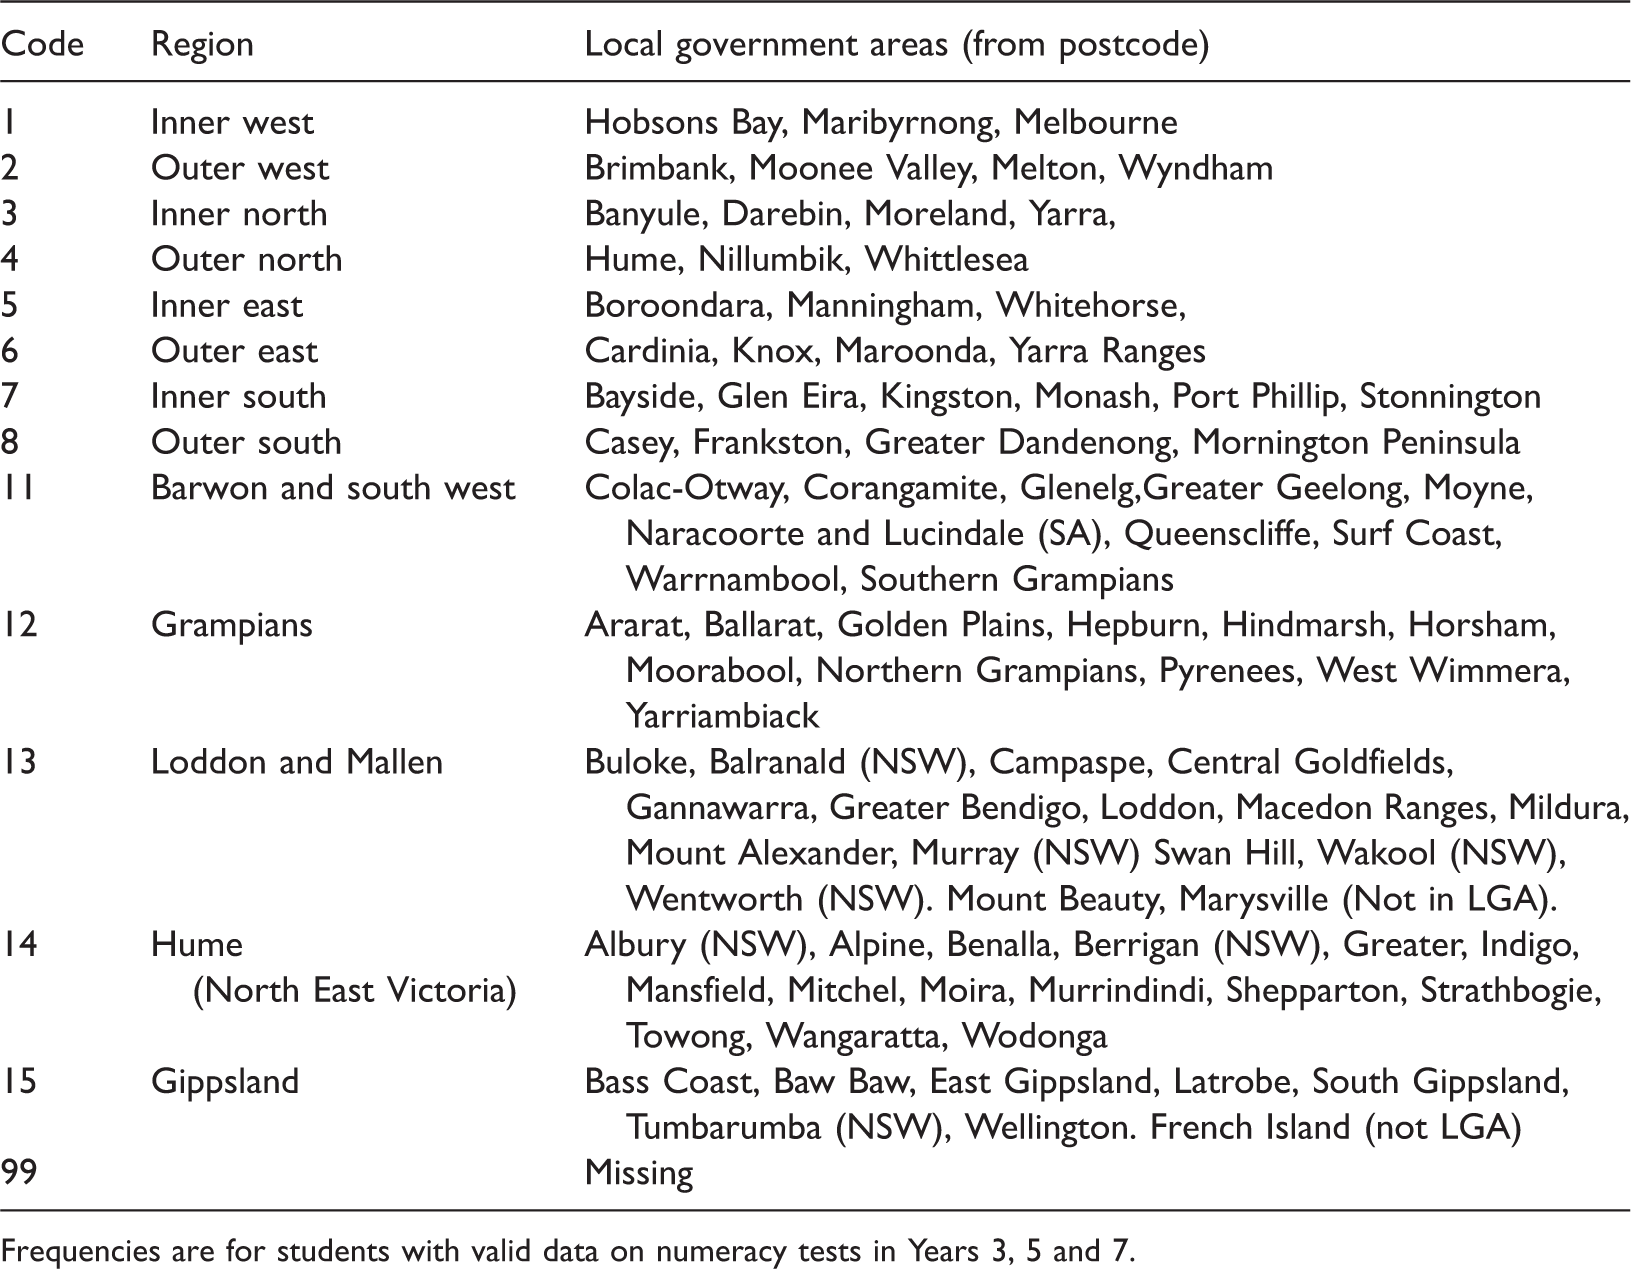
Frequencies are for students with valid data on numeracy tests in Years 3, 5 and 7.
The LBOTE data were based on the administrative field that identifies whether the main language spoken at home was English. Although the LBOTE category is broad, including a great diversity of non-English speaking background students (see Creagh, 2014), the Victorian data only contained dichotomous measures. Schools were identified with standard identification numbers for each NAPLAN test year.
Methods
The data are analysed using multiple regression. The first row in a panel (tables are divided into panels for the separate year) reports the unadjusted (bivariate) regression coefficients. For categorical variables these coefficients are equal to the differences in the mean scores between the reference group and other groups. Subsequent rows report the regression coefficients adjusting for other factors (where appropriate): region, school differences, socioeconomic background or combinations of these variables. The last row for the Year 5 and Year 7 panels present the regression coefficients net of prior achievement in that domain. In multiple regression, the regression coefficient is the predicted change in the outcome variable for a one unit change in the predictor variable, net of the other predictor variables. In other words, it is the effect of the predictor variable on the outcome variable ‘purged’ of its associations (correlations) with the other predictor variables. The ‘purged’ variables are not correlated with each other. This is why the coefficients obtained in multiple regression are commonly referred to as ‘independent’ or ‘net’ effects, or reported as the effect ‘other things being equal’. Only the coefficients for the variables of interest are shown in the tables, not the regression coefficients for the control variables. Note that statistical significance levels are not reported in this paper since the analyses are performed on population data not on data from a sample.
Fixed effect models
Fixed effect models are used to control for the effects of (measured or unmeasured) differences between schools. Fixed effect models are increasingly used in educational research to control for unobserved effects (Blanden & Gregg, 2004; Jæger, 2011; Mouw, 2006). Differences between schools (controlled for by fixed effect models for schools) include resources; staff–student ratios and school size; teacher qualifications, experience, quality and morale; school sub-cultures and anything else that might differ between schools.
Mathematically, the fixed effect model for schools is

Fixed effect models are based on the several of the same assumptions as Ordinary Least Squares regression: the x variables are measured without error; the expectation of the error term is zero; the error is constant for different values of the x variables, the error term is uncorrelated with the intercepts (
Results
Gender
Gender differences in achievement, unadjusted and net of prior achievement for Years 3, 5 and 7.
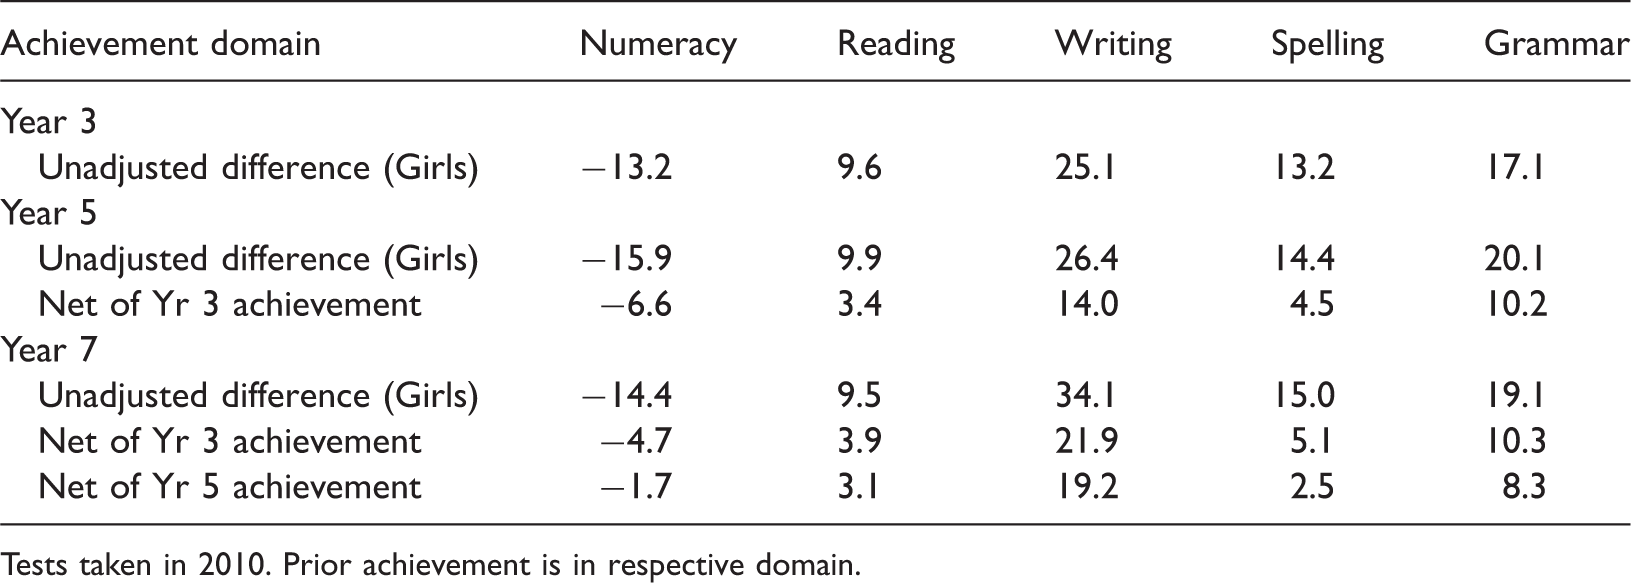
Tests taken in 2010. Prior achievement is in respective domain.
Controlling for prior achievement indicates that the gender gaps in numeracy, reading and spelling largely reflect gender differences in achievement measured two years earlier. The larger net effects for gender on writing and grammar are due to the weaker over-time correlations for writing and grammar (see Table 2).
Indigenous status
Indigenous–non-indigenous differences in achievement, unadjusted and net of region, SES and school differences for Years 3, 5 and 7.
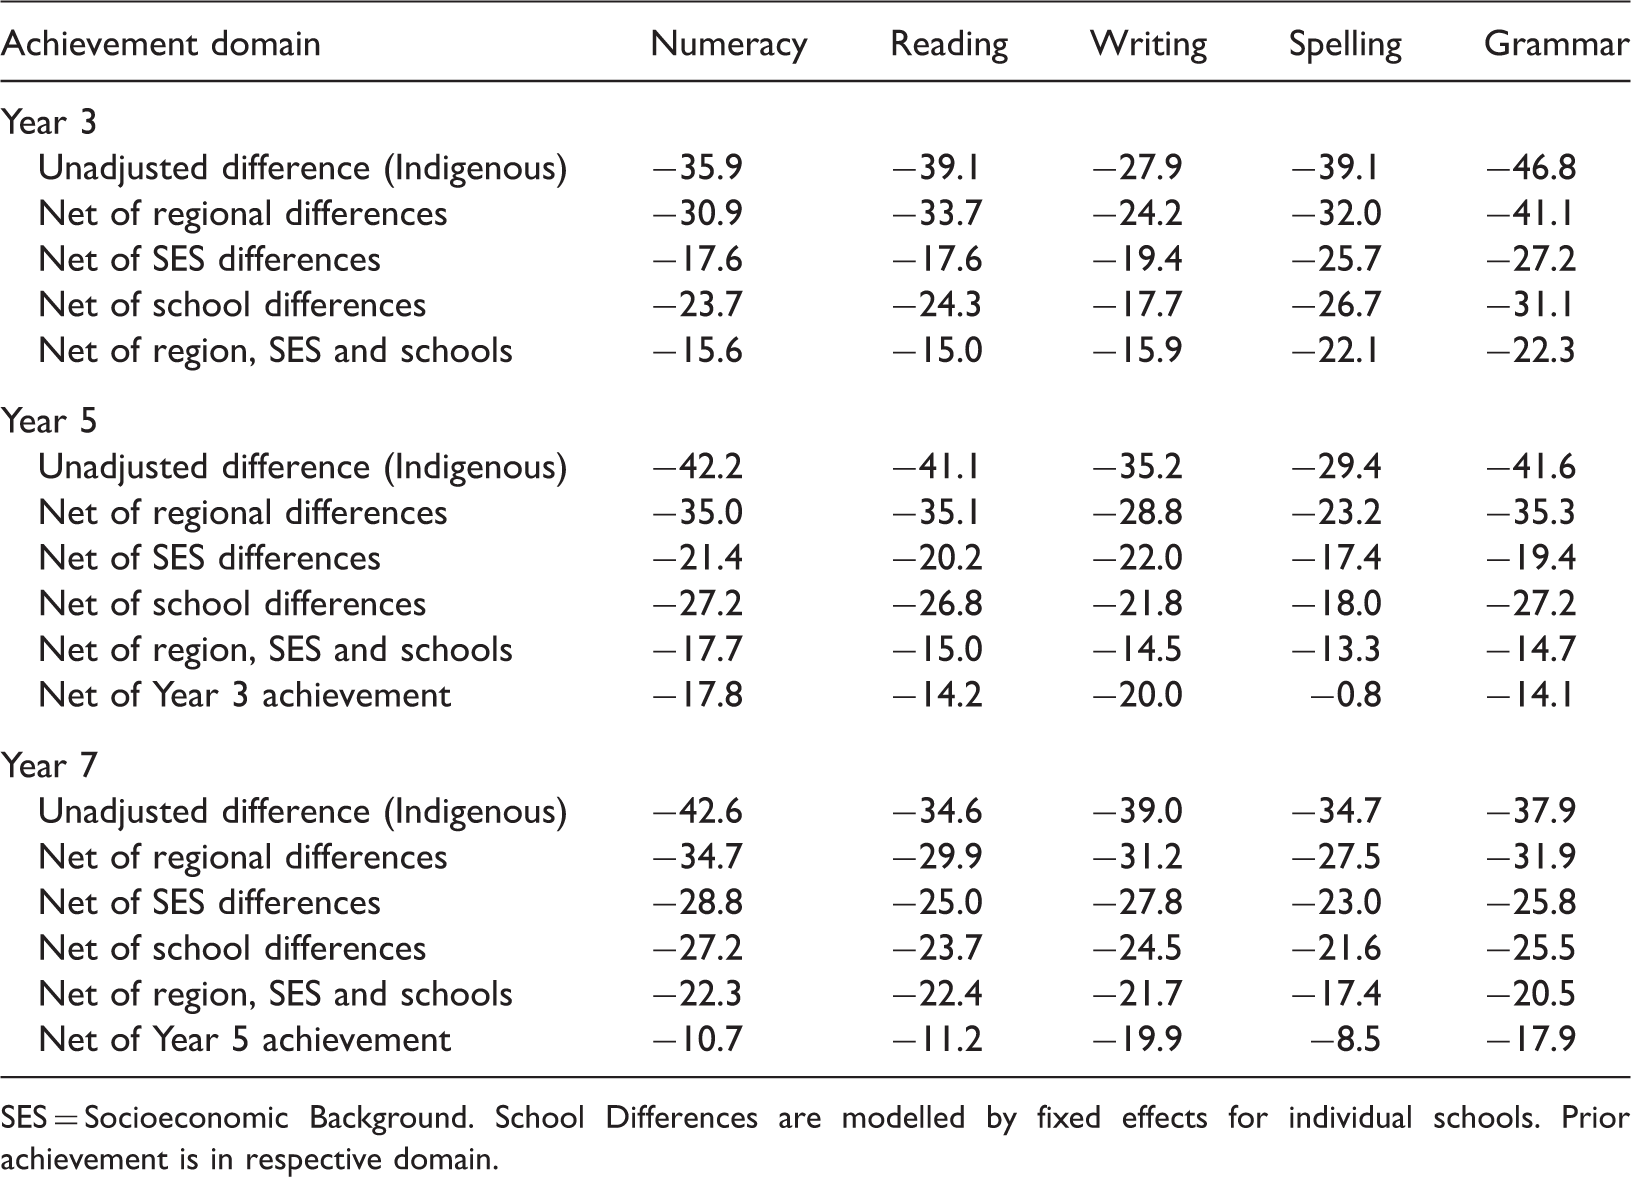
SES = Socioeconomic Background. School Differences are modelled by fixed effects for individual schools. Prior achievement is in respective domain.
The Indigenous–non-Indigenous achievement gap cannot be attributed to regional differences since controlling for region decreases the gap by only about 10%. Controlling for socioeconomic background reduced the Indigenous–non-Indigenous gaps in achievement by between a third and a half reflecting the association between Indigenous status and socioeconomic background. A similar finding was found for schools, indicating that part of the Indigenous–non-Indigenous gap is associated with differences in the schools attended. Controlling for prior achievement (for achievement in Years 5 and 7) indicates that a large proportion of the Indigenous–non-Indigenous achievement gap, between one-half and three-quarters, can be attributed to differences in prior achievement.
Language background
Language background differences in achievement, unadjusted and net of region, SES, school differences and prior achievement for Years 3, 5 and 7.
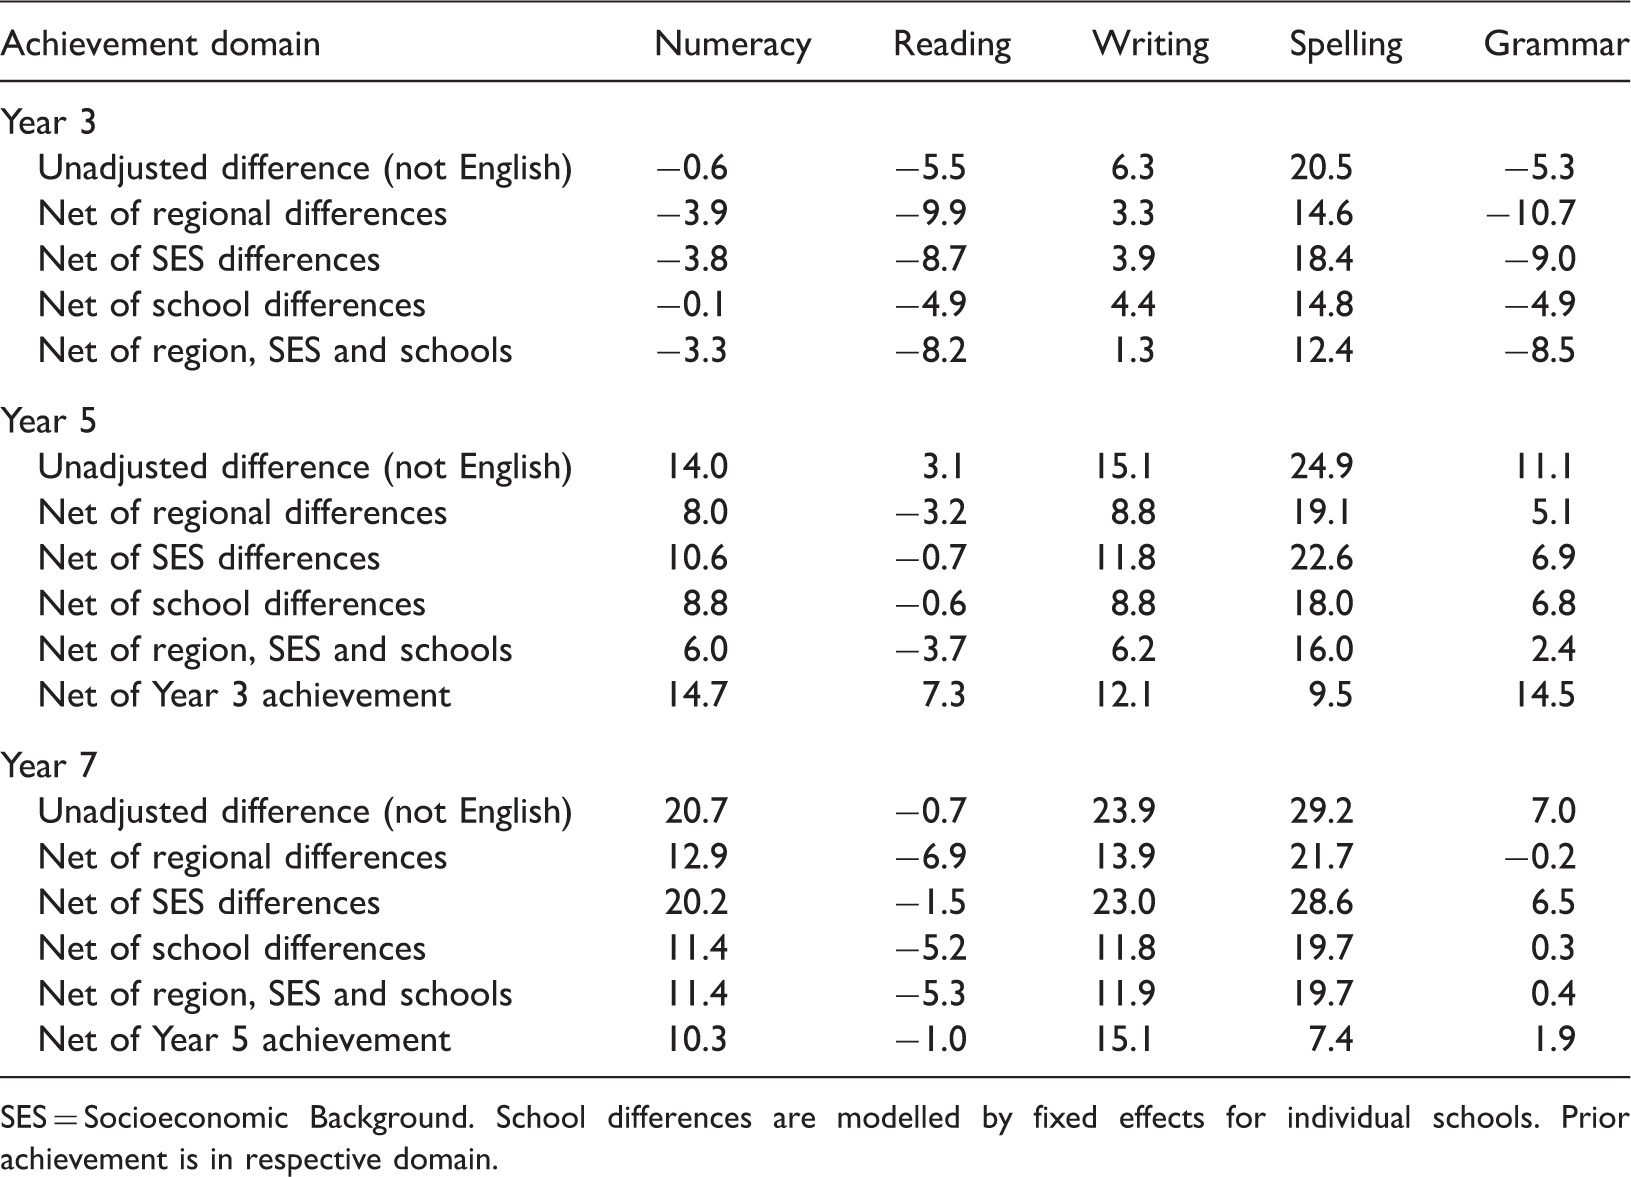
SES = Socioeconomic Background. School differences are modelled by fixed effects for individual schools. Prior achievement is in respective domain.
For achievement in each domain in Years 5 and 7, controlling for region reduces differences in achievement between LBOTE and non-LBOTE students indicating that LBOTE students tend to live in regions with higher levels of student achievement. Similarly, controlling for school differences reduces the difference indicating that, on average, LBOTE students attend higher performing schools. Controlling for socioeconomic background makes little difference to language background differences in achievement. Controlling for prior achievement does not consistently reduce language background differences confirming that LBOTE students tend to improve their relative performance in most domains.
Region
Regional differences in numeracy achievement, unadjusted and net of SES, language background, school differences and prior achievement for Years 3, 5 and 7.
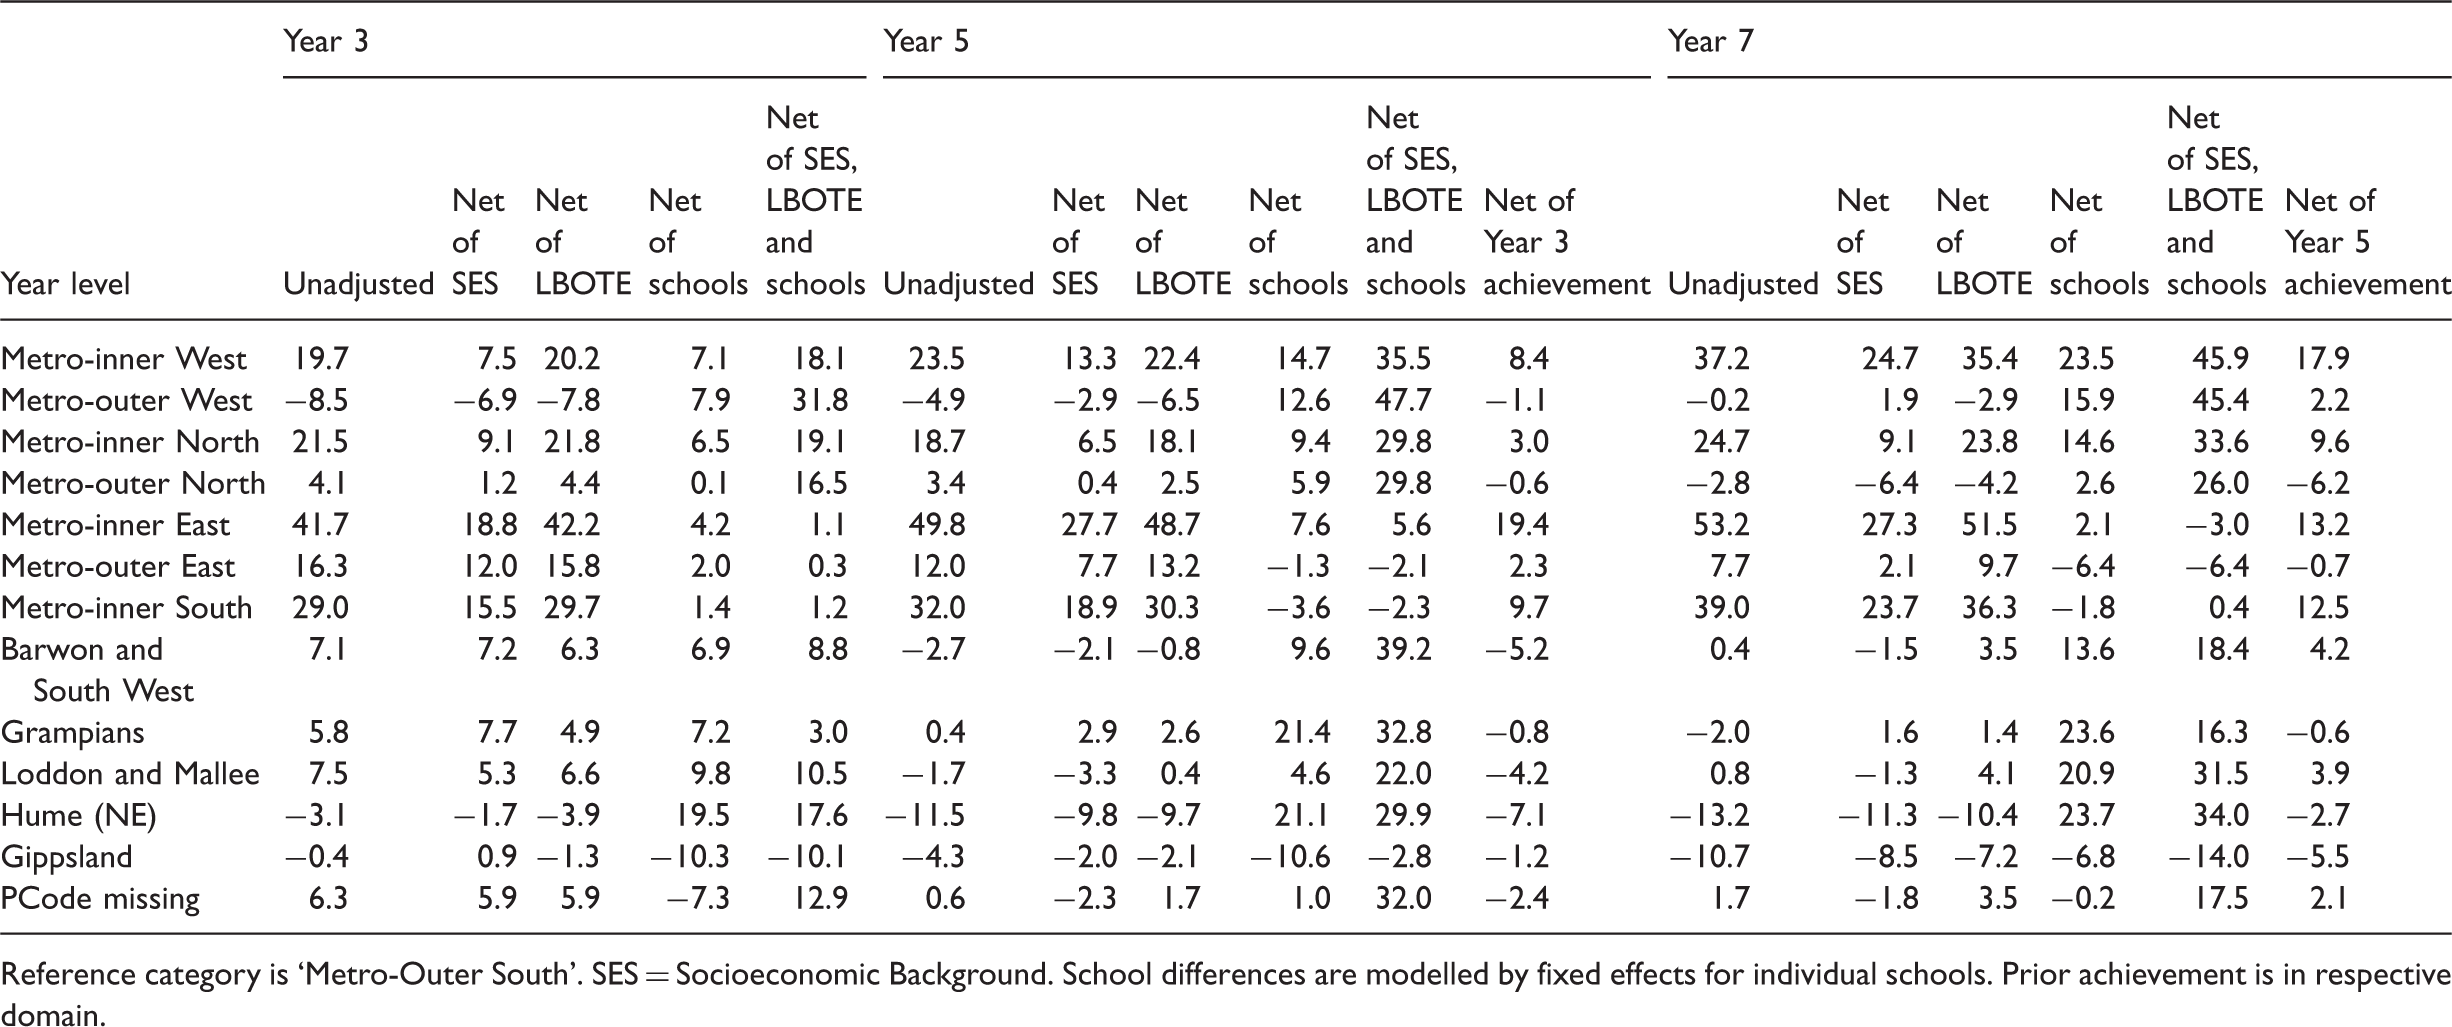
Reference category is ‘Metro-Outer South’. SES = Socioeconomic Background. School differences are modelled by fixed effects for individual schools. Prior achievement is in respective domain.
Regional differences in reading achievement, unadjusted and net of SES, language background, school differences and prior achievement for Years 3, 5 and 7.
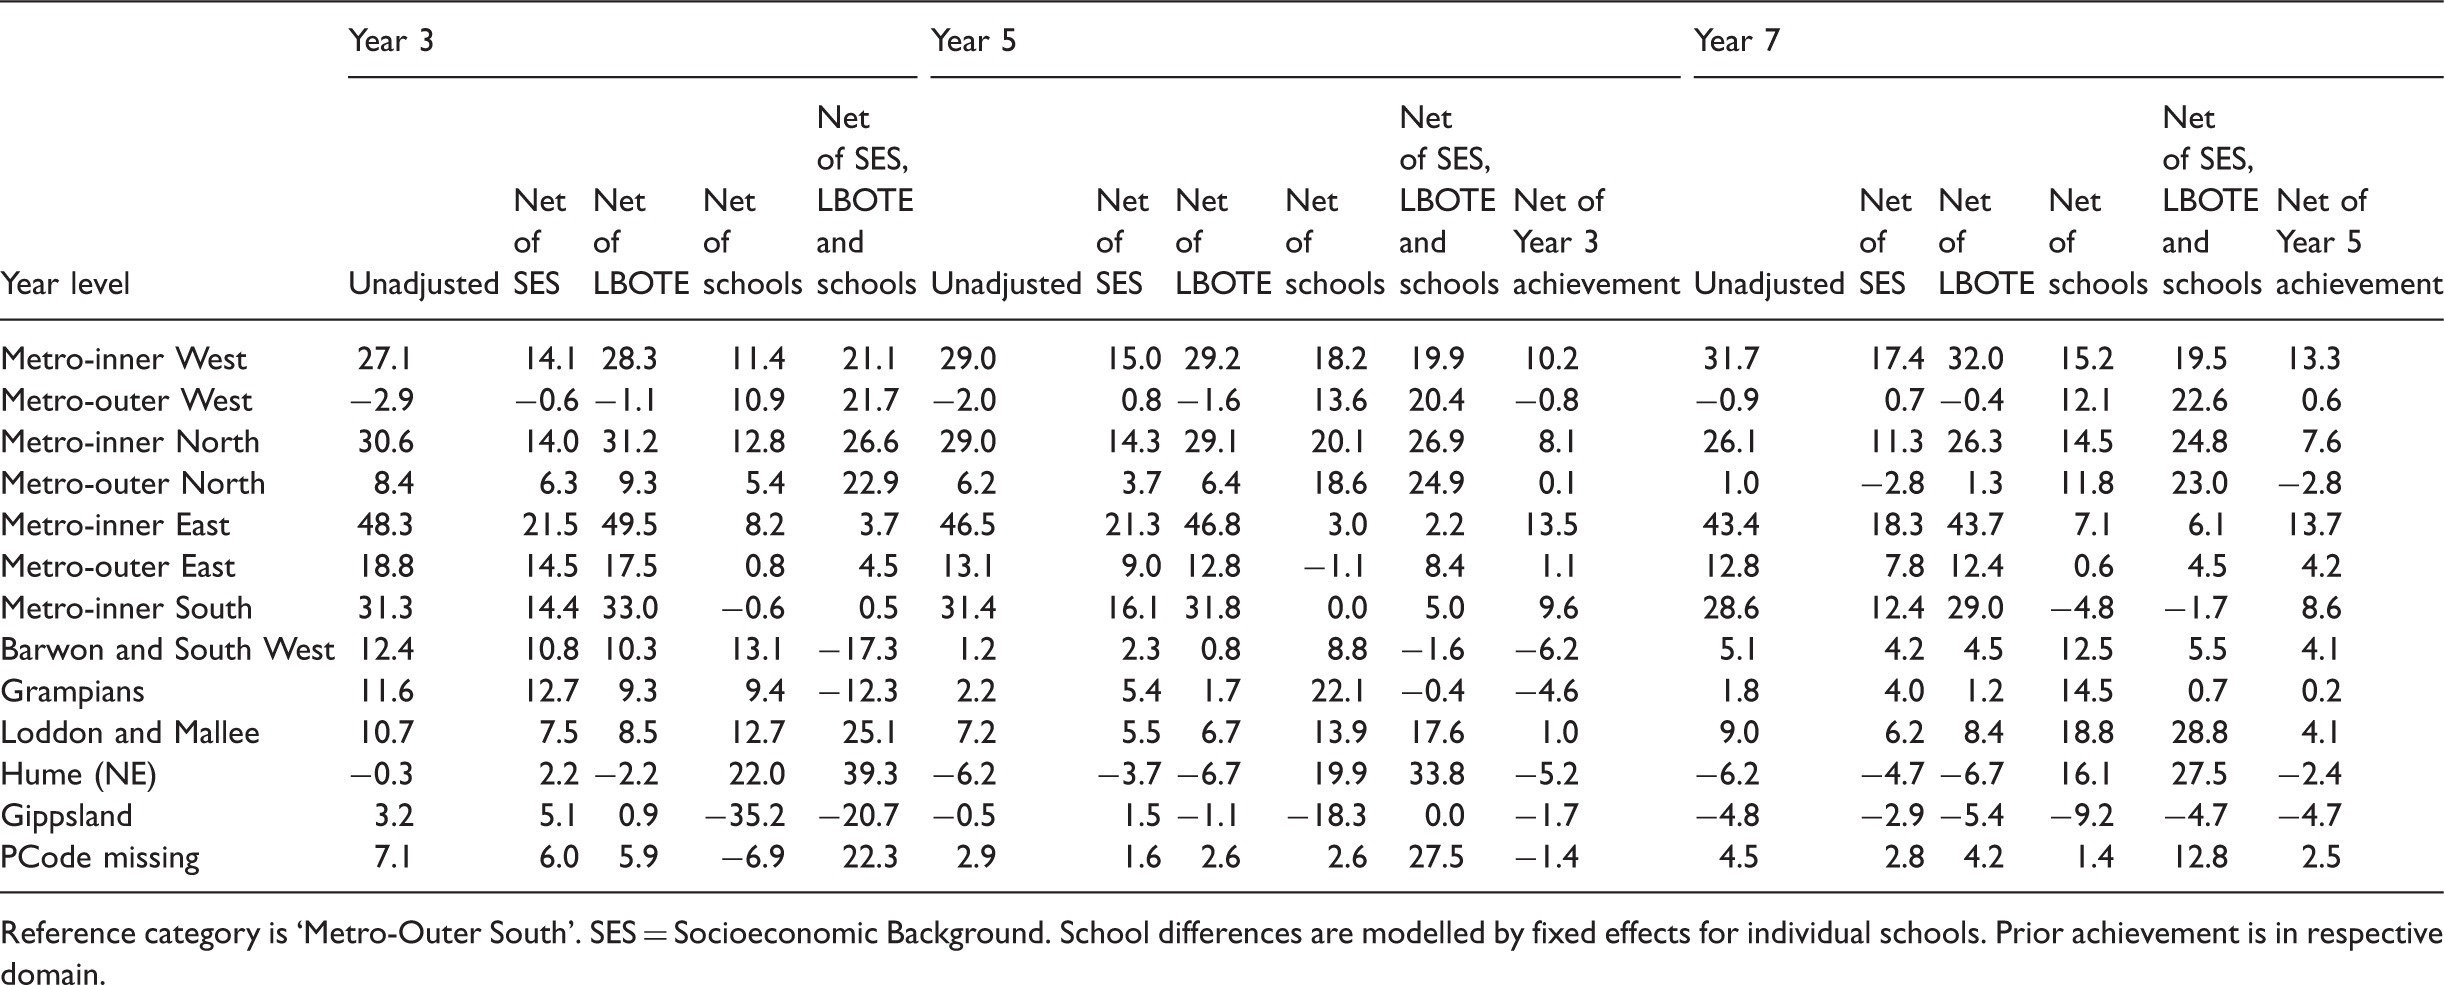
Reference category is ‘Metro-Outer South’. SES = Socioeconomic Background. School differences are modelled by fixed effects for individual schools. Prior achievement is in respective domain.
Some of the regional differences increased over the school career. For numeracy this occurred among students living in the metropolitan inner west, inner-east and inner south regions. In some regions, student achievement in numeracy declined relative to the outer southern metropolitan region: Hume (North East Victoria), Gippsland and to a lesser extent the other non-metropolitan regions. Regional differences in reading tended not to increase over the school career.
When controlling for socioeconomic background, regional differences in both numeracy and reading achievement declined by about half in the inner metropolitan regions, to a lesser extent in the outer metropolitan areas and had little impact for the five non-metropolitan regions. This reflects the relationship between socioeconomic background and students’ region. Controlling for the language background of the students had no substantial impact on regional differences in achievement. Controlling for school differences had a strong impact on achievement differences associated with region. For example, for numeracy in Year 3, controlling for school differences reduced the difference for the metropolitan inner east region (compared to the outer southern region) for 42 to 4, for the inner south region from 29 to 1. The same pattern was found for Years 5 and 7 and for reading. Therefore, regional differences are often strongly associated with school differences.
Regional differences are very much reduced when controlling for prior achievement. This suggests that bulk of regional differences in student achievement can be attributed to differences in the characteristics of students between regions. Only a few regions, notably the inner metropolitan regions, show sizable differences after controlling for prior achievement. This means that students living in these regions make greater achievement gains than students living in other regions.
Socioeconomic background and prior achievement
Correlations between socioeconomic background and achievement for Years 3, 5 and 7.
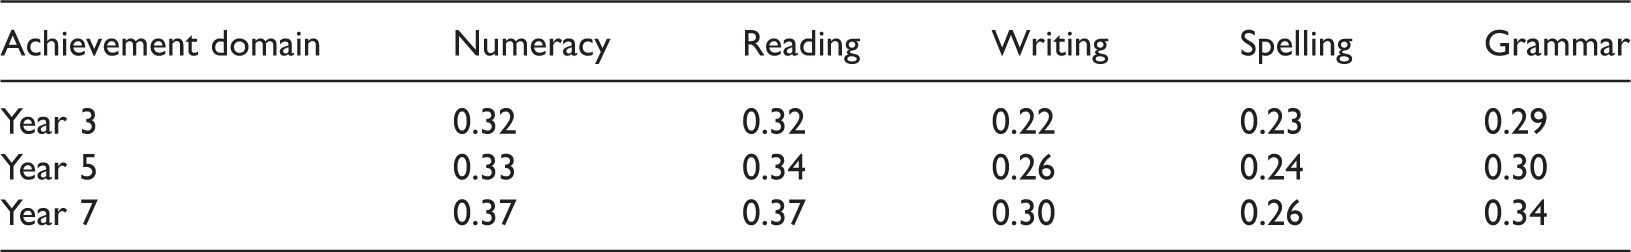
The correlations of socioeconomic background are substantially weaker for spelling and, to a lesser extent, writing than for the other domains. There is no indication than the correlations between socioeconomic background and aspects of English literacy (which would seem to be more influenced by the home environment) are stronger than that between socioeconomic background and numeracy (which would seem to be more influenced by schools). The correlations between achievement and socioeconomic background increase in all domains between Year 3 and Year 7.
Effects of SES on achievement, unadjusted and net of school differences and prior achievement for Years 3, 5 and 7.
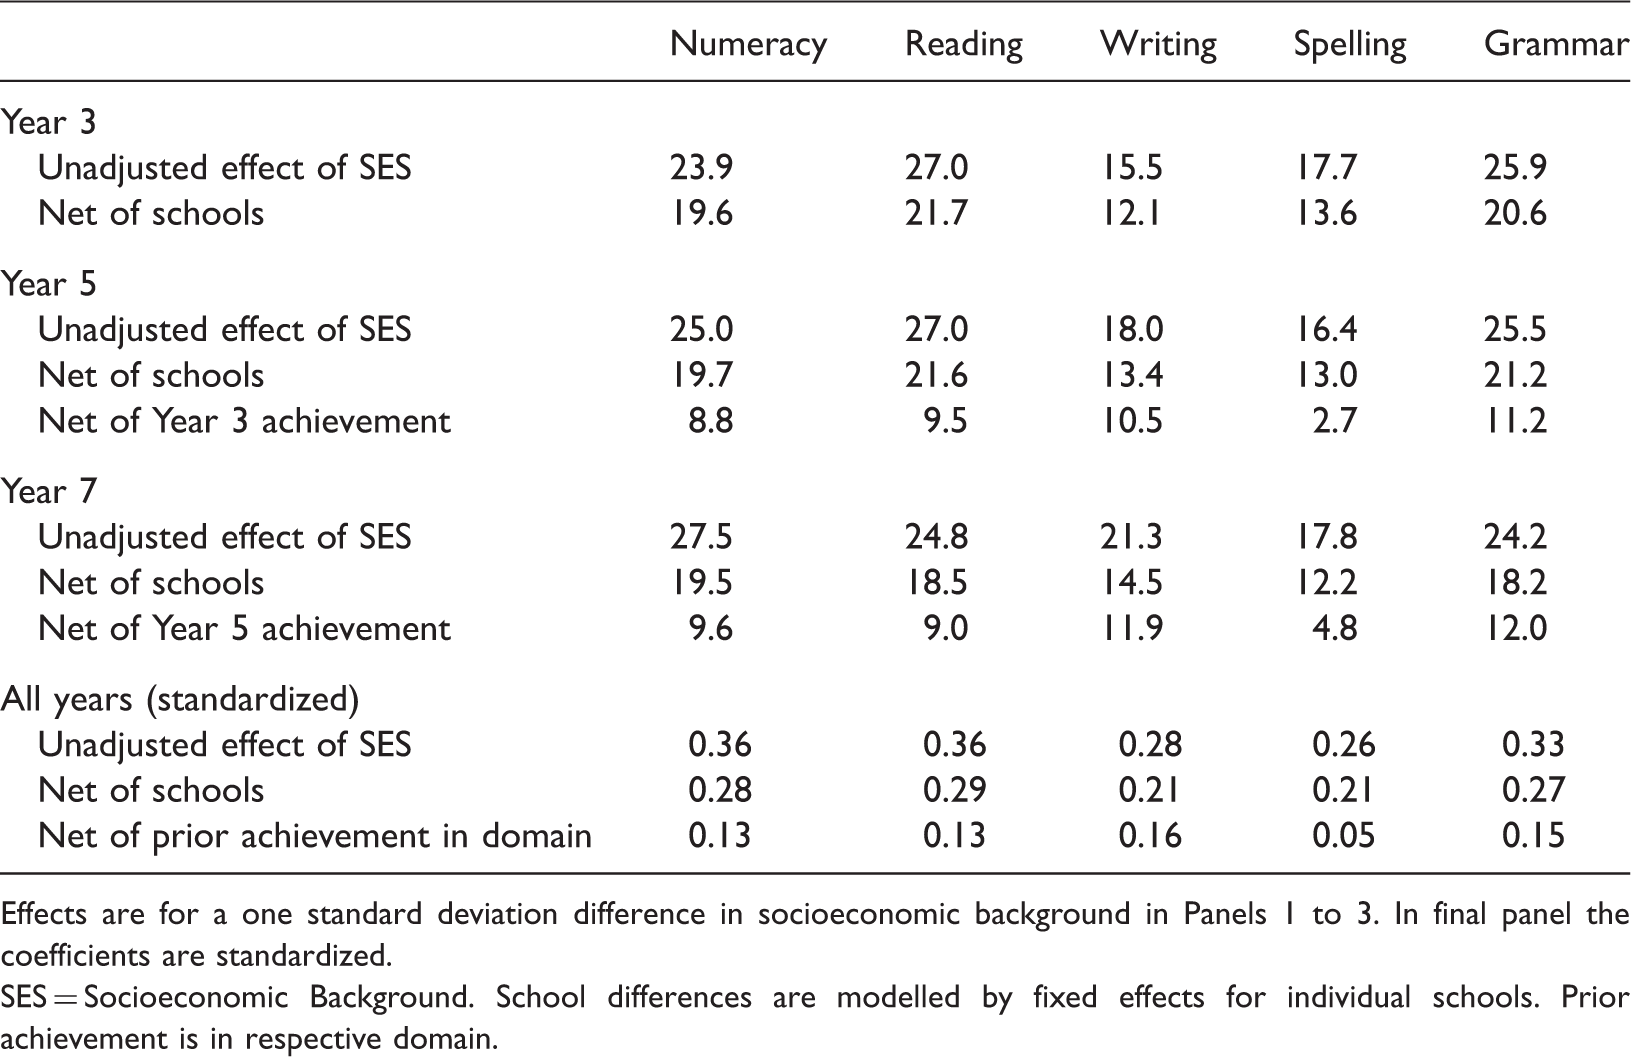
Effects are for a one standard deviation difference in socioeconomic background in Panels 1 to 3. In final panel the coefficients are standardized.
SES = Socioeconomic Background. School differences are modelled by fixed effects for individual schools. Prior achievement is in respective domain.
The effects of socioeconomic background on achievement decline by up to one-third when controlling for school differences. However, this does not mean that school differences account for up to a third of socioeconomic inequalities in student achievement. The results presented for Years 5 and 7 and in the last panel show that net of prior achievement, socioeconomic background effects on achievement are comparatively weak. The effects of socioeconomic background on achievement decline by between one-half (writing and grammar) and three-quarters when controlling for prior achievement. Again, this pattern reflects the weaker over-time correlations for writing and grammar. The last line of the last panel suggests that socioeconomic background accounts for only a very small proportion of the variation in student achievement (up to 3%), net of prior achievement. 8
Prior achievement
Effects of prior achievement on student achievement with and without controls for SES and school differences.
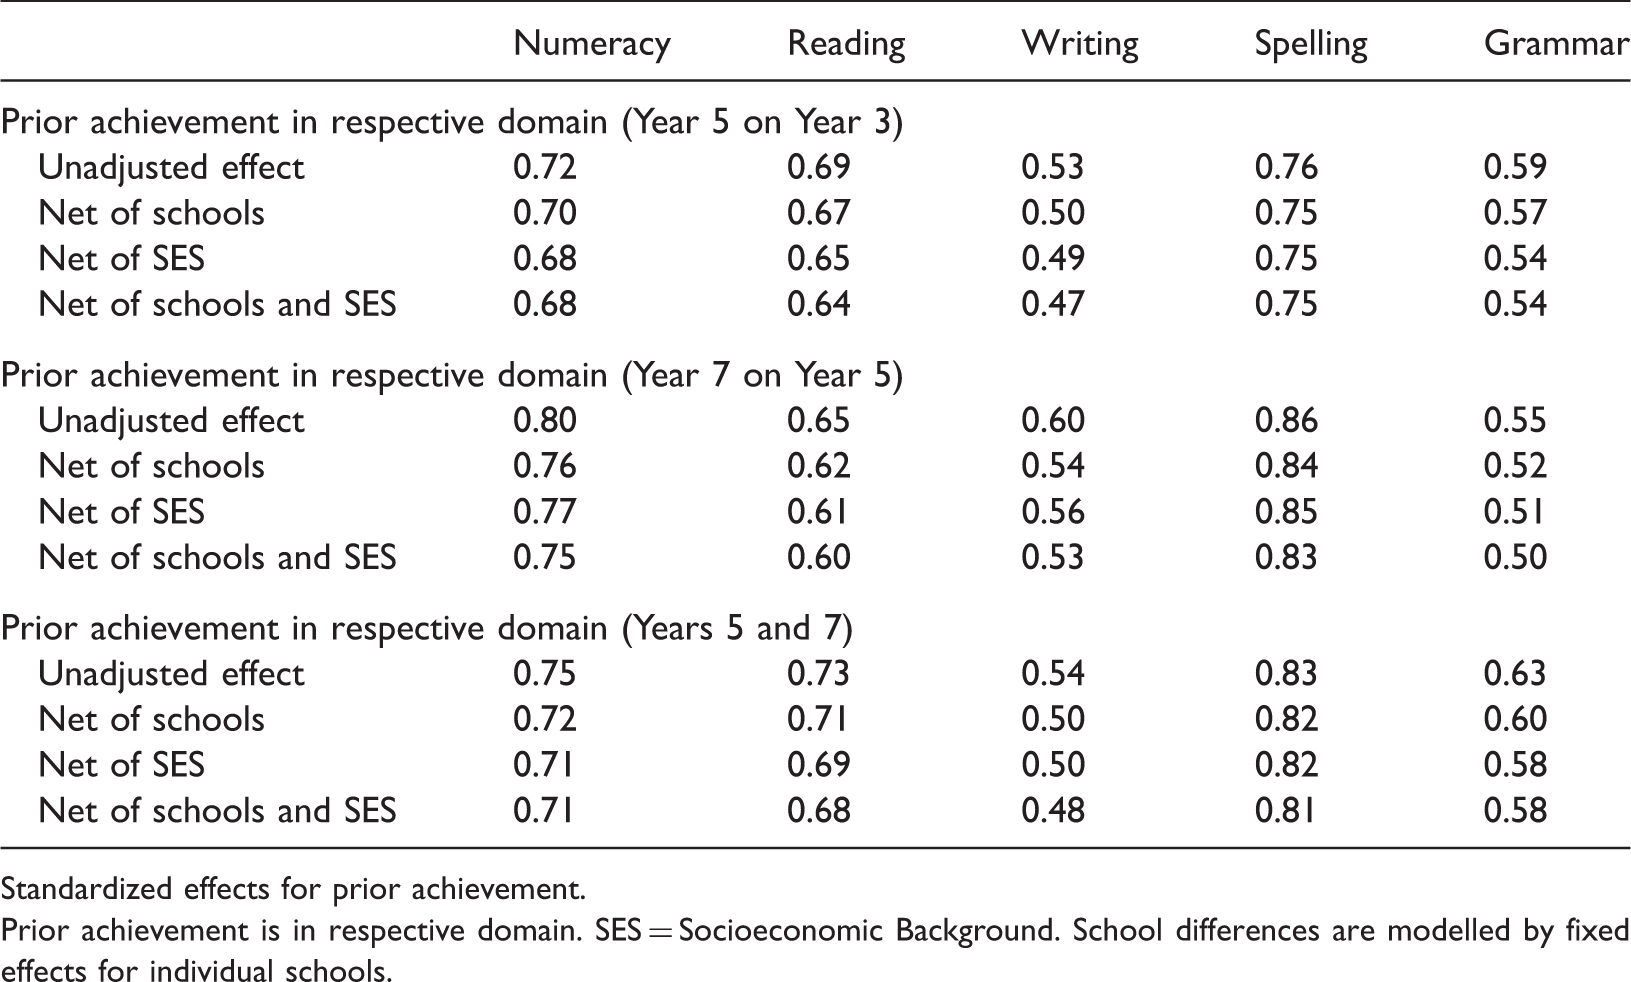
Standardized effects for prior achievement.
Prior achievement is in respective domain. SES = Socioeconomic Background. School differences are modelled by fixed effects for individual schools.
The striking feature of Table 11 is that the effects of prior achievement are not substantially reduced when taking into account school differences or socioeconomic background. Controlling for school fixed effects reduced the magnitudes of the coefficients only marginally. This was the case for achievement in individual Years and in the combined analyses of Years 5 and 7 (third panel). This means that differences between schools have little impact on the effects of prior achievement on student achievement. School differences do not explain the effects of prior achievement on achievement. Similarly, controlling for students’ socioeconomic backgrounds made very little difference to the effects of prior achievement. This indicates that the strong effects of prior achievement on achievement cannot be attributed to socioeconomic background. Together, school differences and socioeconomic background only marginally reduce the strong relationships between prior achievement and achievement.
Conclusion and discussion
In the analyses presented here, prior achievement typically reduces the effects of demographic and socioeconomic factors on student achievement, often very substantially. The major exceptions are language background, the inner metropolitan regions in numeracy and reading, where these students experience greater achievement growth. The effects of prior achievement are also weaker in the analyses of writing, and to a lesser extent grammar, where the over-time correlations are weaker. Adams (2012, p. 18, 32) focusing on student gain scores in NAPLAN also found that after taking into account students’ initial scores, there is little variability in performance that is associated with student background characteristics and concluded ‘by far the most profound predictor of performance is past performance’.
The review of the literature suggests that cognitive ability has a major role in student performance in achievement tests. From these analyses of NAPLAN performance, there is substantial indirect evidence that general cognitive ability is involved. The sizable inter-domain correlations are suggestive of a common underlying factor that accounts for the similarity of student performance across domains. The even stronger over-time correlations within domains most likely reflect the stability of cognitive ability among individual students. The strong effects of prior achievement cannot be accounted for by schools or socioeconomic background. If schools were the main influence on variations in student achievement, then the effects of prior achievement would be very much reduced when controlling for school differences. Recall that the fixed effects for schools control for all differences between schools: their resources, practices and cultures. Similarly, if prior achievement was largely a function of socioeconomic background then controlling for socioeconomic background would substantially reduce the effects of prior achievement. However, controlling for both school differences and socioeconomic background made little difference to the strong effects of prior achievement on student achievement. The most plausible explanation for these findings is that student ability is the major influence on student achievement with schools and socioeconomic background playing much lesser roles. Therefore, assertions commonly made in policy debates and in academia that the variation in student achievement can be largely attributed to students’ socioeconomic backgrounds and/or the schools they attend are incorrect.
The key to understanding many of the social inequalities in student performance is to understand the influences on early school achievement and childhood ability. Future research should focus on the relative importance of innate ability (if that can be measured adequately), pre- and peri-natal health, infant health and nutrition, early childhood stimuli, parenting and preschool attendance. Understanding these relationships much better than we do today should help reduce demographic, socioeconomic and other social disparities in student achievement.
Footnotes
Declaration of conflicting interests
None declared.
Funding
This research was undertaken as part of a research partnership with the Victorian Department of Education and Early Childhood Development (DEECD). This paper uses unit record data from the NAPLAN administrative data collection, provided by DEECD. The findings and views reported in this paper are those of the authors and should not be attributed to DEECD or any other branch of the Victorian government.