
Abstract
Studies using data from the Early Childhood Longitudinal Study–Kindergarten Class of 1998–1999 (ECLS-K:1999) revealed gender gaps in mathematics achievement and teacher perceptions. However, recent evidence suggests that gender gaps have closed on state tests, raising the question of whether such gaps are absent in the ECLS-K:2011 cohort. Extending earlier analyses, this study compares the two ECLS-K cohorts, exploring gaps throughout the achievement distribution and examining whether learning behaviors might differentially explain gaps more at the bottom than the top of the distribution. Overall, this study reveals remarkable consistency across both ECLS-K cohorts, with the gender gap developing early among high achievers and spreading quickly throughout the distribution. Teachers consistently rate girls’ mathematical proficiency lower than that of boys with similar achievement and learning behaviors. Gender differences in learning approaches appear to be fairly consistent across the achievement distribution, but girls’ more studious approaches appear to have more payoff at the bottom of the distribution than at the top. Questions remain regarding why boys outperform girls at the top of the distribution, and several hypotheses are discussed. Overall, the persistent ECLS-K patterns make clear that girls’ early mathematics learning experiences merit further attention.
D
Unlike gaps based on race and socioeconomic status (SES), which stem, in part, from differences in schools attended (Fryer & Levitt, 2004), it is unlikely that gender gaps in elementary school are due to boys and girls attending different schools or to demographic differences between boys and girls. Hence, it is surprising that math gender gaps, as measured on ECLS-K:1999, grew at least as much as race- and SES-related gaps did in elementary grades (Fryer & Levitt, 2010; Reardon & Robinson, 2008). 1 These findings suggest there are patterns unique to gender and mathematics that warrant our attention.
Interestingly, though, research suggests that the gender gap is not constant throughout the achievement distribution. For example, National Assessment of Educational Progress (NAEP) data suggest that gender gaps among students in Grades 4 and 8 favor males at the top of the distribution but are virtually nonexistent below the median (Lubienski, McGraw, & Strutchens, 2004). State tests suggest that males display greater achievement variability in general, outscoring girls at the top of the distribution but also underperforming at the bottom (Hyde, Lindberg, Linn, Ellis, & Williams, 2008). The ECLS-K:1999 provided a unique opportunity to examine how the gaps develop longitudinally and suggested that the math achievement gap developed first at the top of the distribution (in kindergarten) and then progressed further down the distribution through Grade 3 (Husain & Millimet, 2009; Robinson & Lubienski, 2011). Gender gaps at the top of the distribution were substantial; for example, Robinson and Lubienski (2011) found that, in the fall of kindergarten, girls made up only 20% of students above the 99th percentile in math. Together, the research on gender gaps highlights the importance of looking beyond simple mean differences to understand patterns related to achievement differences across the distribution.
Math Achievement Disparities: How Much Should We Focus on Them?
The gender gap at the top of the math achievement distribution deserves special attention, as this is where future mathematicians, computer scientists, and other science, technology, engineering, and mathematics (STEM) professionals tend to reside. Women remain severely underrepresented in high-paying, math-intensive fields. For example, in the United States, women earn only 19% of bachelor’s degrees in engineering and 18% in computer science (National Science Foundation, 2014). This gender imbalance not only limits women’s opportunities but also diminishes the pool of students who can contribute to these fields.
It may seem a stretch to link early mathematics achievement patterns with later career outcomes. Indeed, although high school math achievement generally predicts career choices, it leaves the majority of the gender gap in STEM careers unexplained (Mann & DiPrete, 2013; Riegle-Crumb, King, Grodsky, & Muller, 2012; Xie & Shauman, 2003). Hence, researchers have looked for additional explanations. For example, Eccles and Wang (2016) found that students’ values and math self-concepts are significant predictors of STEM career choices even after conditioning on gender differences in math achievement and that math achievement plays a smaller role once these factors are included in regression models.
Still, early math achievement may influence girls’ career paths in both direct and indirect ways. A recent analysis of ECLS-K:1999 data revealed that, in addition to being the largest predictor of later math achievement, early math achievement predicts changes in mathematics confidence and interest during elementary and middle grades (Ganley & Lubienski, 2016). Hence, math achievement in elementary school appears to influence girls’ emerging views of mathematics and their mathematical abilities. This is important because, as Eccles and Wang (2016) found, mathematics ability self-concept helps explain the gender gap in STEM career choices. Examining early gendered patterns in math can shed new light on differences in young girls’ and boys’ school experiences that may shape their later choices and outcomes.
This paper will focus on the early development of gender gaps in math, including where in the distribution such gaps develop, when disparities first appear, and how the gaps have changed since ECLS-K:1999. Examining the full set of causes of gap development is beyond the scope of this paper; however, we examine two potential issues: students’ learning behaviors and teachers’ expectations of girls in math. Together, the outcomes we examine provide intriguing evidence on the (fairly consistent) patterns of early emerging gender gaps in math achievement scores, learning behaviors, and teacher ratings of math proficiency, across two cohorts separated by over a decade. Examining these three factors together can provide insights into ways in which students’ approaches to learning and teachers’ perceptions of boys and girls are related to gender gaps in math achievement.
Findings from ECLS-K:1999
Before the ECLS-K:1999, our understanding of national-level gender gaps in elementary school was largely limited to studies using NAEP, which is cross-sectional and begins in fourth grade, 5 years after formal education begins. Studies using the ECLS-K:1999 data shed important light on the topic, finding that gender gaps developed in favor of males during the first 4 years of school and developed first among the highest-achieving students (Fryer & Levitt, 2010; Husain & Millimet, 2009; Penner & Paret, 2008; Robinson & Lubienski, 2011).
Going beyond test-based measures, the ECLS-K:1999 provided insights into what teachers thought about the relative proficiency of boys and girls in math (DiPrete & Jennings, 2012; Fryer & Levitt, 2010; Robinson & Lubienski, 2011; Robinson-Cimpian, Lubienski, Ganley, & Copur-Gencturk, 2014b). Several earlier studies with other data had suggested that teachers viewed boys and girls differently, often rating boys’ math abilities as higher than that of girls (Upadyaya & Eccles, 2014), naming boys as the best math students (Fennema, Peterson, Carpenter, & Lubinski, 1990), and holding higher expectations and providing more specific feedback for boys (Sadker & Sadker, 1986).
An ECLS-K:1999 study found that teachers rated the math skills of girls lower than those of similarly behaving and performing boys (Robinson-Cimpian et al., 2014b). These results indicated that teachers rated girls on par with similarly achieving boys only if they perceived those girls as working harder and behaving better than those boys. This pattern of differential teacher ratings did not occur in reading or with other underserved groups (e.g., Black and Hispanic students) in math. Therefore, this phenomenon appears to be unique to girls and math. In a follow-up instrumental-variable analysis, teachers’ differential ratings of boys and girls appeared to account for a substantial portion of the growth in gender gaps in math achievement during elementary school (Robinson-Cimpian et al., 2014b).
Data from the ECLS-K:1999 also suggested a strong link between learning behaviors—both externalizing problem behavior and approaches to learning (e.g., self-direction, organization, and eagerness to learn)—and gender achievement gaps, including disparities in teacher ratings of girls’ and boys’ math proficiency and in direct cognitive assessment scores. In particular, girls often had better behavior and approaches to learning ratings, and when researchers held these factors constant, the math gap further developed in favor of males (Cornwell, Mustard, & Van Parys, 2013; DiPrete & Jennings, 2012; Robinson-Cimpian et al., 2014b). These better learning behaviors of girls are indeed positive attributes, likely buffering girls against a larger disadvantage in math while contributing to a larger advantage in reading (DiPrete & Jennings, 2012). These findings suggest the importance of examining the role of student learning behaviors in studies of gender and mathematics achievement. Moreover, given prior evidence that gender gaps in math achievement are particularly large at the top of the distribution, this study considers how the role of student learning behaviors in the gender gap might vary throughout the achievement distribution.
Possible Changes Since ECLS-K:1999
Since the time of the ECLS-K:1999 cohort, a number of changes have occurred in education policy, media, and society that may have led to reductions in the development of the gender achievement gap in elementary school. For example, the No Child Left Behind (NCLB) law required that schools report test scores disaggregated by gender, thereby potentially focusing educators’ attention on gender disparities. Moreover, NCLB and the accountability movement in general created other pressures that could affect the gender gap. For example, as expectations and curricular practices get pushed down to lower grades (Bassok, Latham, & Rorem, 2016), students are learning more advanced material earlier. The fact that ECLS-K:1999 gender gaps grew between first and third grades might lead some to suspect that pushing curricular expectations downward to earlier grades may lead to a widening of early gender gaps. However, given that girls tend to perform better when mathematics assessments are closely aligned with school-taught material (Downey & Vogt Yuan, 2005; Kimball, 1989), the inclusion of more explicit instruction on advanced content could boost girls’ early mathematics achievement.
In fact, as noted above, Hyde and colleagues (2008) found a striking lack of gender gaps in math achievement on state exams. They concluded, “For grades 2 to 11, the general population no longer shows a gender difference in math skills” (Hyde et al., 2008, p. 495). This work was published in Science and received considerable media attention in the United States and internationally, including notable pieces in The New York Times (Lewin, 2008) and other major outlets (e.g., Hansen, 2008; Quaid, 2008; Spears, 2008). Perhaps this widespread attention to the closure of gender gaps in math has improved the public’s (including teachers’ and parents’) perceptions about the relative math abilities of boys and girls.
However, despite encouraging evidence from state tests and the emergence of various factors that may contribute to a decrease in gender gaps in math achievement and teacher stereotypes, there are other reasons to suspect that gaps in both achievement and teacher perceptions might not have improved since ECLS-K:1999.
First, the gender gap closure reported by Hyde et al. (2008) was on state tests, which—as the authors, themselves, note—rarely contain high-level questions on which gender differences are most apparent; by contrast, the ECLS-K tests use an adaptive two-stage testing design and item response theory (IRT) to avoid floor and ceiling effects (Pollack et al., 2005; Tourangeau et al., 2015). Given the differences in content and design, the ECLS-K assessments may detect gaps where state tests do not. In this respect, the ECLS-K math test may be less similar to state tests (at least, before the Common Core State Standards) and more similar to more advanced tests on which previous studies have found gender gaps, such as NAEP (Lubienski et al., 2004), Organisation for Economic Co-operation and Development’s (OECD) Programme for International Student Assessment (PISA; Guiso, Monte, Sapienza, & Zingales, 2008), the SAT Mathematics assessment (College Board, 2015), and the American Mathematics Competition (Ellison & Swanson, 2010).
Nonetheless, as noted above, Hyde et al.’s (2008) work could have had an impact on the public perception of gaps. On the other hand, the highly publicized lack of gender differences on state tests (and the likelihood that NCLB-mandated reporting reveals no gender differences, given its reliance on state tests) might have removed incentives for schools to address girls’ specific needs in mathematics. Furthermore, it is not clear that societal and teacher perceptions of girls’ mathematics abilities have actually improved.
In fact, several recent studies suggest that stereotypes related to gender and mathematics persist. Cvencek, Meltzoff, and Greenwald (2011) found that elementary school children hold both implicit and explicit stereotypes of mathematics as a male domain. Other research suggests that field specialists (e.g., professors), college students, and a lay audience (e.g., Mechanical Turk subjects) associate success in male-dominated fields (e.g., mathematics, physics, computer science, and engineering) with having an innate ability (Leslie, Cimpian, Meyer, & Freeland, 2015; Meyer, Cimpian, & Leslie, 2015; Storage, Horne, Cimpian, & Leslie, 2016).
Relatedly, using recent Google search data, Stephens-Davidowitz (2014) found that parents were 2.5 times more likely to ask, “Is my son gifted?” than “Is my daughter gifted?” 2 This suggests that stereotypes operate in society and affect our perceptions of young children’s giftedness. As Penner (2014) notes, teachers are members of society and reflect society. If elementary teachers continue to hold beliefs about boys having greater mathematical abilities than girls, then they may hold different expectations for male students, which could act as a self-fulfilling prophecy (Robinson-Cimpian et al., 2014b).
More generally, though, Stephens-Davidowitz’s (2014) study of Google queries suggests that parents were more concerned about boys at both ends of the achievement spectrum—that is, parents were more likely to question not only whether their sons (more than their daughters) were “genius[es]” and “intelligent” but also whether they were “stupid” and “behind.” This concern of parents may in part reflect the greater variance in male achievement, which has been found on numerous achievement tests (Hyde et al., 2008; Lubienski et al., 2004). 3
Together, the expectations of parents/teachers and the greater-variability hypothesis suggest that gender gaps in achievement and teacher perceptions must be studied throughout the achievement distribution (e.g., Husain & Millimet, 2009; Robinson & Lubienski, 2011). Moreover, given that student learning behaviors relate to both gender and achievement, attention to behavior can provide a new, more nuanced analysis of the development of gender gaps.
Research Questions
The changes in education policy since 1999, along with evidence of gap closures on state tests, raise the question of whether patterns evident in ECLS-K:1999 persist in the ECLS-K:2011 data set. Specifically, we ask the following?
Do gender disparities in math achievement during elementary school remain in the 2011 cohort, and are there particular regions of the achievement distribution where we see differences between the 1999 and 2011 cohorts?
Do teachers’ differential perceptions of boys’ and girls’ mathematics proficiency remain in the 2011 cohort, and are there particular regions of the achievement distribution where we see differences between cohorts?
How do learning behaviors relate to the distributional patterns of gender gaps in math achievement?
To answer these questions, this study builds from earlier analyses using ECLS-K:1999 (in particular, Robinson & Lubienski, 2011) and includes new models with data from both ECLS-K:1999 and ECLS-K:2011 to examine patterns in math achievement and teacher perceptions for girls and boys throughout the achievement distribution, while considering differences in learning behaviors in some analyses. In addition to replicating prior analyses of ECLS-K:1999 data with ECLS-K:2011 data, this study makes several additional contributions, including statistical tests for between-cohort differences, the first application of covariate-adjusted distributional metric-free gaps (using Robinson & Lubienski’s [2011] method), and a new distributional examination of the role of learning behaviors in the gender math gap.
Data
This study uses data from the ECLS-K:1999 (N = 21,399) and ECLS-K:2011 (N = 18,170). The ECLS-K:1999 has completed all waves of data collection, including kindergarten and first, third, fifth, and eighth grades. The ECLS-K:2011 has completed data collection for kindergarten and first and second grades, with third, fourth, and fifth grades forthcoming. Relevant to this study, the data sets include information on student achievement, teacher ratings of academic proficiency and learning behaviors, and student demographic information.
Direct Cognitive Assessment Scores
Children completed mathematics and reading direct cognitive assessments at each wave of data collection, included in the data set as theta scores. Assessments were developed by the Educational Testing Service and were based on input from early education and curriculum expert as well as widely accepted standards and frameworks for assessment. Assessments were adaptive, with each child receiving questions best suited to their ability based on their answers to previous items (Najarian, Pollack, Sorongon, & Hausken, 2009; National Center for Educational Statistics [NCES], n.d.).
Teacher Ratings
Academic Rating Scale
Teachers used subject-specific Academic Rating Scales (ARS) to rate their students’ proficiency (on a 5-point scale from not yet = 1 to proficient = 5) in a variety of constructs, including specific mathematical topics and problem-solving skills (Najarian et al., 2009; Tourangeau et al., 2015). For example, some items on the kindergarten ARS asked teachers to evaluate how well the child “orders a group of objects,” “solves problem involving numbers using concrete objects,” “shows an understanding of the relationship between quantities,” and “models, reads, writes, and compares fractions.” 4 In the first-grade survey, some items rotate out, replaced by items regarding more difficult skills, such as “surveys, collects, and organizes data into simple graphs” and “makes reasonable estimates of quantities.” 5
ARS scale scores were calculated using a one-parameter IRT (Rasch) model and included in the ECLS-K:1999 data set (Pollack et al., 2005). Only item-level data were included for the ARS in ECLS-K:2011; therefore, we calculated the scale scores using a generalized partial-credit IRT model, and it is these scale scores on which our analyses are based.
Learning behaviors: Externalizing Problem Behaviors and Approaches to Learning
The ECLS-K Externalizing Problem Behaviors scale is a combined score based on teacher responses to items about a student’s tendencies to have difficulty getting along with others, paying attention, or avoiding distractions. The ECLS-K Approaches to Learning scale score is based on a teacher’s ratings of student behaviors related to self-direction, organization, persistence, and eagerness to learn (see teacher questionnaires for both data sets; NCES, n.d.). NCES provides the composite scores for both of these scales in both data sets. We refer to externalizing problem behaviors and approaches to learning collectively as learning behaviors.
Student Demographics
Student gender, race, and age at assessment were collected from parent interviews and school documentation. Parents also provided their education levels, occupations, and incomes, which were used to create a composite SES variable (Najarian et al., 2009; Tourangeau et al., 2015).
Analytic Data Sets
To ensure that we compare the same students across the various tests (including direct cognitive assessments and ARS scores) as they progressed through school, we retained only students with nonzero longitudinal sampling weights, valid test scores, and academic ratings scores at each wave of analysis; this reduced the 1999 sample to 5,615 observations and the 2011 sample to 8,522 observations. These samples were further restricted to first-time kindergarteners at the beginning of the studies with complete demographic information (i.e., age, race, SES, gender) and valid teacher ratings on the Approaches to Learning and Externalizing Problem Behaviors scales. The final analytic samples for the 1999 and 2011 cohorts are 5,056 and 7,507, respectively. The final sample includes students in kindergarten and Grades 1 and 3 for ECLS-K:1999 and kindergarten and Grades 1 and 2 for ECLS-K:2011. Descriptive statistics for both samples are provided in Table 1.
Means and Standard Deviations, by Cohort, Wave, and Gender

Note. Test scores and teacher ratings have been standardized with mean 0 and variance 1 in each wave. Standard deviations appear in parentheses. All values are weighted by the longitudinal sampling weights. Teacher ratings are unavailable for ECLS-K:2011 Grade 2. ECLS-K = Early Childhood Longitudinal Study–Kindergarten; Sig. = significant differences between gender scores.
p < .05. **p < .01. ***p < .001.
Method
Distributional Gender Gaps
Because prior research suggests that the size of math gender gaps differ for low- and high-performing boys and girls, we estimate gaps throughout the achievement spectrum. 6 Here, rather than assuming the ECLS-K assessments are interval scaled, we use a metric-free distributional measure, λθ, developed by Robinson and Lubienski (2011). The method estimates the proportion of females scoring above/below a given percentile.
In addition to replicating this work with the 2011 cohort, we extend it to look at adjusted gaps throughout the achievement distribution. As explained in the online appendix of Robinson and Lubienski (2011), one can use a series of logistic regressions to estimate the conditional proportion of males and females and, thus, estimate a conditional version of their measure. The cumulative density (Φ) of females (or males) observed by a given percentile of achievement (θ) conditional on a vector of characteristics (

Thus, using logistic regression as the basis for λθ, we can estimate the proportion of females (or males) at or below (or above) each percentile:
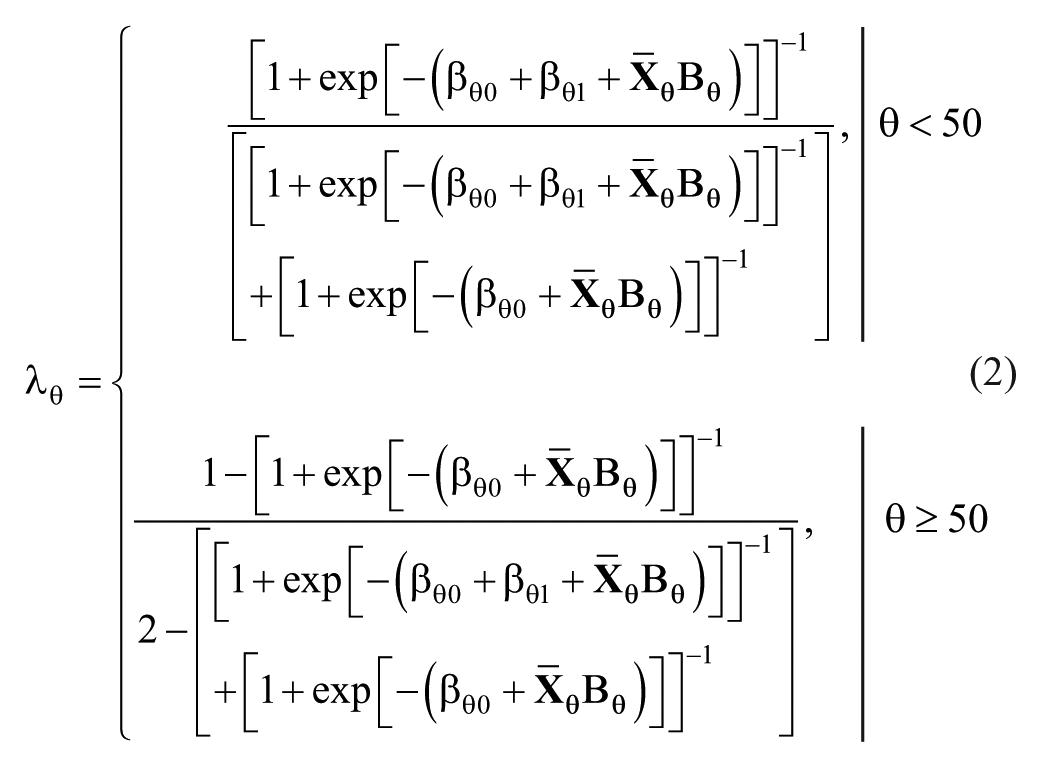
Here, we interpret the value of λ50 to be the proportion of students at or above the median value of achievement (or in some instances, teacher ratings) who are female, after conditioning on demographic, behavioral, and prior achievement differences between males and females in some model specifications. A value of λ50 = .5 indicates that half of the students above the median are female and half are male. A value of λ50 = 1 indicates that only females score above the median, and a value of λ50 = 0 indicates only males score above the median; hence, the metric is bounded by [0,1], facilitating easy interpretation. For values of θ below the median, the value of λθ represents the proportion of students who are male; as Robinson and Lubienski (2011) explained, this is necessary so that, throughout the distribution, values of λθ below .5 consistently indicate an advantage for males and values above .5 consistently indicate an advantage for females. For example, a value of λ10 = .3 indicates that only 30% of students below the 10th percentile are males, whereas a value of λ90 = .3 indicates that only 30% of students above the 90th percentile are females.
We estimate three models for the metric-free distributional gaps; the first two models are similar regardless of outcome. Model 1 contains no covariates other than gender and thus is identical to the models estimated by Robinson and Lubienski (2011). Model 2 extends the base model by adding covariates for age, race, SES, and all prior and current ratings of learning behaviors. When the direct cognitive assessment is the outcome, Model 3 adds covariates for all prior direct cognitive assessment scores in the content area. When ARS scores (i.e., teacher rating of student proficiency) are the outcome, Model 3 adds covariates for all prior and current direct cognitive assessment scores as well as all prior ARS scores in the content area.
Hence, when the direct cognitive assessment is the outcome, Model 1 presents raw gaps, Model 2 presents conditional gaps, and Model 3 presents conditional gaps that can loosely be interpreted as conditional gaps in growth. 7 For instance, if λ90 = .4 in Model 3, we would conclude that among students at or above the 90th percentile who have similar demographics, learning behaviors, and prior achievement, females represent only 40%. Model 3 helps us identify where in the distribution we see growth in the gaps between the waves of data collection. That is, although we can visually compare, say, Model 2 from the fall of kindergarten to the spring for intuitions on growth, Model 3 provides a more formal test of growth.
When the teacher rating is the outcome, Models 1 and 2 present raw and conditional gaps, respectively, just as with the direct cognitive assessment outcomes; Model 3, however, represents how a teacher would rank a boy and girl with the same demographics, learning behaviors, past academic trajectory, and current achievement score.
To better understand the magnitude of the λθ estimates, we can translate them into an effect size metric. Estimates of λθ = .44 (or .56, if above .5) approximately correspond to a standardized effect size of d = 0.2, thus the range of λθ = (.44,.56) could be considered “small.” Differences considered “moderate” (d = [0.2,0.5]) correspond to λθ = (.30,.44) and λθ = (.56,.70). Differences considered “large” (d = [0.5,0.8]) correspond to λθ = (.21,.30) and λθ = (.70,.79). Differences considered “very large” (d = [0.8,1.0]) correspond to λθ = (.15,.21) and λθ = (.79,.85). 8
Results
Research Question 1: Gender Gaps in Math Achievement (Direct Cognitive Assessment Scores)
Table 1 reveals that in ECLS-K:2011, the overall gender gap in mathematics achievement (favoring males) was very small in kindergarten but became significant by Grade 1 and grew to nearly 0.2 standard deviations by Grade 2. This general pattern of growth is similar to that in the ECLS-K:1999 cohort, with the most notable difference being that the small (0.1 standard deviations) kindergarten gaps in the earlier cohort were significant. However, focusing on overall gender gaps can mask important differences between boys and girls throughout the achievement distribution.
Distributional gaps in the 2011 direct cognitive assessment scores
We begin by examining gender gaps in direct cognitive assessment scores throughout the distribution. We discuss the ECLS-K:2011 results first and then compare these patterns with results for the earlier cohort. In Figure 1, we see that in the fall of kindergarten for the 2011 cohort, males hold a significant and substantial advantage above the 85th percentile of the direct cognitive assessment (see the upper-left panel). For instance, roughly half of all students above the 50th percentile are females, but this figure drops to 45% above the 85th percentile and drops to only 33% above the 99th percentile.

ECLS-K:2011 math achievement gender gaps.
After adjusting for age, race, SES, and ratings of learning behaviors in Model 2, we see that girls experience a significant disadvantage throughout nearly the entire distribution (i.e., significant everywhere except below the 5th percentile). In supplementary analyses (not shown here, but available upon request), we found that adjusting for age, race, and SES did not alter these patterns in any detectable way; the factors responsible for the shift between Models 1 and 2 are learning behaviors (consistent with DiPrete & Jennings, 2012, and Robinson-Cimpian et al., 2014b). This shift indicates that boys score higher than girls with similar behavioral ratings and suggests that girls’ advantages in learning behaviors are related to their near parity with boys at the start of school in math achievement. Interestingly, the adjustments for learning behaviors do not appear to alter the estimates at the 99th percentile much (about 33% female in both models), but nearly every other percentile is affected. (We investigate these relationships further in a later Results subsection.) The patterns in the spring of kindergarten are largely similar to those in the fall, except the gap at the top of the distribution has widened further.
Grade 1 patterns show a significant advantage for boys at all points above the 35th percentile. After adjusting for differences in learning behaviors in Model 2, boys score higher than behaviorally similar girls at each point throughout the achievement distribution, suggesting that girls’ better learning behaviors may have been helping to boost their early math achievement. Model 3 makes clear that the growth in the gender gap among demographically and behaviorally similar students between the springs of kindergarten and Grade 1 is driven by girls at the upper end of the distribution falling further behind; note that the gender gap representation does not significantly change among similar students below the 25th percentile.
By the spring of Grade 2 (bottom row of Figure 1), the gender gap has crept further down the distribution in Model 1, significantly favoring males at all points above the 15th percentile. The gap at the top has again widened so that only 1 out of every 5 students is female above the 99th percentile in Model 1 and only 1 out of 6 in Model 2. In Model 3, we can see that—unlike the results of Model 3 for the spring of Grade 1—the losses to girls between Grades 1 and 2 are felt throughout the distribution. The patterns for the 1999 cohort can be seen in Figure 2.

ECLS-K:1999 math achievement gender gaps.
Between-cohort differences in distributional gaps in direct cognitive assessment scores
Having now seen the distributional gap patterns in both the 2011 (Figure 1) and 1999 (Figure 2) cohorts, we can compare the gaps at the various percentiles of the achievement distribution (Figure 3). Given concerns about the underrepresentation of females among top math scorers, we are particularly interested in whether girls have gained ground at the top of the distribution.

Between-cohort differences in math achievement gaps.
Figure 3 reveals that in the fall of kindergarten, the gender gap favors boys by less in the 2011 cohort than it did in the 1999 cohort from about the 75th to 85th percentiles (see Model 1). To elaborate, in Figure 2 (1999 cohort), boys were significantly overrepresented among students above the 75th percentile; by contrast, in Figure 1 (2011 cohort) boys and girls were at a statistical parity below the 85th percentile. This change marks a significantly different trend (all ps < .1 for the range between the 75th and 85th percentiles in Figure 3). However, no other cohort-based differences in the distribution are significant. That is, we cannot claim that boys or girls are gaining any ground below the 75th or above the 85th percentile, according to Model 1. According to Model 2, there are no statistically significant cohort-based differences after we account for demographic and learning behavior differences.
By the spring of kindergarten, Model 1 reveals that girls have gained some ground between the 50th and 65th percentiles, but no other major between-cohort differences were found to be significant. 9 Models 2 and 3 are largely consistent with that pattern, although the range over which girls made progress is smaller. By the spring of first grade, there is no region of the distribution over which significant relative gains were made by boys or girls.
Overall, Figure 3 suggests that the 2011 cohort experienced statistically significantly more gender parity in the middle-upper percentiles during the kindergarten year than did the 1999 cohort. Despite the greater parity in kindergarten, the distributional gender gaps in the 1999 and 2011 cohorts were statistically indistinguishable by the spring of first grade.
Research Question 2: Gender Gaps in Teacher Ratings of Math Proficiency (ARS Scores)
Distributional gaps in 2011 ARS scores
Regarding the gender gap in teacher ratings of mathematical proficiency throughout the distribution in the 2011 cohort (Figure 4), we see some similarities and some discrepancies with the patterns for the direct cognitive assessments. In the fall of kindergarten (Model 1), there is no detectable gender gap in teacher ratings of boys and girls below the 95th percentile—a pattern largely consistent with the direct cognitive gap. However, at the very top of the distribution, teachers rate the math proficiency of girls higher than that of boys—a pattern that sharply contradicts the direct cognitive assessment pattern. That is, whereas the direct assessment finds that only about 33% of students at or above the 99th percentile are female, teachers rate girls to be over 60% of the top students in Model 1. Accounting for learning behaviors (and demographics), teachers no longer rate boys and girls differently in the fall of kindergarten (Model 2). 10 In the spring of kindergarten, we do not see substantial differences in teacher ratings of boys and girls with similar demographics, learning behaviors, prior academic ratings, and prior and current achievement scores (Model 3, middle row). By the spring of Grade 1, however, teachers rate boys higher than similar girls (Model 3, bottom row). Importantly, this underrating of girls in Model 3 is among boys and girls who score equally well on past and current tests and have similar learning behaviors, and occurs throughout the distribution, suggesting a consistent tendency to underestimate girls’ math proficiency among both high- and low-achieving students. The results for the 1999 cohort appear in Figure 5 and are largely consistent with those of the 2011 cohort, as we now discuss.

ECLS-K:2011 gender gaps on the math Academic Rating Scale (teacher ratings).

ECLS-K:1999 gender gaps on the math Academic Rating Scale (teacher ratings).
Between-cohort differences in distributional gaps in ARS scores
Figure 6 shows very few between-cohort differences in the teacher ratings of math proficiency throughout the distribution. The only notable differences are that teachers in 2011 appear to rate girls significantly higher at the very top of the distribution in the fall of kindergarten in both Models 1 and 2—this pattern is also evidenced when comparing Figures 4 and 5. No other significant between-cohort differences emerge consistently across the three models.

Between-cohort differences in gaps in math Academic Rating Scale (teacher ratings).
Perhaps most remarkable is the lack of significant between-cohort differences anywhere in the distribution in Model 3 of the spring of Grade 1. In both the 2011 (Figure 4) and 1999 (Figure 5) cohorts, teachers rated the math performance of girls lower than those of similarly performing and engaged boys, throughout the achievement distribution. The tests performed in Figure 6 provide no evidence that teachers’ perceptions of girls’ and boys’ relative skills have changed over the decade. That is, in first grade, teachers underrated girls by nearly identical and statistically indistinguishable amounts in the 1999 and 2011 cohorts at every point in the achievement distribution.
Research Question 3: The Role of Learning Behaviors in Gender Gaps Throughout the Achievement Distribution
According to teacher ratings of students’ behavior, girls consistently demonstrate better learning behaviors than do boys, in both cohorts and at all time points within each cohort (see Table 1). The 2011 gender gaps in Externalizing Problem Behaviors and Approaches to Learning were substantial, with differences between boys and girls, averaging 0.37 to 0.57 standard deviations. Positive attributes by themselves, learning behaviors also strongly relate to achievement and may buffer girls from losses in math while boosting their advantage in reading (DiPrete & Jennings, 2012). Although teachers rate girls’ math proficiency comparatively higher than what would be expected by their test performance alone (Robinson & Lubienski, 2011), this seeming advantage in teacher ratings for girls disappears once teacher ratings of learning behaviors are accounted for, suggesting that teachers conflate behavior and math proficiency when rating students (Robinson-Cimpian et al., 2014b).
With the present study, we found that teachers rate girls’ math performance lower than that of boys when teacher ratings of learning behaviors are accounted for (see Model 2 in Figures 4 and 5). This pattern is evident in most of the achievement distribution as early as the spring of kindergarten in both cohorts and is significant throughout the distribution from Grade 1 onward, save for the lowest percentiles. Even when further adjusting for prior and current achievement scores, teachers continue to rate girls’ math proficiency lower than similarly achieving and behaving boys from Grade 1 onward. Notably, these patterns are nearly identical in the 1999 and 2011 cohorts. We later discuss (in the Stereotypes Against Girls in Math subsection) evidence that differences in teachers’ expectations of girls and boys in math may be partly causing the early development of a gender gap in both cohorts.
Prior work has demonstrated that the better learning behaviors of girls may explain why the gender gap does not grow even more in early elementary school (Cornwell et al., 2013; DiPrete & Jennings, 2012; cf. Robinson-Cimpian et al., 2014b; Robinson-Cimpian, Lubienski, Ganley, & Copur-Gencturk, 2014a); however, this is the first study to address how learning behaviors relate to achievement throughout the achievement distribution. The patterns suggest that accounting for learning behaviors has a differential relationship at the top versus the bottom of the achievement distribution.
To illuminate this differential relationship, we performed supplemental analyses to better assess whether (a) the gender gap in learning behaviors was greater at the bottom than the top of the distribution or (b) learning behaviors more strongly relate to achievement percentile in the lower portion of the distribution. Figure 7 provides the results of these analyses for the ECLS-K:2011 data. We found that girls are rated as demonstrating better learning behaviors than boys by about the same amount throughout the achievement distribution (see the first two columns of Figure 7), and thus, a differential in learning behaviors at the top and bottom is unlikely to explain the observed patterns. Rather, these supplemental analyses suggested that the relationship between achievement and learning behaviors—in particular, the Approaches to Learning measure (self-direction, organization, persistence, and eagerness to learn)—is much stronger at the bottom of the distribution than at the top (see the final column of Figure 7).

Exploring the contribution of learning behaviors to predicting the gender achievement gap in math.
Discussion
Given recent changes in education policy and encouraging evidence showing no gender gaps in state test performance, this study examined whether gendered patterns in math achievement and teacher perceptions that were evident in the ECLS-K:1999 data set might be lessened or absent in the ECLS-K:2011 data set. Despite changes in the education landscape, our findings suggest that the gender gap patterns observed for the 1999 cohort are remarkably similar in the 2011 cohort. There are three specific findings to note.
First, in both cohorts, the gender gap developed early at the top of the achievement distribution and spread throughout the distribution during the first few years of elementary school. Second, when boys and girls had the same past and current math achievement and similar behavioral ratings, teachers in both the 1999 and 2011 cohorts underrated the skills of girls throughout the achievement distribution as early as Grade 1. Finally, when we examined whether gendered patterns of learning behaviors explain why boys tend to outscore girls at the top of the distribution and why the reverse may be true at the bottom, we found that gender differences in learning approaches appear to be fairly consistent across the distribution, but girls’ more studious approaches appear to have more payoff at the bottom of the distribution than at the top.
One caveat to consider is that teachers’ ratings of student behavior might be biased by student gender. For example, if teachers rate girls’ behavior as better than that of equally behaving boys, then this bias would contribute to the gender gap we see in teacher ratings of girls and boys as well as to our findings regarding the underrating of “equally” behaving and equally performing girls and boys. This potential bias in teacher ratings of behavior is unlikely to affect our cross-cohort comparisons (assuming teachers were biased similarly in both cohorts), and our findings related to the greater “payoff” of good behavior at the bottom of the achievement distribution than the top (assuming biases were strictly related to gender and not intersected with performance). Still, although it seems unlikely that teacher bias explains the full gender gap in behavior (0.37–0.57 standard deviations), the possibility of biased ratings of behavior suggests that caution is warranted in interpreting results.
Overall, the consistency of gender gaps between the 1999 and the 2011 ECLS-K data is striking. These persistent gaps and the potential mechanisms influencing their development merit further discussion.
The Persistence of Gender Gaps Throughout the Distribution, Especially at the Top
This study was motivated in part by a curiosity regarding whether the gender gap might have reduced since the beginning of NCLB, perhaps due somewhat to the requirement that states report assessment results disaggregated by gender. Our analyses found that math gender gaps (as measured by ECLS-K) did not close during this time of increased accountability, consistent with findings of gender gaps in many non-ECLS-K data sets spanning Grades 1 through 12 (e.g., College Board, 2015; Ellison & Swanson, 2010; Fahle, 2016; Guiso et al., 2008; Reardon et al., 2016b). 11 However, recall that state accountability tests often do not show gender achievement gaps in math (Hyde et al., 2008; see also Reardon et al., 2016a, who find little average gaps on state tests but considerable between-district heterogeneity). Although beyond the scope of this paper, this raises an interesting question: Why do many state tests not reveal gaps when other assessments do—to what extent are the tests measuring different math content versus being more or less sensitive to differences at the top of the distribution, and to what extent are instructional practices contributing to different patterns on the different tests?
The gender gap at the top of the math achievement distribution deserves special attention. In both the ECLS-K:1999 and ECLS-K:2011, girls represent fewer than one third of students above the 99th percentile as early as the spring of kindergarten. Also in both ECLS-K data sets, the underrepresentation of girls at the top worsens, with girls representing fewer than one third of students above the 90th percentile and only one fifth of those above the 99th percentile by Grade 3 in the older cohort and Grade 2 in the newer cohort. Clearly, this gender gap at the top of the distribution develops before students enter kindergarten, worsens through elementary school, and has not improved over the last decade.
Gender gaps at the top of the distribution have been found in other data sets that contain challenging items and are not tied to school or state curriculum standards, including NAEP (Lubienski et al., 2004), the SAT (College Board, 2015), the American Mathematics Competition (Ellison & Swanson, 2010), and the OECD’s PISA (Guiso et al., 2008). For instance, among 15-year-old PISA takers in the United States, females perform about 0.1 standard deviations worse than males on average, but the gap is most pronounced at the top of the distribution: Girls represent about 46% of students above the 75th percentile but only about 23% of those above the 99th percentile (Guiso et al., 2008). Of all students taking the SAT in 2015, 1.73 times as many male students as female students scored at or above the 95th percentile (College Board, 2015). Thus, the PISA and SAT Mathematics patterns are remarkably consistent with those we find among students as young as age 6, which may suggest that these later-grade gaps are rooted in gaps that emerge early in childhood.
Potential Mechanisms for the Early Development of the Gender Gap in Math
Thus far, the data suggest that in two cohorts more than a decade apart, gender gaps in achievement are present at the top of the distribution early on and spread quickly to parts further down the distribution, especially when we look at similarly behaving boys and girls. This could leave one with the impression that gender gaps are inevitable and develop quickly; however, prior research points to two prominent possible explanations for this early growth in the gender gap that warrant further consideration: (a) stereotypes and (b) gendered patterns of mathematical problem solving.
Stereotypes against girls in math
Stereotypes abound that link males to math, and to STEM more broadly, and students throughout the grade distribution endorse these stereotypes (e.g., Cvencek et al., 2011; Nosek, Banaji, & Greenwald, 2002), even when males and females are performing equally well and participating equally (Grunspan et al., 2016). Research suggests that teachers likely endorse these stereotypes. For instance, teachers have been found to attribute boys’ failures at math to a lack of effort but attribute girls’ failures to a lack of ability and their successes to hard work (Tiedemann, 2000).
Our findings suggest that females are uniformly underrated relative to their academically and behaviorally similar male peers. That is, the underrating occurs throughout the distribution, suggesting that the tendency to underrate females is not relegated to just the high- or low-performing females but rather to the group female in general. The underrating is significant at virtually all points in the distribution as early as Grade 1 and continues into later grades (we can observe the later grades only for ECLS-K:1999 because ECLS-K:2011 stopped collecting teacher ratings after Grade 1).
The tendency of teachers to underrate girls in comparison to equally performing and behaving boys is particularly important to recognize because a prior instrumental-variables analysis with the ECLS-K:1999—which we replicated with data from the new cohort in supplemental analyses—suggests that this underrating has a direct effect on the growth of the gender achievement gap (Robinson-Cimpian et al., 2014b). 12 That is, the widening of the gender gap in math achievement we have documented in two separate cohorts is likely due in part to the lower expectations that teachers (and society; Nosek et al., 2009; Penner, 2014; Pope & Sydnor, 2010) hold of girls. More research is necessary to better understand the link between teacher expectations and the early emergence of the gender gap, including how teacher perceptions actually influence girls’ math learning.
Additionally, more research is needed to understand the math gender gap we see at the top of the distribution upon entry to kindergarten. Although high-SES parents tend to espouse more egalitarian beliefs (Marks, Lam, & McHale, 2009), an earlier ECLS-K study found that high-SES children were more likely than their low-SES peers to participate in parent-initiated activities aligned with gender stereotypes, such as dance lessons for girls (Lubienski, Robinson, Crane, & Ganley, 2013), consistent with the notion of “concerted cultivation” (i.e., fostering children’s abilities through numerous organized activities; see Lareau, 2003) but with a gendering pattern. Although the activities, themselves, did not generally correlate with mathematics achievement, the study suggests that high-SES children, who tend to be at the top of the achievement distribution, may experience other gendered parenting practices that could contribute to the early gender gaps we see among high math achievers.
Gendered patterns of problem-solving techniques
Given our findings that girls are observed to exhibit better learning behaviors, one question worth further consideration is whether “good girl” behavior actually inhibits girls’ advanced mathematics learning. Several studies have suggested that boys and girls have different problem-solving approaches, with boys more likely to use bolder strategies, such as “backwards reasoning” (Winkelmann, van den Heuvel-Panhuizen, & Robitzsch, 2008), and girls more likely to use familiar, teacher-given, procedural strategies, in both U.S. and international contexts (Carr & Jessup, 1997; Che, Wiegert, & Threlkeld, 2012; Fennema, Carpenter, Jacobs, Franke, & Levi, 1998; Gallagher et al., 2000; Gallagher & De Lisi, 1994; Goodchild & Grevholm, 2009; Zhu, 2007). It could be that compliant, “good girl” behavior can help girls learn material taught in early math classes, but has drawbacks in terms of the development of girls’ mathematical confidence and achievement, particularly as they encounter increasingly complex mathematics tasks that require more flexible problem-solving approaches (Goodchild & Grevholm, 2009). This theory is consistent with girls scoring as well as boys on state tests while being underrepresented among top scorers on other tests less tied to the school curriculum.
Conclusion
The persistence of the gender gap across two ECLS-K cohorts over a decade apart and the mounting evidence from many other types of math assessments demonstrating its early emergence make clear that this gap deserves more attention than it receives in our public awareness and education accountability policies. In both data sets, the gap emerges early, starting first at the top of the achievement distribution and working its way completely down the distribution in the first 3 to 4 years of school. Girls’ stronger approaches to learning may help narrow the gender gap in math at lower ranges of the achievement distribution but may do less to help the persistent gap at the top of the distribution. We also found consistent evidence across both cohorts that teachers give lower ratings to girls when boys and girls perform and behave similarly; this underrating of girls relative to observationally similar boys was found throughout the achievement distribution and suggests that teachers must perceive girls as working harder than similarly achieving boys in order to rate them as similarly proficient in math. This work points to the importance of examining gaps throughout the achievement distribution as well as further examining the causes of early gender gaps in math, including the role that teacher expectations and students’ learning behaviors and problem-solving approaches may play in their development.
Footnotes
Acknowledgements
The research reported here was supported by the Institute of Education Sciences, U.S. Department of Education, through Grant R305B100017 to the University of Illinois. The opinions expressed are those of the authors and do not represent views of the Institute or the U.S. Department of Education. A portion of Joseph Robinson Cimpian’s time was supported by a National Academy of Education/Spencer Foundation Postdoctoral Fellowship. We thank Andrei Cimpian for helpful comments on an earlier draft.
Notes
Authors
JOSEPH R. CIMPIAN, PhD, is an associate professor of economics and education policy at the New York University Steinhardt School of Culture, Education, and Human Development, Kimball Hall, 2nd floor, New York, NY 10003;
SARAH T. LUBIENSKI, PhD, is a professor in the Department of Curriculum and Instruction at the University of Illinois at Urbana-Champaign, College of Education, 1310 S. 6th St., Champaign, IL 61820;
JENNIFER D. TIMMER, MA, is a doctoral student in the Department of Educational Psychology at the University of Illinois at Urbana-Champaign, College of Education, 1310 S. 6th St., Champaign, IL 61820;
MARTHA B. MAKOWSKI, MS, is a doctoral student in the Department of Curriculum and Instruction at the University of Illinois at Urbana-Champaign, College of Education, 1310 S. 6th St., Champaign, IL 61820;
EMILY K. MILLER, PhD, is an assistant professor in the Department of Mathematics at West Chester University, 25 University Avenue, West Chester, PA 19382;
References
Supplementary Material
Please find the following supplemental material available below.
For Open Access articles published under a Creative Commons License, all supplemental material carries the same license as the article it is associated with.
For non-Open Access articles published, all supplemental material carries a non-exclusive license, and permission requests for re-use of supplemental material or any part of supplemental material shall be sent directly to the copyright owner as specified in the copyright notice associated with the article.