
Abstract
Objective:
Australia’s Better Access initiative enables Australians with mental disorders to receive sessions of evidence-based psychological treatment following referral from an eligible provider (usually a general practitioner), subsidised through Medicare. As part of a commissioned evaluation, we examined patterns of Better Access treatment.
Methods:
We sourced aggregated Medicare Benefits Schedule data from Services Australia on Better Access services delivered from 1 January 2018 to 30 June 2022. From this, we developed profiles of Better Access treatment over time and according to key consumer characteristics.
Results:
In 2021, over 1.3 million Australians received at least one treatment session subsidised through Better Access (up by 0.9% per year since 2018). People living in medium/high socioeconomic status areas within major cities, females and young adults were more likely to receive Better Access treatment compared to other groups. Consumers made an out-of-pocket payment for two-thirds (64.8%) of treatment sessions in 2021 (vs 52.7% in 2018). The median out-of-pocket payment per session was constant between 2018 and 2021 ($74) but increased to $90 in the first half of 2022. In 2021, 29.9% of fees charged for all treatment sessions nationally came from consumer out-of-pocket payments (vs 24.5% in 2018). Fewer people accessed treatment following referral in 2021 than in 2018 (58.8% vs 66.9%), and those who did waited longer until their first session (median 22 days in 2021 vs 18 days in 2018).
Conclusion:
Better Access enables many Australians to receive psychological treatment. Efforts are required to address gaps in access and increased wait time and consumer costs.
Keywords
Introduction
Australia’s Better Access to Psychiatrists, Psychologists and General Practitioners through the Medicare Benefits Schedule initiative (Better Access) was introduced in late 2006. Better Access offers people with diagnosed mental disorders access to government-subsidised evidence-based psychological therapy (Australian Government Department of Health and Aged Care [DHAC], 2023). Demand for Better Access services was high from the outset and has continued to grow, with the majority of psychology services delivered in Australia now estimated to be funded through Better Access (Pirkis et al., 2022).
Better Access provides several treatment pathways. The main pathway involves the preparation of a mental health treatment plan, typically by a general practitioner (GP) or Prescribed Medical Practitioner (PMP), after which an eligible consumer can be referred for various treatment options including psychological treatment funded under Better Access. Better Access treatment sessions can be delivered by clinical psychologists (‘psychological therapy services’) or by psychologists, social workers, occupational therapists or GPs/PMPs (‘focussed psychological strategies’). Sessions can be delivered individually or in groups, with a maximum of 10 per calendar year for each. The referrer should review a consumer’s plan at least once. Other Better Access pathways enable psychiatrists to conduct initial consultations with new (i.e. not seen by the psychiatrist in the preceding 24 months) consumers, prepare a psychiatrist assessment and management plan, refer for treatment under various options including Better Access and to review care (DHAC, 2023).
Better Access services are listed on the Medicare Benefits Schedule (MBS), with item numbers specific to the type of provider and the service being delivered. Each MBS item number has an associated fee (the amount the Government deems appropriate for the service) and a benefit (the amount the Government will reimburse to the consumer). The consumer is either ‘bulk-billed’ (i.e. the provider accepts the Medicare benefit as full payment) or makes a co-payment (i.e. the provider charges a higher fee, and the consumer pays the difference between the fee and benefit out-of-pocket).
Better Access has evolved over time. In response to COVID-19, for example, consumers could access 10 additional individual treatment sessions per year. The additional 10 sessions were introduced in August-October 2020 and ceased as planned in December 2022. Also in response to COVID-19, individual treatment sessions and GP/PMP services were made available via telehealth/phone to all consumers (previously only available to those in eligible areas). These services were introduced March to April 2020, with telehealth/phone treatment items continuing, and GP/PMP phone items ending June 2021. More recently, changes have been made to GP/PMP arrangements. From 1 November 2025, benefits for mental health treatment plans, referrals and reviews will only be payable if completed at the consumer’s MyMedicare practice or by their usual medical practitioner. The dedicated GP/PMP mental health consultation items (to support ongoing care of a person with a mental disorder) and review items were retired from the MBS, with general attendance items to be used instead (Australian Government Department of Health, Disability and Ageing, 2025).
We conducted an evaluation of Better Access in 2009–2011 which included an analysis of MBS data describing Better Access services delivered during the first 3 years of the programme (Harris et al., 2010). In 2009, one in every 19 Australians received at least one Better Access service, and one in 38 received at least one treatment session. Some groups were less likely to access treatment sessions: males (vs females), people aged <15 and ⩾65+ years (vs 15–64 years), people living in rural/remote areas (vs capital cities) and people living in relatively more socioeconomically disadvantaged areas (vs less disadvantaged areas). Most treatment sessions (57–65%) involved a consumer co-payment, with an average out-of-pocket payment of $32–$37 per session ($62–$72 in 2021–2022 dollars). Nationally, the total fees charged for treatment sessions totalled $334.3 million ($650 million in 2021–2022 dollars), of which 71.8% was contributed by government and 18.2% by consumer out-of-pocket payments. Studies over the ensuing decade suggest that these differentials in access to treatment have persisted (Harrison et al., 2012; Meadows et al., 2015; Rosenberg and Hickie, 2019) and that out-of-pocket payments have increased (Rosenberg et al., 2022). Our evaluation also found that, in 2008, the median number of treatment sessions following a mental health treatment plan was five. Approximately 1-in-3 plans were reviewed by a GP/PMP using the review items (Harris et al., 2010). A later study found that this had changed little by 2016–2017 (Rosenberg and Hickie, 2019). Consumers and providers indicate that wait times for mental health care have increased in recent years (Productivity Commission, 2020); however, data on wait times for Better Access treatment have not been published.
In 2021–2022, we conducted a new evaluation of Better Access that included 10 studies (Pirkis et al., 2022). This study and eight others are reported in this issue of the Australian and New Zealand Journal of Psychiatry (Arya et al., 2026; Chilver et al., 2026; Currier et al., 2026; Harris et al., 2026; Newton et al., 2026; Pirkis et al., 2026a, 2026b; Tapp et al., 2026). This study is one of two that involved analyses that used population-level MBS data (see also Chilver et al., 2026). In this paper, we explored: What is the uptake and utilisation of Better Access services? How much does Better Access treatment cost the government and consumers? What are the patterns of Better Access treatment following a mental health treatment plan? For each question we explored changes over time (2018–2022) and variations according to consumer characteristics.
Methods
Data supply and scope
Services Australia maintains a database of all MBS services for which a claim was made. They supplied all data used in this study according to a set of specifications we developed. The scope of data included all Better Access services rendered from 1 January 2018 to 30 June 2022 and processed up to and including 7 August 2022 (the date the data were extracted). The period began on 1 January 2018 because Services Australia only holds 5 years of data at the time of extraction. For this study, the Better Access MBS items were grouped according to provider type and purpose, with further subgrouping by mode of service and whether they were additional sessions (Table 1). Services Australia also provided population counts, based on the number of people enrolled in Medicare at the end of each calendar year.
Better Access Medicare Benefits Schedule items used in this study.
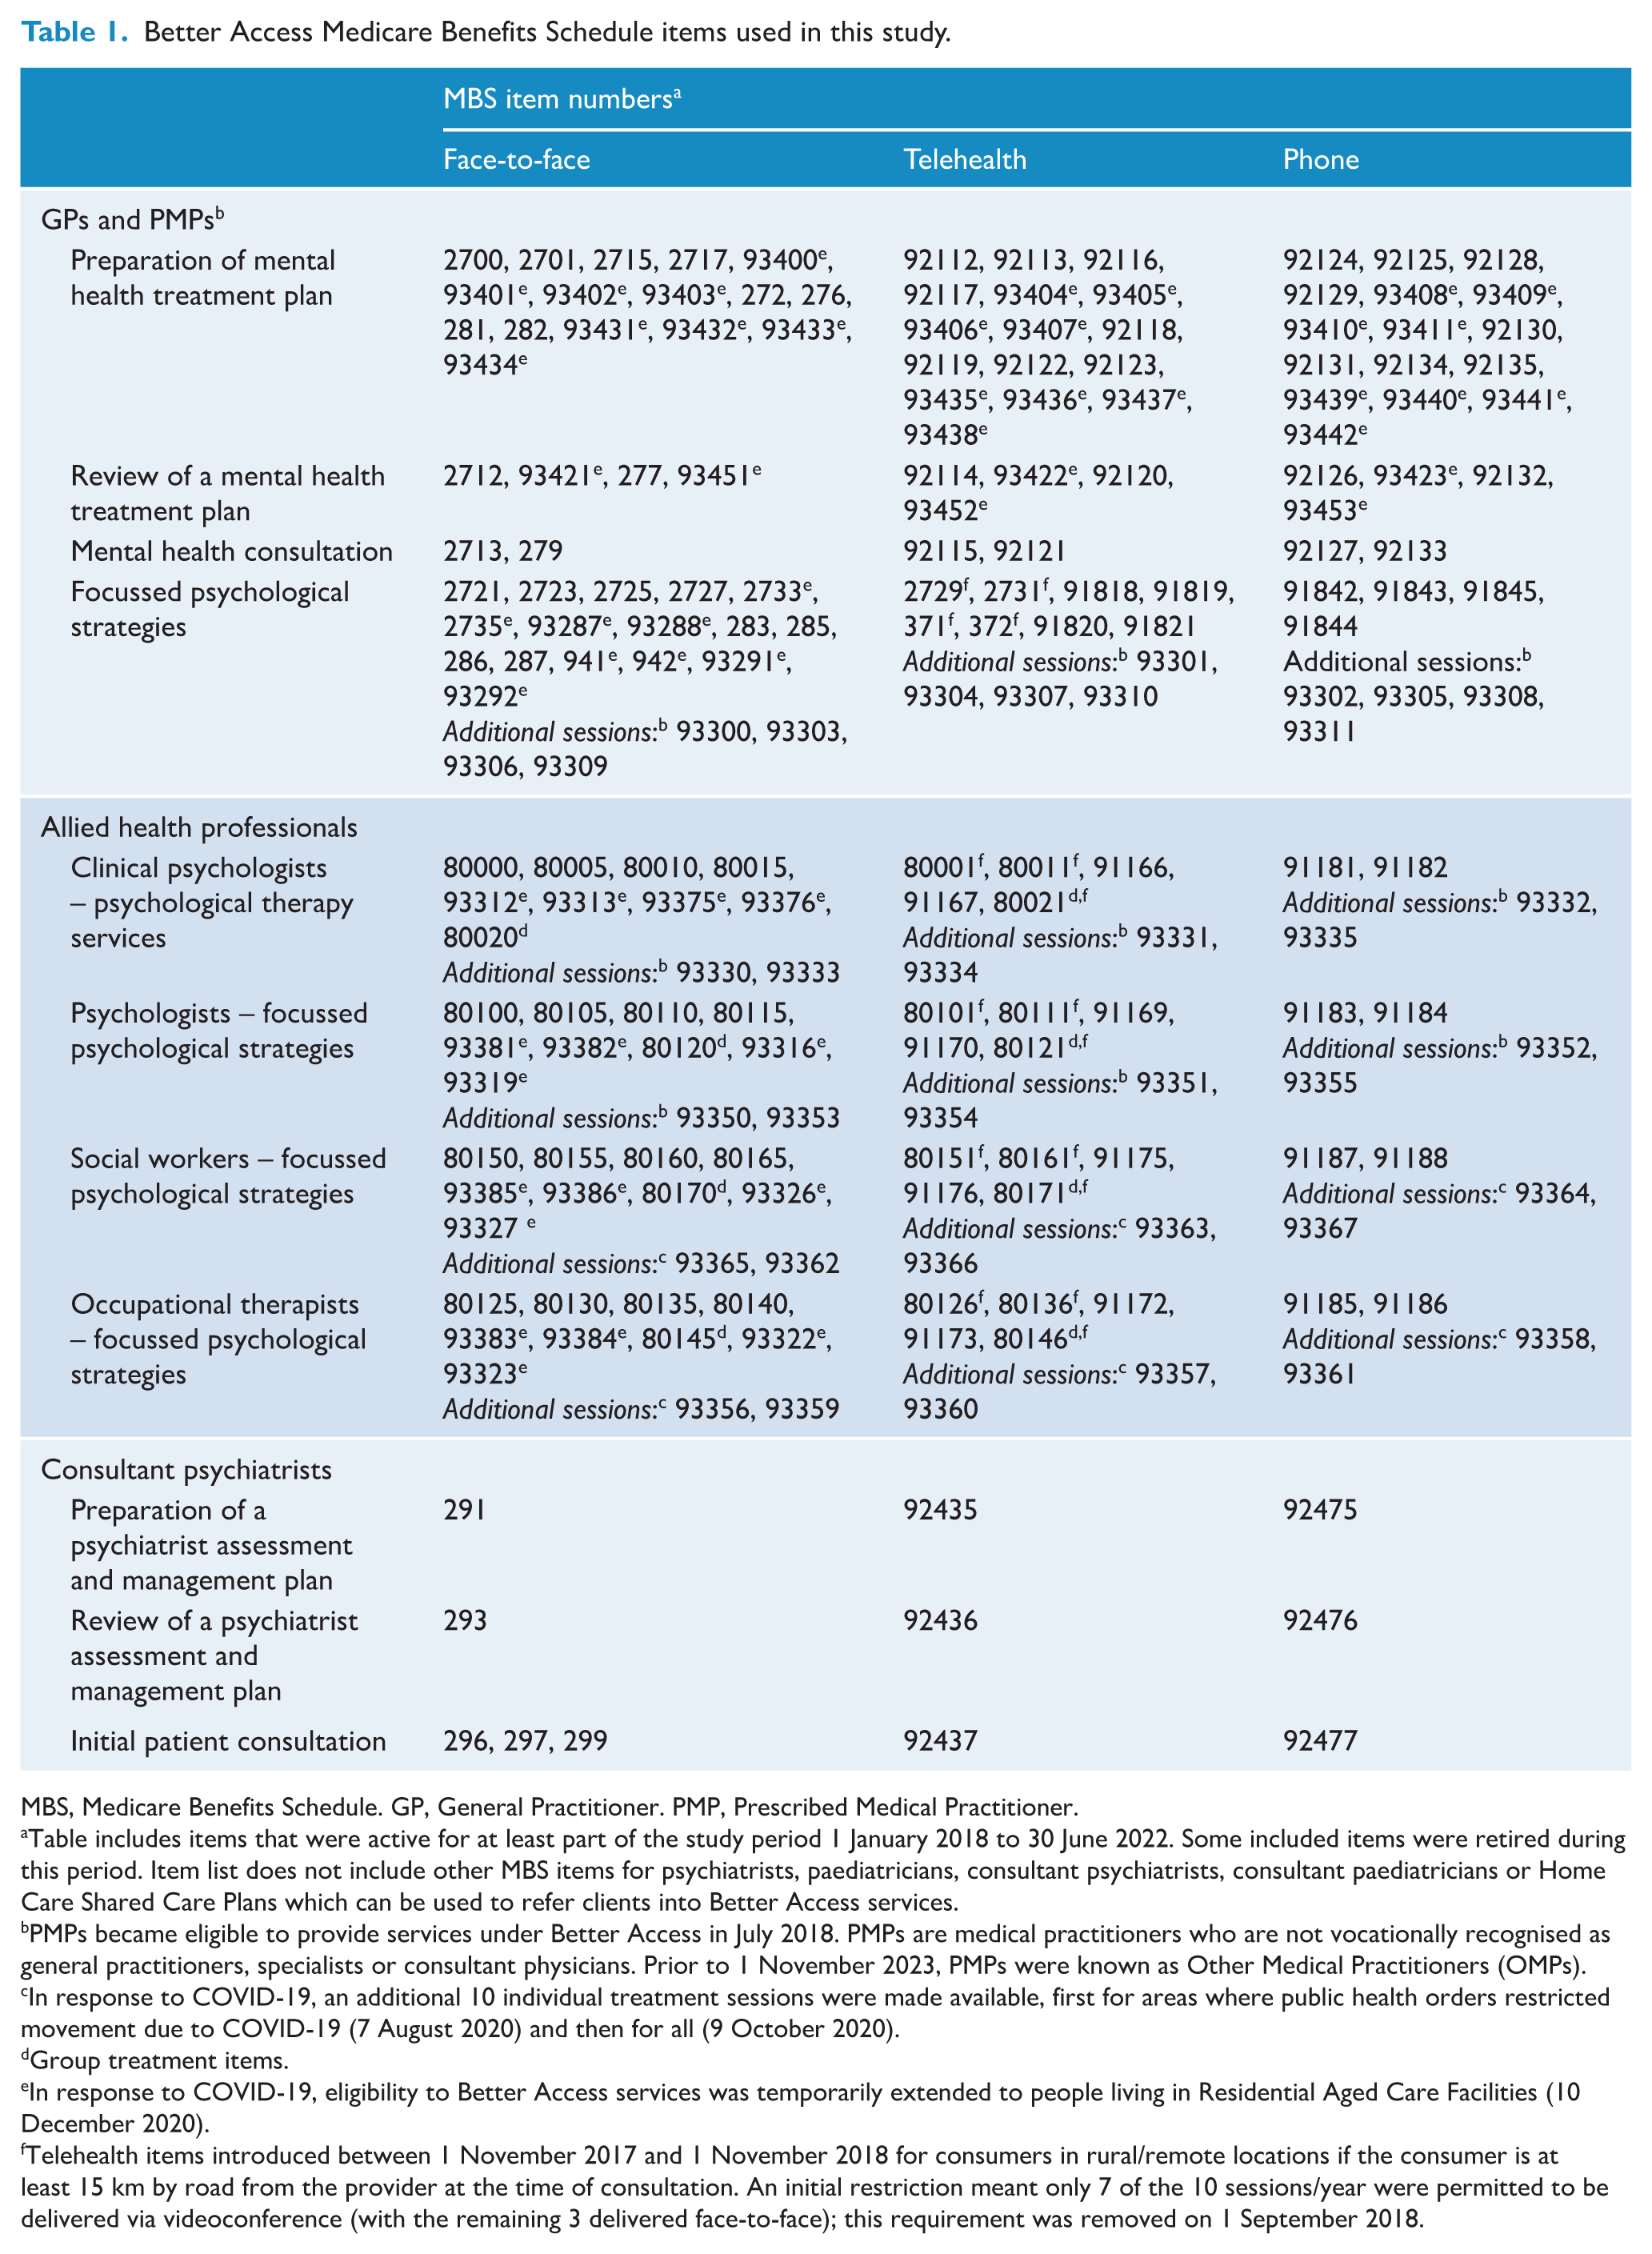
MBS, Medicare Benefits Schedule. GP, General Practitioner. PMP, Prescribed Medical Practitioner.
Table includes items that were active for at least part of the study period 1 January 2018 to 30 June 2022. Some included items were retired during this period. Item list does not include other MBS items for psychiatrists, paediatricians, consultant psychiatrists, consultant paediatricians or Home Care Shared Care Plans which can be used to refer clients into Better Access services.
PMPs became eligible to provide services under Better Access in July 2018. PMPs are medical practitioners who are not vocationally recognised as general practitioners, specialists or consultant physicians. Prior to 1 November 2023, PMPs were known as Other Medical Practitioners (OMPs).
In response to COVID-19, an additional 10 individual treatment sessions were made available, first for areas where public health orders restricted movement due to COVID-19 (7 August 2020) and then for all (9 October 2020).
Group treatment items.
In response to COVID-19, eligibility to Better Access services was temporarily extended to people living in Residential Aged Care Facilities (10 December 2020).
Telehealth items introduced between 1 November 2017 and 1 November 2018 for consumers in rural/remote locations if the consumer is at least 15 km by road from the provider at the time of consultation. An initial restriction meant only 7 of the 10 sessions/year were permitted to be delivered via videoconference (with the remaining 3 delivered face-to-face); this requirement was removed on 1 September 2018.
All data were supplied to us in aggregated form. For the most part, the data were organised into reference periods defined by calendar years because Better Access programme rules regarding the permissible number of treatment sessions are based on calendar year. These data were used to create annual summaries of uptake, utilisation and costs. To examine treatment patterns, data were not limited to a single year but rather followed consumers over a period defined by clinical milestones (e.g. number of treatment sessions received following a mental health treatment plan).
The University of Melbourne Human Research Ethics Committee approved the study (2021-22771-22273-2). The Services Australia External Requests Evaluation Committee approved the data request (EREC RMS2103).
Measures
Services Australia supplied summary statistics for various groupings of Better Access MBS items: counts of persons who used services (i.e. uptake) and services delivered (i.e. utilisation); the sum of provider fees charged; the sum of MBS benefits paid; counts of persons making a co-payment; median (and interquartile range) out-of-pocket payments for services where a co-payment was made; and median (and interquartile range) number of services delivered. Virtually all Better Access MBS services were either bulk-billed or had a non-zero out-of-pocket cost; however, for a small percentage of services, the patient was billed but with an out-of-pocket cost of zero. Only services for which the consumer contributed a non-zero co-payment were included in out-of-pocket cost estimates.
Summary statistics were stratified by consumer characteristics: age group (0–14, 15–24, 25–44, 45–64 and 65+ years), sex (male, female) and geographic area group. Geographic area group was based on a schema used by the Australian Institute of Health and Welfare (AIHW, 2021) which applies standardised area-level information about remoteness and relative socioeconomic disadvantage (Australian Bureau of Statistics [ABS], 2018a, 2018b) to classify a person’s area of residence into one of six categories: major cities (higher socioeconomic areas); major cities (medium socioeconomic areas); major cities (lower socioeconomic areas); inner regional areas; outer regional areas and remote (including very remote) areas. Given that a consumer’s age or address may have changed during the reference period, their characteristics at the last date of service in the reference period were applied to all services for that consumer in the reference period.
Statistical analyses
We converted counts of persons and services to crude rates per 1000 population to enable comparisons over time adjusted for population growth. We converted provider fees charged, MBS benefits paid and out-of-pocket costs to 2021–2022 values using the ABS Consumer Price Index for Medical and Hospital Services (ABS, 2022a). For most measures, we calculated the average annual rate of change (AIHW, n.d.) over the interval 2018–2021. Cell sizes <10 were suppressed, with consequential suppression applied where necessary so that the suppressed cell values could not be calculated.
Results
What is the uptake and utilisation of Better Access services?
Table 2 provides a summary of uptake and utilisation across all Better Access services annually between 2018 and 30 June 2022. In 2021 (the last full year of data supplied), more than 2.6 million people (one in every 10 Australians) received at least one Better Access service of any kind. The services with the highest uptake (38–54% of persons) were preparation of a mental health treatment plan (GP/PMP), mental health consultations (GP/PMP) and, as a group, Better Access treatment. Uptake of most services increased over time, except psychiatrist plans and reviews and focussed psychological strategies provided by occupational therapists. A total of 11.3 million Better Access services were delivered in 2021.
Uptake and utilisation of Better Access services, 2018 to 2022.
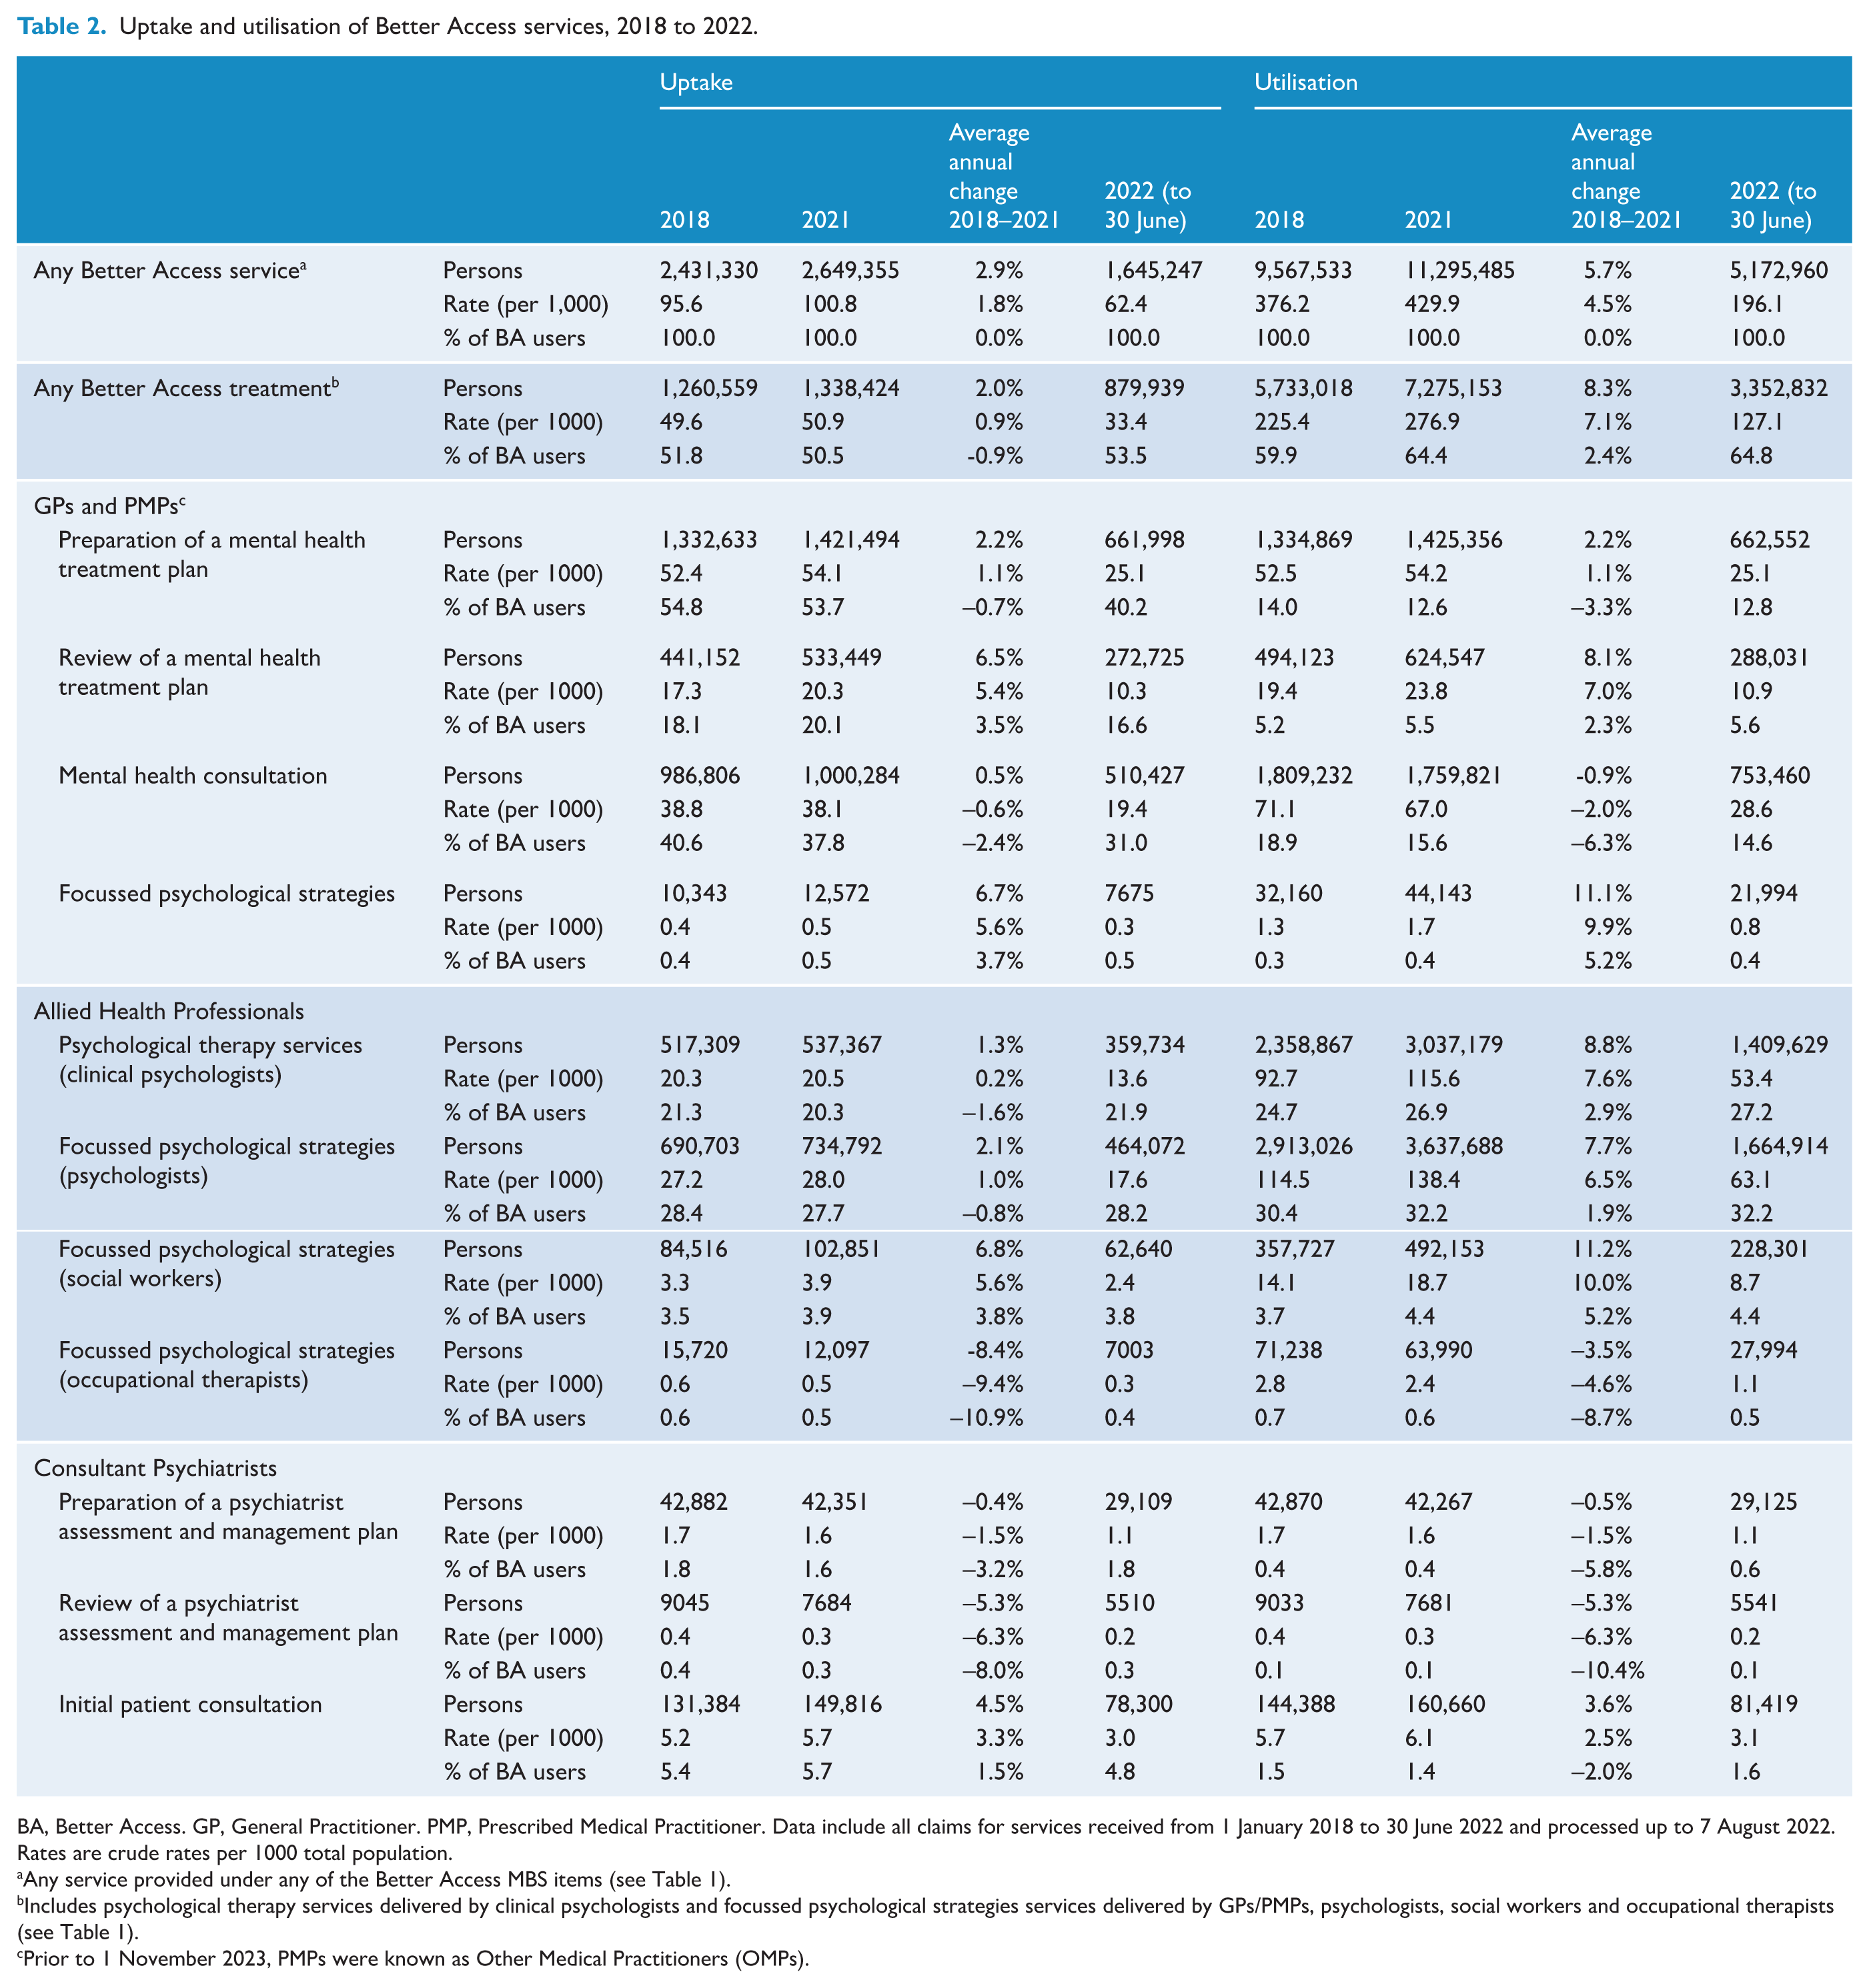
BA, Better Access. GP, General Practitioner. PMP, Prescribed Medical Practitioner. Data include all claims for services received from 1 January 2018 to 30 June 2022 and processed up to 7 August 2022. Rates are crude rates per 1000 total population.
Any service provided under any of the Better Access MBS items (see Table 1).
Includes psychological therapy services delivered by clinical psychologists and focussed psychological strategies services delivered by GPs/PMPs, psychologists, social workers and occupational therapists (see Table 1).
Prior to 1 November 2023, PMPs were known as Other Medical Practitioners (OMPs).
More than 1.3 million Australians (one in every 20) received at least one Better Access treatment session in 2021, with more people accessing treatment sessions provided by clinical psychologists and psychologists (20.5 and 28.0 per 1000), relative to GPs/PMPs, social workers and occupational therapists (0.5–3.9 per 1000). Uptake of treatment sessions increased over time for most types of providers, except occupational therapists. Nearly 7.3 million Better Access treatment sessions were delivered in 2021. Notably, the number of people for whom a new mental health treatment plan was completed in each year increased by 2.2% and the number of people receiving treatment increased by 2.0%, whereas the number of treatment sessions delivered increased by 8.3%.
Figure 1 shows uptake and utilisation of Better Access treatment sessions according to consumers’ characteristics. In each of the years 2018 to 2021, uptake and utilisation were higher among females (compared to males), people aged 15–24 and 25–44 years (compared to other age groups), and people living in major cities and inner regional areas (compared to outer regional and remote areas). Between 2018 and 2021, the largest relative increases in uptake and utilisation were for people in major cities (high and medium socioeconomic status) and people in remote areas compared to other areas (although absolute uptake and utilisation remained lowest in remote areas compared to all other areas).
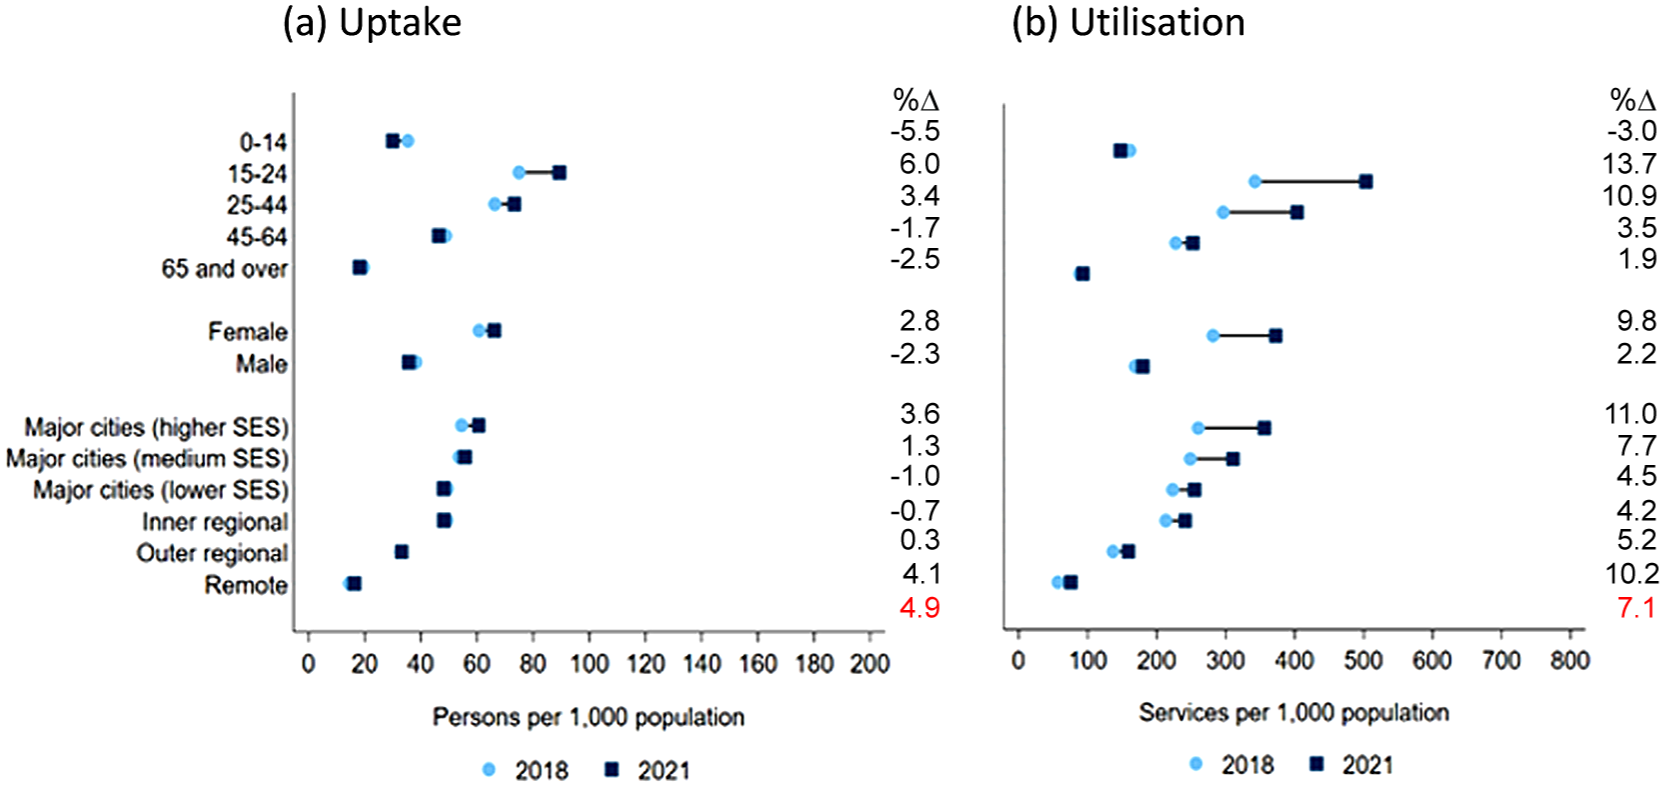
Uptake and utilisation of Better Access treatment, by consumer characteristics, 2018 to 2021.
Table 3 profiles the types of treatment items used before and after the introduction of the additional 10 treatment sessions and telehealth/phone options in the second half of 2020. In 2021, the first full year of these changes, almost 15% of all treatment sessions were billed via the additional session items. Relatively few (<1.2%) treatment sessions were delivered via telehealth in 2018–2020, reflecting the location-based restrictions in place prior to March 2020. In 2021, almost one-third of sessions were delivered via telehealth (20.6%) or phone (8.0%). Use of telehealth, but not phone, services continued to expand into 2022.
Profile of treatment items used, 2018 to 2022.
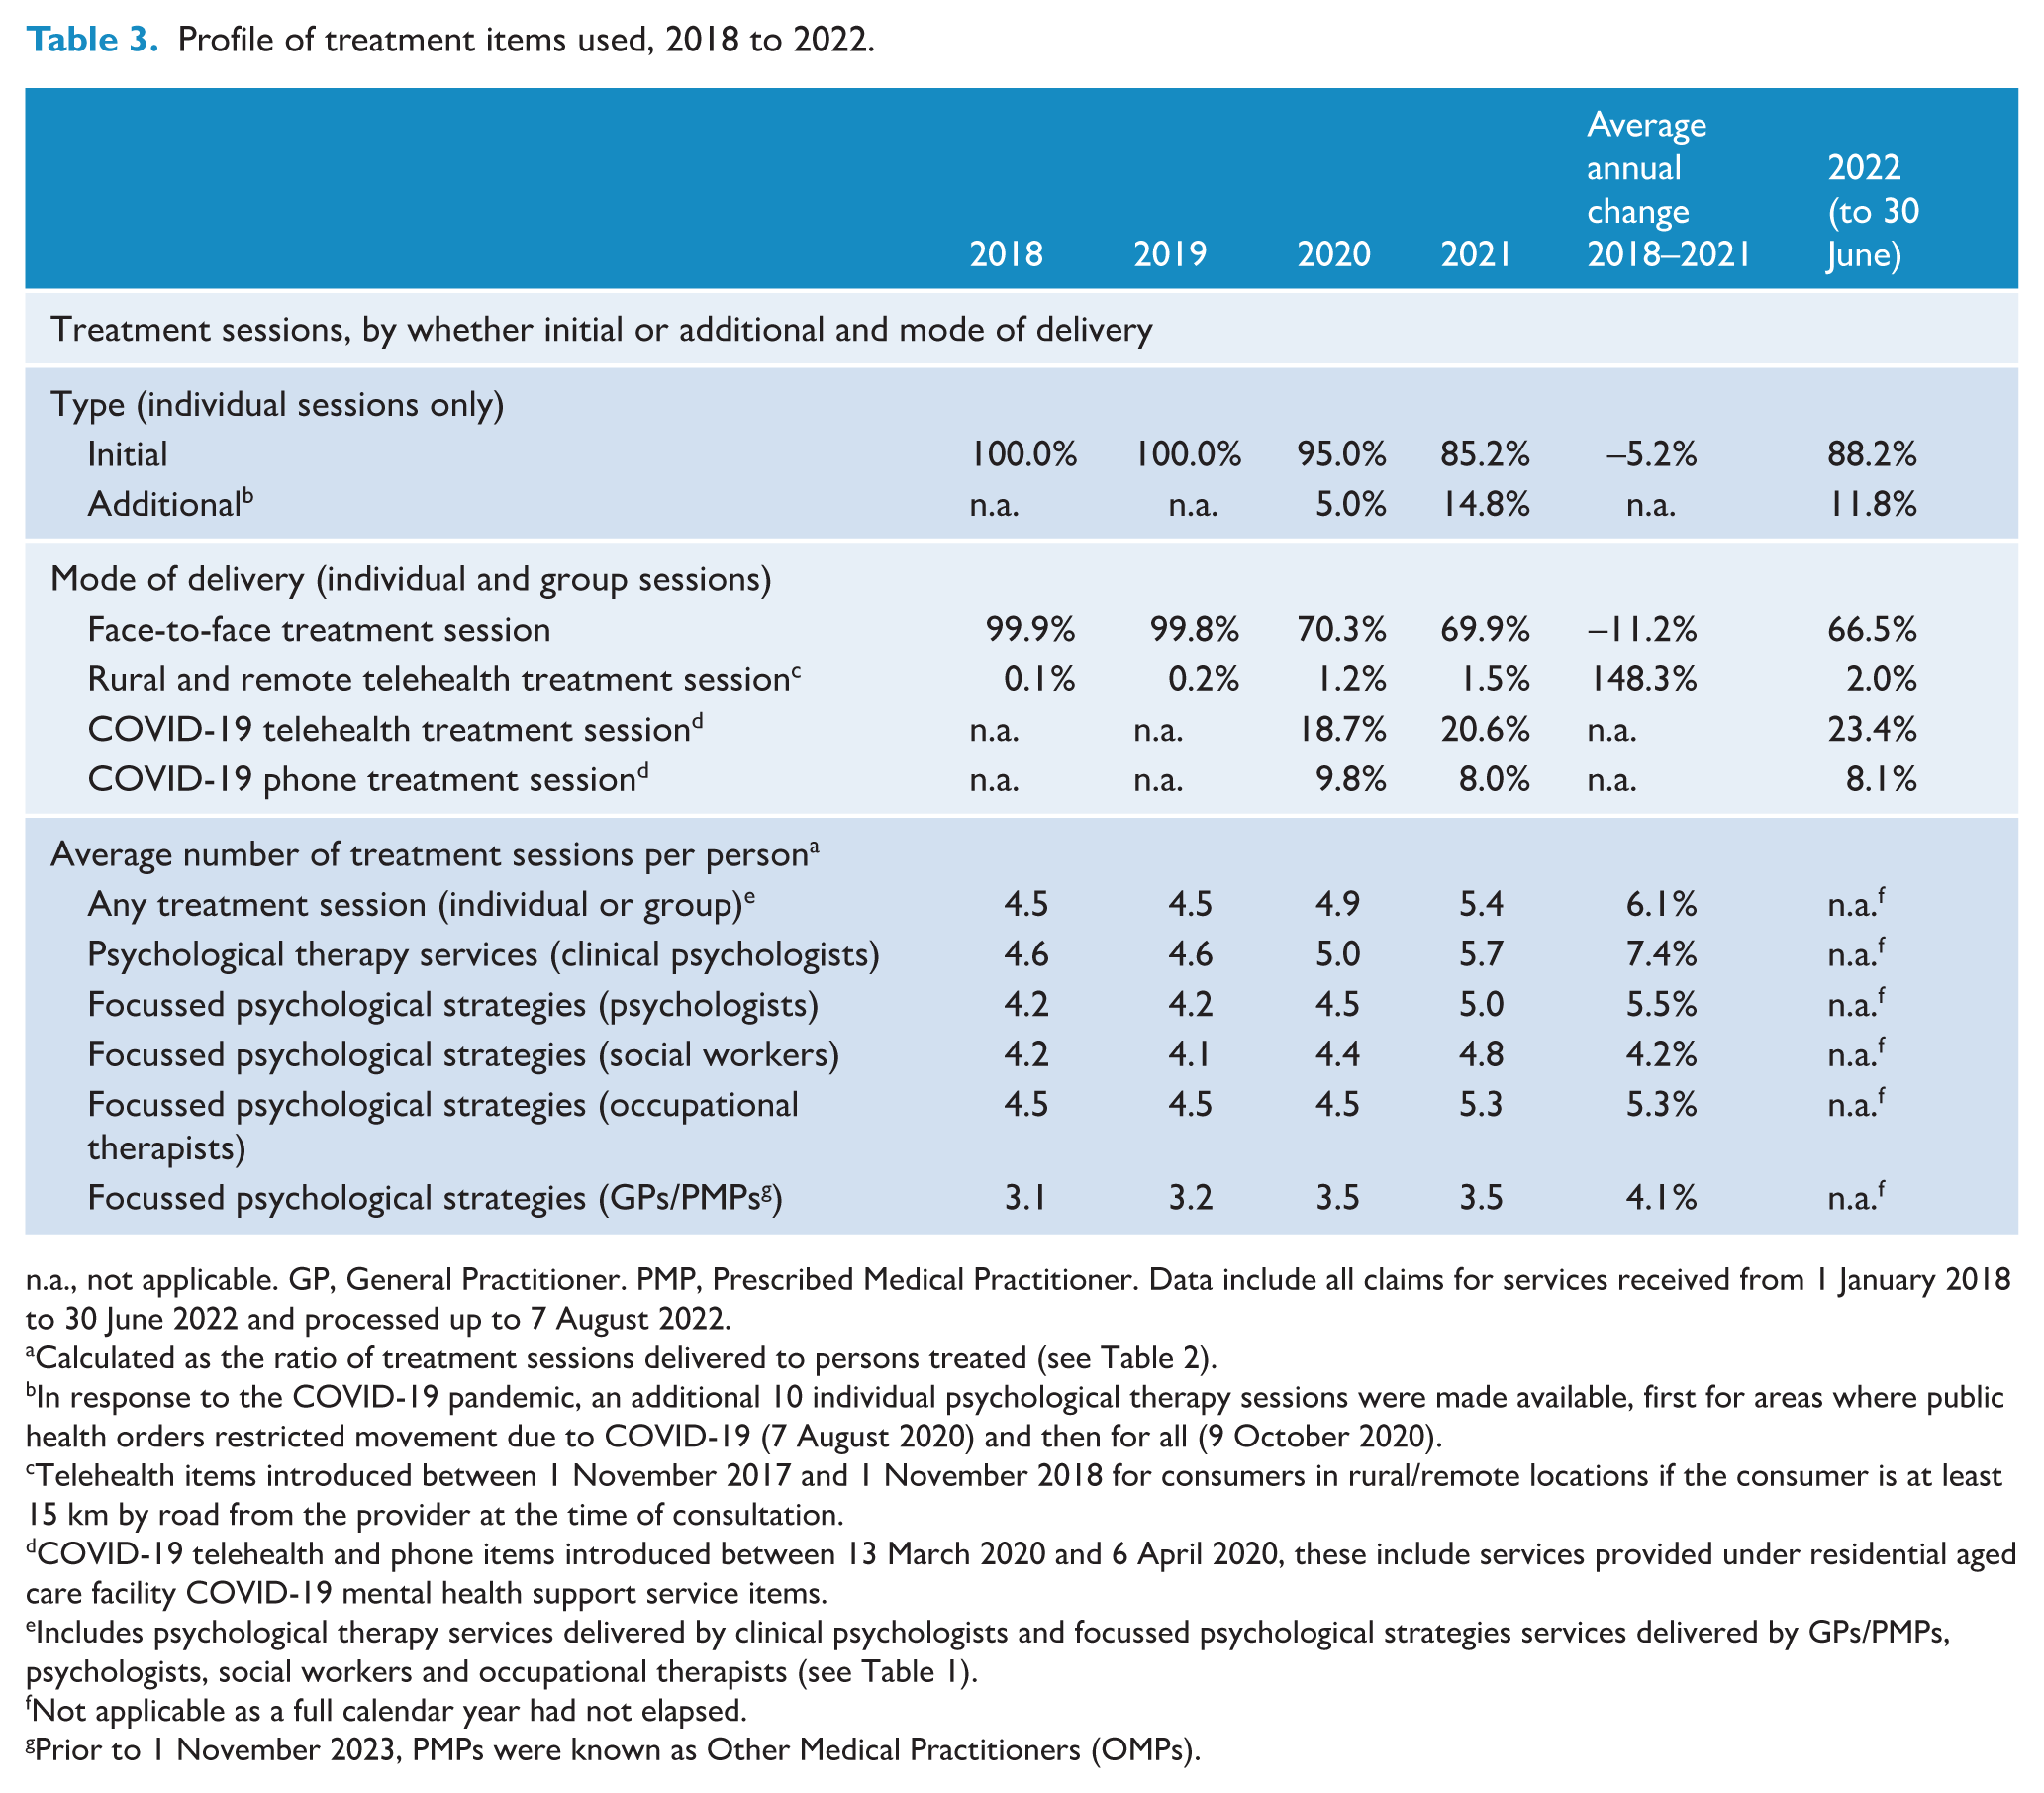
n.a., not applicable. GP, General Practitioner. PMP, Prescribed Medical Practitioner. Data include all claims for services received from 1 January 2018 to 30 June 2022 and processed up to 7 August 2022.
Calculated as the ratio of treatment sessions delivered to persons treated (see Table 2).
In response to the COVID-19 pandemic, an additional 10 individual psychological therapy sessions were made available, first for areas where public health orders restricted movement due to COVID-19 (7 August 2020) and then for all (9 October 2020).
Telehealth items introduced between 1 November 2017 and 1 November 2018 for consumers in rural/remote locations if the consumer is at least 15 km by road from the provider at the time of consultation.
COVID-19 telehealth and phone items introduced between 13 March 2020 and 6 April 2020, these include services provided under residential aged care facility COVID-19 mental health support service items.
Includes psychological therapy services delivered by clinical psychologists and focussed psychological strategies services delivered by GPs/PMPs, psychologists, social workers and occupational therapists (see Table 1).
Not applicable as a full calendar year had not elapsed.
Prior to 1 November 2023, PMPs were known as Other Medical Practitioners (OMPs).
Table 3 also shows the average number of treatment sessions used by each person who received Better Access treatment. In 2021, an average of 5.4 sessions were used, higher than in previous years (averages 4.5–4.9) which corresponds with the introduction of programme changes described above. The average number of sessions increased over time for all provider types.
How much does Better Access treatment cost the government and consumers?
Table 4 shows the costs of Better Access treatment. In 2021 nationally, the cost to government (i.e. benefits paid) for treatment sessions was $827 million, equating to $618 per treatment user or $31 per capita. In 2021, approximately 29.9% of the total fees charged by service providers ($1180.6 m) were contributed by consumers in the form of out-of-pocket payments ($353.5 m) compared with 70.1% contributed by the government in the form of benefits paid. The relative contribution from out-of-pocket payments increased over time from 24.5% in 2018 to 35.6% in the first half of 2022. Put another way, in 2022, for every $1.81 spent by the government on treatment sessions, consumers spent $1.
Costs of Better Access treatment, 2018 to 2022.
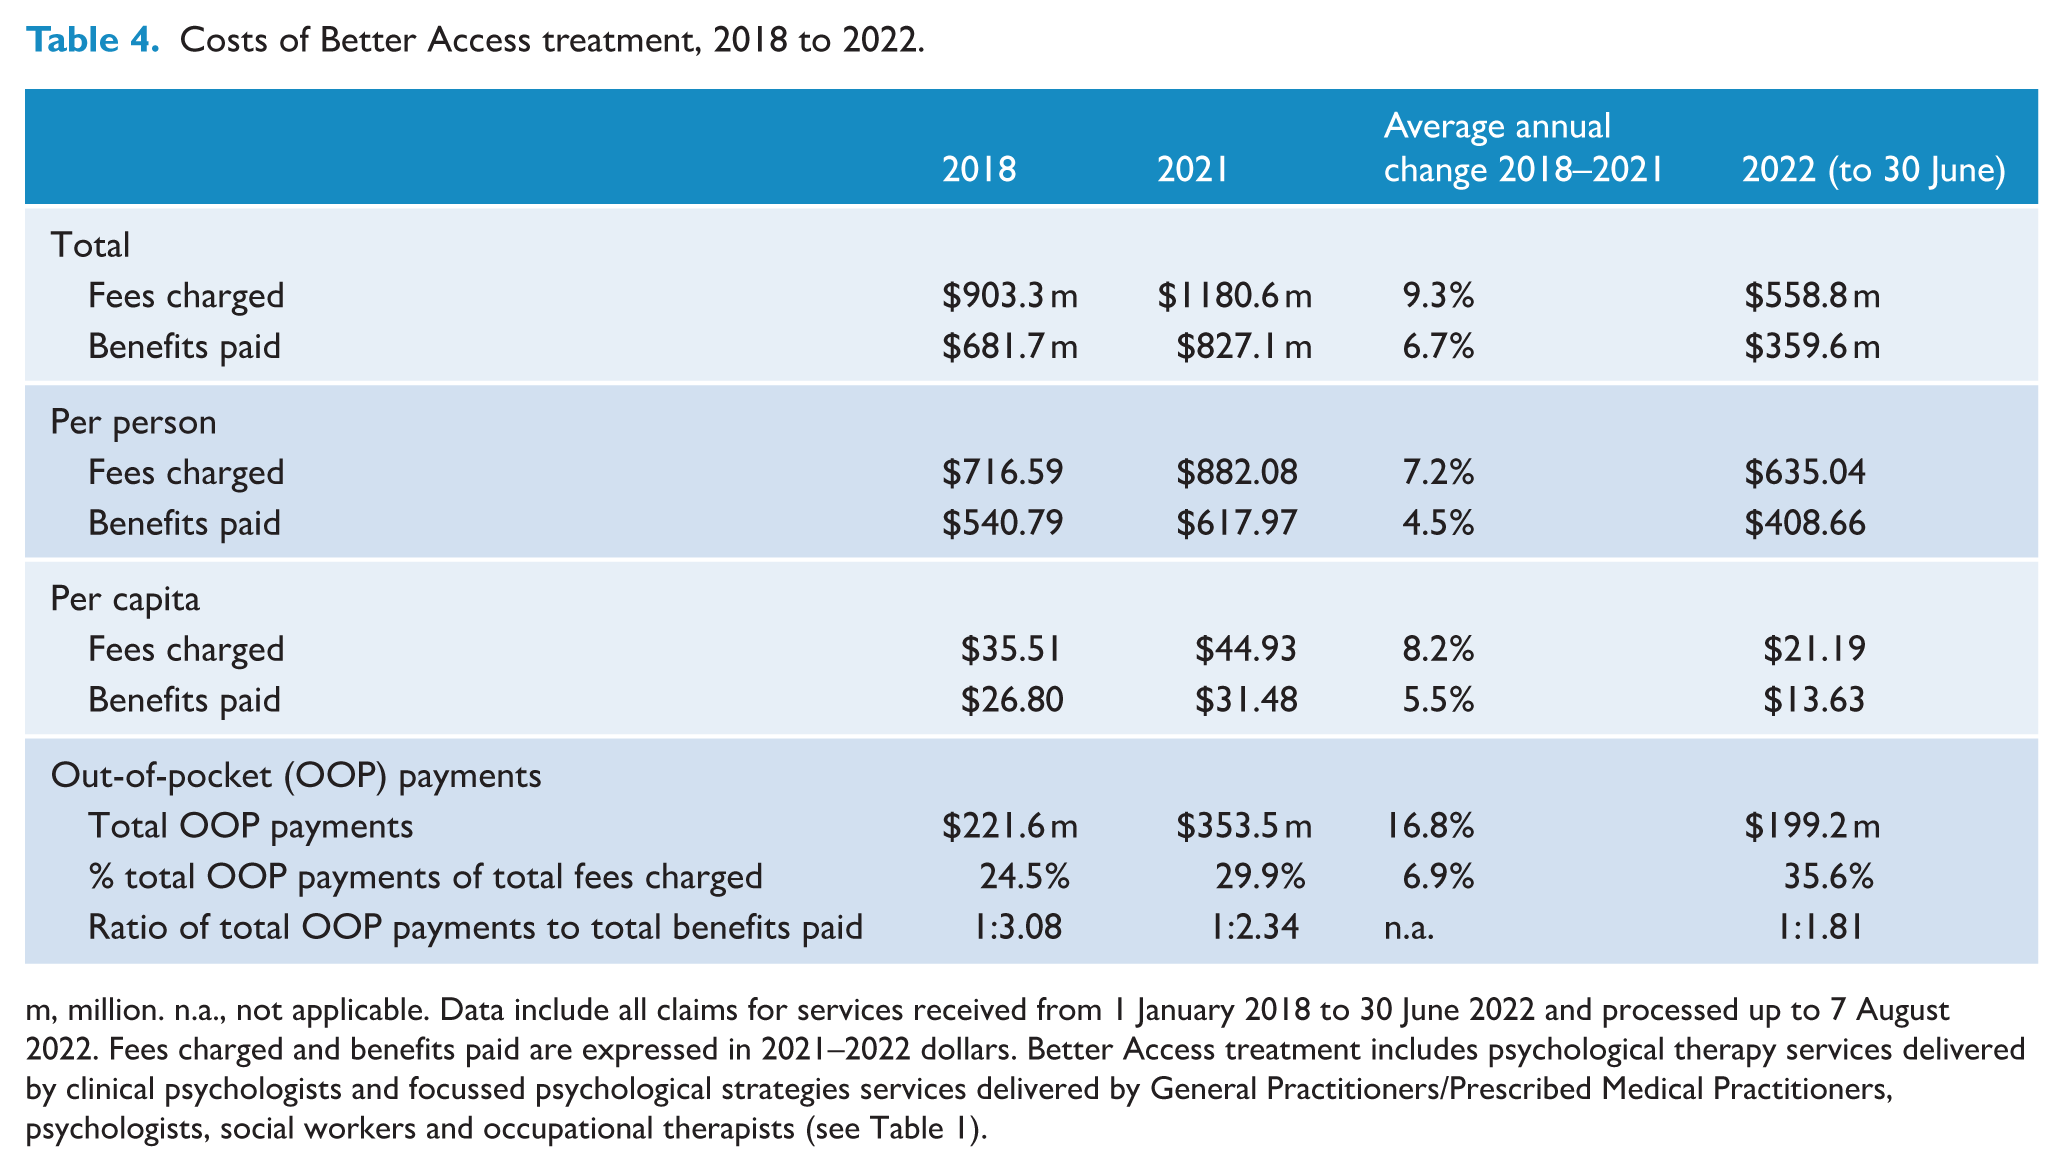
m, million. n.a., not applicable. Data include all claims for services received from 1 January 2018 to 30 June 2022 and processed up to 7 August 2022. Fees charged and benefits paid are expressed in 2021–2022 dollars. Better Access treatment includes psychological therapy services delivered by clinical psychologists and focussed psychological strategies services delivered by General Practitioners/Prescribed Medical Practitioners, psychologists, social workers and occupational therapists (see Table 1).
Table 5 details co-payment rates and consumer out-of-pocket payments per Better Access treatment session. In 2021, 64.8% of treatment sessions involved a co-payment; it was lowest for sessions delivered by GPs/PMPs (32.3%) and highest for sessions delivered by clinical psychologists (68.8%). Co-payment rates increased between 2018 and 2021 for the three provider types who provide the majority of treatment sessions – clinical psychologists, psychologists and social workers – but did not change meaningfully for others. Co-payment rates increased thereafter for all provider groups, such that nearly 70% of treatment sessions involved a consumer co-payment in the first half of 2022. In 2021, the median out-of-pocket payment per treatment session was $74; it was lowest for treatment sessions delivered by delivered by GPs/PMPs ($62) and highest for treatment sessions delivered by psychologists ($83). Between 2018 and 2021, the median was unchanged overall, although this varied across different types of providers. In the first half of 2022, the median out-of-pocket payment per treatment session increased to $90 (>$80 for all treatment providers except for GPs/PMPs at $63).
Co-payment rates and out-of-pocket payments per treatment session paid by consumers, 2018 to 2022.
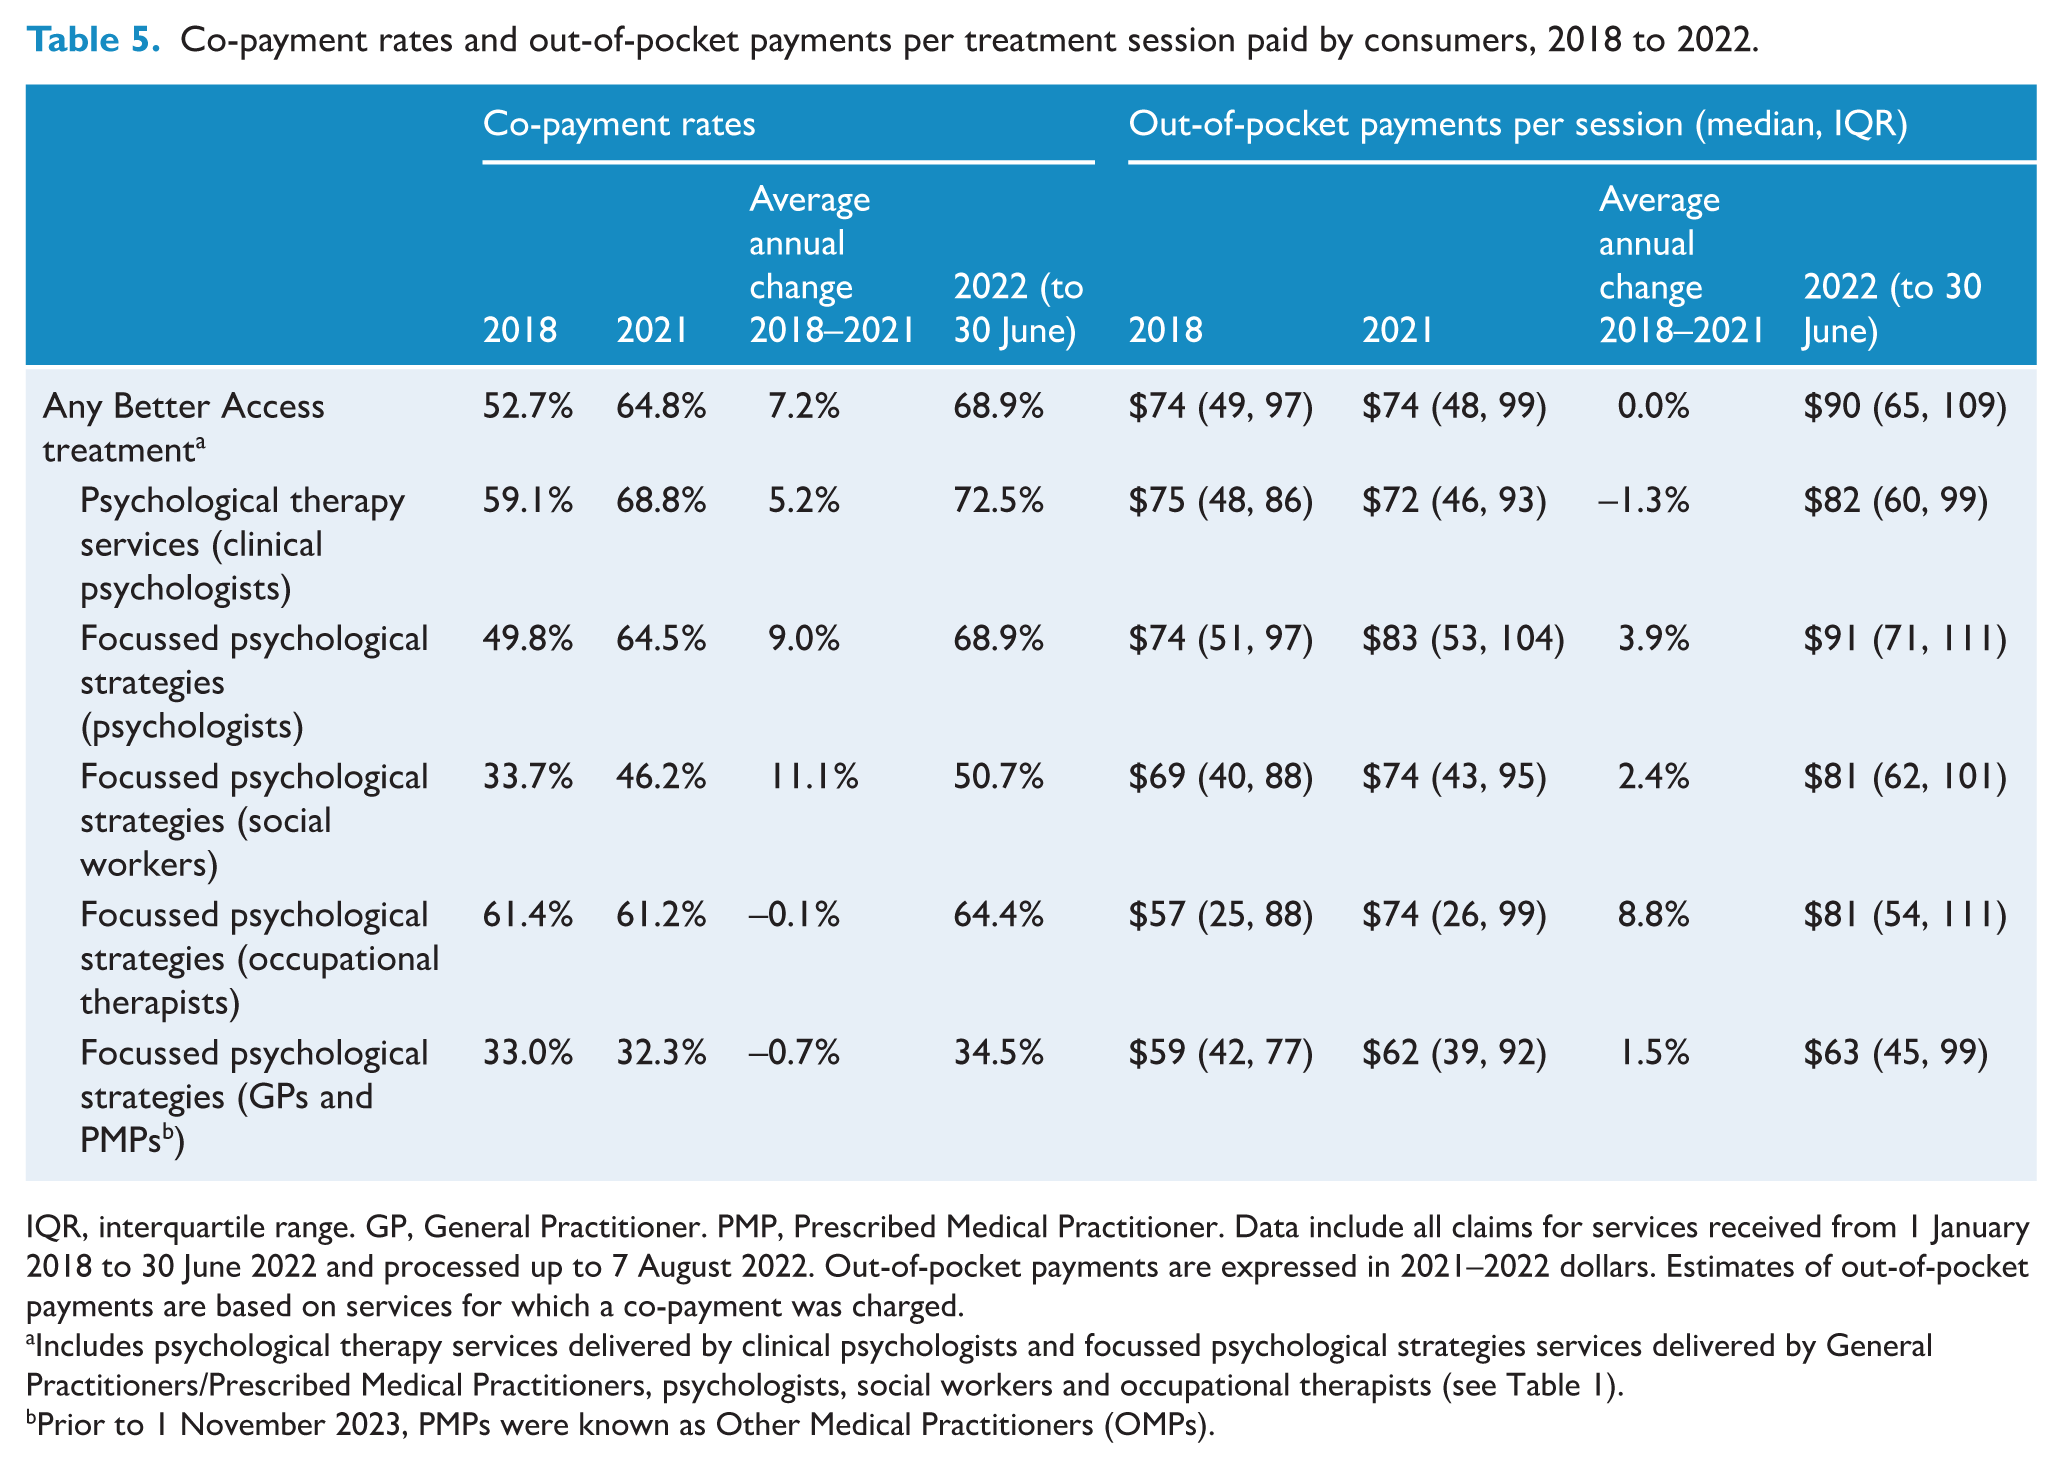
IQR, interquartile range. GP, General Practitioner. PMP, Prescribed Medical Practitioner. Data include all claims for services received from 1 January 2018 to 30 June 2022 and processed up to 7 August 2022. Out-of-pocket payments are expressed in 2021–2022 dollars. Estimates of out-of-pocket payments are based on services for which a co-payment was charged.
Includes psychological therapy services delivered by clinical psychologists and focussed psychological strategies services delivered by General Practitioners/Prescribed Medical Practitioners, psychologists, social workers and occupational therapists (see Table 1).
Prior to 1 November 2023, PMPs were known as Other Medical Practitioners (OMPs).
Figure 2 shows co-payment rates and out-of-pocket payments for different sociodemographic groups. Across age groups, co-payment rates were highest for people under 45 years of age and lowest for people aged 65 and over. People living in areas of high and medium socioeconomic status in major cities had higher co-payment rates (vs all other areas). When a co-payment was made, the median out-of-pocket payment was lower for people aged 65 and over (vs all other age groups) and higher for people living in higher socioeconomic areas in major cities and remote areas (vs all other areas).
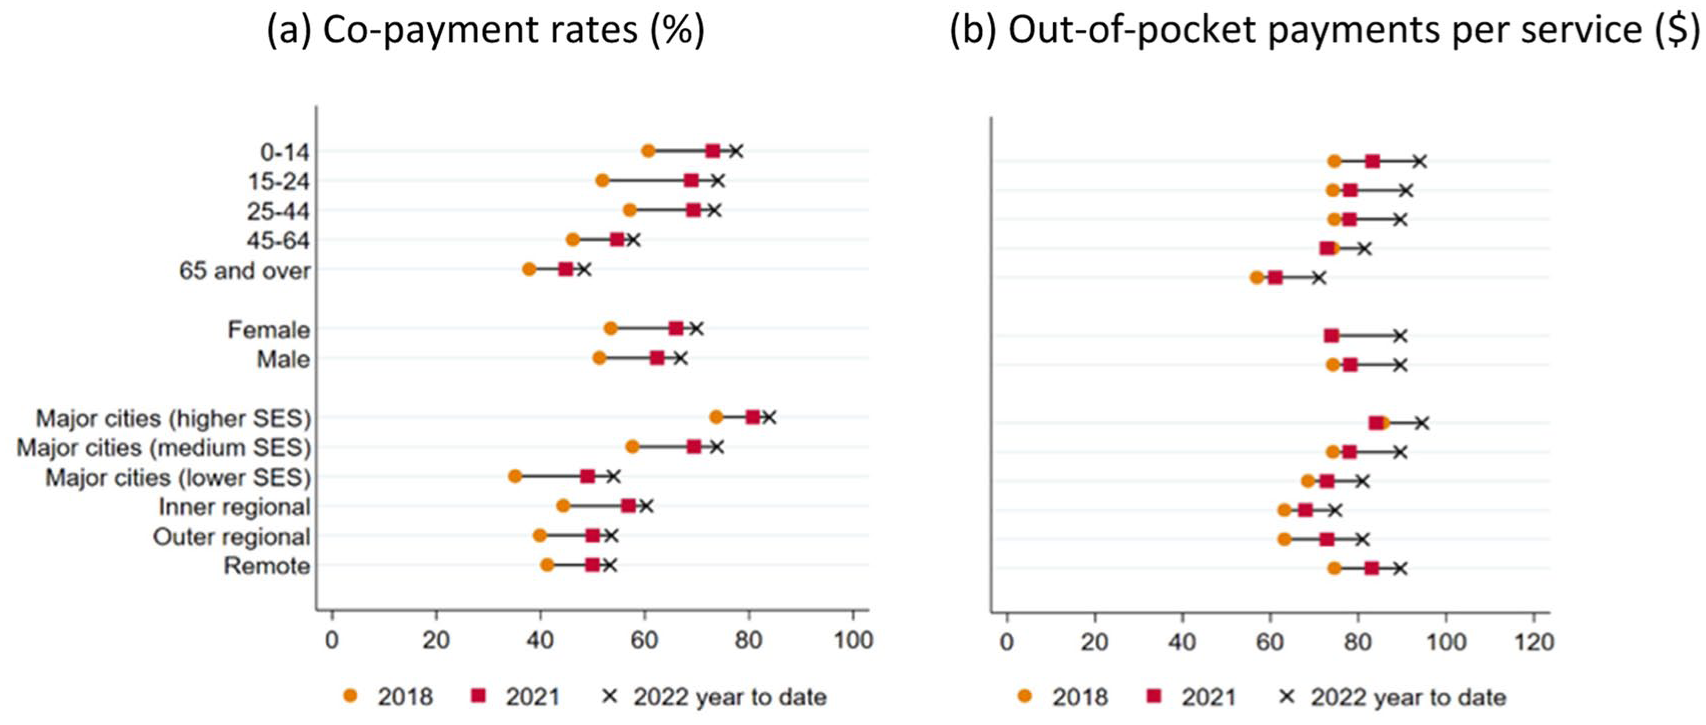
Co-payment rates and out-of-pocket payments for Better Access treatment, by consumer characteristics, 2018 to 2022.
What are the patterns of Better Access treatment following a mental health treatment plan?
Table 6 shows treatment patterns following preparation of a mental health treatment plan. In interpreting these results, it should be noted that the counts include all treatment sessions received after a plan and are not limited to a calendar year, and people who received plans in late 2021 may only have had 6 months of follow-up time in which to receive subsequent treatment sessions or reviews because our data only went to 30 June 2022. The majority of plans were followed by at least one treatment session, with some evidence of a decrease over time (66.9% in 2018 to 58.8% in 2021). Of plans that were followed by treatment sessions, relatively few involved more than 21 sessions (<5% in all years); this proportion increased over time, likely due to the introduction of the additional 10 individual sessions in late 2020. Fewer than 1-in-3 of all plans completed in 2018–2020 were followed by a review. Among the subset of plans that were followed by Better Access treatment sessions, the proportion was much higher (approximately 1-in-2.5). As expected, the proportions were slightly lower in 2021 due to the shorter follow-up time available. The median time elapsed between preparation of a plan and the first treatment session increased from 18 days in 2018 to 22 days in 2021.
Treatment patterns following a mental health treatment plan completed 2018 to 2021.
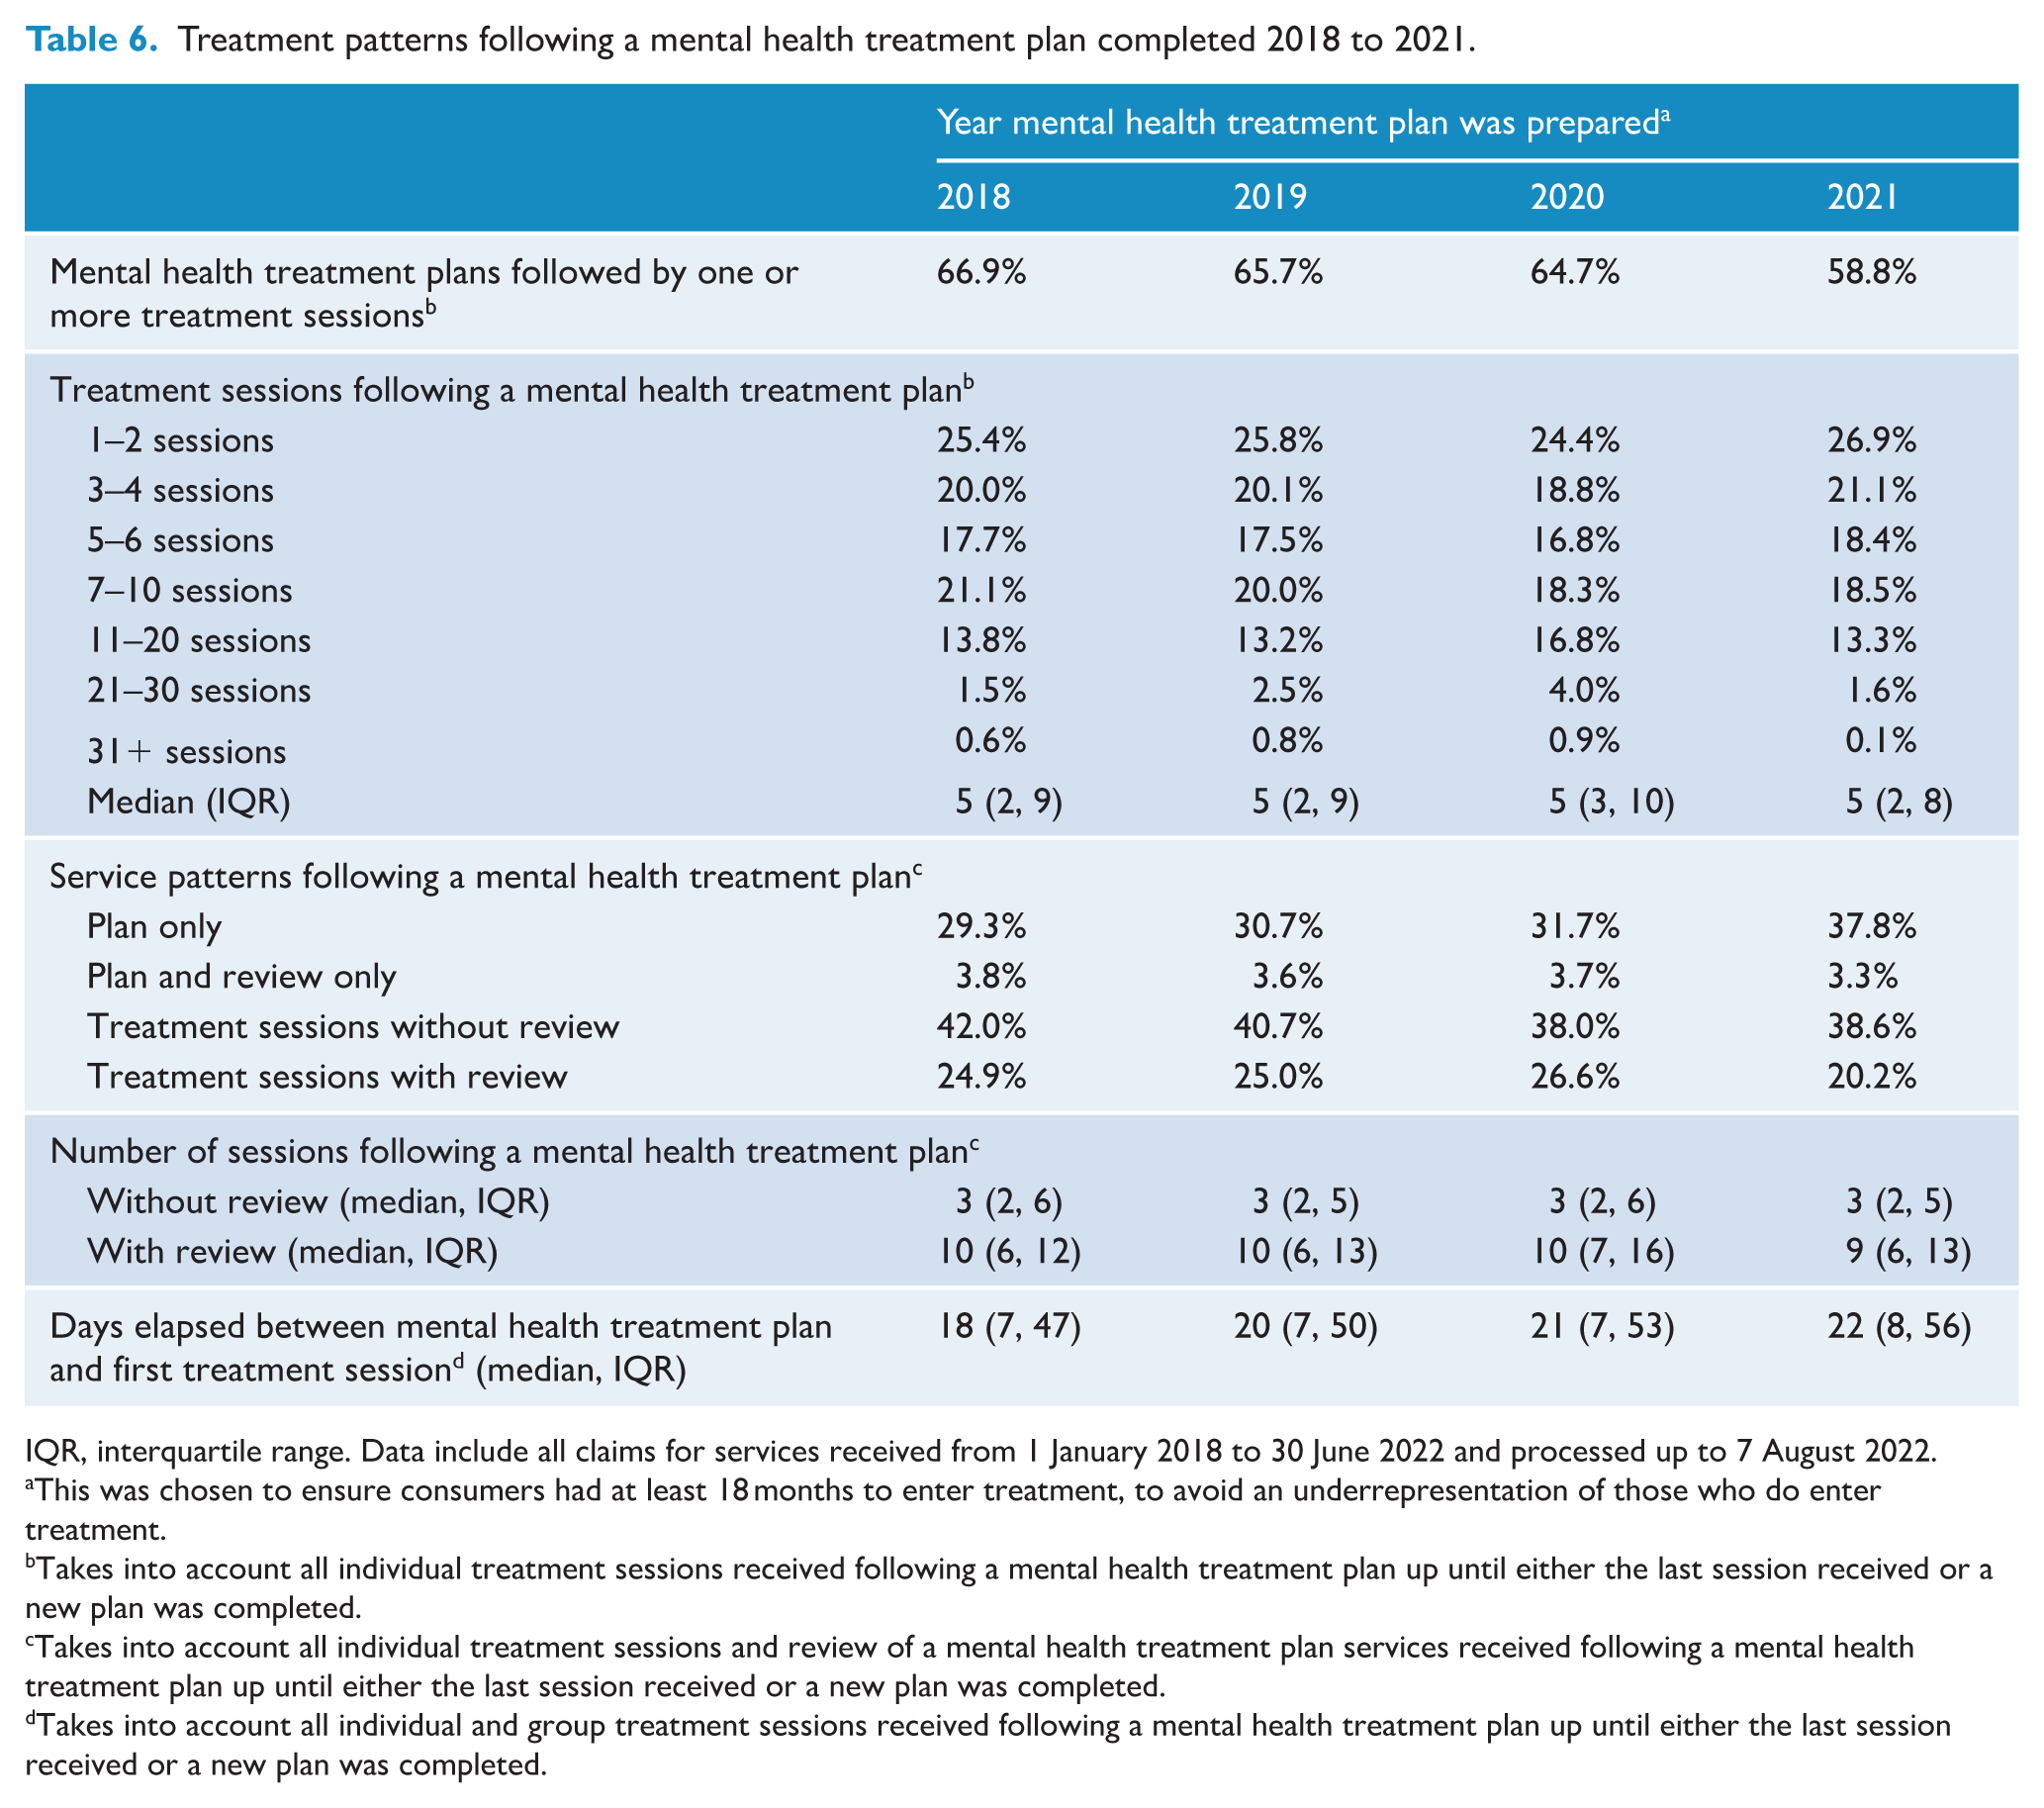
IQR, interquartile range. Data include all claims for services received from 1 January 2018 to 30 June 2022 and processed up to 7 August 2022.
This was chosen to ensure consumers had at least 18 months to enter treatment, to avoid an underrepresentation of those who do enter treatment.
Takes into account all individual treatment sessions received following a mental health treatment plan up until either the last session received or a new plan was completed.
Takes into account all individual treatment sessions and review of a mental health treatment plan services received following a mental health treatment plan up until either the last session received or a new plan was completed.
Takes into account all individual and group treatment sessions received following a mental health treatment plan up until either the last session received or a new plan was completed.
Figure 3 shows how co-payment patterns varied according to the number of individual Better Access treatment sessions received following a mental health treatment plan, for the first 20 sessions of treatment. These charts show that as the number of sessions received increased the likelihood of making a co-payment at any given session also increased [chart (a)], as did the likelihood of having made a co-payment for any previous session [chart (b)]. This was true in each year except 2022; in the absence of complete data for 2022, it is unclear whether this reflects a true change in the pattern or particular characteristics of consumers who require a higher number of sessions in a short time and/or the billing practices of their providers.
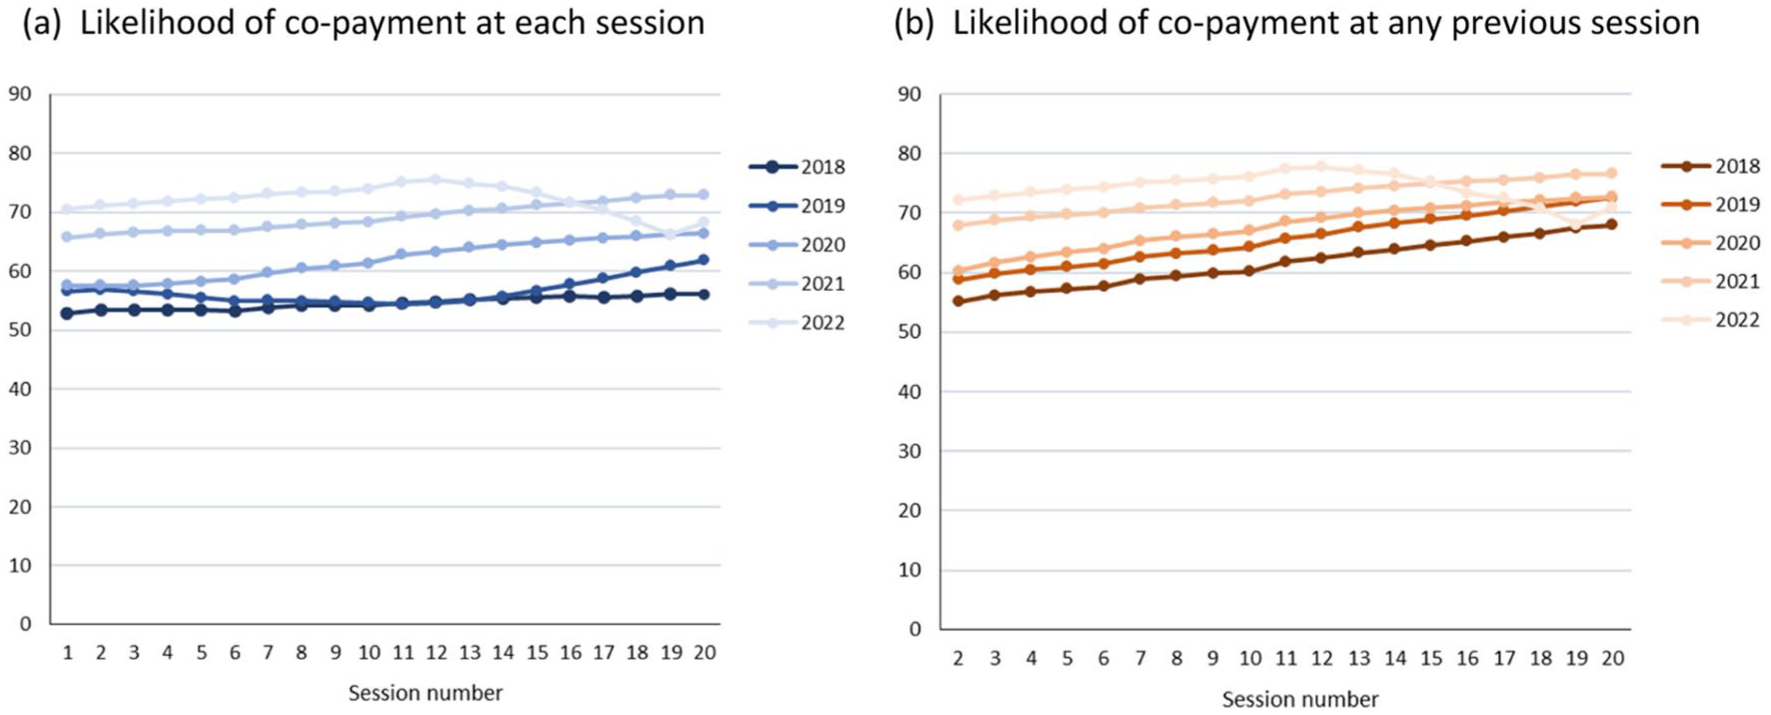
Co-payment patterns across Better Access treatment sessions following a mental health treatment plan, 2018 to 2022.
Discussion
Better Access continues to provide an important pathway to psychological care for many Australians. We found that, in 2021, one in every 20 Australians received psychological therapy funded through Better Access, nearly double the rate in 2009 (Harris et al., 2010). The number of treatment sessions delivered each year increased more than the number of people having new mental health treatment plans completed and the number of people receiving treatment. Together, these trends indicate that while the number of ‘new’ people entering Better Access increased modestly each year, those who accessed treatment received more sessions than in previous years.
We found that use of Better Access treatment in 2018–2021 varied across population groups. People living in less disadvantaged areas in major cities had the highest rates of uptake and utilisation. Recent reviews have highlighted the need for strategies to attract and retain providers to work outside of major cities and to mitigate costs for people in less affluent areas [e.g. by introducing bulk-billing incentives in some areas (DHAC, 2022)]. While uptake and utilisation remained lowest for people living in remote areas, there was a strong relative increase for this group between 2018 and 2021, possibly due to phone treatment options introduced in 2020 in response to COVID-19 and the removal (in late 2018) of a previous requirement that 3 of the 10 telehealth sessions for people in rural/remote areas be delivered face-to-face. We also found that use of Better Access treatment increased relatively more for females and people aged 15–24 years (vs males and people aged >24 years). This might, at least in part, reflect increases in the prevalence of high/very high psychological distress in young people, particularly young women, between 2017–2018 and 2022 (ABS, 2018c, 2022b).
We found that the costs of Better Access treatment have increased for consumers. More treatment sessions involved a co-payment in 2022 (69%) than in 2018 (53%). In addition, the median out-of-pocket payment per session increased sharply to $90 in 2022 [vs median $74 in 2018–2021 and an average of $62–$72 in 2009 (Harris et al., 2010)]. Consumer out-of-pocket payments made up a greater share of total treatment costs in 2022 (36%), compared to 2018 (25%) and 2009 (18%) (Harris et al., 2010). These patterns are of concern, as high treatment costs can result in consumers delaying or not using a service at all (Russell and Doggett, 2019). Providers report struggling to meet the costs of private practice – a result of the rising cost of living and the effects of a freeze on indexation of Medicare fees between 2013 and 2019 (Australian Medical Association, 2022; Duckett et al., 2022) – resulting in higher co-payment rates and higher fees which, in turn, increase the cost burden on the consumer (Tapp et al., 2026; Newton et al., 2026).
Adoption of the expanded telehealth/phone options was strong, accounting for more than one-third of Better Access treatment sessions delivered in 2021 and 2022. It remains to be seen whether demand continues to grow. The temporary additional 10 sessions were used by 15% of treatment users in 2021. Elsewhere in our evaluation, consumers and providers said they valued the additional sessions, particularly for people with complex needs (Tapp et al., 2026; Newton et al., 2026). However, other analyses suggested that additional sessions for existing consumers may have limited providers’ capacity to offer treatment to new consumers (Chilver et al., 2026). There are community concerns that the current maximum of 10 sessions is insufficient for people with more severe and complex problems (Chrysanthos, 2023; Orr, 2022).
Our study also explored patterns of Better Access treatment. We found that most mental health treatment plans were followed by treatment sessions; however, this proportion declined somewhat in 2021 (65–67% in 2018 to 59% in 2021). Chilver et al. (2026) found a similar decline in 2020–2021, indicating barriers to new consumers accessing treatment. Unfortunately, we do not know whether people without sessions following a plan received treatment funded in other ways (e.g. Primary Health Networks, public sector mental health services, entirely self-funded). The dedicated MBS items for review of a mental health treatment plan were used for fewer than 1-in-3 of all plans and for 1-in-2.5 plans that were followed by treatment sessions. Concerns that GPs/PMPs are not reviewing progress as intended (Rosenberg and Hickie, 2022) are difficult to judge from our data because GPs/PMPs could also undertake reviews using general attendance items. The retiring of dedicated review items will make reviews more challenging to track. The new requirements for plans, reviews and referrals to be linked to the consumer’s MyMedicare registered practice/usual practitioner are designed to improve continuity of care; this will need to be evaluated (Australian Government Department of Health, Disability and Ageing, 2025).
The median time elapsed between a mental health treatment plan and the first treatment session increased from 18 days for plans completed in 2018 to 21 days for plans completed in 2020. This is consistent with a survey of psychologists which found that since the start of the COVID-19 pandemic, 1-in-3 psychologists reported being unable to see new consumers (up from 1-in-5 in June 2021 and 1-in-100 pre-pandemic), and wait times for an initial treatment session are up to 3 months or longer (Australian Psychological Society, 2022). Our provider survey identified similar issues (Tapp et al., 2026). Capacity issues have been cited as the main reason for ceasing the additional 10 individual sessions (Minister for Health and Aged Care, 2022); it is as yet unclear whether wait times have declined as a result. The Australian Government has committed $91.3 million over 5 years to increase workforce capacity through additional postgraduate placements, internships and supervisor training sessions (Commonwealth of Australia, 2023).
Treatment patterns were not uniform across population groups. In the main, people living in more urban and affluent areas were more likely to access treatment following a mental health treatment plan, to wait a shorter time for their first session, to receive a greater quantum of treatment and to have their treatment reviewed using the dedicated review items. Our analyses of co-payment patterns for treatment sessions following a plan also suggested that people who can afford co-payments are more likely to receive more treatment.
Strengths and limitations
We drew on complete MBS data for the Better Access programme covering a 4.5-year period, from 1 January 2018 up to 30 June 2022, which allowed us to examine how the significant changes made to the programme rules during this period may have impacted on patterns of Better Access care. MBS data do not include information about the clinical characteristics (e.g. diagnosis, measures of severity and psychosocial function) or outcomes of consumers. Therefore, we were unable to draw conclusions about whether need and outcomes are associated with patterns of Better Access treatment. Our data set included services claimed by males and females. Recent Medicare system updates allow claimants to identify as non-binary, potentially enabling inclusion of this group in future analyses.
Conclusion
The Better Access programme has continued to grow. However, in 2021 (compared to 2018), proportionally fewer people accessed a first treatment session following referral and, of those that did, fewer received their first treatment session in a timely way. The costs of treatment sessions increased for consumers, with out-of-pocket payments contributing an increasingly greater share of the costs of these services. Better Access appears to be serving some groups better than others, such as people living in areas of medium/high socioeconomic status within major cities. Efforts are required to address persistent gaps in access to Better Access treatment as well as increased wait times and costs to consumers. Our study covered a period in which several changes (some temporary) were made to Better Access. Evaluation of the impact of subsequent programme changes is needed.
Footnotes
Acknowledgements
This study was funded by the Australian Government Department of Health, Disability and Ageing, as part of the broader evaluation of Better Access. We would like to thank the two groups that were constituted to advise on the evaluation, the Clinical Advisory Group and the Stakeholder Engagement Group. All data presented in this study were supplied by Services Australia.
Declaration of conflicting interests
The authors declared no potential conflicts of interest with respect to the research, authorship and/or publication of this article.
Funding
The authors disclosed receipt of the following financial support for the research, authorship and/or publication of this article: The Better Access Evaluation was funded by the Australian Government Department of Health, Disability and Ageing.
ORCID iDs
Data accessibility statement
Medicare Benefits Schedule data are available from Services Australia for approved projects. The specific analytic datasets derived for the current study are not available.