
Abstract
Objective:
Models of psychometric screening to identify individuals with neurodevelopmental disabilities (NDDs) have had limited success. In Aotearoa/New Zealand, routine developmental surveillance of preschool children is undertaken using the Before School Check (B4SC), which includes psychometric and physical health screening instruments. This study aimed to determine whether combining multiple screening measures could improve the prediction of NDDs.
Methods:
Linked administrative health data were used to identify NDDs, including attention deficit hyperactivity disorder, autism spectrum disorder and intellectual disability, within a multi-year national cohort of children who undertook the B4SC. Cox proportional hazards models, with different combinations of potential predictors, were used to predict onset of a NDD. Harrell’s c-statistic for composite models were compared with a model representing recommended cutoff psychometric scores for referral in New Zealand.
Results:
Data were examined for 287,754 children, and NDDs were identified in 10,953 (3.8%). The best-performing composite model combining the Strengths and Difficulties Questionnaire, the Parental Evaluation of Developmental Status, vision screening and biological sex had ‘excellent’ predictive power (C-statistic: 0.83) compared with existing referral pathways which had ‘poor’ predictive power (C-statistic: 0.68). In addition, the composite model was able to improve the sensitivity of NDD diagnosis detection by 13% without any reduction in specificity.
Conclusions:
Combination of B4SC screening measures using composite modelling could lead to significantly improved identification of preschool children with NDDs when compared with surveillance that rely on individual psychometric test results alone. This may optimise access to academic, personal and family support for children with NDDs.
Introduction
Data from several countries suggest prevalence of neurodevelopmental disabilities (NDDs) is rising and estimated to affect up to 17% of children (Arora et al., 2018; GBD 2017 Child and Adolescent Health Collaborators et al., 2019; Zablotsky et al., 2019). Improved public awareness, diagnostic practices, surveillance programmes and increasing survival rates from chronic illness are some possible reasons explaining this trend (Arora et al., 2018). NDDs are a group of often co-occurring conditions that include attention deficit hyperactivity disorder (ADHD), autism spectrum disorder (ASD), and intellectual disability (ID). Internationally, these are estimated to occur in children and young people at rates of 7.2%, 2.3%, and 1%, respectively (Maenner et al., 2021; Maulik et al., 2011; Thomas et al., 2015). Long-term health consequences of NDDs include deleterious effects on physical health (Aarons et al., 2008), academic achievement, personal economic outcomes, and social well-being (Capone Singleton, 2018; Duncan et al., 2007). It has been suggested that children with earlier identification of NDDs benefit from interventions during critical periods of their development (Bailey et al., 2001) and provide significant societal savings (Cidav et al., 2017). Therefore, to afford timely support for children with NDDs, several countries, including Aotearoa/New Zealand (NZ), have instituted standardised developmental screening as part of the entry to school (Committee on Children With Disabilities, 2001).
The Before School Check (B4SC) is a nationwide, government-sponsored preschool school health assessment offered to all NZ children, typically at 4 years of age (Ministry of Health, 2016). It is the last in a series of eight free health surveillance checks from birth and reaches over 90% of eligible individuals (Gibb et al., 2019). The B4SC covers child development, behaviour, hearing, vision, oral health, and growth (Statistics New Zealand, 2017b). Currently, children with NDDs may be identified during the B4SC via abnormal scores on either the Strengths and Difficulties Questionnaire (SDQ) or the Parental Evaluation of Developmental Status (PEDS) questionnaire (WHO, 2020; Wilson et al., 1968). Cut scores on individual scales are used to discern potentially indicative behaviour or development and prompt referral for further assessment and support (Radecki et al., 2011). Elevated SDQ scores are associated with poor neurodevelopment and increased risk of NDDs (Becker et al., 2015; Goodman et al., 2003; Nielsen et al., 2019), while total PEDS cutoff scores at the 16th percentile were predictive of developmental delays in children with less than 8 years of age (Brothers et al., 2008). In practice, cut score–dependent identification of individuals with NDDs using the SDQ and PEDS is challenged by non-linear patterns of early development, lack of cross-cultural validation (especially, in the case of NZ Māori and Pacific Island populations), and lack of consensus regarding grounds for onward referral (Mukherjee et al., 2014; Sand et al., 2005). Such issues have also previously been identified when using other developmental screening instruments (Marlow et al., 2019). Thus, there is no ‘gold standard’ screening instrument for NZ children with NDDs, and there are concerns about the under-identification of their prevalence (Kaufman, 2020).
A growing body of evidence shows associations between neurodevelopment and physical health, including biological sex (Martin and Hadwin, 2022), vision (Harris and Lord, 2016), hearing (Idstad et al., 2019), oral health (Yusuf et al., 2020) and weight (Wentz et al., 2017). Thus, we hypothesise that combining multiple mental health determinants into a single predictive model will more accurately identify children with NDDs when compared with existing referral guidelines involving cutoff scores. Examples of composite measures previously used to improve the validity or efficiency of case identification in a wide range of applications include identifying psychiatric disorders (Kessler et al., 1998; Liu et al., 2021), the onset of dementia (Borson et al., 2000), and identifying problematic drinking in students (Werner et al., 1994). In clinical research, motor, visual and language development measures have been previously combined to predict cognitive functioning (Shank, 2011).
In NZ, the Integrated Data Infrastructure (IDI), a large database containing anonymised microdata, including on the health of children, is available for research deemed to be for the public good. Although the definitions of ‘best practice’ in the use of such large administrative data are currently evolving (Grath-Lone et al., 2022; Harron et al., 2017), it nonetheless provides opportunities to explore health associations. In this study, we explore novel uses of IDI to improve prediction and referral pathways for children with NDDs. In the absence of any national registries for NDDs in NZ, previously established IDI-based methods will be used to identify cases of NDDs using a combination of diagnostic data and pharmaceutical dispensing (Bowden et al., 2020a, 2020b). These methods remain formally unvalidated; however, they have been applied in extant literature with demonstrated face validity (Bowden et al., 2020c, 2022; McLay et al., 2021, 2022). Physical and psychometric health surveillance measures contained in the B4SC data set, together with demographic attributes, will be combined with the aim to
Apply predictive models and ascertain whether it would be possible to increase the accuracy of the health assessment in identifying children with NDDs,
Identify the combination of predictors that optimise the performance of the model, and
Offer recommendations for improving B4SC-based identification of children with NDDs.
Methods
Study design
This was a retrospective, time-to-event analysis of a multi-year national cohort of NZ preschool children. The study has ethical approval under the minimal risk category by the University of Otago Human Research Ethics Committee (Approval: HD17/004).
Data source: the integrated data infrastructure
Data for the study were sourced from the Statistics NZ-curated Integrated Data Infrastructure (IDI), a national repository of administrative and survey data that includes B4SC screening data (Statistics New Zealand, 2017a). De-identified, probabilistically linked IDI data are available to trusted researchers operating within the Five Safes framework (Statistics New Zealand, 2017a). Access to IDI data was approved by Statistics NZ.
Participants
The cohort identified for this study included NZ preschool (4–5 years old) children who had available B4SC data within the IDI, between 1 January 2011 and 30 June 2016 (Gibb et al., 2016; Zhao et al., 2018). Age was determined at the time of B4SC completion. Individuals were excluded from the analysis if their age was beyond the B4SC age bracket (<4 or >5 years), where their B4SC was incomplete, or if consent was not provided.
Primary outcomes: neurodevelopmental disorders
The NDDs of interest, ADHD, ASD, ID, and a combined category termed ‘any NDD’ were identified using established case identification methods for IDI-based data (Bowden et al., 2020a, 2020b). These methods utilise diagnostic codes and pharmaceutical dispensing information obtained from four health data sets: The Programme for the Integration of Mental Health Data (PRIMHD), a national collection of publicly funded specialist mental health service use data; the National Minimum Dataset (NMDS), a national collection of publicly funded hospital admissions; Socrates, a national database of the Ministry of Health’s Disability Support Services clients; and the Pharmaceutical Collection (PHARMS), a national claims and payment information data set from pharmacists for government-subsidised medication dispensing. Each NDD was identified using up to 9 years of data from 1 July 2010 until 30 June 2019 via the presence of one or more diagnostic codes across any of the four data sets (see Table 1 for details). Dichotomous indicators (yes/no) were constructed for each specific NDD and for a composite indicator termed ‘any NDD’.
IDI codes used to identify NDDs.
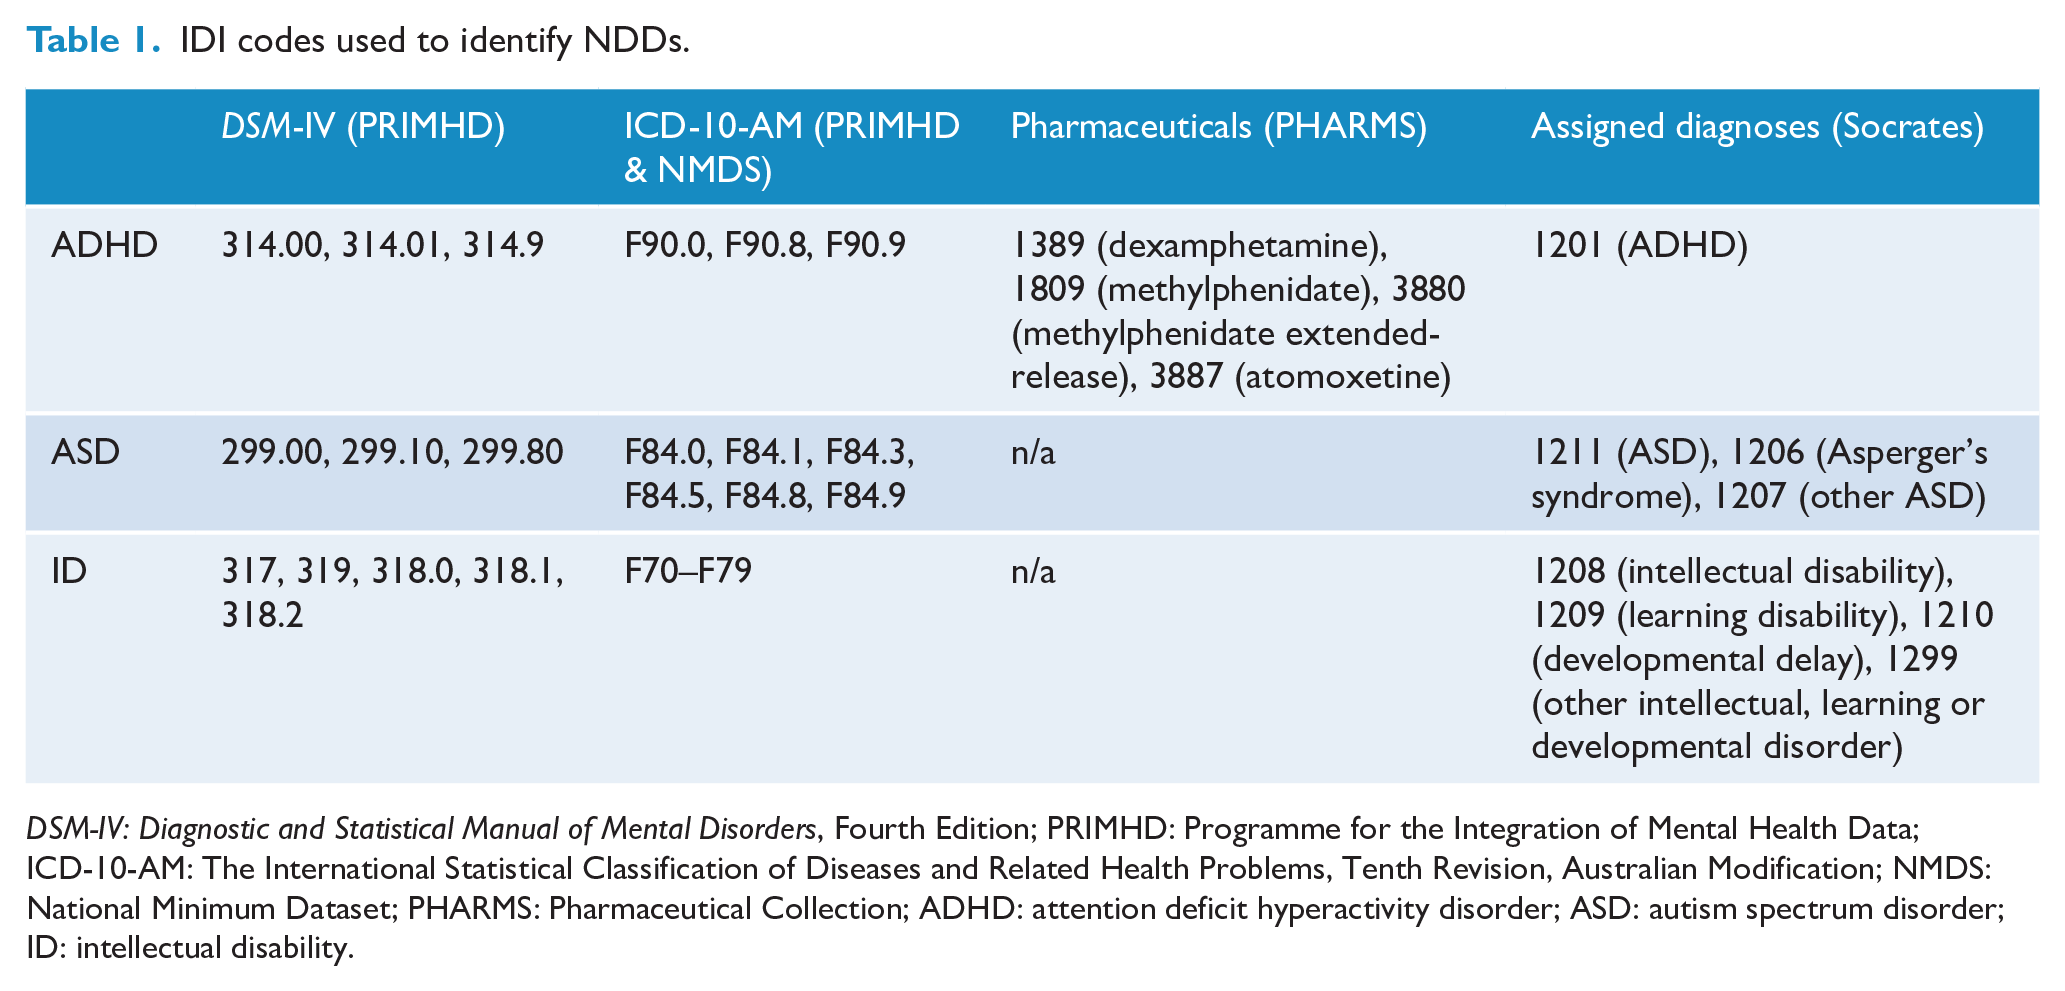
DSM-IV: Diagnostic and Statistical Manual of Mental Disorders, Fourth Edition; PRIMHD: Programme for the Integration of Mental Health Data; ICD-10-AM: The International Statistical Classification of Diseases and Related Health Problems, Tenth Revision, Australian Modification; NMDS: National Minimum Dataset; PHARMS: Pharmaceutical Collection; ADHD: attention deficit hyperactivity disorder; ASD: autism spectrum disorder; ID: intellectual disability.
Covariates
Predictors of NDDs included developmental, behavioural, and physical health measures from the B4SC between 1 January 2010 (the point at which the B4SC is considered universal (Gibb et al., 2019) until 30 June 2016 (to enable at least 3 years of follow-up for each child in the cohort). Detailed methods for capturing these measures can be found in The B4 School Check Handbook (Ministry of Health, 2008). Biological sex was also included in the models.
Strengths and Difficulty Questionnaire (SDQ)
The SDQ encompasses 25 questions, reported by parents and teachers, which identify five psychosocial attributes, namely conduct, emotional, hyperactivity, peer problems, and pro-social behaviour (Goodman, 1997; Goodman et al., 2000). In the present study, scores of individual subscale measures and a summary score representing overall difficulty (SDQ Total) were calculated from the first four sub-scales. Per the literature, SDQ scores were excluded where all five subscales registered as zero (Kersten et al., 2018; Ministry of Health, 2015; Silva et al., 2015).
Approximately half of the cohort did not receive an SDQ assessment from their teachers. To make the best use of available teacher-assessed SDQ scores, parent and teacher scores were normalised and missing teacher scores were imputed with normalised parent scores where available.
Two additional binary indicators were created for subsequent referral based on recommended governmental guidelines, SDQ Total scores: ⩾ 17 from a parent-completed questionnaire; and ⩾ 16 from an imputed teacher-completed questionnaire.
Parents’ Evaluation of Developmental Status (PEDS)
PEDS examines parental concerns regarding development (cognition, communication and motor skills) in children up to 8 years of age (Glascoe, 2003; The Royal Children’s Hospital Melbourne, 2108). PEDS includes 10 questions about behaviour; development; speech and language; and fine or gross motor skills. Two continuous scores were generated from PEDS responses and used in the present study: (1) PEDS with significant concerns (PEDS-sig), which captures established predictors of developmental delay; and (2) PEDS other concerns (PEDS-ns), while not considered established predictors of developmental delay may still highlight issues that require ongoing monitoring. An additional PEDS measure, PEDS-sig referral was constructed to represent governmental guidelines for a referral if two or more significant concerns are reported.
Hearing, vision, and oral test
Hearing, vision, and oral test results were captured by specialist services during B4SC screening. Each measure used in this study was converted into a dichotomous variable, with ‘1’ indicating a pass of the respective check and ‘0’ indicating referral to an appropriate service when concerns were raised. The auditory assessment included sweep audiometry with follow-up tympanometry test if audiometry were equivocal or abnormal. Vision was assessed using Snellen charts. Oral health screening involved the ‘Lift the Lip’ check to identify dental decay (Arrow et al., 2013).
Height and Weight measurements
As per guidelines, anthropometric measurements were conducted using calibrated instruments (Ministry of Health, 2008). Height (±0.1 cm) was measured using a portable stadiometer (Leicester Height Measure or SECA 214) and weight (±0.1 kg) was measured using a floor scale (SECA 862, SECA 770, Tanita WB 100 S MA or Tanita HD-351). The WHO Anthro Macro (version 3.2.2) was used to obtain sex-specific body mass index (BMI)-for-age Z-scores (WHO Anthro Department of Nutrition, 2019). A three-level categorical variable, BMI, was used to indicate children within a healthy BMI range of plus or minus one standard deviation (SD) of the WHO mean for children at 4 years of age, those one SD below the mean considered underweight, and one SD above the mean considered overweight (de Onis et al., 2019).
Biological sex
Information on the biological sex of participants was sourced from the personal details table in the IDI and categorised as either female or male.
Procedure
Data were accessed from the June 2020 refresh of the IDI and extracted using SAS version 7.1 (SAS Institute Inc, 2014). The resulting data were analysed using StataMP version 15 (StataCorp, 2017). Following Statistics NZ confidentiality requirements, all counts were randomly rounded to base 3 and suppressed if less than six to minimise any risk of individual identification (Statistics New Zealand, 2019). Confidentialised results were approved for final release by Statistics NZ.
Statistical analysis
Observed rates of NDDs (any NDD, ASD, ADHD, and ID) were presented overall and stratified by sex. Unadjusted hazard ratios (HRs) and associated 95% confidence intervals (CIs) for each predictor measure on NDD status were generated from Cox proportional hazards regression models (StataCorp, 2019). Onset for the Cox models of NDD was registered as the earliest time to (1) first NDD diagnosis, (2) death, or (3) a period of overseas travel greater than 3 months. Otherwise, times were censored for individuals that survived to the end of the study period (30 June 2019). The proportional hazards assumption was checked for all predictors using Schoenfeld residual plots (Schoenfeld, 1980).
For each NDD classification, baseline models (one) were constructed utilising current referral pathway information from SDQ and PEDS scores at recommended thresholds for a referral (Ministry of Health, 2008). Baseline models were compared with a sequence of Cox models which incrementally combined predictor variables: M1 (SDQ subscales as continuous variables), M2 (PEDS scores), M3 (M1 + M2), M4 (M3 + Hearing), M5 (M3 + Vision), M6 (M3 + Oral), M7 (M3 + BMI) and M8 (M5 + Sex).
The predictive ability of each model was assessed using Harrel’s c-statistic, a performance measure that assesses models of dichotomous outcomes (Pencina et al., 2008). Using the c-statistic, the discriminatory power of models is categorised as ‘poor’ (⩽ 0.7), ‘acceptable’ (0.7–0.79), ‘excellent’ (0.80–0.89), or ‘outstanding’ (⩾ 0.9) (Hosmer and Lemeshow, 2000). Models were assessed further using positive predictive value (PPV), negative predictive value (NPV), sensitivity, and specificity. For the baseline model, actual referrals were compared with observed NDD diagnoses. For each subsequent model, predicted probabilities for NDDs were calculated and compared with actual observed NDDs. The threshold value for predicted probabilities was set to constrain the percentage of the referred population to that of the baseline model (9.3%). Thresholds were adjusted to halve (4.7%) and double referrals (18.6%) to reflect differing capacities of public health funding.
Results
Participant population
Over the study period, a total of 309,231 children were administered a B4SC, of which 287,754 children were aged between 4 to 5 years and had complete B4SC information and consent, which were therefore eligible for inclusion in our analysis (see Figure 1).
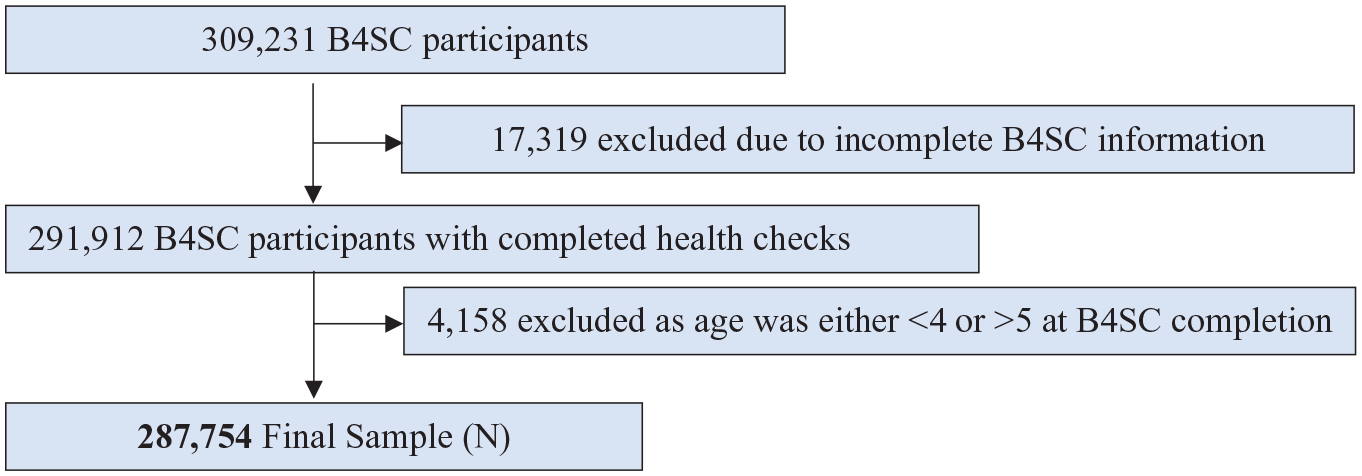
Participant flow chart.
Participants with identifiable NDDs
NDDs were identified in 10,953 children (3.8% of the participant population) (Table 2). ADHD was the most common (2.5%), followed by ASD (1.3%) and ID (1.0%). Overall, boys with NDDs outnumbered girls by over three to one. This sex difference was particularly high for ADHD and ASD at approximately four to one.
NDDs (ADHD, ASD, ID) identified and population rates among the eligible sample of 287,754 children.
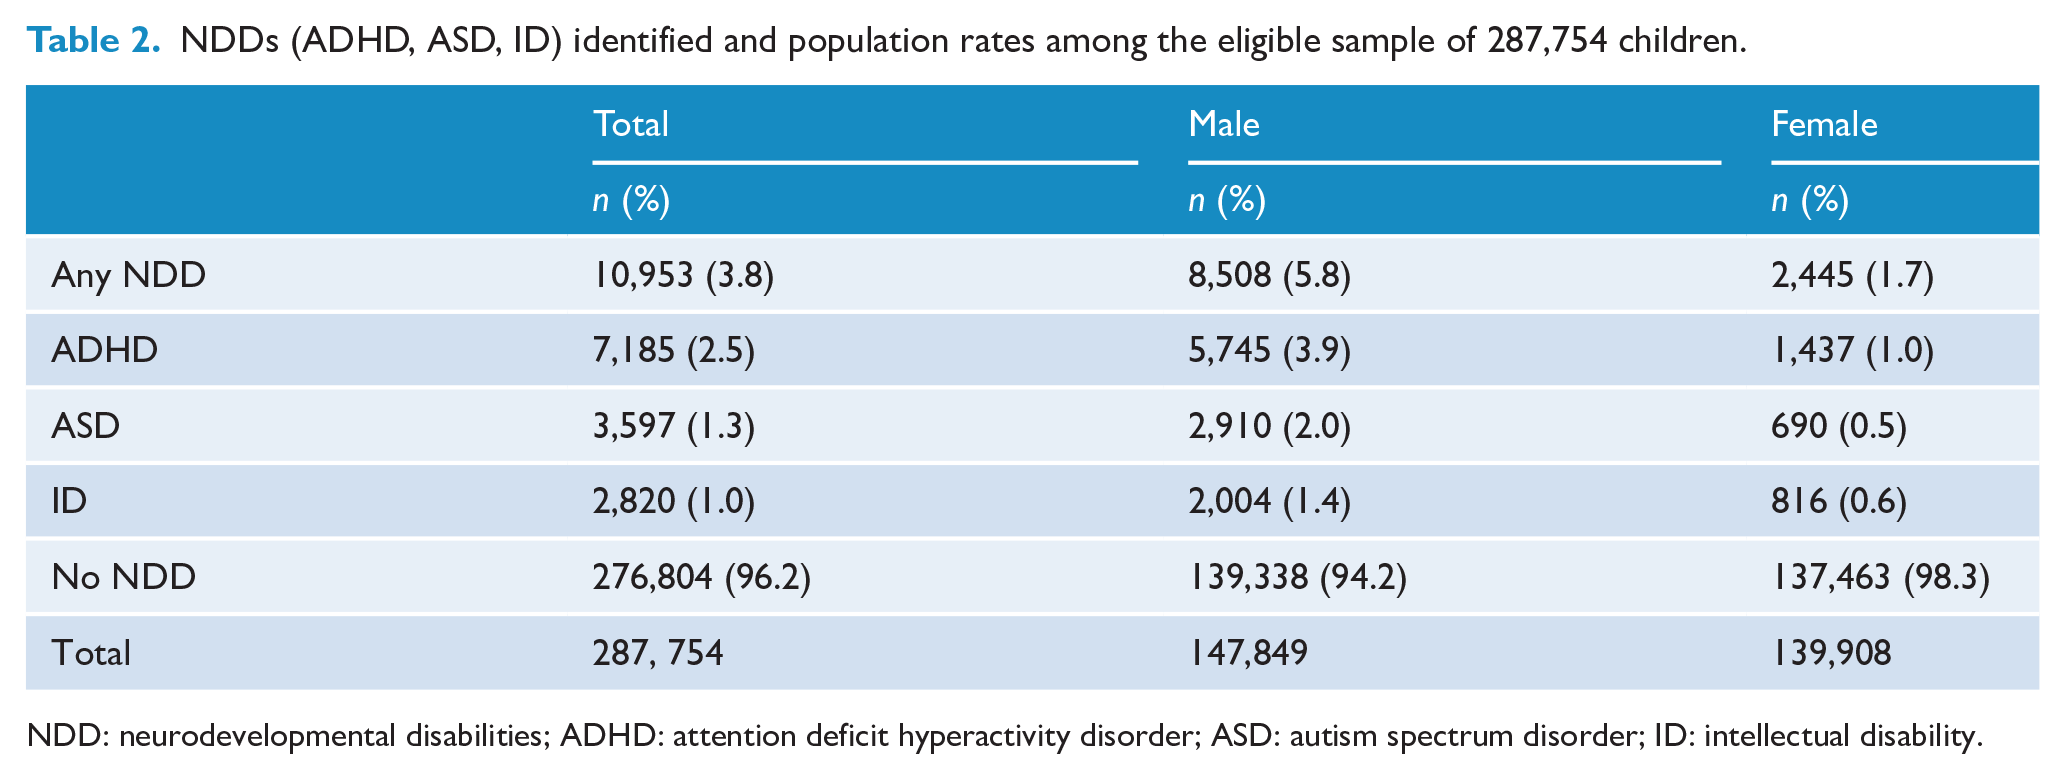
NDD: neurodevelopmental disabilities; ADHD: attention deficit hyperactivity disorder; ASD: autism spectrum disorder; ID: intellectual disability.
Prediction of NDDs by B4SC components
Among the analytical sample, completion rates for each B4SC component were typically high, including SDQ parent (98.5%), PEDS (99.1%), vision (100.0%), hearing (92.3), oral (99.1%), and height and weight (99.1%). The SDQ teacher was administered at a far lower rate (51.4%). For any of the NDDs investigated, unadjusted HRs for SDQ and PEDS referral thresholds were significantly greater than one, indicating a higher risk of any NDD against those who did not meet the referral threshold in each score (Table 3). Likewise, HRs for all continuous SDQ scores (except SDQ Pro-social), both PEDS scores, high BMI, and male sex were associated with significantly higher risk of any NDD. In contrast, both SDQ Pro-social scores, a pass on vision testing, hearing testing, and normal oral health were associated with significantly lower risk of any NDD. Having a low BMI (one SD below the mean) had no association with any NDD (p value = 0.58). Similar patterns were replicated within each individual NDD diagnoses. The only exception was children with a BMI one SD below the mean, who were at no more risk of individual NDDs than children with normal BMI, except in the case for ID which was associated with increased risk.
Unadjusted hazard ratios (HRs) and associated 95% CIs for B4SC measures and sex on NDDs.
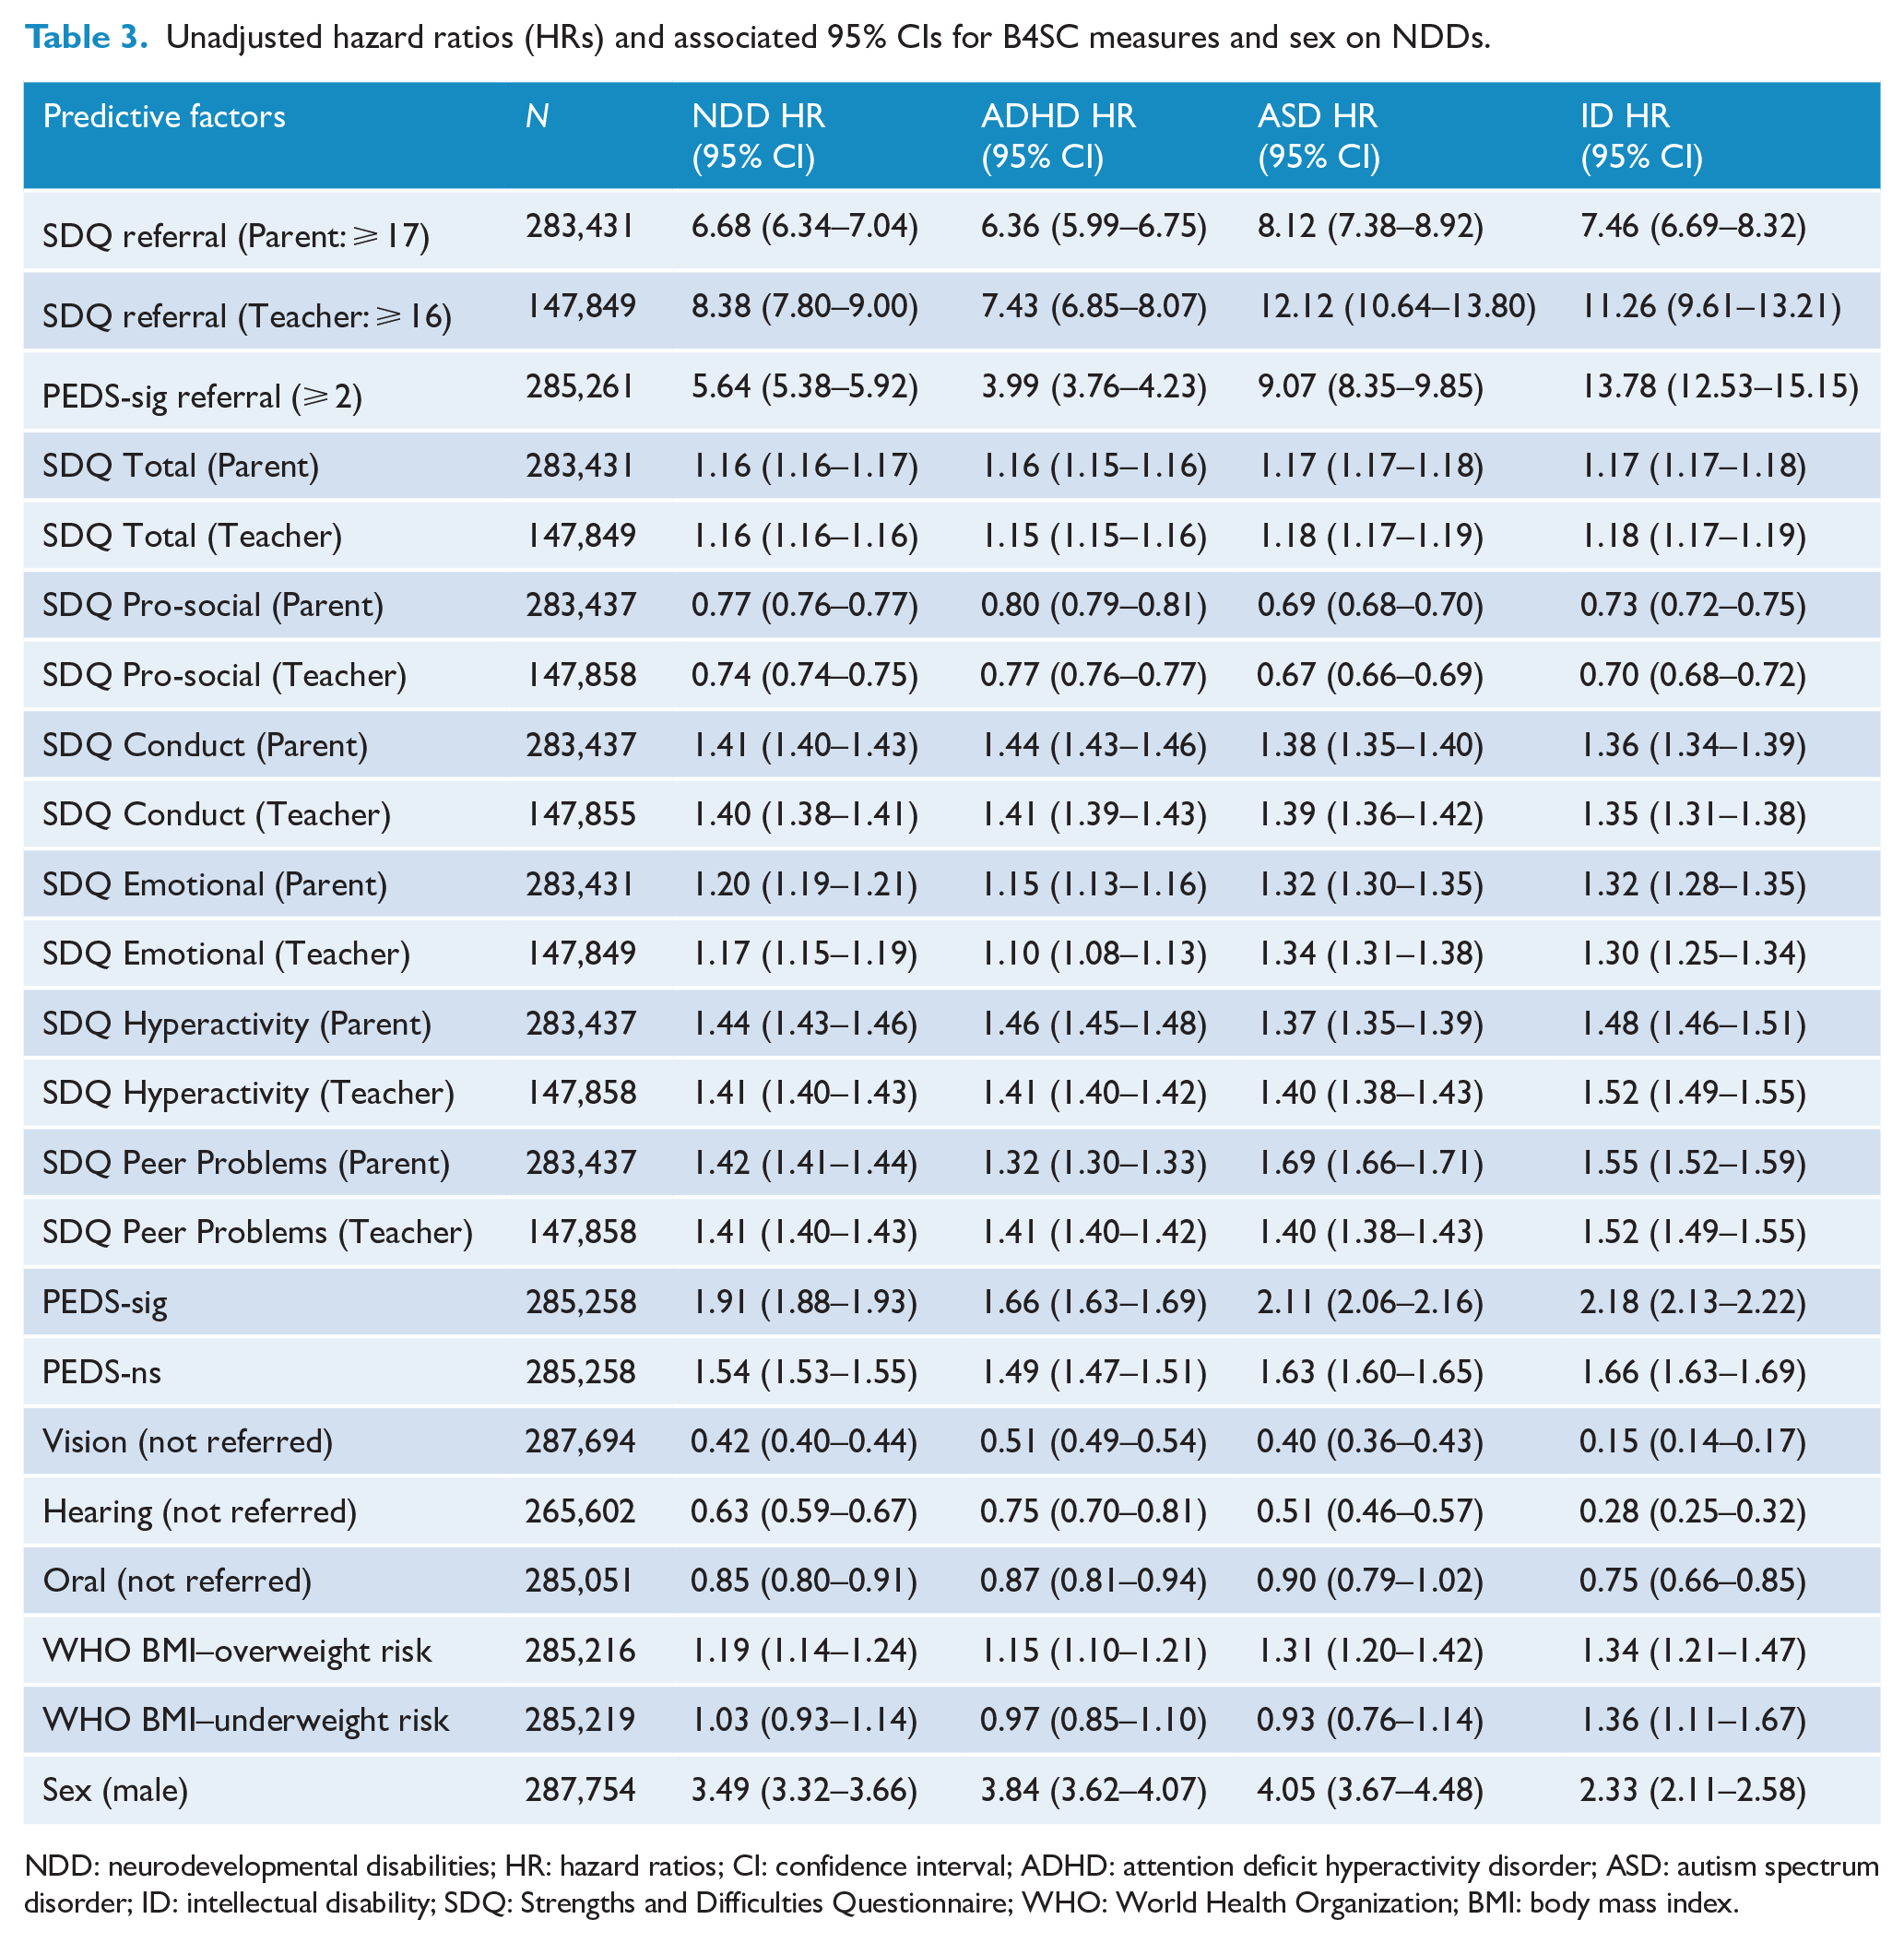
NDD: neurodevelopmental disabilities; HR: hazard ratios; CI: confidence interval; ADHD: attention deficit hyperactivity disorder; ASD: autism spectrum disorder; ID: intellectual disability; SDQ: Strengths and Difficulties Questionnaire; WHO: World Health Organization; BMI: body mass index.
Comparing the predictive performance of models
Baseline models had ‘poor’ discriminatory power for any NDD (c-statistic = 0.68) and ADHD (0.66) but had ‘acceptable’ power for ASD (0.72) and ID (0.78). In contrast, the composite models consistently outperformed the Baseline models (see supplementary material for complete regression results).
Combining all five SDQ sub-sales and the PED scores into a predictive model yielded higher c-statistics (M3) when compared with baseline models or individually modelled measures (M1, M2), thus indicating improved predictive power (Table 4). The c-statistic further improved across all NDD classifications with the addition of ocular health (M5) and biological sex (M8), but not auditory health (M4), oral health (M6), or BMI (M7). Ultimately, model M8 outperformed other models with ‘excellent’ discriminatory power for any NDD (0.83), ADHD (0.83), ASD (0.86), and ‘outstanding’ for ID (0.90).
Predictive assessment (C-stats a ) of regression models.
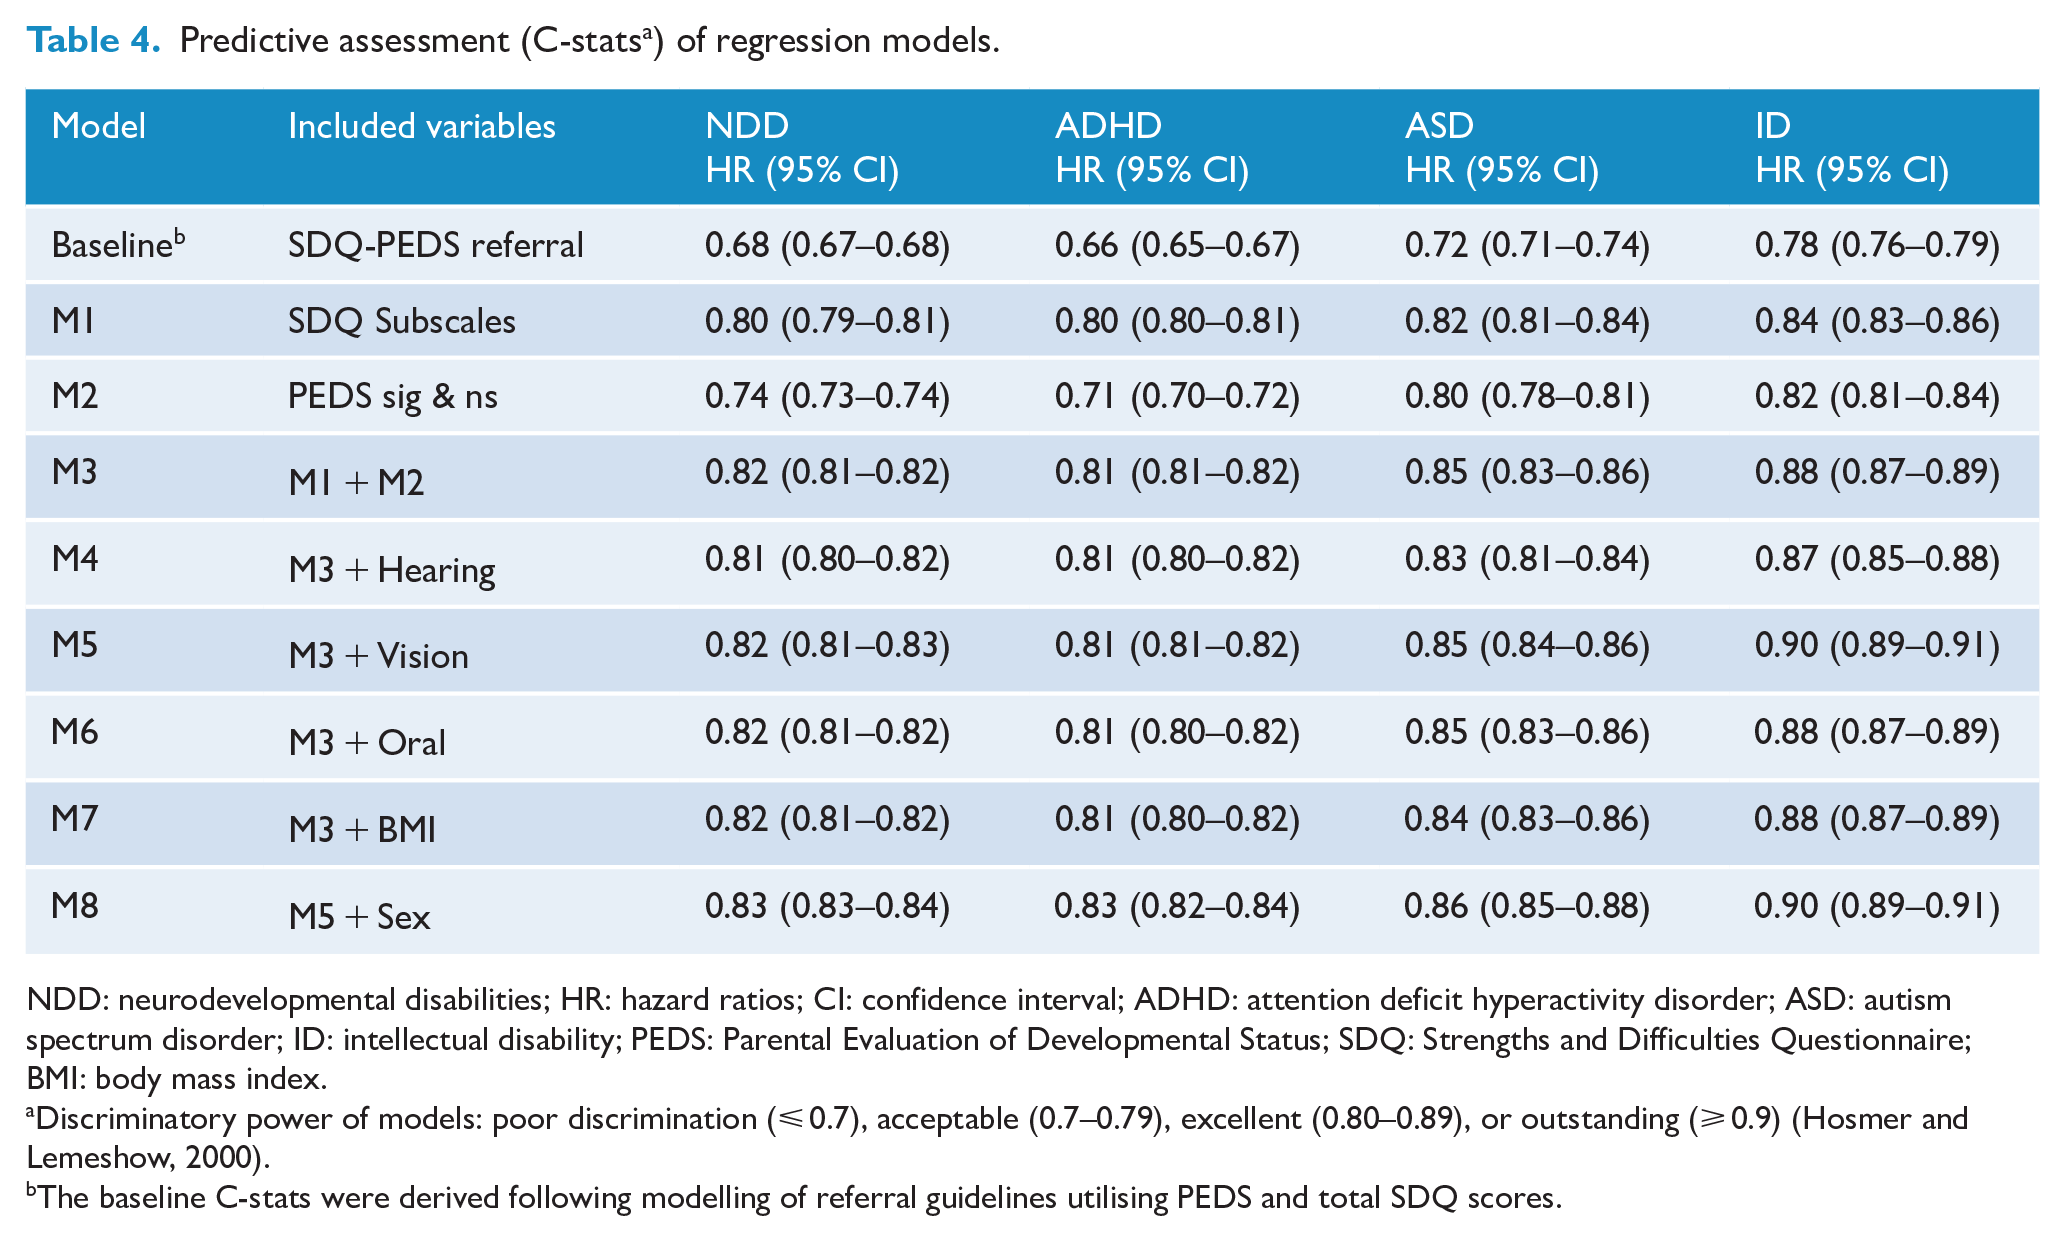
NDD: neurodevelopmental disabilities; HR: hazard ratios; CI: confidence interval; ADHD: attention deficit hyperactivity disorder; ASD: autism spectrum disorder; ID: intellectual disability; PEDS: Parental Evaluation of Developmental Status; SDQ: Strengths and Difficulties Questionnaire; BMI: body mass index.
Discriminatory power of models: poor discrimination (⩽ 0.7), acceptable (0.7–0.79), excellent (0.80–0.89), or outstanding (⩾ 0.9) (Hosmer and Lemeshow, 2000).
The baseline C-stats were derived following modelling of referral guidelines utilising PEDS and total SDQ scores.
These results were further confirmed by comparing the PPV, NPV, sensitivity, and specificity values of the baseline and M8 the best-performing composite model (Table 5). The composite models performed better than or equal to the baseline for all metrics for all NDD classifications. For any NDD, sensitivity improved by 13% (46% vs 52%). Improvement in sensitivity was highest for ADHD (38% vs 50%). These gains in sensitivity were observed without loss of specificity. For individual NDDs, doubling the referral rate improved sensitivity from baseline but specificity declined. In contrast, specificity improved by halving referrals at the expense of sensitivity. Those effects were also reflected with varying magnitude in NPV and PPV.
Comparisons of PPV, NPV, sensitivity and specificity between baseline and prediction model.
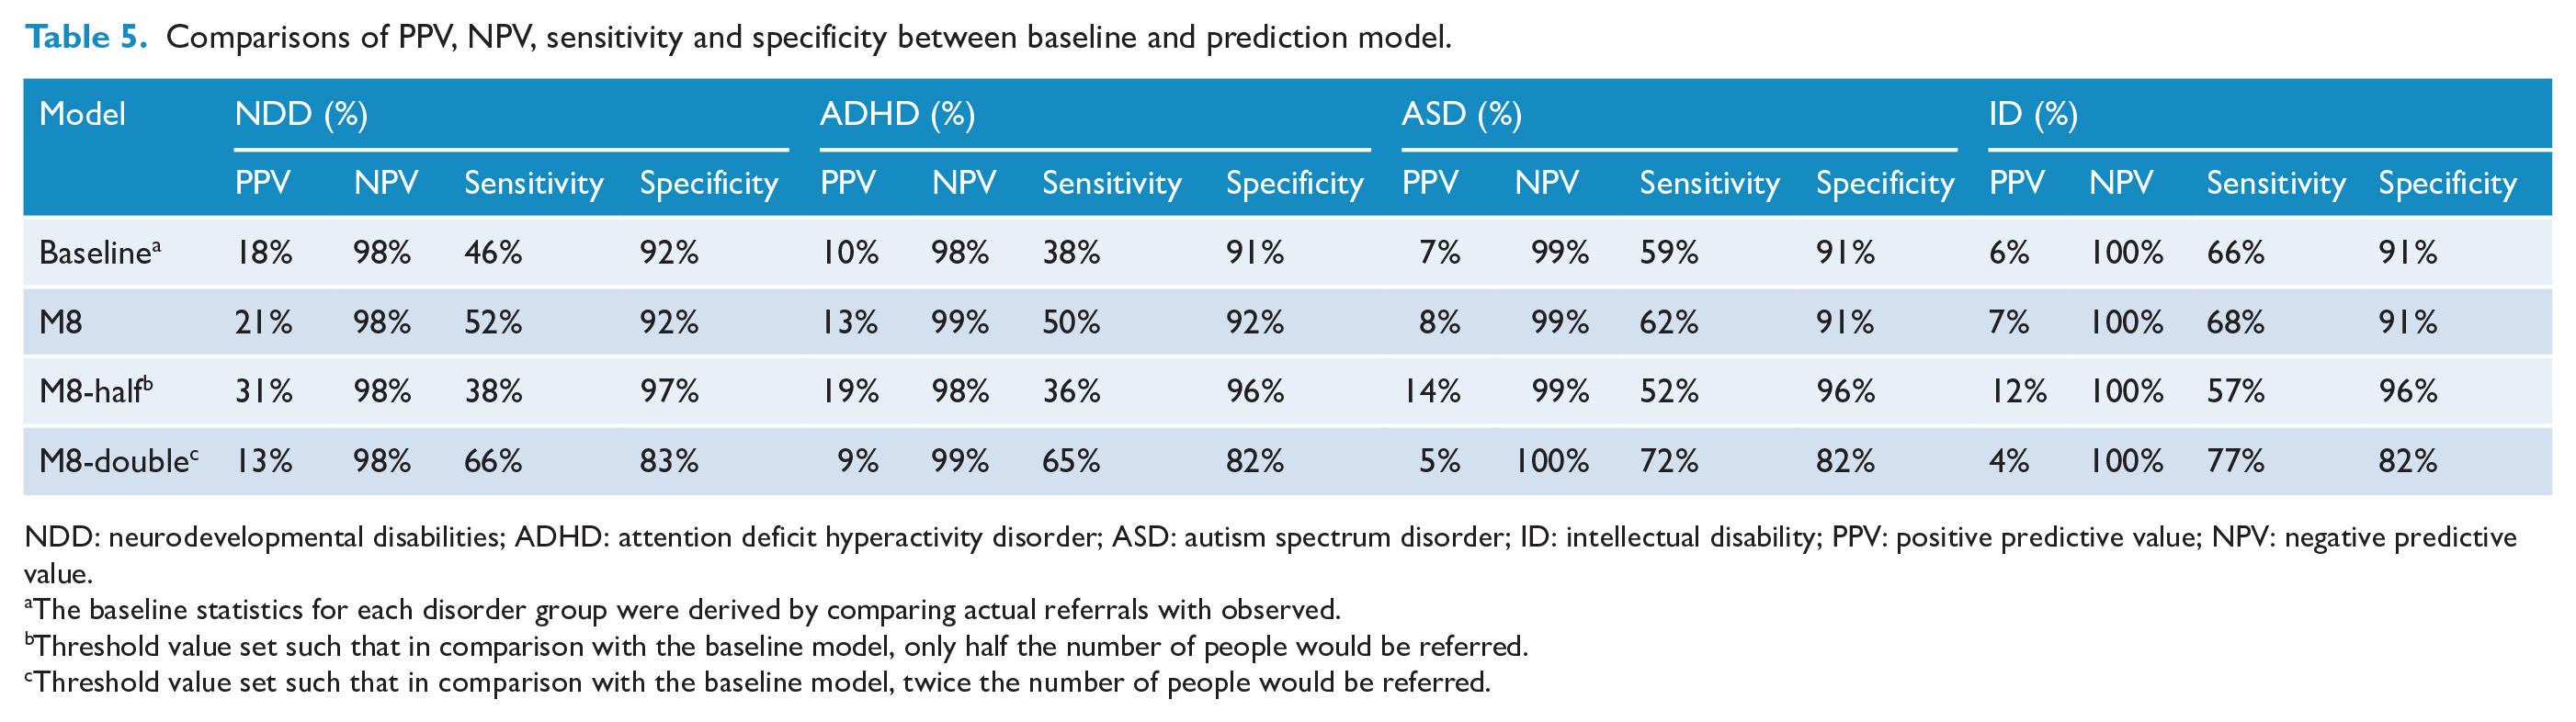
NDD: neurodevelopmental disabilities; ADHD: attention deficit hyperactivity disorder; ASD: autism spectrum disorder; ID: intellectual disability; PPV: positive predictive value; NPV: negative predictive value.
The baseline statistics for each disorder group were derived by comparing actual referrals with observed.
Threshold value set such that in comparison with the baseline model, only half the number of people would be referred.
Threshold value set such that in comparison with the baseline model, twice the number of people would be referred.
Discussion
Key findings
In this national retrospective cohort study, we sought to combine psychometric and physical health screening measures into a novel composite predictive model to improve the identification of NDDs. Composite modelling was found to improve the identification of preschool children with NDDs compared with existing referral pathways. The optimal composite model, including indicators of SDQ scales, PEDS, vision, and biological sex, had excellent discriminatory power (C-statistic 0.83) (Hosmer and Lemeshow, 2000). It outperformed all other models including the current use of cutoff scores from individual psychometric questionnaires. Using this model, the sensitivity of NDD detection was improved by 13% without loss of specificity.
Factors that may limit further clinical support following B4SC assessment include barriers to accessing local resources; some children are already known to child health and development providers; and lack of parental resources to engage with further assessment (Richards et al., 2019). Improving the sensitivity of NZ’s current system of health checks could have a role in addressing some of these issues as the higher sensitivity will improve the cost-efficiency of the whole system. Given that the B4SC is broadly accepted in NZ (Williams, 2013), it would be advantageous to retain current screening tools such as the SDQ and PEDS while improving their effectiveness by employing prediction models that combine health screening measures. Such models should be further validated among specific communities with different levels of need.
Strengths and limitations
Strengths of this study include using a large, national data set and well-established statistical modelling techniques. The approach is novel concerning the application to NDDs. However, the findings must be viewed considering several limitations. First, cases of NDDs are established using unvalidated methods that likely undercount true NDD prevalence, and the extent of false positives remains unknown (Bowden et al., 2020a, 2020b). Second, in practice, the process of referral often involves communication between professionals, which is not available in the IDI and consequently not captured in the baseline model. Third, B4SC administrative data were not originally intended for health analysis and therefore has issues surrounding the reliability of individual B4SC measures (Schluter et al., 2018). Finally, our approach of combining teacher and parent SDQ measures to account for the low rate of teacher administered SDQs completed is imperfect, particularly given parent and teacher SDQ scores do not correlate well (Kersten et al., 2018). Future work should look to explore alternative imputation methods, and ways to improve SDQ teacher completion rates such as protected teacher time or alternative incentives.
Ethical issues associated with the use of IDI data for research include risks of marginalisation, mislabelling, and exacerbation of the apparent boundaries between health and ill health. For a more detailed discussion, see Bowden et al. (2019). Use of IDI data may be disadvantageous for ethnic groups that receive poorly equitable services, such as Māori and Pasifika (Wikaire et al., 2016; Williams et al., 2018). In particular, B4SC participation has been found to be lower for Māori, Pasifika, and those living in socioeconomically deprived areas (Gibb et al., 2019).
Future directions
Further research is needed to explore the psychometric properties of the composite screening model (M8) with children of different ethnicities, especially Māori and Pasifika. Further addition of predictors (e.g. known co-occurring conditions) could improve the effectiveness of the composite model. Finally, a trial of the composite screening model with a clinical sample would validate its impact on onward referral in the real world.
Conclusion
Our composite prediction models demonstrated better discrimination for NDDs (ADHD, ASD, and ID) than the current screening guidelines. Thus, we propose that by routinely combining measures of SDQ, PEDS, visual health, and biological sex, earlier detection of children with NDDs and subsequently better support will be possible.
Supplemental Material
sj-docx-1-anp-10.1177_00048674231151606 – Supplemental material for Identifying neurodevelopmental disabilities from nationalised preschool health check
Supplemental material, sj-docx-1-anp-10.1177_00048674231151606 for Identifying neurodevelopmental disabilities from nationalised preschool health check by Himang Mujoo, Nicholas Bowden, Hiran Thabrew, Jesse Kokaua, Richard Audas and Barry Taylor in Australian & New Zealand Journal of Psychiatry
Footnotes
Declaration of Conflicting Interests
The author(s) declared no potential conflicts of interest with respect to the research, authorship, and/or publication of this article.
Funding
The author(s) disclosed receipt of the following financial support for the research, authorship, and/or publication of this article: This research was part of A Better Start National Science Challenge, funded by the New Zealand Ministry of Business, Innovation and Employment (MBIE) grants UOAX1511 and UOAX1901. The authors would like to further acknowledge Dean’s Medical Student Research Scholarship. The funder/sponsor did not participate in the work.
Disclaimer
Supplemental material
Supplemental material for this article is available online.
References
Supplementary Material
Please find the following supplemental material available below.
For Open Access articles published under a Creative Commons License, all supplemental material carries the same license as the article it is associated with.
For non-Open Access articles published, all supplemental material carries a non-exclusive license, and permission requests for re-use of supplemental material or any part of supplemental material shall be sent directly to the copyright owner as specified in the copyright notice associated with the article.