
Abstract
Objective:
Amyloid-beta often co-exists in dementia with Lewy bodies, but its clinical relevance in dementia with Lewy bodies remains unclear. This study aimed to investigate the clinical and imaging correlates of amyloid-beta deposition in dementia with Lewy bodies, particularly its relationship with cortical thickness in Alzheimer’s disease–prone regions and hippocampal volume.
Methods:
Twenty-four participants with probable dementia with Lewy bodies underwent high-resolution magnetic resonance imaging and amyloid-beta positron emission tomography imaging using the radiotracer 18F-NAV4694. Amyloid-beta deposition was quantified and reported using the Centiloid method.
Results:
Amyloid-beta positivity, defined as Centiloid > 50, was present in 45.8% of dementia with Lewy bodies participants. There were no statistically significant differences in clinical characteristics between Aβ+ and Aβ− dementia with Lewy bodies. Compared with the Aβ− group, Aβ+ dementia with Lewy bodies exhibited greater global cortical thinning as well as in the Alzheimer’s disease–prone region of interest, adjusted for age, sex and years of education. A mean cortical thickness of 5.12 mm across a combined meta-region of interest has a sensitivity of 88.9% and specificity of 90.0% in discriminating Aβ+ from Aβ− dementia with Lewy bodies. Hippocampal volume was not different between groups.
Conclusion:
Early structural changes in cortical thickness, but not hippocampal volume, were observed in dementia with Lewy bodies with significant amyloid-beta burden. This may represent an early Alzheimer’s disease–related neurodegenerative process.
Introduction
Dementia with Lewy bodies (DLB) is the second most common neurodegenerative dementia in older adults, after Alzheimer’s disease (AD) (Jellinger and Attems, 2015). Pathologically, DLB is characterised by accumulation of the synaptic protein alpha-synuclein in the brain, but a significant proportion of people with DLB also harbour co-morbid AD pathology (amyloid-beta [Aβ] plaques and neurofibrillary tangles [NFTs] of hyperphosphorylated tau) (Jellinger and Attems, 2015). The development of positron emission tomography (PET) imaging using radioligands, such as Pittsburgh compound B (11C-PiB), has enabled accurate in vivo detection of fibrillar amyloid in neuritic plaques and contributed to better understanding of the significance of Aβ deposition during life in people with dementia (Petrou et al., 2015).
Systematic reviews have consistently reported that more than half of the people with DLB are ‘Aβ-positive’ on PET imaging, with the prevalence increasing with age (Donaghy et al., 2015; Ossenkoppele et al., 2015; Petrou et al., 2015). When present in DLB, the regional pattern of Aβ deposition was also similar to that seen in AD (Donaghy et al., 2015). Studies have reported mixed findings when examining the associations between Aβ pathology and clinical characteristics in people with DLB. A previous cerebrospinal fluid (CSF) study reported that concomitant AD pathology (low CSF Aβ and high tau levels) was associated with worse cognition and shorter survival in DLB (Lemstra et al., 2017). Conversely, another study found that Aβ deposition on PET was not associated with any differences in clinical or neuropsychological profiles in DLB (Donaghy et al., 2018).
The relationship between Aβ plaques and structural imaging features in DLB has been evaluated in previous Aβ PET studies, but the results have not been consistent (Donaghy et al., 2018; Lee et al., 2018; Mak et al., 2019; Ye et al., 2020). When people with DLB were categorised into ‘Aβ positive’ (Aβ+) and ‘Aβ negative’ (Aβ−) groups, Donaghy et al. (2018) found no differences in hippocampal volume or grey matter volume between the two groups. In contrast, Lee et al. (2018) and Ye et al. (2020) reported that Aβ+ DLB had greater cortical thinning in the ‘AD-prone’ brain regions compared to Aβ− DLB. In Mak et al. (2019), Aβ deposition was analysed using principal component analysis and was associated with more severe hippocampal and subiculum atrophy, but not with regional cortical thickness.
Aβ PET positivity is a biomarker for AD and is used in the diagnosis as well as in disease monitoring in AD clinical trials. However, Aβ positivity on PET scans has also been reported in a proportion of cognitively normal older adults (estimated to be 11% in those aged 70–80 and 39% in those older than 90 in a meta-analysis), and moderate-to-high levels of Aβ are generally required to explain dementia caused by AD (Montine et al., 2011; Ossenkoppele et al., 2015). In addition, there is wide variability in Aβ PET imaging techniques, including radiotracer properties and analysis methods, which may hinder or limit data comparison or data pooling from different studies (Klunk et al., 2015). To help address this limitation, the Centiloid (CL) method has been more recently developed, with the aim to standardise quantitative Aβ measurement universally, and therefore allow data comparison across studies with different PET techniques (Klunk et al., 2015). Briefly, the CL method is a standardised method used to quantify Aβ deposition by scaling any Aβ PET data to a 0–100 scale, anchored by young Aβ-negative controls at 0-point scale and typical mild AD patients at 100-point scale (Klunk et al., 2015; Rowe et al., 2016).
In this study, we aimed to investigate and quantify Aβ deposition in people with DLB using the radiotracer 18F-NAV4694 and the CL method. 18F-NAV4694 tracer binding correlates strongly with the binding of 11C-PiB and it has additionally been reported to have lower non-specific white matter binding compared to the other 18F-labelled radiotracers (Rowe et al., 2013, 2016). Our study aimed to estimate the magnitudes of the clinical and imaging correlates of Aβ accumulation in DLB, particularly examining its relationship with cortical thickness in AD-vulnerable regions as well as hippocampal volume.
Methods
Participants
Individuals with DLB were referred by local memory clinics, neurologists, old age psychiatrists and geriatricians to participate in an observational study of DLB. All 24 participants who completed the baseline assessments were included. Inclusion criteria were fulfilling the clinical diagnostic criteria for probable DLB (McKeith et al., 2005, 2017), age ⩾ 50, structured Mini-Mental State Examination (MMSE) ⩾ 14 and availability of a study partner to provide collateral information. Exclusion criteria were past history of alcohol or drug dependence, and any alternative psychiatric or neurological disorder that can significantly impact on cognition. All participants and, where appropriate, their person responsible as well as study partners provided written informed consent. The study was approved by the Melbourne Health Human Research Ethics Committee (HREC 17/MH/89).
Clinical and cognitive assessments
Cognitive fluctuations were assessed based on informant history and two carer-based questionnaires, the Mayo Fluctuation Scale and Clinician Assessment of Fluctuation, which are well-validated questionnaires used to identify cognitive fluctuations in people with DLB (Ferman et al., 2004; Walker et al., 2000). For instance, endorsement of at least three of the four items on Mayo Fluctuation Scale has been reported to yield a positive predictive value of 83% for the clinical diagnosis of DLB against AD (Ferman et al., 2004). Visual hallucinations were assessed based on informant history and the Neuropsychiatric Inventory (NPI) (Cummings, 1997). Symptom was rated as present if participants experienced recurrent, well-formed or complex visual hallucinations. Rapid eye movement (REM) sleep behaviour disorder (RBD) was assessed based on informant history as well as using the Mayo Sleep Questionnaire (MSQ) (Boeve et al., 2013). MSQ has been shown to have 98–100% sensitivity and 74–95% specificity for the diagnosis of RBD compared to the gold standard of polysomnography (Boeve et al., 2011, 2013). Motor parkinsonism was assessed using Unified Parkinson’s Disease Rating Scale-part III (UPDRS-III motor subsection) (Ramaker et al., 2002).
The full cognitive test battery comprised the structured MMSE, Montreal Cognitive Assessment (MoCA), Addenbrooke’s Cognitive Examination version III (ACE-III), Clinical Dementia Rating (CDR) and Hopkins Verbal Learning Test (HVLT) (Folstein et al., 1975; Hughes et al., 1982; Mathuranath et al., 2000; Nasreddine et al., 2005; Shapiro et al., 1999). NPI and Geriatric Depression Scale-15 (GDS-15) were used to assess for the presence of any neuropsychiatric symptoms (Cummings, 1997; Yesavage et al., 1982). Study partners completed the Bristol Activities of Daily Living (BADL) instrument which assessed for functions as well as the Zarit Burden Interview questionnaire which recorded caregiver burden (Bianchi et al., 2016; Bucks et al., 1996). In addition, EuroQol-5D (EQ-5D) was administered to measure general quality of life (Rabin and De Charro, 2001).
Neuroimaging
Neuroimaging (magnetic resonance imaging [MRI] and PET imaging) was completed within 3 months of clinical assessment.
Magnetic resonance imaging
MRI was performed on a 3T Siemens Prisma system (Siemens, Erlangen, Germany). Participants underwent T1-weighted MRI using the following acquisition parameters: voxel size = 0.8 mm × 0.8 mm × 0.8 mm, repetition time (TR) = 2400 ms, echo time (TE) = 2.31 ms and flip angle = 8°. All magnetic resonance images were visually inspected to be free of major motion artefact.
Cortical thickness and volumetric analyses
Brain volume and cortical thickness measures were calculated with FreeSurfer using the recon-all pipeline (v6.0.0) (Dale et al., 1999; Fischl and Dale, 2000; Fischl et al., 1999). In brief, this pipeline included motion correction, bias field correction, skull stripping, Talairach transformation and segmentation to white and grey matter (Fischl et al., 2002). This was followed by a tessellation of the white and grey matter boundary, topology correction and surface warping to optimise the grey-white and grey-CSF borders (Dale et al., 1999; Fischl and Dale, 2000). Once the cortical models were generated, surface inflation, spherical atlas transformation and parcellation of the cerebral cortex were performed (Fischl et al., 2004). Visual inspections were performed throughout the processing pipeline.
Cortical thickness, expressed in millimetres, was the distance between the grey-white and grey-CSF boundaries. In addition to vertex-based analysis, region-of-interest (ROI) analyses were performed on six AD-prone cortical regions: inferior temporal, middle temporal, inferior parietal, entorhinal, fusiform and precuneus. These AD-prone ROIs were chosen based on their performance in distinguishing Aβ-positive mild cognitive impairment and AD from Aβ-negative controls and were combined to generate a meta-ROI (Schwarz et al., 2016). Total subcortical grey matter volume and hippocampal volume, expressed as a fraction of intracranial volume, were also estimated.
Amyloid-β PET
Aβ PET imaging was performed using radiotracer 18F-NAV4694. A 20-minute acquisition was performed 50 minutes post-injection of 200 MBq of 18F-NAV4694. Aβ PET scans were spatially normalised using CapAIBL (Bourgeat et al., 2018), and the standard CL method was applied for quantitation (Klunk et al., 2015; Rowe et al., 2016). Twenty CL has been found to be an optimal threshold to indicate the presence of at least moderate Aβ plaque density at neuropathologic evaluation, while 50 CL or more correlated with a clinicopathological diagnosis of AD (Amadoru et al., 2020). Given that Aβ positivity has been consistently reported in a substantial proportion of cognitively normal older individuals, a more stringent threshold of 50 CL was used to identify clinically meaningful Aβ burden and to investigate the clinical and imaging correlates of Aβ in this study.
Statistical analysis
Statistical analysis was performed using SPSS Statistics for Windows version 26 and R. Normality of data distribution was determined using visual inspection of histogram and Shapiro–Wilk test. Differences between Aβ-positive and Aβ-negative DLB were examined using chi-square test for categorical variables, and t test or rank-based test for continuous variables, depending on the normality of data distribution. Effect estimates were reported as mean differences for normally distributed data or Generalised Odds Ratio (Genodds) (Churilov et al., 2014) for rank-based analysis, with respective 95% confidence intervals (CIs). Genodds above 1 for a given outcome indicate that a randomly chosen Aβ-positive participant will have a worse outcome than a randomly chosen Aβ-negative control on the relevant scale. Relationship between Aβ deposition and imaging variables (cortical thickness and subcortical volumes) was also examined using linear regression model, adjusted for age, sex and years of education. In addition, a post hoc receiver operating curve (ROC) analysis was conducted to evaluate the diagnostic ability of AD-prone meta-ROI in distinguishing Aβ+ from Aβ− DLB.
Results
Demographics and clinical characteristics
Twenty-four participants with probable DLB underwent Aβ PET imaging. Of these, 16 (66.7%) had an Aβ CL of more than 20 and 11/24 (45.8%) had an Aβ CL of more than 50 (considered Aβ+). Age, sex and level of education were similar between Aβ+ and Aβ− DLB groups. Clinical characteristics of both groups are presented in Table 1. Interestingly, all Aβ+ participants were on a cognitive-enhancing medication, either a cholinesterase inhibitor or memantine, compared to less than half of the Aβ− group (p = 0.004; see Table 1). Clinically, the severity of cognitive impairment, neuropsychiatric symptoms, self-report quality of life and caregiver burden did not differ between groups (see Table 2). The above analyses were repeated using 20 CL as threshold and similar results were obtained (see Supplementary Table 1).
Demographics and clinical characteristics.
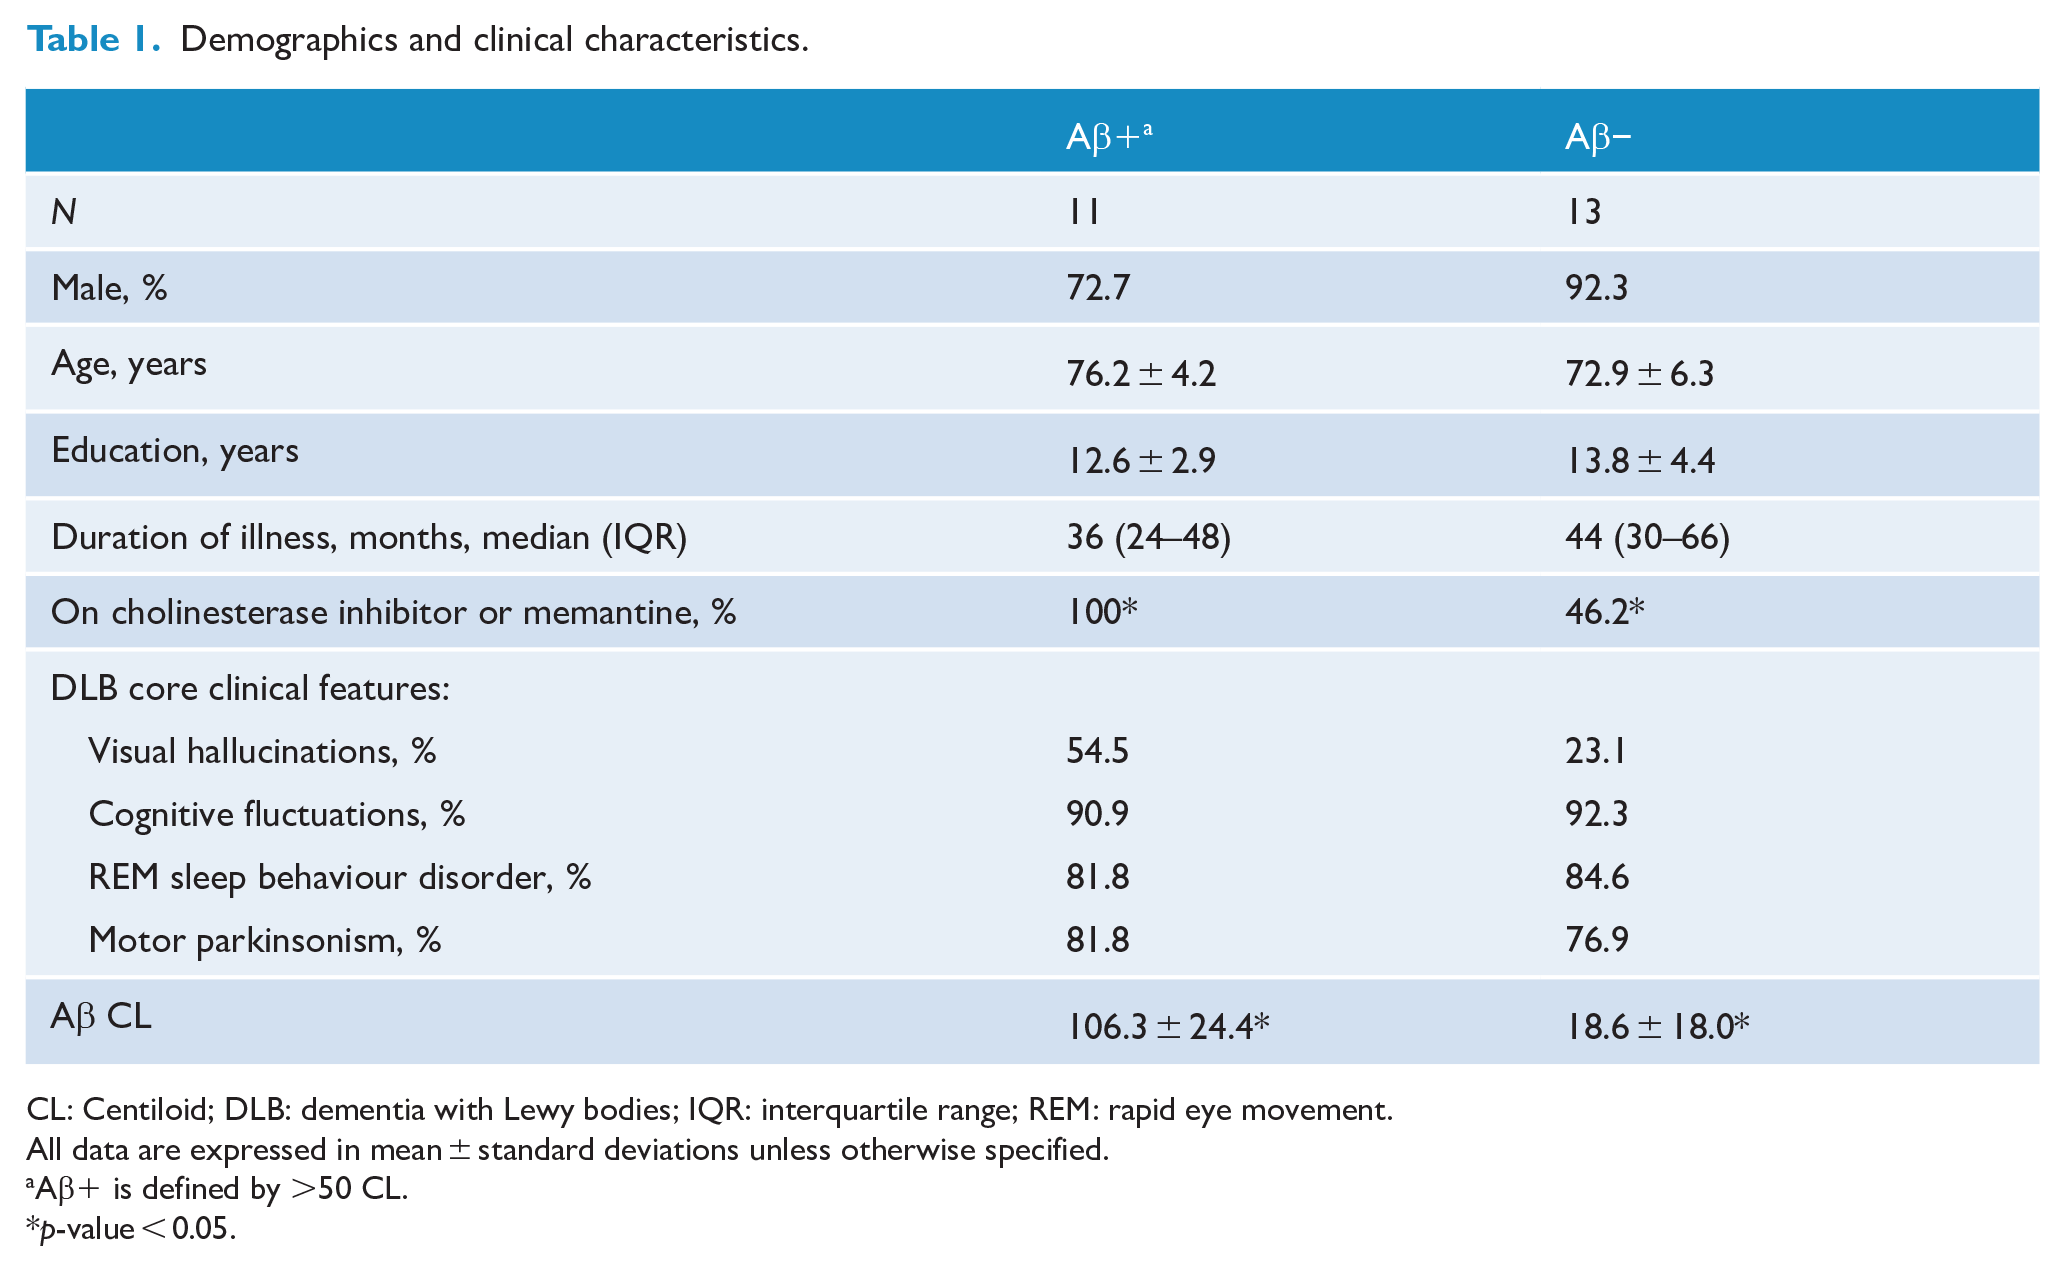
CL: Centiloid; DLB: dementia with Lewy bodies; IQR: interquartile range; REM: rapid eye movement.
All data are expressed in mean ± standard deviations unless otherwise specified.
Aβ+ is defined by >50 CL.
p-value < 0.05.
Group differences in clinical scales between Aβ+ and Aβ− DLB.
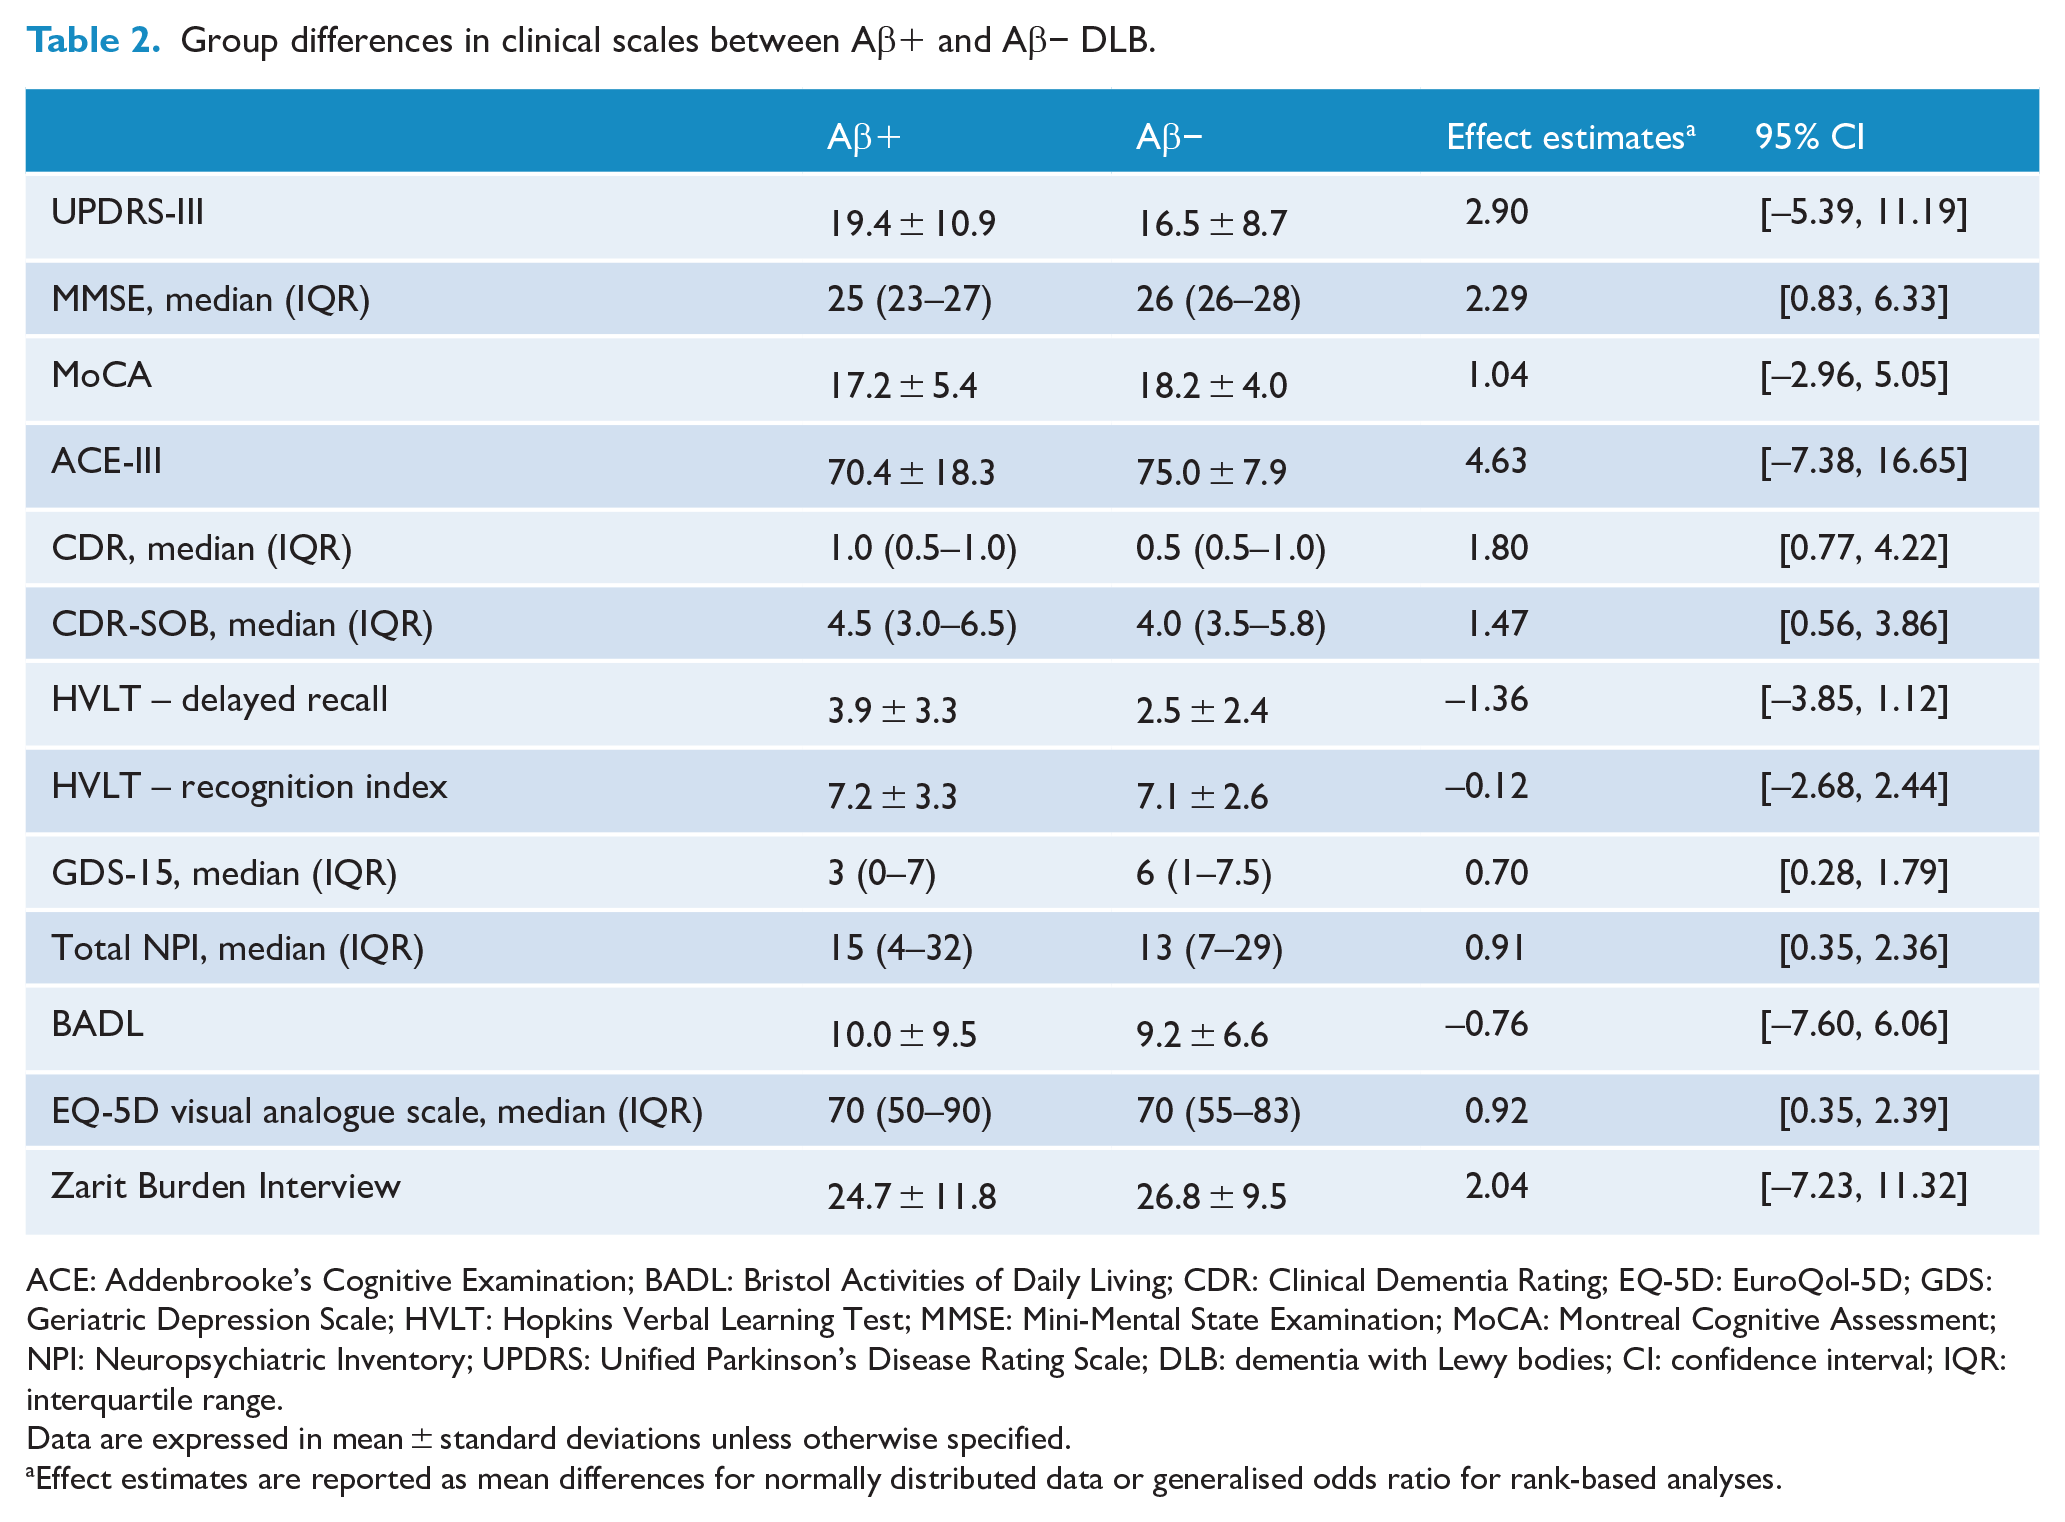
ACE: Addenbrooke’s Cognitive Examination; BADL: Bristol Activities of Daily Living; CDR: Clinical Dementia Rating; EQ-5D: EuroQol-5D; GDS: Geriatric Depression Scale; HVLT: Hopkins Verbal Learning Test; MMSE: Mini-Mental State Examination; MoCA: Montreal Cognitive Assessment; NPI: Neuropsychiatric Inventory; UPDRS: Unified Parkinson’s Disease Rating Scale; DLB: dementia with Lewy bodies; CI: confidence interval; IQR: interquartile range.
Data are expressed in mean ± standard deviations unless otherwise specified.
Effect estimates are reported as mean differences for normally distributed data or generalised odds ratio for rank-based analyses.
Cortical thickness
MRI analyses were carried out on 19 DLB participants (5 had contraindications to MRI). Of these, 9/19 (47.4%) were Aβ+ (>50 CL). On vertex-based analysis, Aβ+ DLB participants demonstrated more global cortical thinning compared to Aβ− group (mean difference: left hemisphere [LH] = 0.16 mm, 95% CI = [0.09, 0.24]; right hemisphere [RH] = 0.16 mm, 95% CI = [0.07, 0.24]; see Figure 1). The pattern of increased cortical thinning in Aβ+ DLB participants is illustrated in Figure 2 (pFDR < 0.05). In linear regression, higher cortical Aβ CL was found to be associated with lower cortical thickness bilaterally (LH: β = −0.002, 95% CI = [−0.003, −0.001], p = 0.004; RH: β = −0.002, 95% CI = [−0.003, −0.001], p = 0.006).
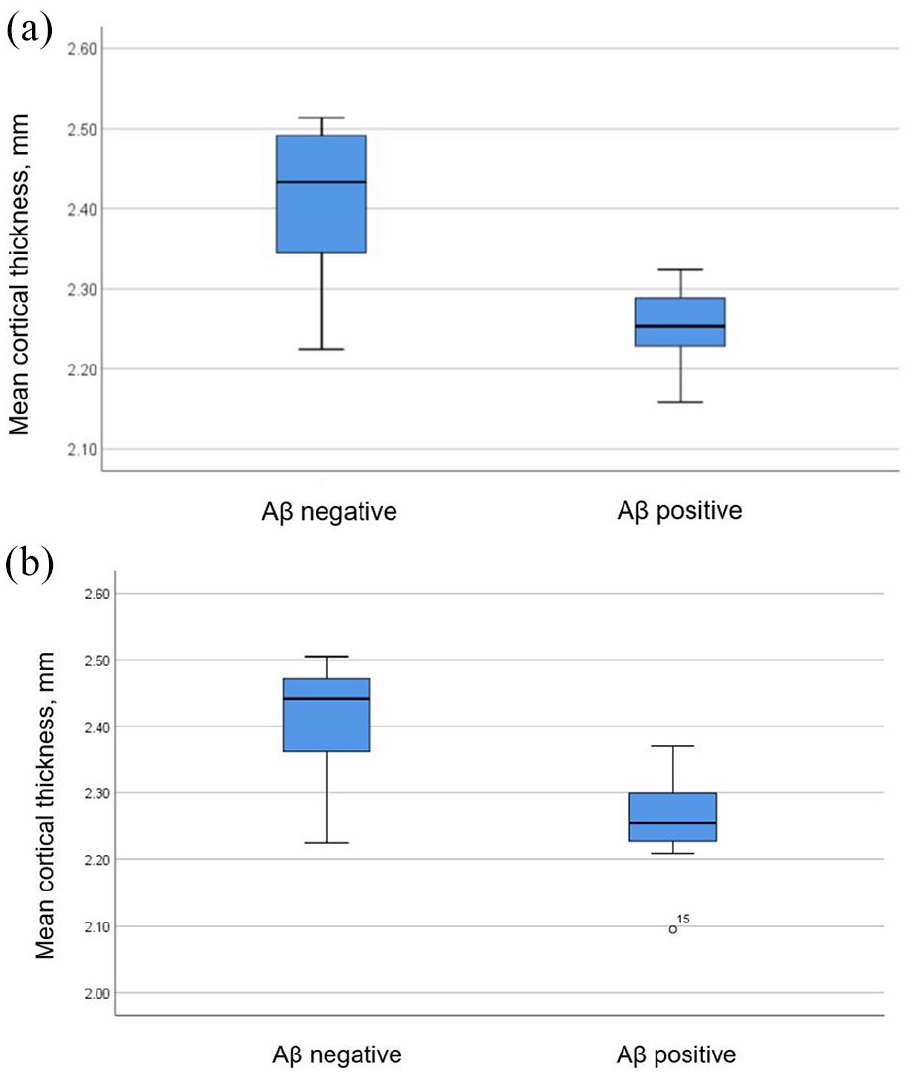
(a) Left cortical thickness between Aβ+ and Aβ− DLB (p < 0.001) and (b) right cortical thickness between Aβ+ and Aβ− DLB (p = 0.001).
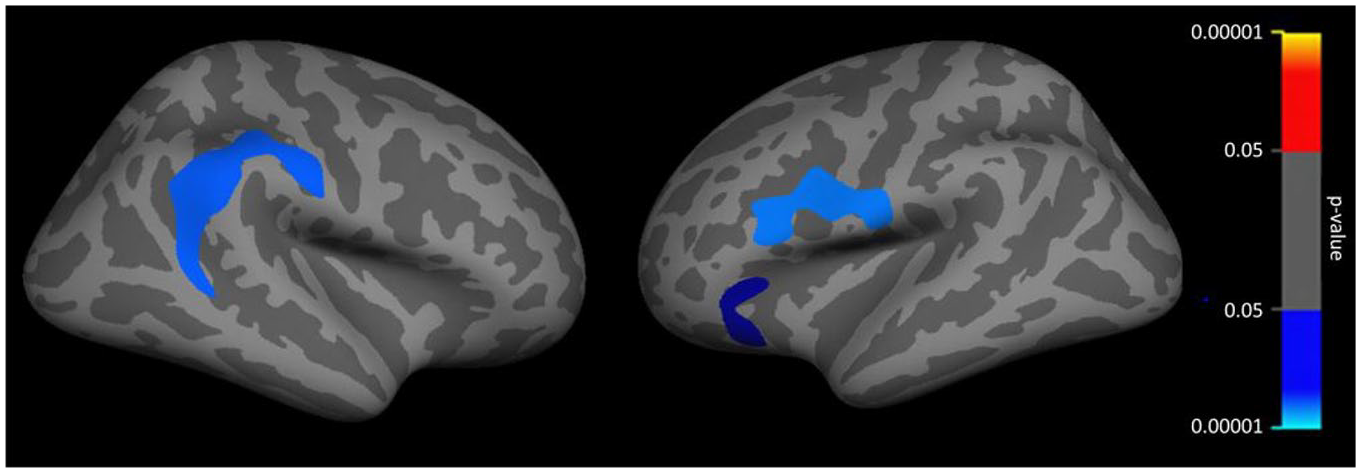
Cortical thickness group difference. Blue: Aβ+ < Aβ−; red: Aβ+ > Aβ−, p < 0.05, corrected for multiple comparison (vertex-wise cluster threshold, p < 0.001).
AD-prone ROIs
The results were similar at the ROI level (see Table 3). Aβ+ DLB participants showed increased cortical thinning in almost all the AD-prone ROIs compared to Aβ− group. A ‘meta-ROI’ thickness measurement was formed by averaging six AD-prone regions (Schwarz et al., 2016). Between-group comparison indicated greater cortical thinning in Aβ+ DLB participants compared to their Aβ− counterparts (mean difference: left meta-ROI 0.22 mm, 95% CI = [0.12, 0.32]; right meta-ROI = 0.17 mm, 95% CI = [0.07, 0.27]). In contrast, analyses repeated using 20 CL as threshold revealed no differences in any of the thickness variables between Aβ+ and Aβ− groups (p > 0.05). To determine the diagnostic performance of AD-prone meta-ROIs in separating Aβ+ from Aβ− DLB, ROC analysis was conducted which showed an area under the curve (AUC) of 0.94 for combined left and right meta-ROIs (see Figure 3). A mean cortical thickness of 5.12 mm across a combined meta-ROI has a sensitivity of 88.9% and specificity of 90.0% in discriminating Aβ+ from Aβ− DLB.
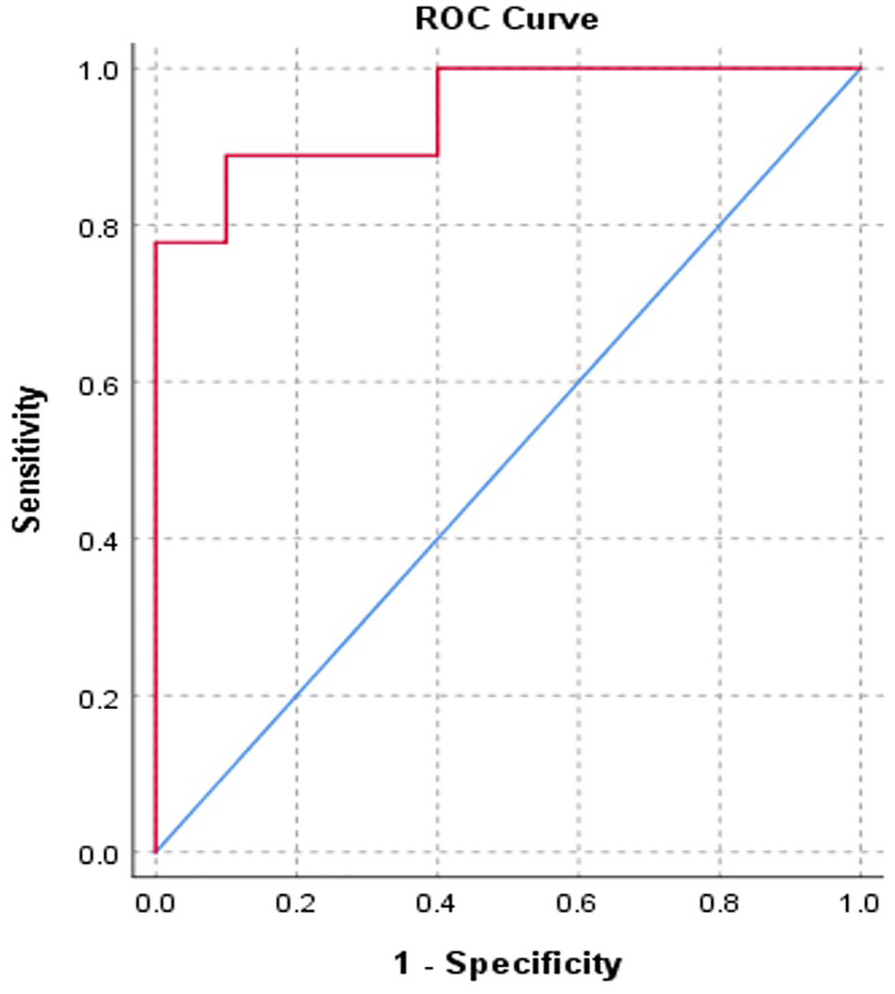
ROC curve for combined meta-ROI in distinguishing between Aβ+ and Aβ− DLB (AUC, 0.944).
Group differences in cortical thickness in AD-prone ROIs between Aβ+ and Aβ− DLB.
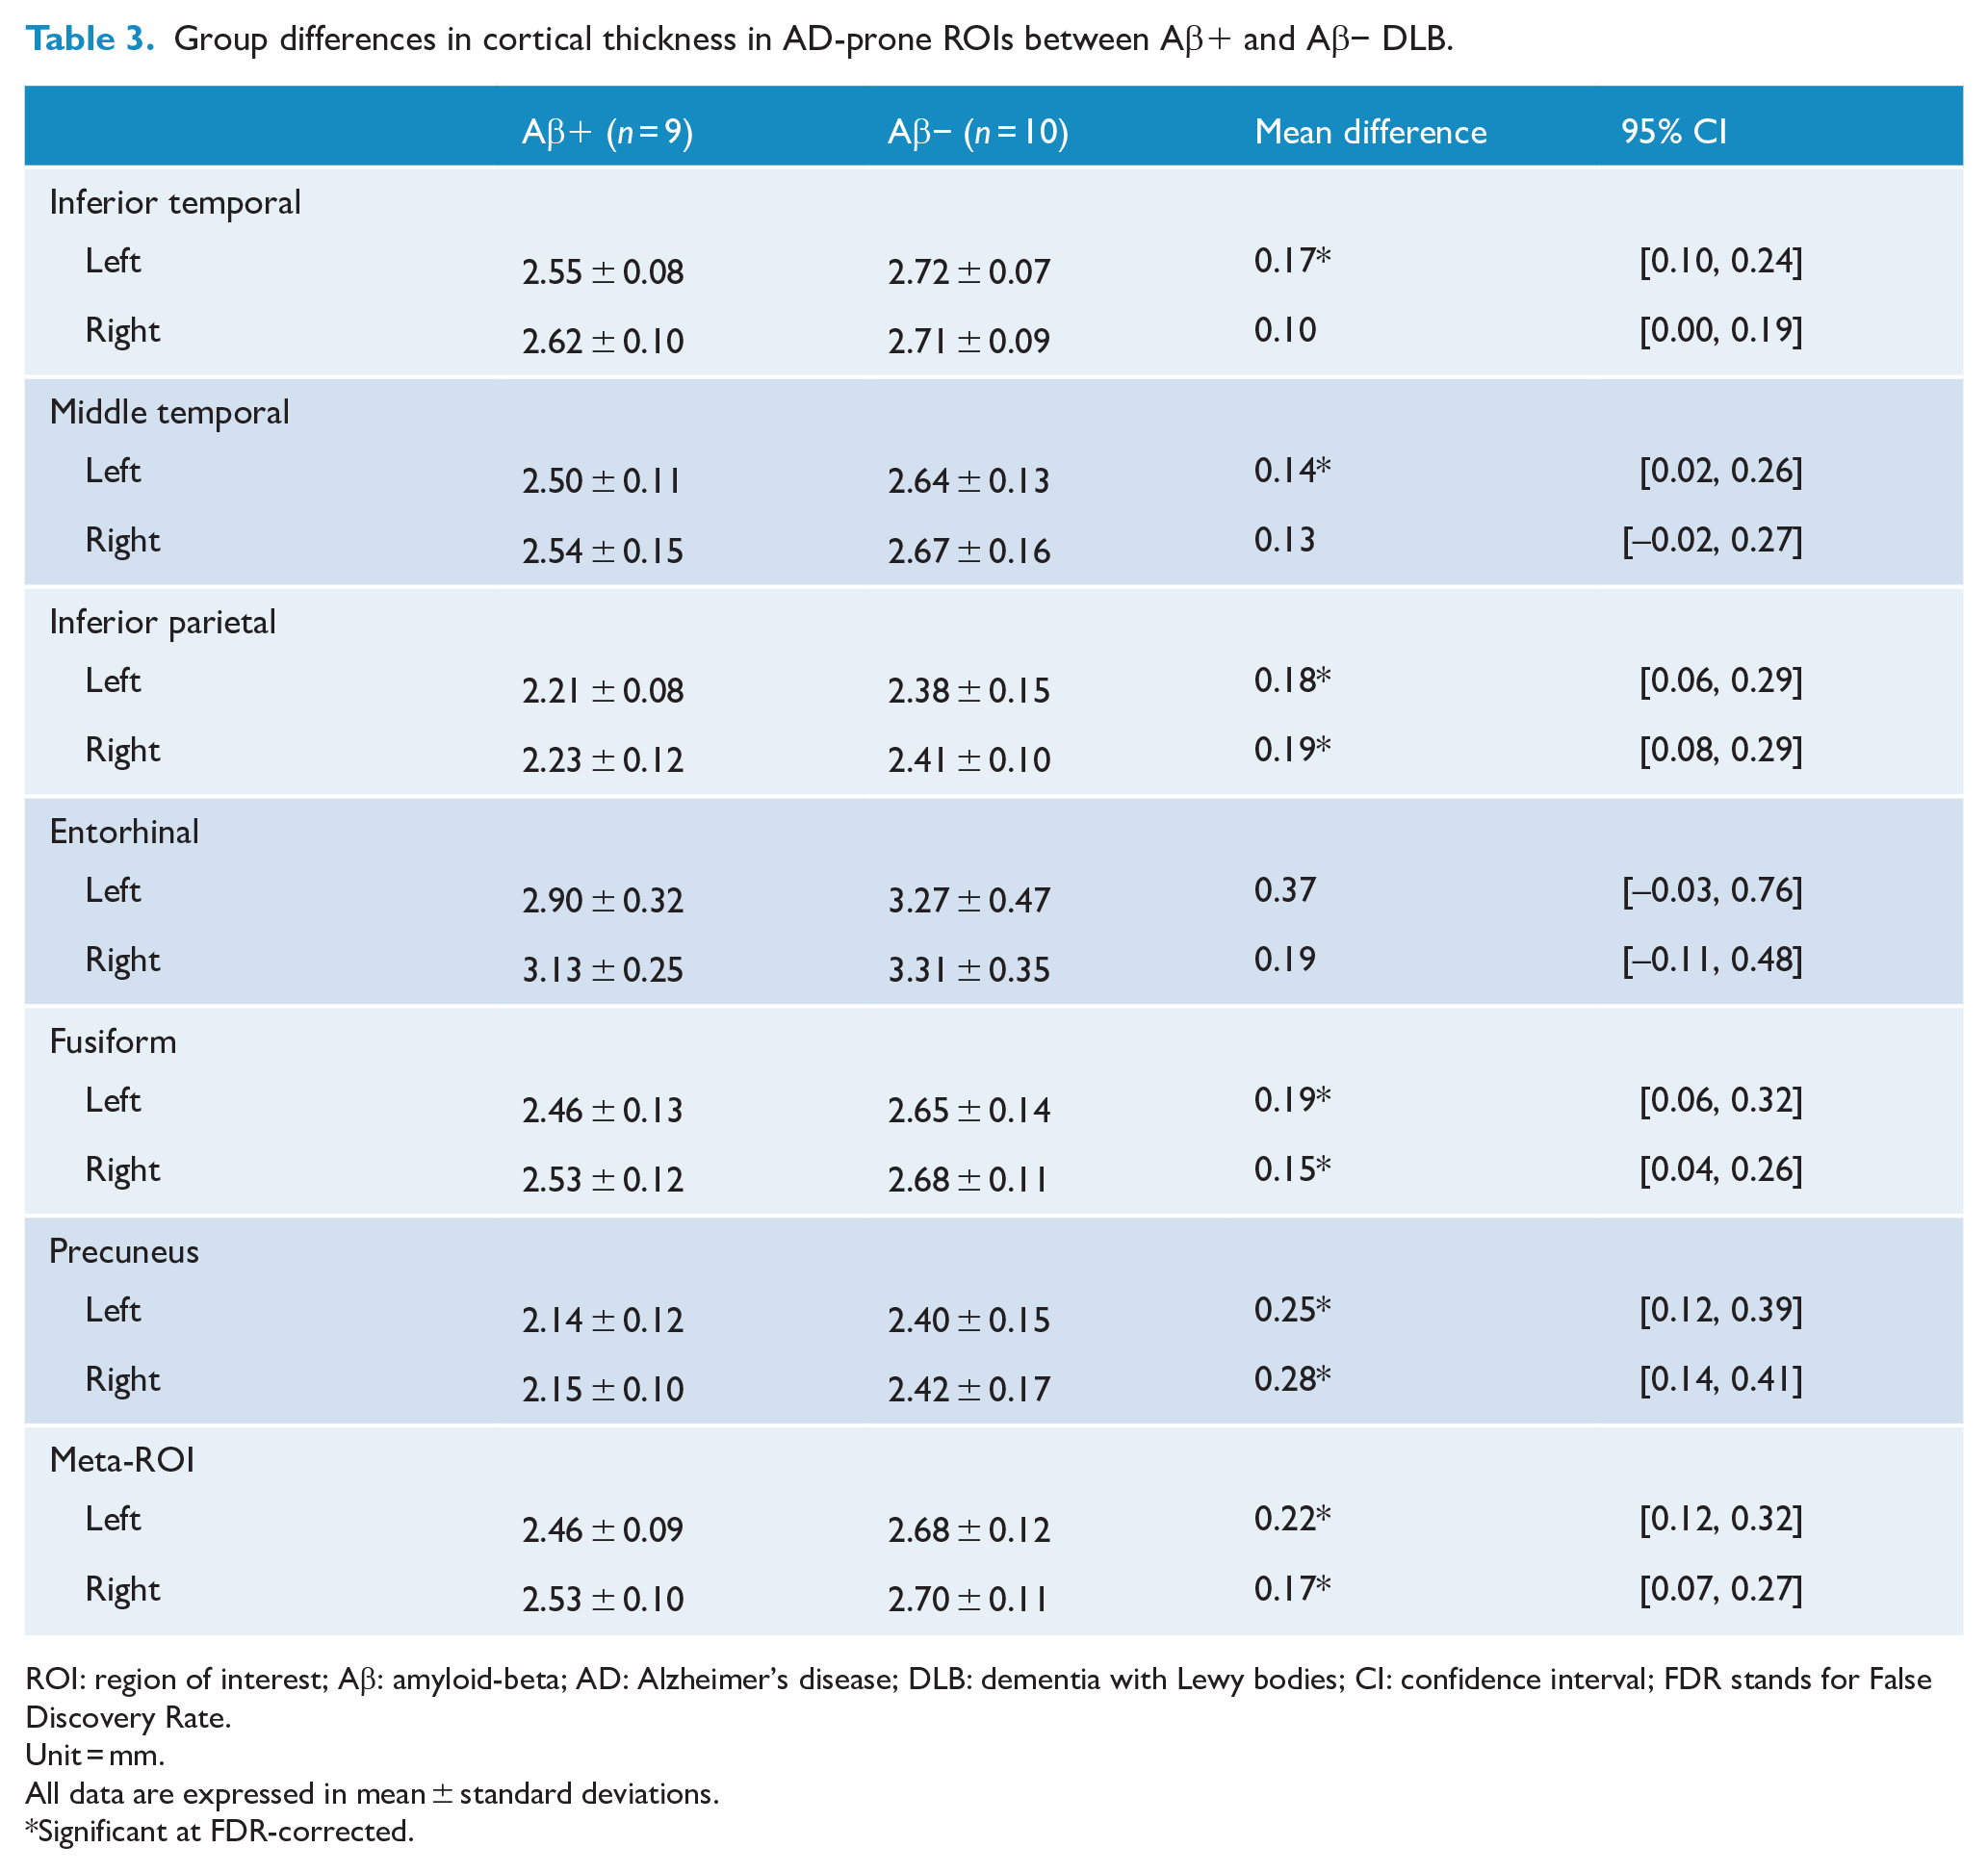
ROI: region of interest; Aβ: amyloid-beta; AD: Alzheimer’s disease; DLB: dementia with Lewy bodies; CI: confidence interval; FDR stands for False Discovery Rate.
Unit = mm.
All data are expressed in mean ± standard deviations.
Significant at FDR-corrected.
Subcortical and hippocampal volumes
Volumes of subcortical structures including the hippocampus were also compared between Aβ+ and Aβ− DLB participants. Total subcortical grey matter and hippocampal volumes were similar between the two groups (mean difference: subcortical grey matter = 1.32, 95% CI = [−0.92, 3.56]; left hippocampus = −0.05, 95% CI = [−0.27, 0.18]; right hippocampus = −0.07, 95% CI = [−0.30, 0.16]). Similar results were observed using 20 CL as the cut-off.
Discussion
Using 18F-NAV4694 Aβ PET and high-resolution MRI, we investigated Aβ deposition and its clinical and imaging associations in a cohort of clinically diagnosed probable DLB participants. The rate of Aβ-PET positivity was 45.8%. We did not find any associations between Aβ positivity and clinical characteristics in our DLB participants. On neuroimaging, Aβ+ DLB showed reduced cortical thickness globally as well as in the AD-prone regions.
In our study, approximately 66.7% of DLB had an Aβ CL of more than 20. When a higher threshold (>50 CL) was used to identify clinically meaningful Aβ burden and to define Aβ-PET positivity, 45.8% were ‘Aβ positive’. Our finding was comparable with previous result from a meta-analysis, which found that the pooled prevalence of ‘11C-PiB-positive’ scans among DLB group was 68% (n = 99; 95% CI = [55%, 82%]) (Petrou et al., 2015). In terms of radiotracers, 18F-NAV4694 radiotracer correlated strongly with the binding of 11C-PiB and might even allow earlier detection of Aβ accumulation compared to 11C-PiB (Rowe et al., 2013, 2016). Our study is one of the first DLB studies to have employed the CL method to quantify and report cortical Aβ deposition (Rowe et al., 2016). PET-autopsy studies have proposed different threshold values ranging between 12.2 and 20 CL to indicate the presence of at least moderate Aβ plaques at autopsy, while the threshold estimated to detect intermediate to high AD neuropathologic change (ADNC) ranged between 24.4 and 49.4 CL (Amadoru et al., 2020; Hyman et al., 2012; La Joie et al., 2019). In Amadoru et al., >50 CL also correlated with a clinicopathological AD diagnosis and was used as the threshold in this study (Amadoru et al., 2020).
In our study, Aβ+ and Aβ− DLB did not differ in demographics as well as clinical characteristics, including duration of illness, frequencies of DLB core clinical features and severity of parkinsonism measured by UPDRS-III. Aβ accumulation is known to increase with age, but we did not detect any association between Aβ positivity and age in our DLB participants. This lack of association may potentially be due to the small sample size or the small age difference between the two groups (76.2 vs 72.9 years). In a previous meta-analysis, Aβ positivity was observed to increase from 60 to 80 years in people with DLB (Ossenkoppele et al., 2015). Previous autopsy study showed that lower frequencies of core clinical features resulting in lower diagnostic accuracy were associated with decreasing Lewy body distribution and increasing neuritic plaque pathology (Tiraboschi et al., 2015). However, unlike the CERAD plaque score that only measures neuritic plaques at neuropathologic examination, Aβ PET radiotracers, such as 11C-PiB, bind to both neuritic and diffuse amyloid plaques which are frequently present in DLB (Montine et al., 2011; Shirvan et al., 2019). This might potentially explain the lack of association between Aβ deposition and DLB core clinical features in our study. Furthermore, the DLB participants in our study were recruited using clinical diagnostic criteria, which meant that those with DLB with significant neuritic plaques or tau pathology are likely to be under-represented in our study due to higher likelihood of misdiagnoses (McKeith et al., 2017; Tiraboschi et al., 2015).
In our cohort, all Aβ+ participants were treated with a cognitive-enhancing medication compared with less than half of the Aβ− group, which suggests that there were potentially some unmeasured clinical differences between the groups which prompted differences in management. Aβ+ DLB performed worse than Aβ− cases on all cognitive and neuropsychological tests, apart from HVLT, but these differences were not statistically significant. Neuropsychiatric features, functional status, self-report quality of life and caregiver burden were also not different between the two groups. Whether the use of cognitive-enhancing medications was masking any significant difference in the severity of cognitive impairment or any other clinical scales between the two groups remains uncertain and needs to be explored in future studies. Previous PET studies in DLB have not identified any associations between Aβ load and clinical features; only one study (Donaghy et al., 2018) reported the frequencies of cognitive-enhancing medication use, which were similar between Aβ+ and Aβ− DLB (Donaghy et al., 2018; Lee et al., 2018; Ye et al., 2020). Even in people with AD, studies have shown that tau pathology, not Aβ, had the strongest negative influence on cognition and disease trajectory (Aschenbrenner et al., 2018; Pontecorvo et al., 2017). In contrast, findings from neuropathologic studies suggested that ADNCs might also contribute to the overall cognitive deficits in people with DLB (Howlett et al., 2015; Zhang et al., 2020). The discordance of results between neuroimaging and neuropathologic studies signifies the importance of conducting longitudinal clinicopathologic correlation studies in people with dementia.
On imaging analyses, our study found that Aβ+ DLB participants exhibited more global cortical thinning than Aβ− DLB on vertex-based analysis. In addition, Aβ+ DLB participants showed greater cortical thinning in the AD-prone ROIs, involving the temporoparietal cortices as well as the precuneus, a signature pattern of cortical thinning typically observed in AD (Dickerson et al., 2009; Schwarz et al., 2016). Notably, these differences were not detected when a lower threshold (20 CL) was applied for Aβ positivity. These findings suggest that Aβ pathology plays a part in the neurodegenerative process of DLB, but a certain threshold may need to be met before Aβ exerts any detrimental effect on the neurostructural changes in people with DLB. Our results are also in keeping with previous DLB studies which reported a negative correlation between Aβ deposition and cortical thickness (Lee et al., 2018; Ye et al., 2020). To evaluate the diagnostic ability of regional cortical thickness in predicting the presence of co-existing Aβ burden in DLB, our ROC analysis demonstrated that a mean cortical thickness of 5.12 mm across right and left AD-prone ROIs discriminated Aβ+ from Aβ− DLB with a high specificity of 90.0% and sensitivity of 88.9%. This result will need to be validated in other cohorts and once validated, this approach may potentially be utilised in clinical and research settings, as a more cost-effective imaging modality than PET scan as well as in centres where Aβ PET imaging is not readily available.
In AD, medial temporal lobe atrophy, particularly hippocampal atrophy, is a commonly used MRI biomarker in clinical and research settings and has been shown to correlate with disease severity (Aschenbrenner et al., 2018; Schwarz et al., 2016). In our cohort, we did not observe any significant differences in total subcortical grey matter or hippocampal volumes between Aβ+ and Aβ− DLB. Temporal progression models of AD biomarkers have shown that Aβ accumulation often precedes NFT formation and structural MRI changes including hippocampal atrophy in people with AD (Jack et al., 2013). One possible explanation is that the DLB participants in our study are at an early stage of their AD-related processes where prominent hippocampal volume loss, possibly driven by NFT pathology, has not developed. Interestingly, one previous study has shown that asymptomatic individuals with CSF AD biomarkers (‘preclinical AD’) showed reduced cortical thickness in AD-vulnerable regions, but not lower hippocampal volume, compared with healthy controls (Sabuncu et al., 2011). These findings imply that AD-like cortical thinning may occur at the earliest stage of disease course and may be a more sensitive marker than hippocampal volume (Sabuncu et al., 2011). Similarly, overt clinical symptoms are often thought to follow functional and structural changes on MRI, which may possibly explain the lack of associations between Aβ deposition and clinical variables in our study (Jack et al., 2013).
Given that a high proportion of people with DLB have significant Aβ burden, understanding the influence of Aβ pathology on the clinical phenotypes and disease course in DLB is crucial and may enable more accurate diagnosis and prognostication. Furthermore, given the advances in therapeutic trials, this may potentially help guide patient selection for anti-amyloid treatment. Our study has some limitations. This was a cross-sectional analysis and therefore multimodal longitudinal assessments incorporating Aβ and tau biomarkers will be required to evaluate the contributions of different neuropathological processes to the clinical and structural features as well as disease trajectories in individuals with DLB. Given the relatively small sample size of our study, some differences between groups may have been missed due to insufficient power. These differences, as well as the diagnostic utility of cortical thickness measurements to predict concomitant Aβ burden in DLB, will need to be validated in larger cohorts.
Conclusion
Aβ deposition is common in DLB. There were no associations found between cortical Aβ deposition and clinical features in our cohort of probable DLB. Early structural changes in cortical thickness, but not hippocampal volume, were observed in DLB with significant Aβ burden. Whether Aβ in DLB represents an early AD process or has important clinical implications will need to be evaluated in future longitudinal studies. Understanding the influence of Aβ deposition in people with DLB is important as it may potentially influence clinical management decisions, particularly when disease-modifying therapy becomes available.
Supplemental Material
sj-docx-1-anp-10.1177_00048674221081773 – Supplemental material for Association between amyloid-beta deposition and cortical thickness in dementia with Lewy bodies
Supplemental material, sj-docx-1-anp-10.1177_00048674221081773 for Association between amyloid-beta deposition and cortical thickness in dementia with Lewy bodies by Kai Sin Chin, Sanuji Gajamange, Patricia M Desmond, Victor L Villemagne, Christopher C Rowe, Leonid Churilov, Nawaf Yassi and Rosie Watson in Australian & New Zealand Journal of Psychiatry
Footnotes
Declaration of Conflicting Interests
The author(s) declared no potential conflicts of interest with respect to the research, authorship and/or publication of this article.
Funding
The author(s) disclosed receipt of the following financial support for the research, authorship and/or publication of this article: This study was funded by the Yulgilbar Alzheimer’s Research Program. K.S.C. is supported by the Research Training Program Scholarship by the Australian Commonwealth Government and a PhD top-up scholarship from the Yulgilbar Alzheimer’s Research Program. All funders have no role in study design, data analysis, preparation of the manuscript and decision to submit the manuscript for publication. We also thank Mr Vincent Dore from CSIRO for his support in the quantitative analysis of amyloid-beta PET data.
Supplemental material
Supplemental material for this article is available online.
References
Supplementary Material
Please find the following supplemental material available below.
For Open Access articles published under a Creative Commons License, all supplemental material carries the same license as the article it is associated with.
For non-Open Access articles published, all supplemental material carries a non-exclusive license, and permission requests for re-use of supplemental material or any part of supplemental material shall be sent directly to the copyright owner as specified in the copyright notice associated with the article.