
Abstract
Objective:
Recent research has suggested that a type of atypical eye movement, called square wave jerks, together with anxiety, may distinguish individuals with anorexia nervosa from those without anorexia nervosa and may represent a biomarker and endophenotype for the illness. The aim of this study was to identify the presence of this proposed marker in individuals currently with anorexia nervosa relative to healthy controls, and to identify the state independence and heritability of this putative marker by exploring whether it also exists in individuals who are weight-restored from anorexia nervosa and first-degree relatives (i.e. sisters of people with anorexia nervosa).
Methods:
Data from 80 female participants (20/group: current anorexia nervosa, weight-restored from anorexia nervosa, sisters of people with anorexia nervosa and healthy controls) were analysed. Square wave jerk rate was acquired during a fixation task, and anxiety was measured with the State Trait Anxiety Inventory.
Results:
Current anorexia nervosa, weight-restored from anorexia nervosa and sisters of people with anorexia nervosa groups made significantly more square wave jerks than healthy controls, but did not differ from one another. Square wave jerk rate and anxiety were found to discriminate groups with exceptionally high accuracy (current anorexia nervosa vs healthy control = 92.5%; weight-restored from anorexia nervosa vs healthy control = 77.5%; sisters of people with anorexia nervosa vs healthy control = 77.5%; p < .001).
Conclusion:
The combination of square wave jerk rate and anxiety was found to be a promising two-element marker for anorexia nervosa, and has the potential to be used as a biomarker or endophenotype to identify people at risk of anorexia nervosa and inform future treatments.
Unlike many other medical conditions, biological markers or ‘biomarkers’ are not established for use in clinical practice for any mental illness. Biomarkers provide an objective measurable indicator of a condition and are routinely used for diagnostic purposes in many areas of medicine. Mental illnesses are instead diagnosed based on the Diagnostic and Statistical Manual of Mental Disorders (DSM-5) (American Psychiatric Association, 2013) and the International Classification of Diseases (ICD-11) (World Health Organization, 2018), which rely on descriptions of symptoms from patients and a clinician’s judgement to make diagnoses. Psychiatric diagnoses are therefore subjective in nature and are further confounded in conditions such as anorexia nervosa (AN) that are often secretive and associated with persistent denial of illness symptoms (Strober, 2004). Therefore, the identification of reliable and valid objective markers for mental illnesses, and AN specifically, is imperative.
AN is a serious psychiatric condition associated with body image disturbances that lead to significantly low body weight (American Psychiatric Association, 2013; Phillipou et al., 2018c). AN is associated with the highest mortality rate of any mental illness, among the highest relapse rates of any psychiatric condition and a long-term recovery rate of less than 63% among surviving patients (Couturier and Lock, 2006; Eddy et al., 2017; Harris and Barraclough, 1998; Norring and Sohlberg, 1993; Steinhausen, 2002; Sullivan, 1995). Managing and treating AN are exceptionally challenging, with only a small window, early in the illness, for which treatment is most effective (Hay et al., 2014). However, illness denial and treatment resistance are characteristic of the condition, often delaying the initiation of treatment (Strober, 2004). Therefore, it is critical to identify AN as early as possible to allow immediate commencement of treatment. A biomarker has the potential to identify people with AN early in the illness, thereby enabling critical early intervention. Establishing a biomarker for any illness, including AN, provides a number of benefits, including (1) potential for the early identification of the illness; (2) potential to identify those at risk of developing the illness; (3) less reliance on descriptions of symptomatology from patients when making diagnoses; and (4) insight into the biological mechanisms involved in the condition.
As is the case with other mental illnesses, a biomarker for AN has not yet been established (Malcolm and Phillipou, 2021). However, recent findings from our research group uncovered a promising potential biomarker for AN. Specifically, this research identified in individuals with AN a distinctive type of saccadic eye movement, called square wave jerks (SWJs), while fixating on a central stimulus (Phillipou et al., 2014). SWJs are very small (<5) involuntary eye movements which briefly (<200 ms) move the eye away from and back to the desired position (i.e. tiny, ‘twitching’, involuntary, horizontal eye movements). SWJs occur at a very low rate in healthy people, and an individual is typically unaware of their occurrence. In our research, we found that participants with a current diagnosis of AN had a significantly increased rate of SWJs during a fixation task (i.e. a task requiring participants to fixate on a central stimulus for 1 minute) compared to healthy controls (HCs). While SWJ rate was a strong predictor of group membership (i.e. AN or HC), the inclusion of anxiety in the model greatly enhanced predictive validity. The rate of SWJs negatively correlated with state anxiety in AN and together correctly discriminated AN from HCs with 95.5% specificity and 87% sensitivity (91.25% accuracy), suggesting a promising biomarker for AN. This finding highlights the important contribution of a self-report measure of anxiety being pivotal to this marker. AN is highly associated with anxiety and is frequently comorbid in the illness (Kaye et al., 2004; Swinbourne and Touyz, 2007). Anxiety is also one of the driving forces underlying AN behaviours and symptomatology (Phillipou et al., 2018c, 2018d). As anxiety and SWJs shared an inverse relationship in AN – that is, low anxiety was associated with increased SWJ rate, and vice versa – the presence of anxiety alone does not discriminate AN from HC, but the combination of anxiety levels and SWJ rate does provide a marker of AN.
Particular deficits in the production of eye movements can be indicative of dysfunction in specific brain regions or neurotransmitter systems. Given the well-defined neural mechanisms involved in eye movements, eye movement assessments are frequently employed in neurological illnesses as diagnostic tools and for differentiating between similarly presenting conditions (Gelb et al., 1999). There is also a very long history of eye movement research in mental illness, particularly in schizophrenia – dating back over 100 years (Diefendorf and Dodge, 1908). Extensive research in this area has uncovered specific eye movement abnormalities, including deficits in antisaccade task performance (i.e. a task that requires participants to suppress an eye movement to a peripherally presented stimulus and instead make an eye movement to the mirror image location of the stimulus). Schizophrenia patients show increased response latencies and greater error rates on the antisaccade task – as do first-degree relatives of people with schizophrenia (Hutton and Ettinger, 2006). Indeed, an increase in antisaccade errors has been proposed as an endophenotype of schizophrenia, given that no study has failed to replicate this result and because the finding is also present in unaffected first-degree relatives (i.e. demonstrating the heritability criterion of an endophenotype) (Hutton and Ettinger, 2006; Myles et al., 2017). However, although antisaccade errors are higher on average in schizophrenia patients, they do not specifically differentiate schizophrenia patients from healthy individuals – that is, this measure has not been proposed as a biomarker. While a number of conditions are associated with specific eye movement deficits, SWJs are not known to be characteristic of any other mental illness. SWJs are present in individuals with neurological conditions such as Friedreich’s ataxia (Fahey et al., 2008), progressive supranuclear palsy (Anagnostou et al., 2020) and Parkinson’s disease (Otero-Millan et al., 2013), but unlike our findings in AN, they have not been proposed as a biomarker for these illnesses.
The overarching aim of this study was to identify the suitability of SWJs together with anxiety as a marker that distinguishes AN from those without AN. Thus, the study had three distinct aims. The first aim was to improve on the methodology of our previous work which used state anxiety together with SWJs, to predict current AN (c-AN) from HC. A limitation of state measures is that they assess current feelings of anxiety, are influenced by environmental factors and can fluctuate depending on the situation. Therefore, a trait measure of anxiety provides a more stable measure and is more appropriate for use as a potential marker. The second aim of the study was to extend this research to individuals weight-restored from AN (wr-AN) to determine whether this marker is only present in c-AN, or is present across different illness stages (i.e. demonstrating state independence). The third aim of this study was to explore the heritability of this marker by assessing non-affected first-degree relatives of individuals with AN: specifically, sisters (AN-sis). It was hypothesised that SWJ count and trait anxiety would together discriminate c-AN and wr-AN participants from HC participants, demonstrating a stable marker across illness stages that could be used to identify lifetime AN. Given the uncertain heritability of AN (Bulik et al., 2006), contrasts with the AN-sis group were exploratory.
Methods
The study was granted ethics approval by the Human Research Ethics Committee (HREC) at The Melbourne Clinic (TMC REC 263) and from Swinburne University’s Human Research Ethics Committee (SUHREC 2016/152). Written informed consent was obtained from all participants.
Participants
Eighty-nine right-handed female participants aged ⩾18 years were recruited through community advertisements. Five were excluded from analyses because of incidental magnetic resonance imaging (MRI) abnormalities identified as part of a broader collection of data on this sample but not reported here (one c-AN, two AN-sis and two HC). An additional c-AN participant was excluded as she presented with current psychotic symptoms; two wr-AN participants were excluded as they self-identified as weight-restored but were underweight when assessed; and one HC participant was not included as she reported a past subclinical eating disorder during the assessment. Therefore, 20 participants in each group were included in the clinical and eyetracking analyses presented here. A multivariate analysis of variance (MANOVA) power analysis suggests that the sample size was sufficient to detect moderate to large effect sizes (f = 0.3) with 80% power at a significance level of 5%.
Groups did not differ on age or premorbid intelligence assessed with the Wechsler Test of Adult Reading (WTAR) (Wechsler, 2001) (see Table 1). All participants were English speaking and had no history of significant brain injury or neurological condition, or ocular pathology. HC were required to have no history of an eating disorder or other mental illness, and AN-sis were required to have a biological sibling with a current or past diagnosis of AN (three AN-sis participants had siblings in the AN groups; two c-AN and one wr-AN). Those in the wr-AN group were required to have a previous diagnosis of AN confirmed by a health professional (psychologist or psychiatrist), and to have maintained a body mass index (BMI) of 18.5 or more for at least the previous 12 months. c-AN participants were required to have a current diagnosis of AN according to DSM-5 criteria (n = 19 restrictive subtype AN).
Demographic and clinical characteristics.
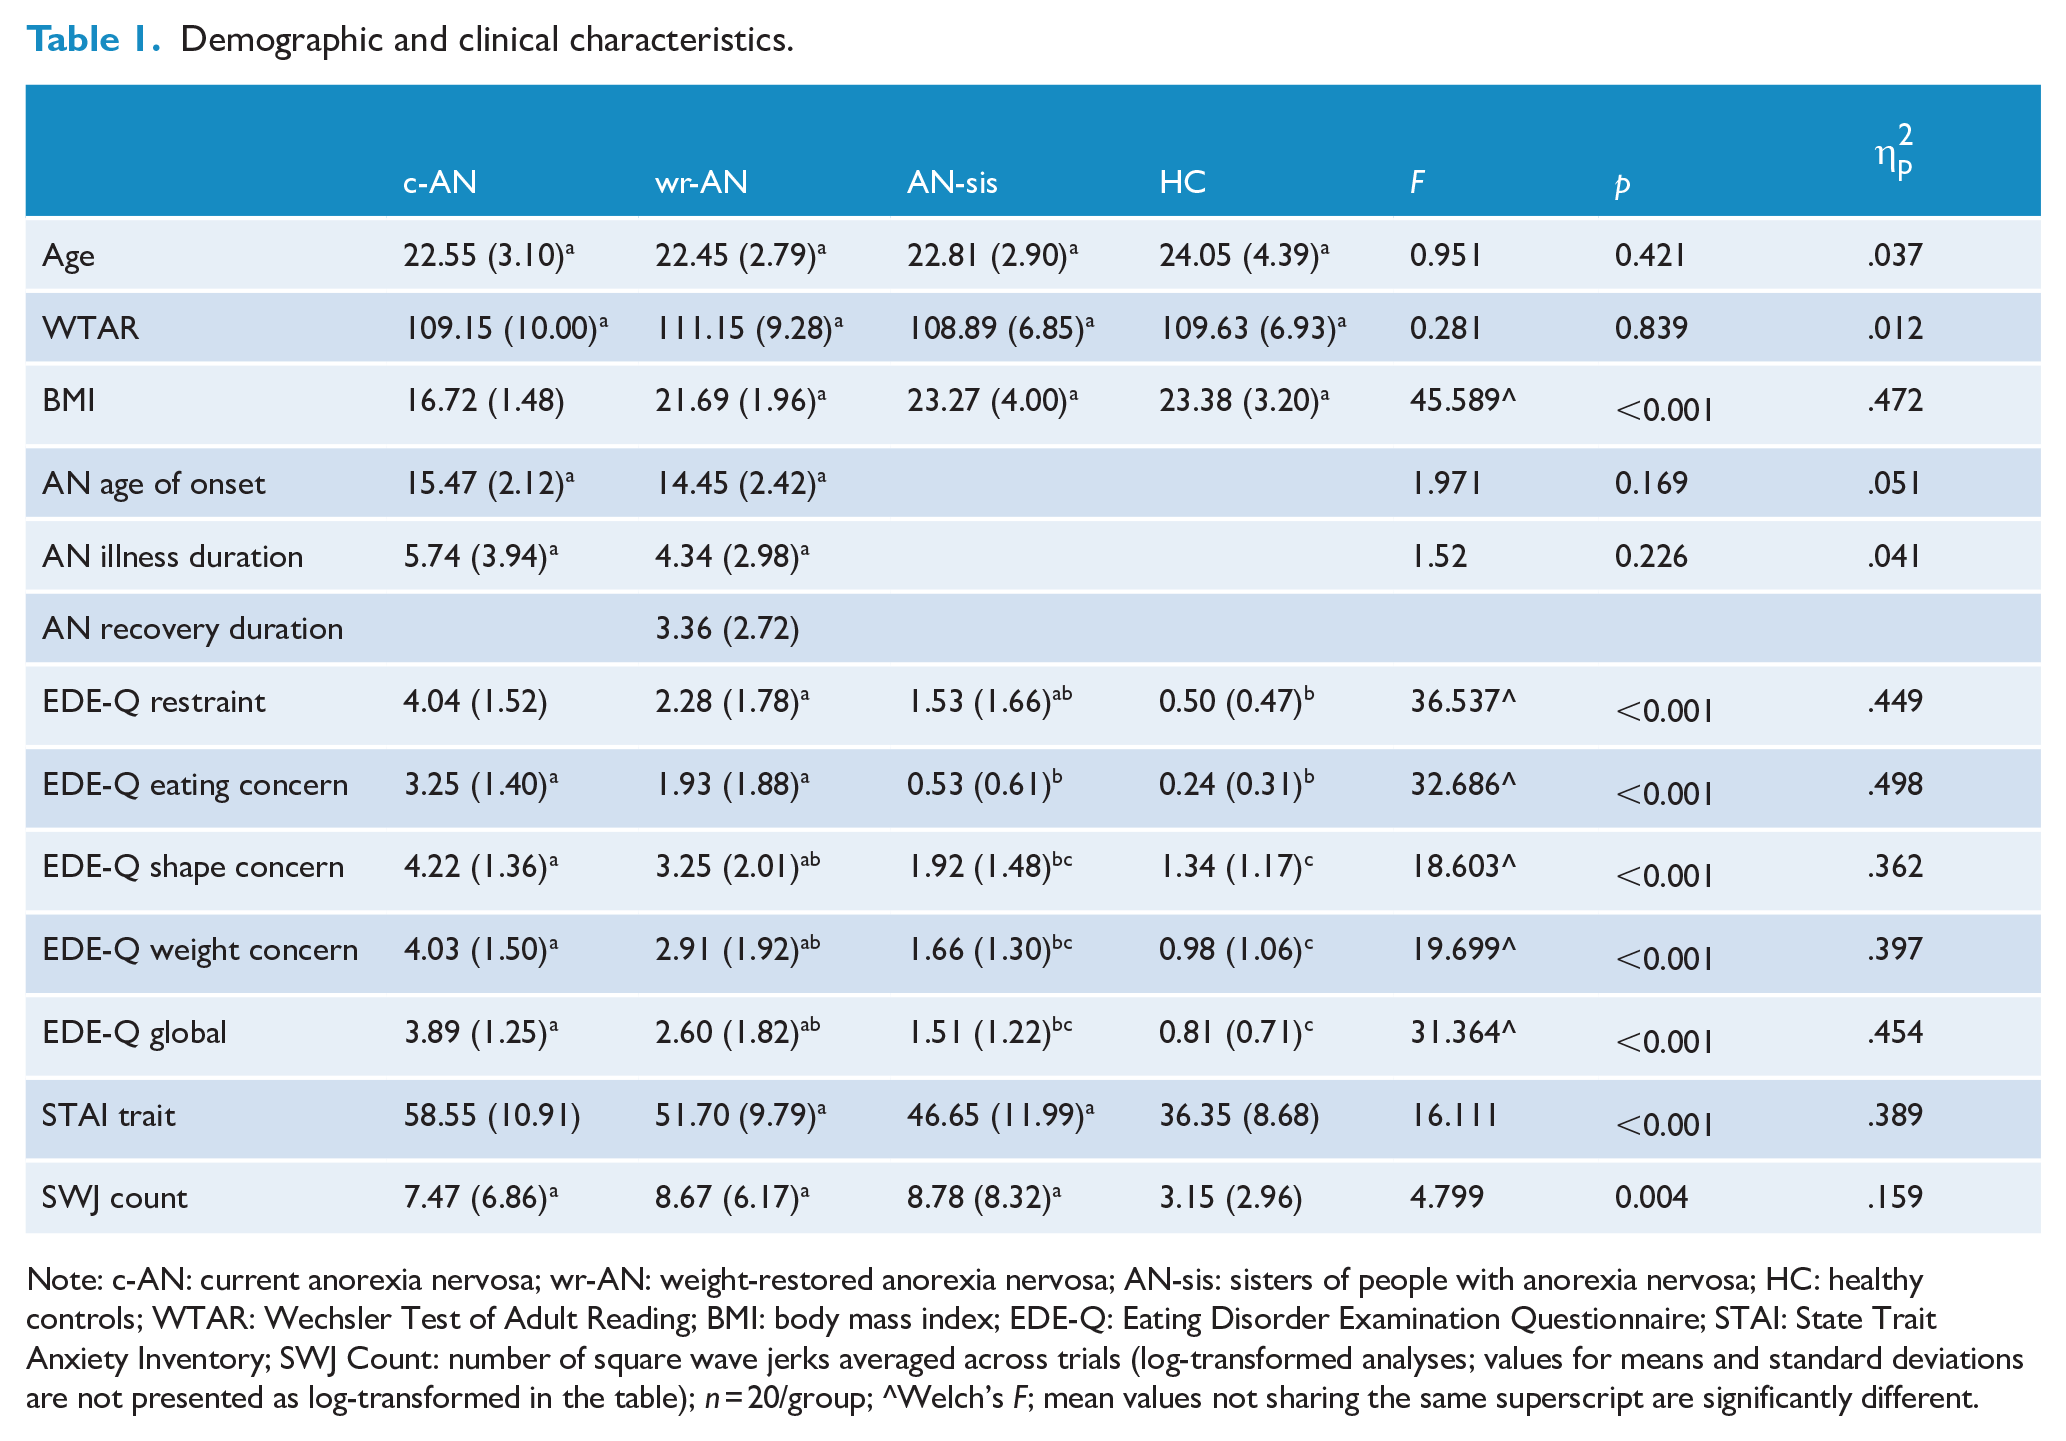
Note: c-AN: current anorexia nervosa; wr-AN: weight-restored anorexia nervosa; AN-sis: sisters of people with anorexia nervosa; HC: healthy controls; WTAR: Wechsler Test of Adult Reading; BMI: body mass index; EDE-Q: Eating Disorder Examination Questionnaire; STAI: State Trait Anxiety Inventory; SWJ Count: number of square wave jerks averaged across trials (log-transformed analyses; values for means and standard deviations are not presented as log-transformed in the table); n = 20/group; ^Welch’s F; mean values not sharing the same superscript are significantly different.
The Mini International Neuropsychiatric Interview, 5.0.0 (MINI) (Sheehan et al., 1998) was used to screen all participants for psychiatric disorders. The MINI was also used to confirm diagnoses of AN, with the exception of the amenorrhea criterion which is not included in DSM-5. AN was required to be the primary diagnosis of the AN group. c-AN, wr-AN and AN-sis participants with comorbid psychiatric conditions, other than psychotic conditions, were not excluded as this would not have represented a generalisable sample. Eating disorder symptomatology was assessed with the Eating Disorder Examination Questionnaire (EDE-Q) (Fairburn, 2008) and anxiety with the State Trait Anxiety Inventory (STAI) (Spielberger, 2010).
Data acquisition and analysis
Eyetracking task
The fixation task was administered and recorded with the EyeLink1000 Plus at 1000 Hz (SR Research, Ontario, Canada), with the use of a chinrest. A 1° black fixation cross was presented in the centre of a white screen for 1 minute. The task was completed in three blocks – that is, three 1-minute blocks – with short rests between each block. The task was analysed with a custom-made programme in MATLAB 2014a (Mathworks, Natick, MA, USA). Data were bandpass filtered between 1.5 and 60 Hz to eliminate slow baseline drift and high-frequency noise. SWJ were then identified through inspection of the filtered recordings. Threshold criteria for SWJ detection included saccade pairs occurring within 200 ms, with amplitudes ranging between 0.1° and 5° (Abadi and Gowen, 2004). SWJs were analysed using rate (count per minute) and averaged across all three trials. See Figure 1 for an example of SWJs compared to stable fixation.
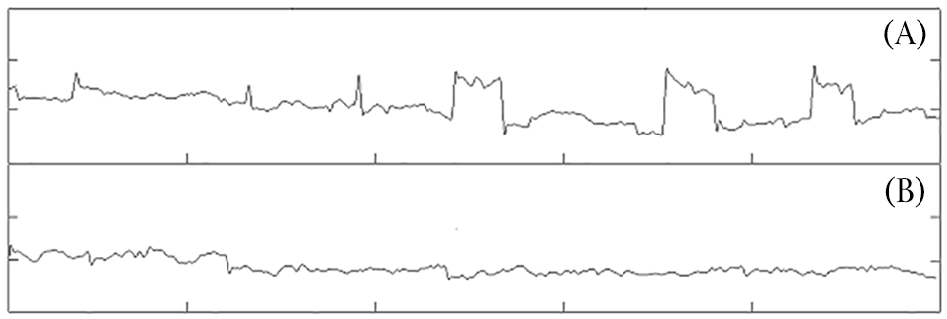
An example of square wave jerks (A) and stable fixation (B) over a 5-second eyetracking recording. Note: vertical axis is in 1° increments; horizontal axis is in 1-second increments.
Statistical analysis
Statistical analyses were performed with IBM SPSS V27. Group comparisons for demographic and clinical variables, and SWJ rate, were performed with between-groups analyses of variance (ANOVAs), with post hoc analyses completed as appropriate. The SWJ data underwent further analyses to determine utility as a potential biomarker. SWJ rate was found to correlate with trait anxiety using Pearson’s correlation analyses; and after a nominal logistic regression found significant differences between the groups, a series of binary logistic regression analyses were performed to determine the sensitivity and specificity of SWJ rate and anxiety together, for differentiating between-group pairs, with post hoc simulated power analyses conducted for each analysis (Kleinman and Horton, 2009). For SWJ rate, Tukey’s box plots revealed two outliers for each of the c-AN and wr-AN groups, and one outlier for the HC group (no outliers were identified for any group for anxiety). Rather than removing outliers, a log transformation was undertaken for SWJ rate to correct for the skewness in distributions and was included in all analyses using SWJ rate (information on outliers and normality of distributions is presented in the Supplementary Material; as are the binary logistic regressions for anxiety and SWJ rate [without a log transformation] with and without outliers removed, demonstrating consistency across analyses). The same series of binary logistic regressions were conducted for SWJ rate and anxiety separately, as well as for EDE-Q. As these analyses are not the focus of the current study (i.e. to assess SWJ rate together with anxiety as a marker), the results are provided in the Supplementary Material.
Results
Demographic characteristics and clinical data are presented in Table 1. Groups did not differ on age or premorbid intelligence; age of AN onset and illness duration did not differ between c-AN and wr-AN groups (p > .05). The c-AN group had significantly lower BMIs than the other groups (p < .001), who did not differ from one another. Groups did differ significantly from each other on each of the EDE-Q subscales, as well as the EDE-Q global score with c-AN scoring the highest, followed by wr-AN, and AN-sis and HC, who did not differ significantly from one another (p < .001). The c-AN group also scored significantly higher on the trait sub-scale of the STAI than all the other groups (Cohen’s d, p = .66, .041; 1.04, <.001; 2.24, <.001; c-AN compared to wr-AN, AN-sis and HC, respectively); the wr-AN group scored higher than HC (Cohen’s d = 1.64, p < .001) but did not differ from AN-sis (p > .05); and the AN-sis group also scored significantly higher than HCs (Cohen’s d = .97, p = .003).
A between-groups ANOVA for SWJ count revealed a statistically significant main effect of group, F(3,76) = 4.799, p = 0.004. Post hoc comparisons revealed that the c-AN, wr-AN and AN-sis groups did not differ significantly from one another (p > .05) but exhibited significantly more SWJs than HCs (Cohen’s d, p = .82, .036; 1.14, .008; .90, .007; c-AN, wr-AN and AN-sis compared to HC, respectively) (see Table 1). Results from two one-sided tests (TOST) of equivalence (equivalence bounds set at ±1.14) indicated that c-AN, wr-AN and AN-sis groups were equivalent to one another for SWJ rate (all p > .05).
Pearson’s correlation analyses between SWJ count and STAI trait anxiety revealed a significant negative correlation in the c-AN group (r = −0.604, p = 0.005), and a trend towards a positive correlation in the wr-AN group (r = 0.410, p = 0.072; see Figure 2). Significant correlations between SWJ count and STAI trait anxiety were not found for AN-sis (r = −0.207, p = 0.380) or HC (r = −0.039, p = 0.871) groups.
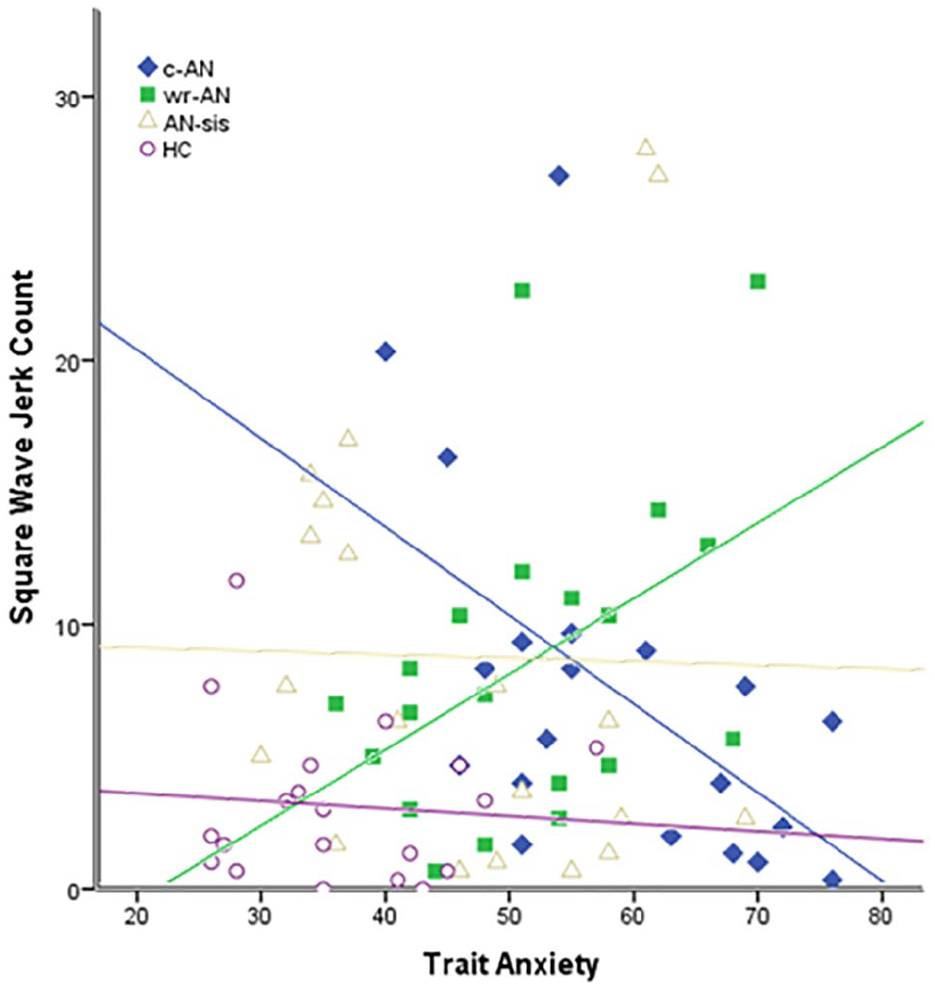
Relationship between trait anxiety and square wave jerk count for current anorexia nervosa (c-AN; r = −0.604, p = 0.005), weight-restored anorexia nervosa (wr-AN; r = 0.410, p = 0.072), sisters of people with anorexia nervosa (AN-sis; r = −0.207, p = 0.380) and healthy control (HC; r = −0.039, p = 0.871) groups.
A nominal logistic regression including SWJs and anxiety identified significant differences between the four groups, χ2(6) = 53.643, p < 0.001. A series of binary logistic regression analyses were then conducted to determine the sensitivity and specificity of anxiety for differentiating between pairs of groups, using a 0.5 estimated probability of group membership as a cut-point. Table 2 presents the results of these models, while Figure 3 presents the relationship between SWJ count and trait anxiety for each regression model.
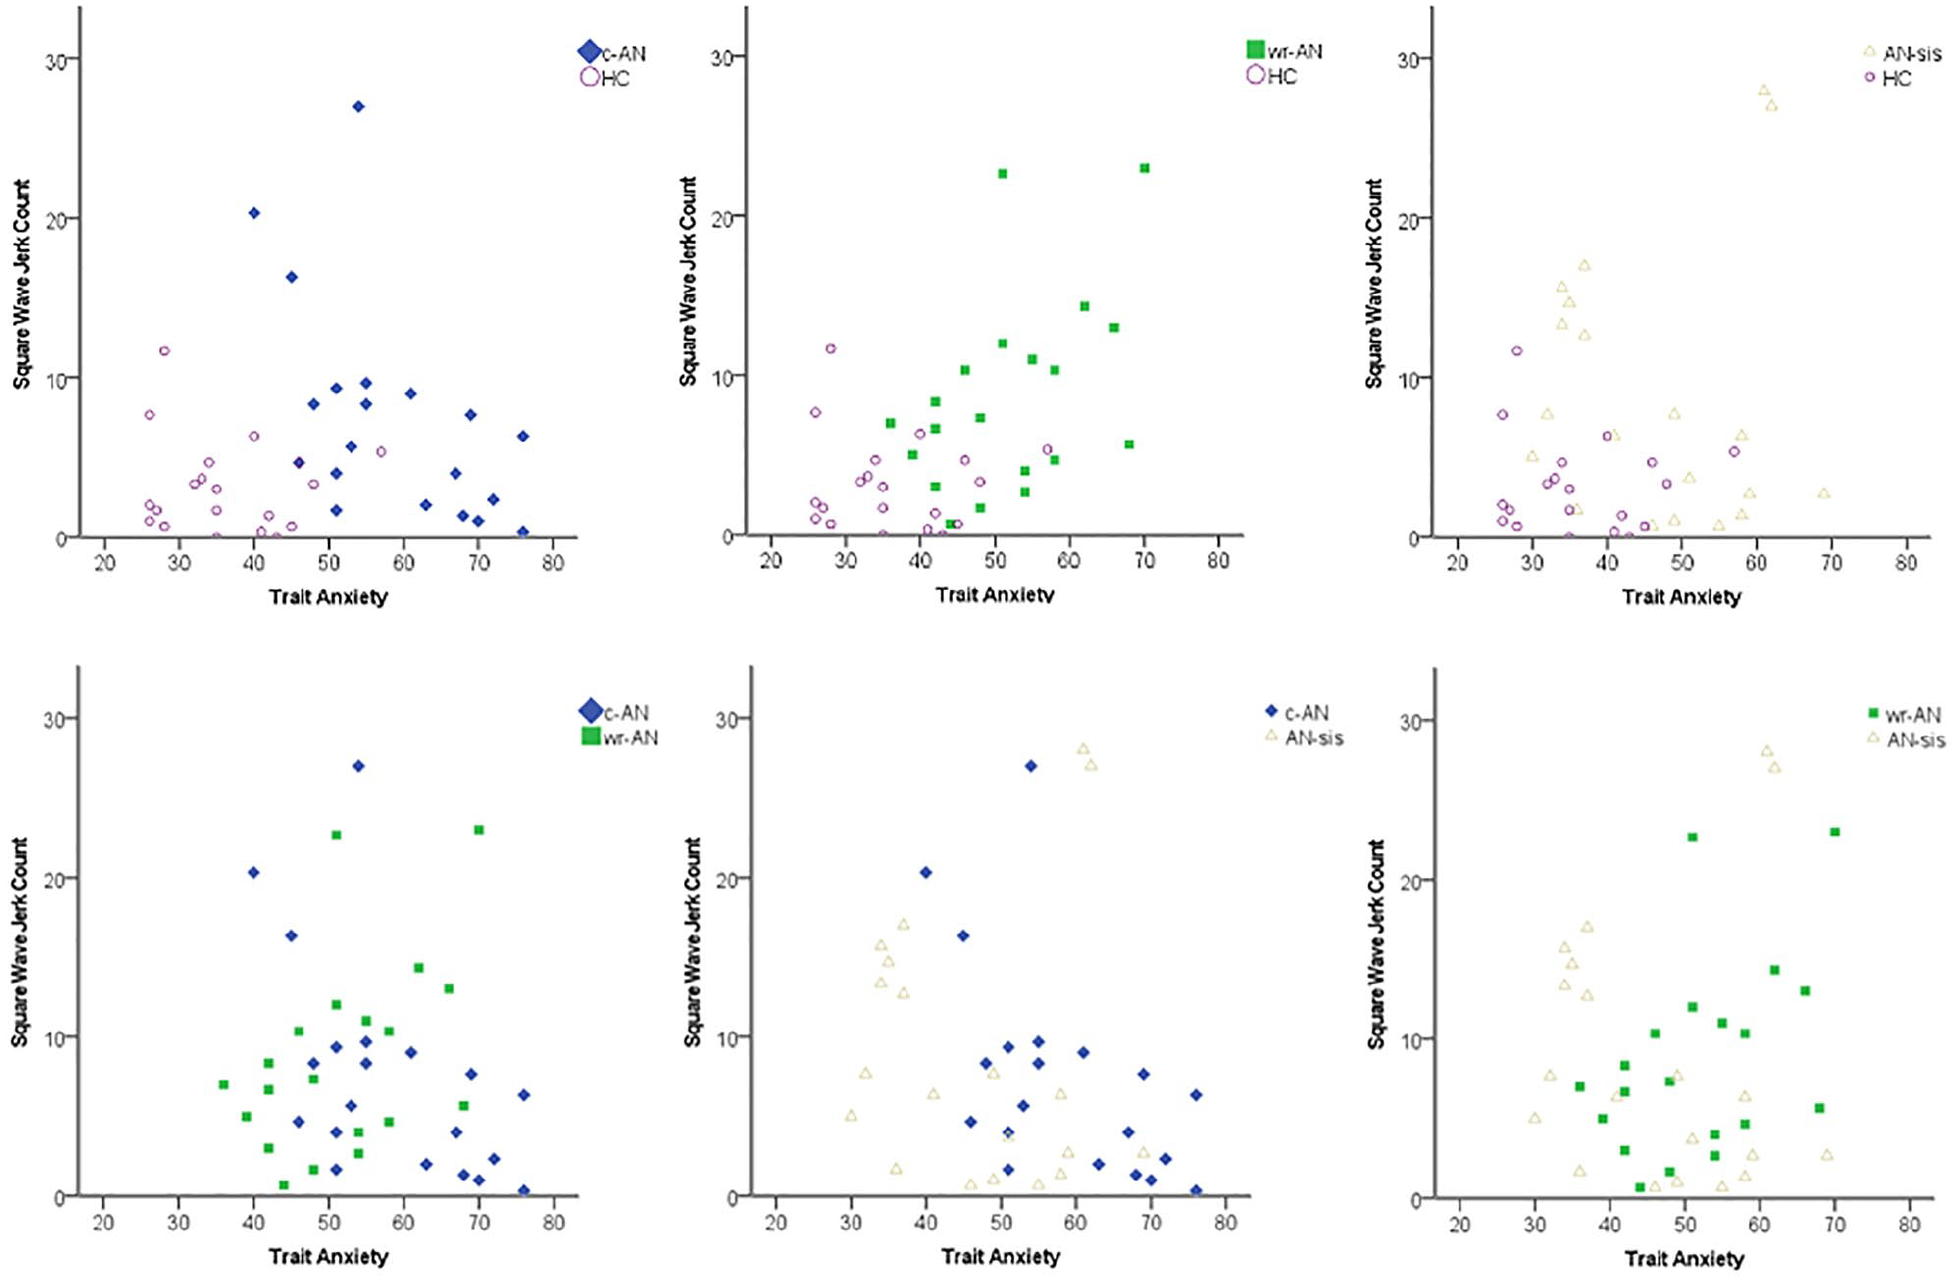
Relationship between trait anxiety and square wave jerk count for current anorexia nervosa (c-AN), weight-restored anorexia nervosa (wr-AN), sisters of people with anorexia nervosa (AN-sis) and healthy control (HC) groups. Series of binary logistic regression analyses. c-AN vs HC: χ2(2) = 39.758, p < 0.001; wr-AN vs HC: χ2(2) = 26.105, p < 0.001; AN-sis vs HC: χ2(2) = 17.755, p < 0.001; c-AN vs wr-AN: (χ2(2) = 4.652, p = 0.098; c-AN vs AN-sis: χ2(2) = 10.528, p = 0.005; wr-AN vs AN-sis: χ2(2) = 2.474, p = 0.290.
Binary logistic regressions discriminating between group pairs.
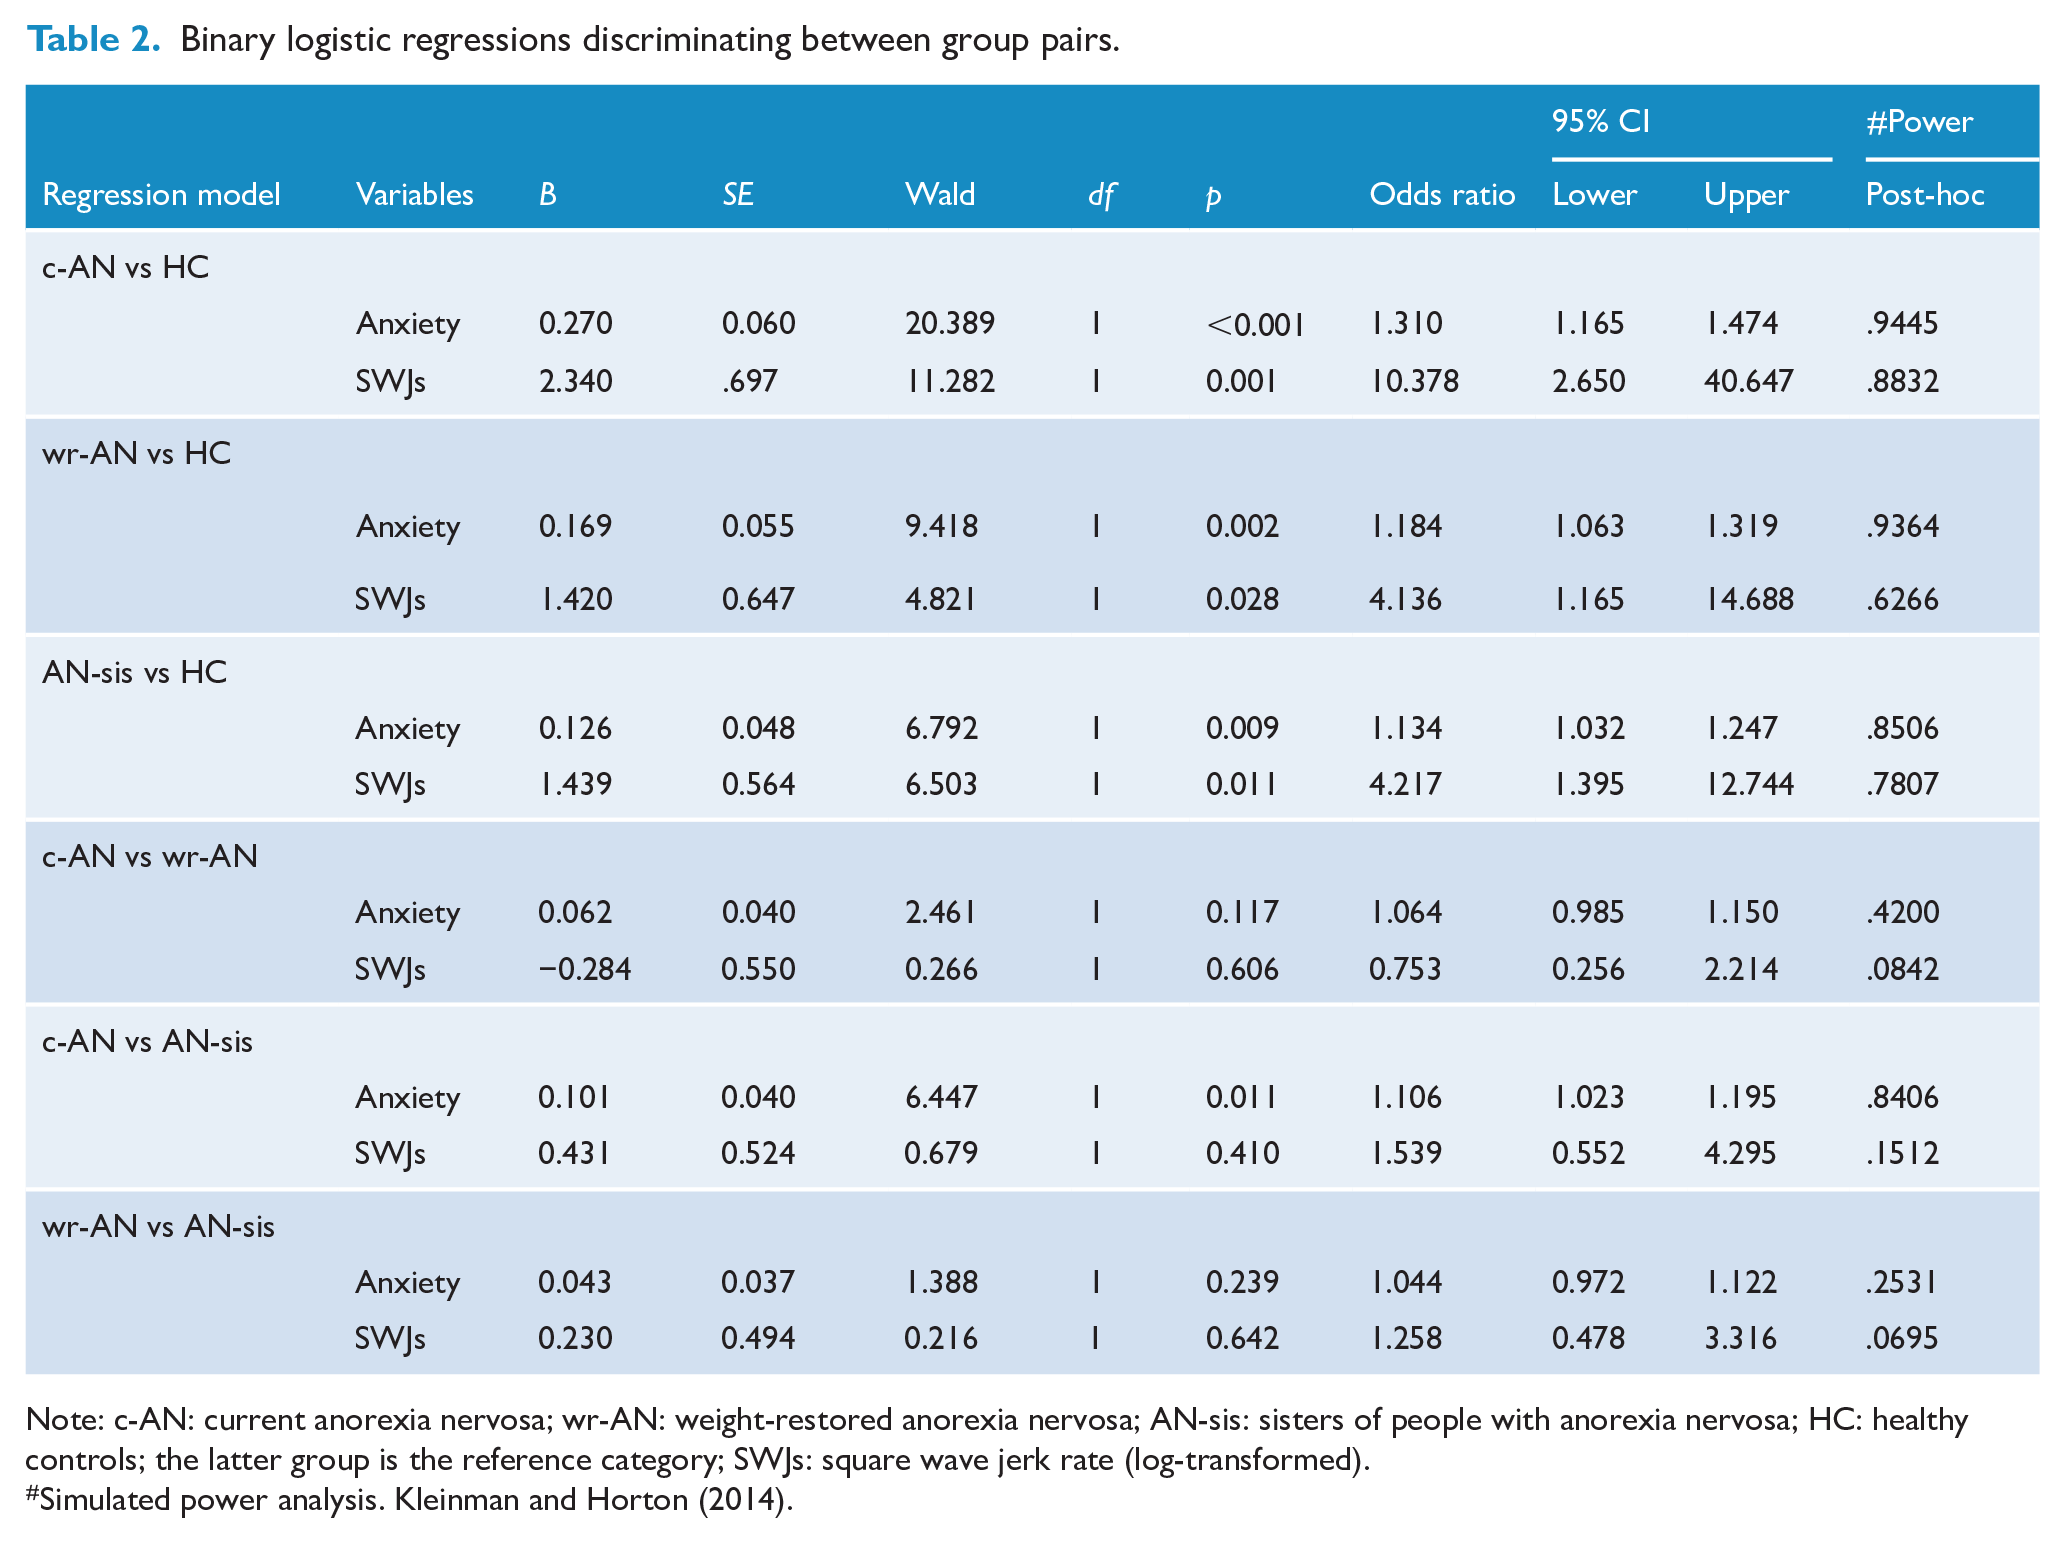
Note: c-AN: current anorexia nervosa; wr-AN: weight-restored anorexia nervosa; AN-sis: sisters of people with anorexia nervosa; HC: healthy controls; the latter group is the reference category; SWJs: square wave jerk rate (log-transformed).
Simulated power analysis. Kleinman and Horton (2014).
When the c-AN and HC groups were considered, the model was statistically significant, χ2(2) = 39.758, p < 0.001, and differentiated significantly between c-AN and HC groups with odds ratios of 1.31 and 10.38 for anxiety and SWJs, respectively. SWJs and trait anxiety correctly classified 92.5% of the sample, with 90% sensitivity and 95% specificity. A receiver operating characteristic (ROC) curve analysis resulted in a value of 0.97 as the area under the curve (confidence interval [CI] = 0.92–1.00), indicating that the model was ‘excellent’ at separating c-AN from HC participants.
The model fitted for the wr-AN and HC groups was also statistically significant, χ2(2) = 26.105, p < 0.001, and correctly classified 77.5% of the sample, with 75% sensitivity and 80% specificity. Anxiety was associated with an odds ratio of 1.18, and SWJs with 4.14 when the wr-AN group was compared with the HC group. The area under the curve was 0.92 (CI = 0.84–1.00) demonstrating that the model was ‘excellent’ at differentiating wr-AN from HCs.
The model including the AN-sis and HC groups was also statistically significant, χ2(2) = 17.755, p < 0.001, correctly classifying 77.5% of the sample, with 75% sensitivity and 80% specificity. The odds ratio for anxiety was 1.13, with 4.22 for SWJs when the AN-sis group was compared with the HC group. The area under the curve was 0.86 (CI = 0.74–0.97), indicating that the model was bordering on ‘excellent’ at discriminating AN-sis from HCs.
The model fitted using the c-AN and AN-sis groups was also significant, χ2(2) = 10.528, p = 0.005, correctly classifying 70% of the sample, with 70% sensitivity and 70% specificity. However, only trait anxiety made a unique statistically significant contribution to this model with an odds ratio of 1.11 when the c-AN group was compared with the AN-sis group, whereas SWJs did not contribute significantly. The area under the curve was 0.78 (CI = 0.63–0.93), indicating that the model was ‘fair’ at discriminating between c-AN and AN-sis participants.
The models fitted using the c-AN and wr-AN groups, χ2(2) = 4.652, p = .098; ROC area = 0.67, CI = 0.50–0.84, and wr-AN and AN-sis groups, χ2(2) = 2.474, p = .290; ROC area = 0.65, CI = 0.47–0.82, were not significant and these groups could not be discriminated from one another.
Discussion
The results of this study supported our previous work demonstrating that c-AN shows a higher rate of SWJs than HCs – with comparable results to our previous work (Phillipou et al., 2014). This study extends our previous work, showing that both wr-AN and AN-sis groups also showed an increased rate of SWJs compared to HCs. Indeed, SWJ rate was similar among c-AN, wr-AN and AN-sis groups; all groups showed an increased SWJ rate relative to HCs. Furthermore, and similarly to our prior work that used state anxiety, SWJ rate and trait anxiety negatively correlated with one another for the c-AN group (but not the HC group), and discriminated c-AN and HC groups in this sample with exceptionally high accuracy (92.5%). A correlation was also found for the wr-AN group (trend), but SWJ rate and trait anxiety were positively correlated with one another. The wr-AN group could also be discriminated from the HC group with very high accuracy (77.5%) using these two variables simultaneously. Although SWJ rate and trait anxiety did not significantly correlate with one another for the AN-sis group, they still correctly classified AN-sis from HCs with 77.5% accuracy. However, SWJ rate and trait anxiety could not differentiate between c-AN and wr-AN participants, or between wr-AN and AN-sis participants. c-AN participants could also not be differentiated from AN-sis participants based on SWJ and trait anxiety together.
Together, these findings indicate that SWJ rate together with trait anxiety may represent a potential biomarker, as well as an endophenotype for AN. Biomarkers and endophenotypes are interrelated concepts but with slight variations in their definitions (Malcolm and Phillipou, 2021). While both biomarkers and endophenotypes must show an association with the illness, biomarkers must also show adequate sensitivity and specificity for detecting the illness (Brower, 2011; Woo and Wager, 2015); this has been demonstrated in this study between the c-AN and HC groups, but SWJ rate and anxiety did not differentiate AN groups from AN-sis. Endophenotype criteria, on the other hand, are related to heritability and specify that state independence and presence in non-affected family members must be present (Gottesman and Gould, 2003); both of which are also present in this study given the lack of discrimination between c-AN and wr-AN groups, and the similarities between AN-sis and the two AN groups. However, further research is required to determine the genetic mechanisms potentially underlying this marker to establish it as an endophenotype. A further biomarker criterion includes test–retest reliability across time and different settings (Gershon and Goldin, 1986; Gottesman and Gould, 2003; Malcolm and Phillipou, 2021; Woo and Wager, 2015), which also requires further investigation. The results of the study therefore provide evidence that SWJ-trait anxiety may not only act as a promising biomarker for AN but may also represent an endophenotype for the illness; however, further research is required to establish this.
Our SWJs data implicate specific brain regions and neurotransmitter systems in the development of AN; specifically, the superior colliculus and gamma-aminobutyric acid (GABA) pathways, through their role in the inhibition and initiation of these types of eye movements (Hikosaka and Wurtz, 1985; Munoz and Wurtz, 1993). Consistent with this premise, GABA deficits are also associated with anxiety (Nemeroff, 2003), therefore providing further rationale for the involvement of GABA in mediating this SWJ-anxiety marker. Individuals currently with AN showed a negative relationship between SWJ rate and anxiety, while individuals weight-restored from AN showed a positive relationship, suggesting an interaction effect. Although the interpretation of these finding is unclear, it may reflect a complex relationship between GABA levels, anxiety, SWJs, BMI and/or eating disorder symptomatology – including the short- and long-term effects of starvation on the brain (Phillipou et al., 2018e).
Additional inhibitory eye movement deficits reported in preliminary AN studies provide further support for GABA dysfunction, specifically in the superior colliculus, in AN (Phillipou et al., 2016b). These include (1) hyperscanning of scenes (i.e. increased fixations of shorter duration) (Phillipou et al., 2015, 2016c); (2) shorter prosaccade latencies (i.e. faster eye movement to peripherally presented stimuli) (Phillipou et al., 2016d); and (3) increased inhibitory errors to 10° targets on a memory-guided saccade task (i.e. an eye movement to a briefly presented peripheral stimulus when required to maintain fixation on a central stimulus) (Phillipou et al., 2016d, 2020). Furthermore, MRI findings have reported both functional (i.e. resting state functional connectivity) and structural (i.e. grey and white matter) deficits of the superior colliculus and connected regions in AN (Phillipou et al., 2016a, 2018a, 2018b, 2018f, 2019). Deficits in the superior colliculus are also of interest to AN given the region’s interactions with higher-order cortical areas and its role in multisensory integration (McFadyen et al., 2020; Meredith and Stein, 1986), which may contribute to deficits in body image perception; specifically, discrepancies in how large the body is felt and seen in AN (Phillipou et al., 2016c). The role of both GABA and the superior colliculus in relation to these eye movement deficits and the proposed marker specifically is, however, speculative and requires specific investigation.
This study has a number of strengths. First, we improved upon our previous research methodology by focusing on trait rather than state anxiety, as well as recording participants over 3 minutes rather than a single 1-minute recording; strengthening the reliability of the eye movement recordings. The study was also strengthened by the inclusion of both wr-AN and AN-sis groups, allowing for state independence and heritability to be examined. Further research would, however, benefit from an even larger sample size (though, the sample was large compared to similar studies), undertaking the assessments across two time points to assess test–retest reliability, and identifying how the results directly relate to neuroimaging findings such as GABA levels in the superior colliculus, as well as underlying genetic mechanisms involved in the illness.
Overall, this study provides evidence for the use of SWJ rate and trait anxiety together as a potential biomarker and endophenotype for AN. With further research, this marker may have the potential to be used to identify people at risk of developing AN, as well as for early intervention. Given the nature of the biomarker, it also shows promise in identifying the neurobiological underpinnings of AN, thereby providing potential targets for treatment with further research.
Supplemental Material
sj-docx-1-anp-10.1177_00048674211047189 – Supplemental material for A biomarker and endophenotype for anorexia nervosa?
Supplemental material, sj-docx-1-anp-10.1177_00048674211047189 for A biomarker and endophenotype for anorexia nervosa? by Andrea Phillipou, Susan L Rossell, Caroline Gurvich, David J Castle, Denny Meyer and Larry A Abel in Australian & New Zealand Journal of Psychiatry
Footnotes
Acknowledgements
The authors would like to thank all of the participants who took the time to participate in the study.
Data Availability Statement
Data are available upon reasonable request from the corresponding author.
Declaration of Conflicting Interests
The authors declared no potential conflicts of interest with respect to the research, authorship and/or publication of this article.
Funding
The author(s) disclosed receipt of the following financial support for the research, authorship, and/or publication of this article: This research was supported by the St Vincent’s Hospital Research Endowment Fund and the Barbara Dicker Brain Sciences Foundation. A.P. is supported by a National Health and Medical Research Council (NHMRC) Project Grant (CIA: GNT1159953). S.L.R. holds an NHMRC Senior Research Fellowship (GNT1154651).
Supplemental Material
Supplemental material for this article is available online.