
Abstract
Objective:
The Health of the Nation Outcome Scales was developed as an overall measure of mental health, applicable to the complete range of psychiatric disorders. Meanwhile, it is a benchmark tool for service providers and is also used for the allocation of costs and funding. The ability of the Health of the Nation Outcome Scales to assess and differentiate the severity of psychiatric disorders is largely unknown, as it is the interpretation of a change in score. We aim to establish Health of the Nation Outcome Scales cut-off and benchmark values for severity and improvement – respectively change, using equipercentile linking to the Clinical Global Impression scales.
Methods:
In a clinical sample of 30,616 individuals with a psychiatric disorder, we used a multivariate regression analysis to determine the correlation between the scales and possible confounders. We used an equipercentile linking analysis of the Clinical Global Impressions severity scale with the Health of the Nation Outcome Scales sum score to establish cut-off values for severity. The linking of the Health of the Nation Outcome Scales sum score difference and the percentage of change to the Clinical Global Impression improvement scale determined benchmark values for change (i.e. improvement or deterioration).
Results:
The Health of the Nation Outcome Scales and Clinical Global Impression scales showed a Spearman correlation of 0.38 (p < 0.000). Clinical Global Impression–Severity: ‘borderline-ill’ corresponded to Health of the Nation Outcome Scales score 3–5; ‘mildly ill’ to 6–10; ‘moderately ill’ to 11–16; ‘markedly ill’ to 17–25; ‘severely ill’ to 26–35; and ‘extremely ill’ to a score ⩾36. The Spearman correlation between the percentage change of the Health of the Nation Outcome Scales was 0.39 (p > 0.000); Clinical Global Impression–Improvement: ‘minimally improved’ corresponded to Health of the Nation Outcome Scales reduction of 4 points or 9%; ‘much-improved’ to 12 points or 48%; ‘very-much-improved’ to ⩾20 points or ⩾90%. Clinical Global Impression–Improvement: ‘minimally worse’ corresponded to an increase of 6 points or 25%; ‘much-worse’ to 12 points or 54%; and finally, ‘very-much-worse’ to >18 points or ⩾82%.
Conclusion:
Our results allow for the comparison of severity and response to treatment of patients with a psychiatric disorder, independent of diagnosis.
Keywords
Introduction
The Health of the Nation Outcome Scales (HoNOS) was developed nearly 25 years ago; with the aim of providing a brief, accurate and relevant measure of overall mental health and social functioning; which would be applicable to the complete range of psychiatric disorders (Wing et al., 1994, 1996). Since its first publication, the psychometric properties and the performance of the HoNOS have been the object of continuous study, demonstrating both good reliability and validity, as well as clinical utility (James et al., 2018; Theodoridou et al., 2011). As a result, it has become a well-established measurement instrument and is primarily used to assess the outcome of psychiatric treatment (Delaffon et al., 2018; James et al., 2018). In the meantime, it is available in several languages (Delaffon et al., 2018; Harris et al., 2018), and in some countries, the HoNOS is a mandatory outcome measure (Delaffon et al., 2018; Speak et al., 2015).
Despite a large number of publications and the profound implications of its use, the ability of the HoNOS to assess and differentiate the severity of psychiatric disorders is still unchartered (Harris et al., 2018). This is attributable to several factors, mainly the methodological and statistical intricacy of comparing heterogeneous groups across multiple domains (Gift et al., 1980; Zimmerman et al., 2018). The interpretation of change in the HoNOS sum score can be arduous, due to the construction of the scale, where each item measures a separate issue (Boon et al., 2019; Egger et al., 2015; Harris et al., 2018; Parabiaghi et al., 2014). Clinical change may, therefore, be captured by a single item, with sub-threshold changes in other items potentially cancelling this out (MacDonald, 2009).
Like the HoNOS, the Clinical Global Impression (CGI) Scales were developed as ‘universal’ measurement instruments (Guy, 1976). They are easy to use and intuitively understood, therefore widely used in research and clinical practice (Berk et al., 2008; Busner and Targum, 2007). The CGI scales extract the raters’ judgement on the severity of illness of a given subject, considering the raters’ clinical experience within the particular diagnosis (Guy, 1976). The CGI scales serve as a reference for the definition of boundaries and cut-off values for several other psychometric instruments (Egger et al., 2019; Leucht et al., 2005, 2006).
We consider that staging of severity and change are crucial aspects for the further use and interpretation of the HoNOS. Therefore, using equipercentile linking analysis of the HoNOS to the CGI scales, we aim to develop HoNOS cut-off scores for severity from one single measurement and benchmark values for change in severity (i.e. improvement or deterioration) whenever two HoNOS measurements are available.
Methods
Sample and procedure
The Department of Psychiatry, Psychotherapy and Psychosomatics as part of the Psychiatric University Hospital of Zurich is responsible for the treatment of adult patients (aged 18–65) in the city of Zurich and its surroundings, with a catchment area of approximately 500,000 inhabitants. For each admission (and discharge), a series of psychometric measures to assess severity and need for treatment is mandatory. We used data from a full 6-year (2013–2018) cohort of consecutive admissions for treatment at our department; only patients admitted and discharged in the study period were considered.
Ethical considerations
The data collection is part of the routine quality control and clinical care procedures; accordingly, previous trial registration is therefore not required. At the time of data collection, no specific written informed consent was obtained from patients. Following current ethical standards and in compliance with current legislation, a protocol and data analysis plan were submitted to the competent Authorities. The Ethics Committee of the Canton of Zurich authorised the further use of the anonymised data for research and publication purposes (BASEC: 2018-01906).
Diagnosis and diagnostic groups
Psychiatric diagnoses were made according to the International Classification of Diseases, 10th edition (ICD-10) (World Health Organization (WHO), 1992) criteria by the clinician responsible for treatment and were confirmed by a senior psychiatrist. The diagnoses of the sample were divided into 16 diagnostic categories according to the ICD-10 classification: dementia (DEM) (ICD-10: F00-F03); neurocognitive disorders (NCD) (ICD-10: F0X; the ‘X’ denotes the remaining diagnostic codes in the respective category); alcohol use disorders (AUD) (ICD-10: F10); substance use disorders (SUD) (ICD-10: F11-F19); schizophrenia (SZP) (ICD-10: F20); transient psychotic disorder (TPD) (ICD-10: F23); schizoaffective disorder (SZA) (ICD-10: F25); schizophrenia spectrum disorder (SZS) (ICD-10: F2X); bipolar disorder (BPD) (ICD10: F30-F31); major depressive disorder (MDD) (ICD-10: F32); stress-response disorders (SRD) (ICD-10: F43); somatoform and dissociative disorders (SDD) (ICD-10: F44-F45); anxiety disorders (AXD) (ICD-10: F4X); body image disorders (BID) (ICD-10: F5); personality disorders (PPD) (ICD-10: F6) and neurodevelopmental disorders (NDD) (ICD-10: F7-F9). The diagnostic clustering was aimed to have diagnostic homogeneous groups, with a large enough sub-sample size.
Rating scales
The CGI scales (Guy, 1976) are widespread in research and clinical practice. They are brief, easy to use and pragmatic measurement tools applicable to the entire spectrum of psychiatric disorders. The CGI consists of three subscales: (1) Severity of Illness (CGI-S), (2) Global Improvement (CGI-I) and (3) Efficacy Index (CGI-E); the latter will not be used for the current analyses. CGI-S and CGI-I have a 7-point Likert-type scale response format. The CGI-S ranges from 1 representing ‘normal’ to 7 ‘extremely ill’. The CGI-I ranges from 1 ‘very much improved’ to 7 ‘very much worse’, whereby a score of 4 indicates no change. Ratings of CGI-S refer to the past week and ratings of CGI-I to the time elapsed since a previous (or first) CGI-S assessment.
The HoNOS is an observer-rated scale to assess the severity of a psychiatric disorder (Wing et al., 1994, 1996). It consists of 12 items: (1) ‘Overactive, aggressive, disruptive or agitated behaviour’, (2) ‘Non-accidental self-injury’, (3) ‘Problem-drinking or drug-taking’, (4) Cognitive problems’, (5) ‘Physical illness or disability problems’, (6) ‘Problems associated with hallucinations and delusions’, (7) ‘Problems with depressed mood’, (8) ‘Other mental and behavioural problems’ (including phobic; anxiety; obsessive-compulsive; mental strain/tension; dissociative; somatoform; eating; sleep; sexual and other), (9) ‘Problems with relationships’, (10) ‘Problems with activities of daily living’, (11) ‘Problems with living conditions’ and (12) ‘Problems with occupation and activities’. Each item is rated on a 5-point Likert-type scale from 0 ‘no problem’ to 4 ‘severe to very severe problem’ (Wing et al., 1998, 1999).
The HoNOS has four predefined dimensions: ‘behaviour’, ‘impairment’, ‘symptoms’ and ‘social problems’. Evaluation can occur on an item, a subscale and total score (Wing et al., 1998, 1999). The usual observation period embraces 14 days. However, analogous to the CGI scales, we also used a 7-day observation period for the HoNOS. Previous findings suggest that a reduction in the observation time frame does not confound the evaluation (Luo et al., 2016). Since its original publication, the scales have undergone a subtle review (James et al., 2018). For this study, we used the German HoNOS translation (Andreas et al., 2007).
Raters and rating
Raters were clinicians: psychiatrists, psychiatry residents or clinical psychologists. Training in the use and objectives of the measurement instruments was conducted in workshops, following to a standard schedule using examples and case vignettes. Trainers were available for consultation, as well as regular refresher sessions. Relevant information for the rating derives from clinical interview and behavioural observation, together with information provided by nursing staff, social workers and significant others. All measures were rated retrospectively for the 7 days prior to the assessment; measurements at admission were conducted within the first 72 hours; measurements at discharge on the day of discharge, at the latest 1-week post-discharge.
Statistical analyses
The analysis included only subjects with complete CGI and HoNOS data sets at baseline and discharge; HoNOS with three or more missing items were considered incomplete (Harris et al., 2018; James et al., 2018). To avoid an overlap of the time frame of evaluation, for the analysis of change, we excluded patients discharged the first week after admission. Demographic and clinical characteristics of the whole sample use descriptive statistics.
To begin with we conducted a multiple regression analysis to determine the correlation between the scales used for equipercentile analysis (CGI and HoNOS) and demographics (gender, age, education and marital status) together with clinical variables (primary diagnosis). Spearman’s rank coefficient determines the pairwise correlations between both scales. Agreement between measurement instruments, was assessed using the visual inspection method of a Bland–Altman plot analysis (Bland and Altman, 1986); of the mean differences and the 95% agreement interval (Giavarina, 2015).
Finally, we performed an equipercentile linking analysis to compare the HONOS with the CGI scales. Equipercentile linking is a non-parametric method where corresponding cut-off points on two different scales are determined, by identifying scores on both measures which have the same percentile rank (González and Wiberg, 2017). It does not require a specific distribution type and allows for possible measurement errors on both scales; for this reason, it is considered the preferred linking method (Wee et al., 2018).
In the first stage, the distribution of the scales of interest was generated; subsequently the distributions were log-linear smoothed, using the Kernel smoothing method for mixed data types, whereby the variables were ‘polished’ using observations close to a shifting target (González and Wiberg, 2017; Hastie et al., 2009). After smoothing, the corresponding percentiles of the scales were matched pairwise in the following manner: the CGI-S to the HoNOS sum score, with a CGI-S score of 0 (‘Normal’) and an HoNOS sum score of zero (‘0’) as anchor scores. The CGI-I score of 4 (‘no change’) anchored to the HoNOS difference score and the percentage change of zero (‘0’).
In a post hoc analysis; variables found to have a statistically significance interaction in the multivariate analysis will be manually removed using a leave-one-out method. The influence of the variables on both the Spearman rank correlation and the equipercentile analysis was recorded. A chi-square goodness-of-fit analysis compares the original CGI scales classification with the severity and change categories derived from the HoNOS cut-off scores and benchmark values.
The statistical software R (v4.0.2) was used for analysis; for multivariate regression with the package ‘np’ (v0.60-9) and for equipercentile calculations with the package ‘equate’ (v2.0.7).
Results
For the analysis, we collected data from 31,759 patients admitted for treatment at our department over a 6-year period (2013–2018). After removing 1143 (3.60%) patients due to incomplete diagnosis, CGI or HoNOS items, the sample size for analysis included 30,616 patients. The mean age was 45.10 ± 17.39 years, with 47.15% of females, 55.85% were single, 17.64% were married, 20.63% were either separated or divorced, and 4.02% were widowed. 22.99% had completed regular education, 34.52% had completed an apprenticeship and 14.95% had a college or university degree. 87.63% were either native speakers or spoke fluent German. The majority of admissions were voluntary (72.05%), with 27.50% compulsory admissions. The mean length of stay was 27.52 ± 28.47, with a right skew distribution and a median length of stay of 19 days.
Main diagnostic groups are MDD (5975, 19.52%), AUD (5414, 17.68%), SZP (4804, 15.69%), SRD (3029, 9.89) and PPD (2250, 7.35%) accounting together for over two thirds of patients. The remaining diagnostic groups are distributed as follows: SUD (1926, 6.29%), BPD (1461, 4.77%), SZA (1378, 4.50%), DEM (1069; 3.49%), NCD (924, 3.02%), TPD (748; 2.44%), AXD (560. 1.83%), NDD (411, 1.34%), SZS (406, 1.33%), SFD (175, 0.57%) and BID (86; 0.28%). Further demographic and clinical characteristics of the sample are summarised in Table 1 and Figure 1. There was no statistical difference regarding demographic characteristics between the sample included for analysis and patients excluded due to missing items (data not shown).
Demographic and clinical characteristics of the sample population.
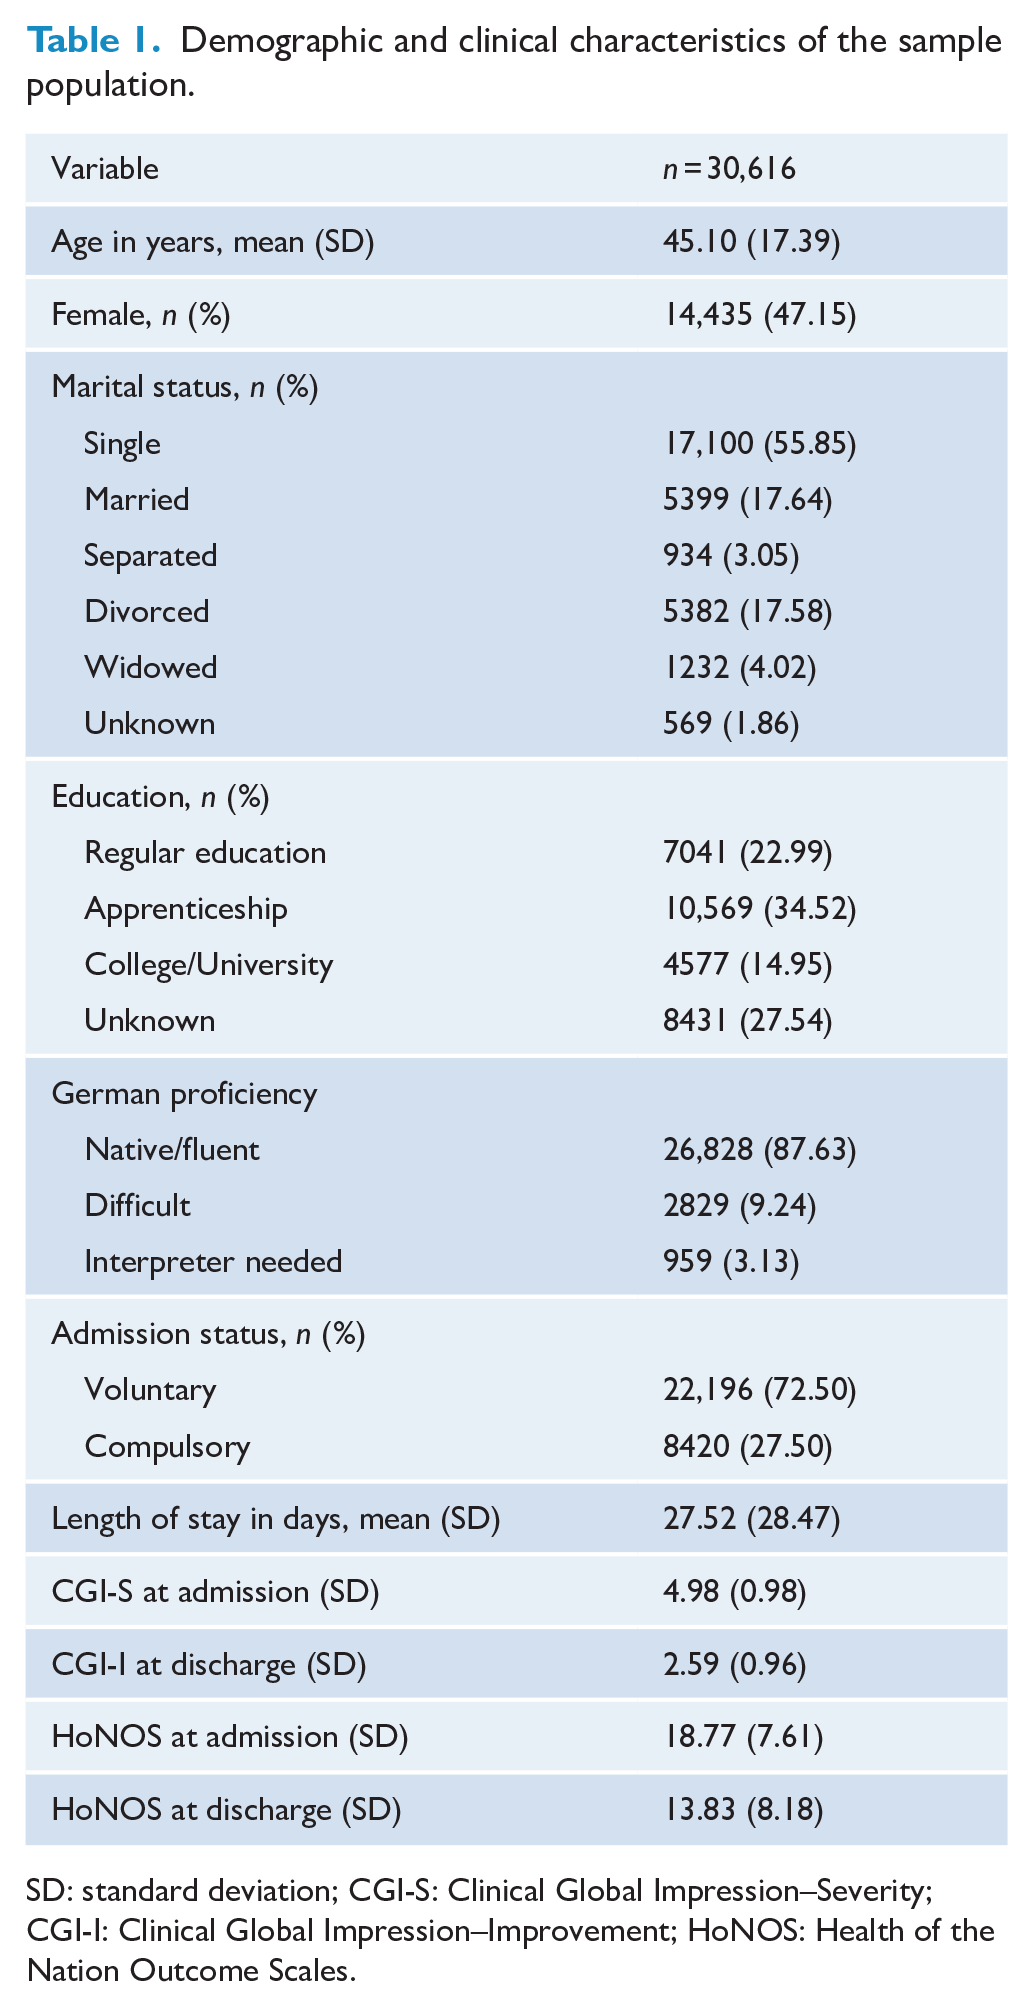
SD: standard deviation; CGI-S: Clinical Global Impression–Severity; CGI-I: Clinical Global Impression–Improvement; HoNOS: Health of the Nation Outcome Scales.
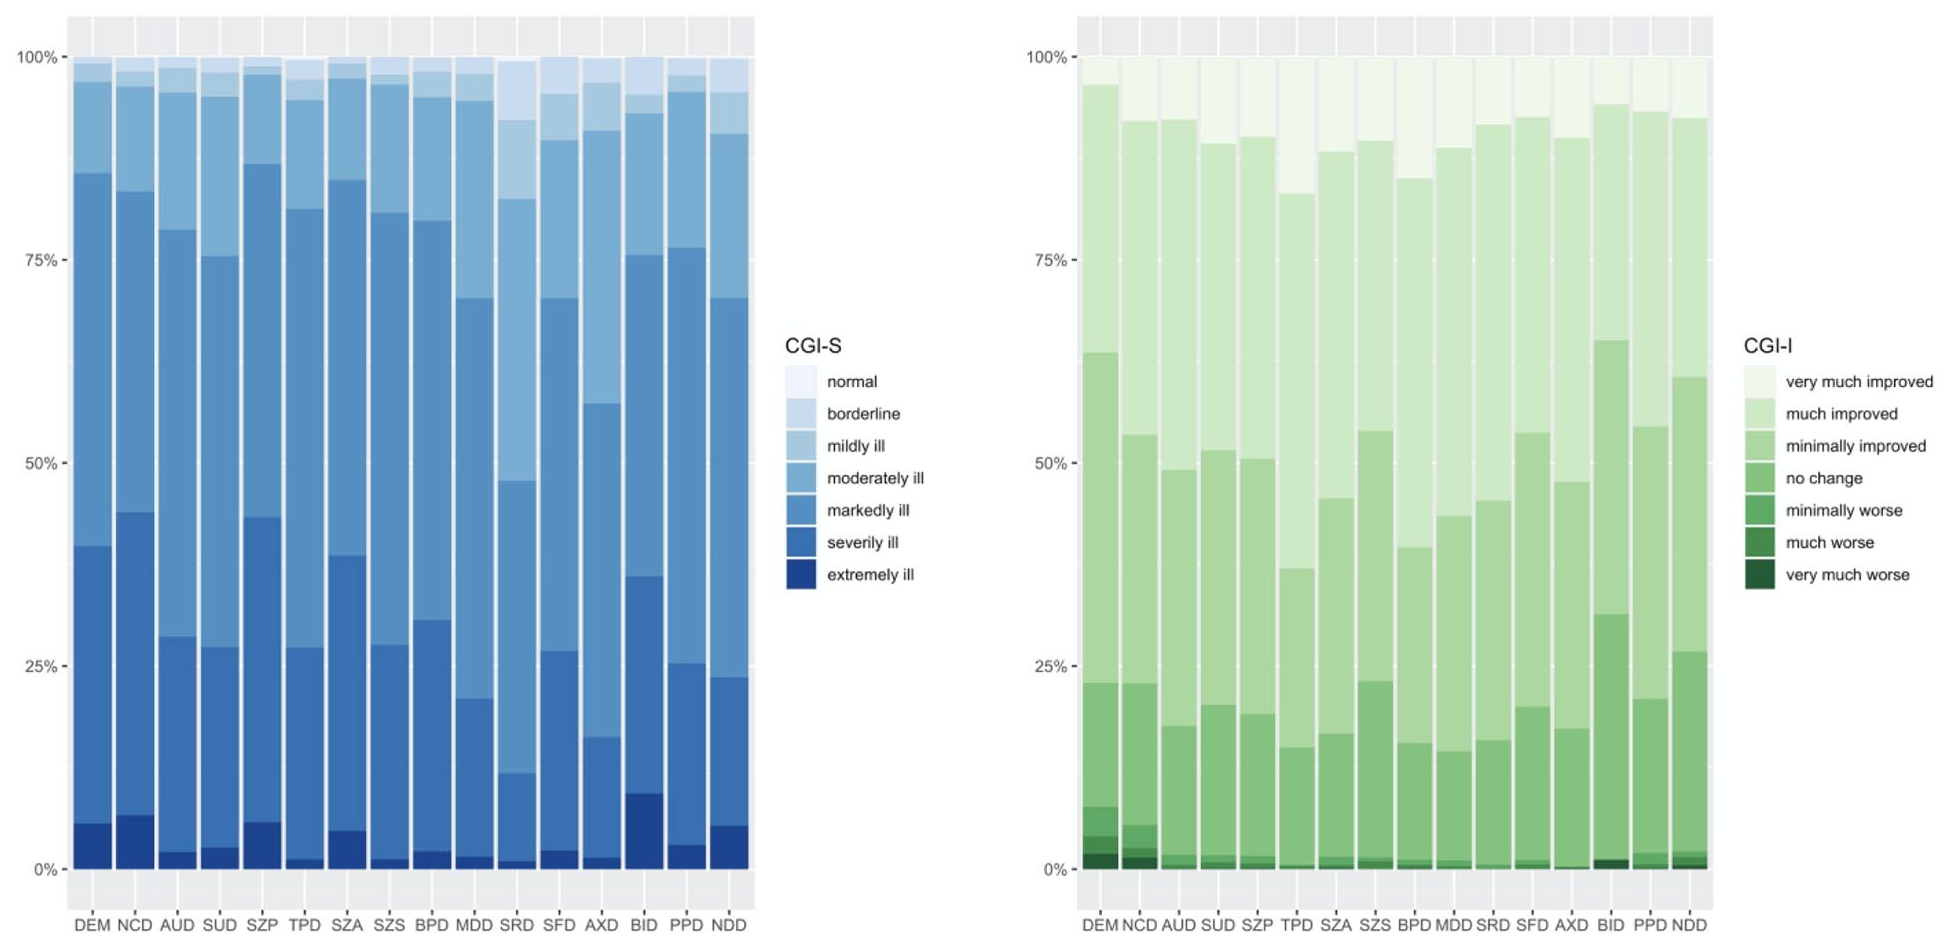
Distribution of the CGI Severity (left, blues) and CGI Improvement (right, greens) gradings among diagnostic groups. DEM: dementia (1069; 3.49%); NCD: neuro-cognitive disorder (924; 3.02%); AUD: alcohol use disorder (5414; 17.68%); SUD: substance use disorder (1926; 6.29%); SZP: schizophrenia (4804; 15.69%); TPD: transitory psychotic disorder (748; 2.44%); SZA: schizoaffective disorder (1378; 4.50%); SZS: schizophrenia spectrum disorders (406; 1.33%); BPD: bipolar disorder (1461; 4.77%); MDD: major depressive disorder (5975; 19.52%); SRD: stress-related disorders (3029; 9.89%); SFD: somatoform disorders (175; 0.57%); AXD: anxiety (560; 1.83%); BID: body image disorder (86; 0.28%); PPD: personality disorder (2250; 7.35%); and NDD: neuro-developmental disorders (411; 1.34%).
The CGI-S score at admission was 4.98 ± 0.98 with a left skew distribution; the CGI-I score at discharge was 2.59 ± 0.96 with a right skew distribution. For analysis, we calculated the HoNOS sum score, as well as the difference score and the percentage of change between admission and discharge. The mean HoNOS sum score at admission was 18.77 ± 7.61 and 13.83 ± 8.18 at discharge, with a difference score of 5.72 ± 7.61 and a percentage of change of 26.90 ± 40.01.
Multiple regression analysis
The HoNOS and the CGI-S at admission have a Spearman rank correlation of 0.38 (p < 0.000). The multiple regression analysis found a statistically significant interaction between gender (female); diagnosis (DEM, NCD, SUD, SZP, TPD, SZA, SZS, MDD, SRD, PPD and NDD); education level (college/university) and language proficiency (difficult). The HoNOS difference score and the percentage of change have a Spearman rank correlation with the CGI-I of 0.39 (p < 0.000). The multiple regression analysis also found a statistically significant interaction between diagnosis (BPD, MDD, SZA, TPD, SRD and PPD) and education level (apprenticeship and college/university).
In the post hoc analysis, we manually removed variables with a potential interaction using a leave-one-out method. The correlation between the scales of interest (i.e. HoNOS and CGI) remained practically unchanged. Furthermore, the equipercentile analysis controlling for these variables showed no variation other than rounding differences. The afterwards performed chi-square goodness-of-fit test comparing the proportions of the HoNOS derived a comparable allocation than the CGI-S (χ2 (df = 36, n = 30,616) = 46, p = 0.23) and the CGI-I (χ2 (df = 28, n = 22,796) = 24, p = 0.26) categorisation.
Equipercentile linking CGI-S and HoNOS sum score
The cut-off severity values for the HoNOS sum scores are given in Table 2. The CGI-S score of 2 (‘borderline ill’) corresponded to an HoNOS sum score between 3 and 5. A CGI-S score of 3 (‘mildly ill’) corresponded to a sum score between 6 and 10. The CGI-S score of 4 (‘moderately ill’) corresponded to a sum score between 10 and 16. The CGI-S score of 5 (‘markedly ill’) corresponded to a sum score between 17 and 25. The CGI-S score of 6 (‘severely ill’) corresponded to a sum score between 26 and 35. Finally, a CGI-S score of 7 (‘extremely ill’) corresponded to a sum score of 36 or more (see Figure 2).
Linking of the HoNOS to the CGI scales.
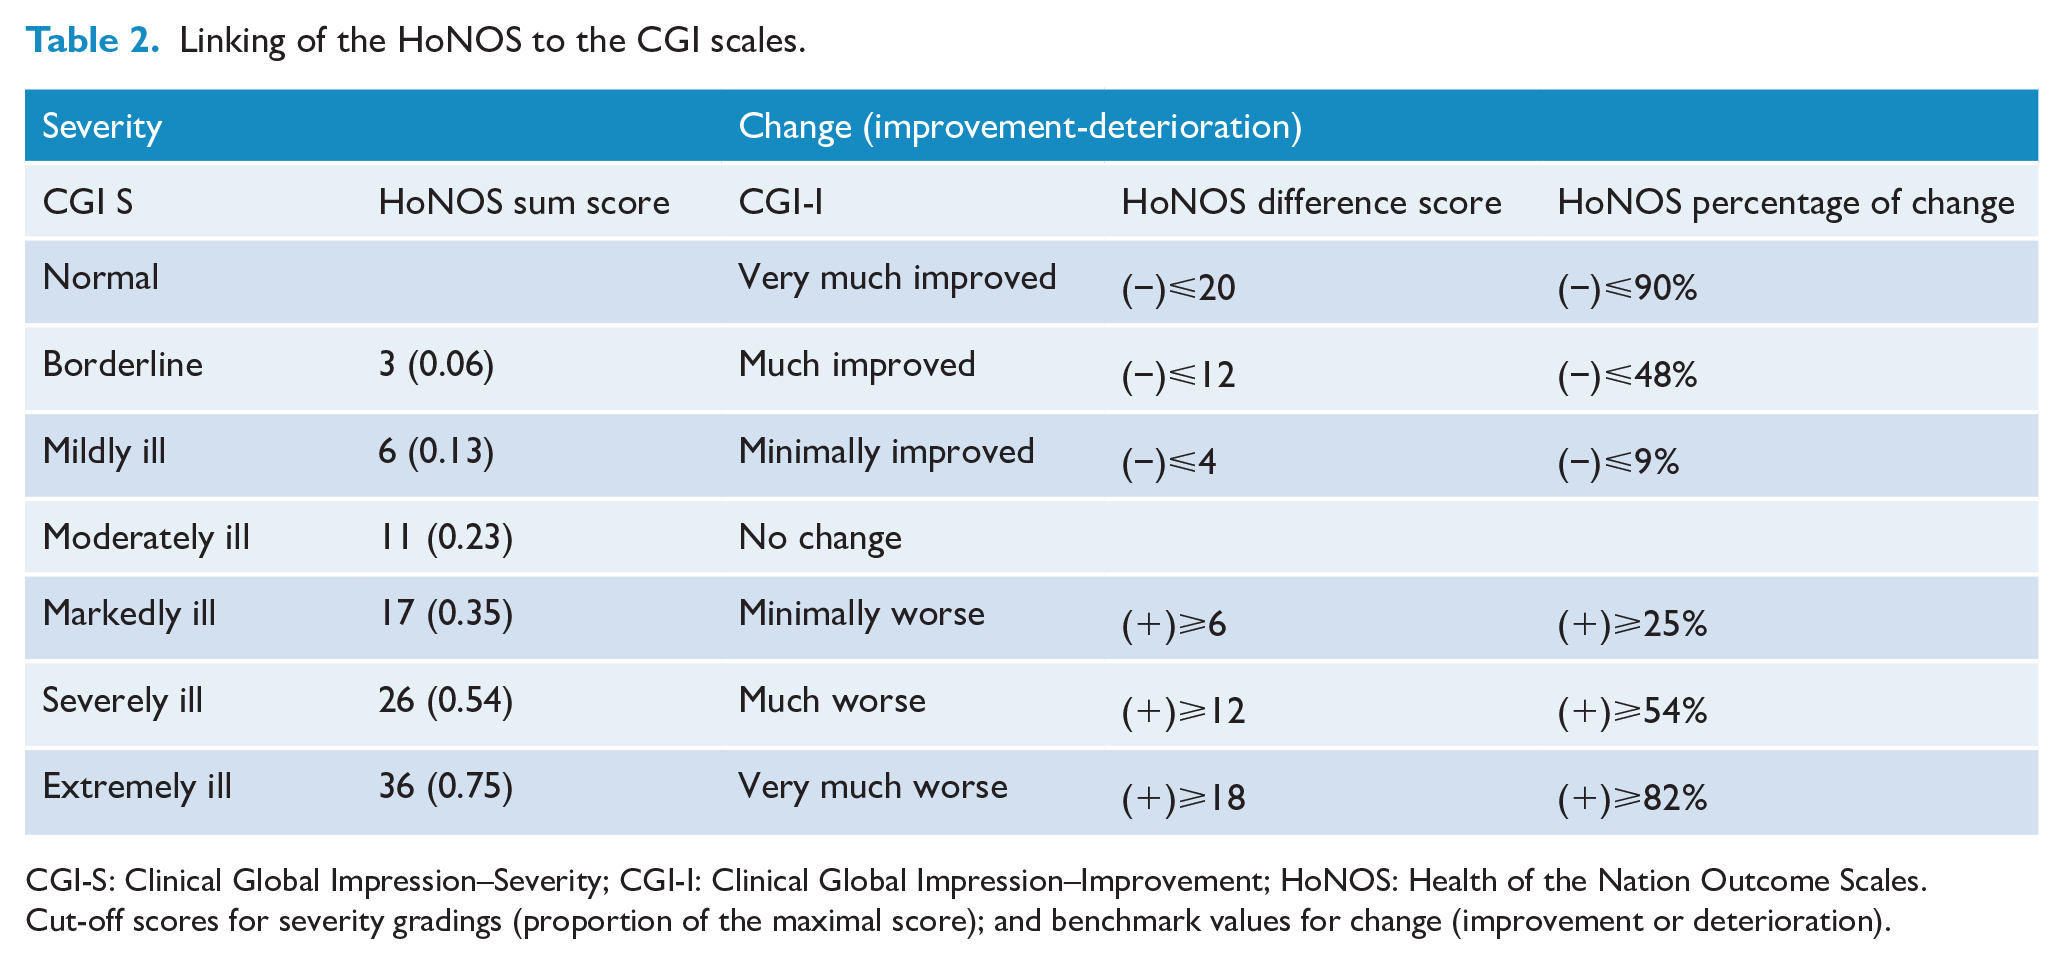
CGI-S: Clinical Global Impression–Severity; CGI-I: Clinical Global Impression–Improvement; HoNOS: Health of the Nation Outcome Scales.
Cut-off scores for severity gradings (proportion of the maximal score); and benchmark values for change (improvement or deterioration).
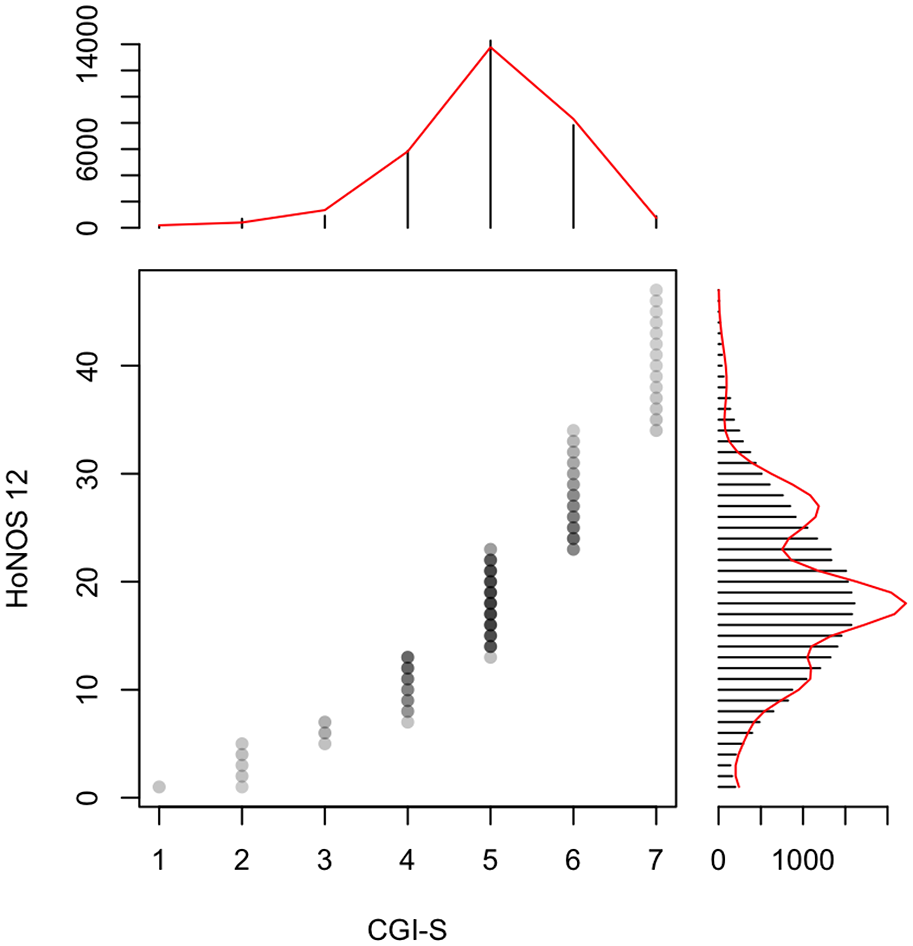
Equipercentile linking of the HoNOS sum-score and the CGI-S. The corresponding CGI-S values: 1: ‘normal’; 2: ‘borderline ill’; 3: ‘mildly ill’; 4: ‘moderately ill’; 5: ‘markedly ill’; 6: ‘severely ill’; and 7: ‘extremely ill’.
Equipercentile linking CGI-I with the HoNOS difference score and percentage of change
The benchmarks derived from the linking of the CGI-I and the HoNOS sum score and percentage of change are summarised in Table 2. The corresponding CGI-I gradings for the HoNOS sum score are as follows: patients with a decrease of 4–11 points (or 9–48%) correspond to ‘minimally improved’ (CGI-I score of 3). Patients with a sum score decrease of between 12 and 19 points (or 49–89%) were considered as ‘much improved’ (CGI-I score of 2) and a decrease over 20 points (or greater than 90%) considered as ‘very much improved’ (CGI-I score of 1). Patients with a sum score increase between 6 and 11 points (or 25–54%) were considered as ‘minimally worse’ (CGI-I score 5). Patients with a sum score increase of 12–17 points (or 55–82%) were considered ‘much worse’ (CGI-I score of 6). Those with a sum score increase over 18 points (or greater than 83%) were considered ‘very much worse’ (CGI-I score of 7). Finally, those with a decrease of 3 points (or less than 8%) or an increase of 5 points (or less than 24%) defined as ‘unchanged’ (CGI-I score of 4).
Discussion
The clinical sample used for our analysis included almost the complete spectrum of mental and substance use disorders present in the adult population (Whiteford et al., 2013; WHO, 1992). Our results, therefore, improve the interpretation of HoNOS scores in clinical practice. Using equipercentile linking of the HoNOS with the CGI scales, we have generated cut-off scores and benchmark values for change according to clinical judgement. This is of importance, considering the use of the HoNOS as a mandatory measurement instrument, as well as a benchmark tool for quality assessment and resource allocation (Delaffon et al., 2018; Speak et al., 2015).
The multiple regression analysis demonstrated a statistically significant interaction with several variables, especially some diagnostic categories. The performed post hoc analysis with a leave-one-out method did not alter either cut-off scores or benchmark values, beyond rounding differences. Therefore, we consider that the interactions found in the multiple regression analysis are an artefact (due to the large sample size) without clinical relevance (Marsh et al., 1988; Sullivan and Feinn, 2012). These findings, strengthen the notion that the HoNOS is suitable as a trans-diagnostic scale (Delaffon et al., 2018; James et al., 2018; Wing, 2000; Wing et al., 1998) and encouraging its use as a basic psychometric instrument and benchmark tool (Delaffon et al., 2018; James et al., 2018; Kisely et al., 2010).
For our analysis, we employed the HoNOS sum score. It allows both the direct comparison of an individual patient with others, as with prior measurements. Alternative approaches for evaluation have been proposed, including a categorical change model (Crawford et al., 2017) and alternative factor structures (Speak and Muncer, 2016). We consider that the sum score is able to reflect the complex and dynamic interplays between psychopathology, behaviour and psychosocial circumstances, as well as compensatory and adaptation mechanisms. These qualities can be lost when the items or subscales are dichotomised (Kortrijk et al., 2019; Schmittmann et al., 2013; Vazquez-Bourgon et al., 2019), also affecting the latent structure of the HoNOS, potentially leading to the divergent results reported to date (Bender, 2019; James et al., 2018; Preston, 2000; Smith et al., 2017; Trauer, 1999).
Our findings, especially the cut-off scores and benchmark values, reciprocally corroborate and validate previous results, obtained in different clinical samples, with other statistical methods (Boon et al., 2019; De Beurs et al., 2018; Parabiaghi et al., 2005, 2011, 2014). The percentage of change for improvement (treatment response) and deterioration determined in our analysis are in accordance with generally accepted thresholds (Duff, 2012; Evans et al., 1998; Schennach-Wolff et al., 2010). Since the last two items measure the social environment and living conditions, some authors suggest omitting these items when analysing the HoNOS, especially during hospitalisation (Bech et al., 2003; Pirkis et al., 2005; Trauer, 1999). A subsequent analysis, leaving the last two items of the HoNOS, leads to similar results as for the complete scale.
The main limitation of our results remains the low correlation between the HoNOS and the CGI-scales (Mukaka, 2012; Schober et al., 2018). We consider that the differences in the construction of the scales, mainly the ability of the CGI to capture several subjective aspects of severity, likewise functioning and well-being (Beneke and Rasmus, 1992; Berk et al., 2008; Leon et al., 1993) explain this finding. Nonetheless, we consider precisely this capacity of the CGI adds to its flexibility and uniqueness as a reference tool. Despite the rather low correlation, the agreeability of both scales is visualised in the Bland–Altman plot (Mukaka, 2012), yielding an agreement within the 95% mean difference between HoNOS and CGI (Bland and Altman, 1986; Giavarina, 2015). Through the equipercentile analysis, especially the smoothing procedure flaws in correlation can be compensated (González and Wiberg, 2017).
A peculiarity of our sample remains a large number of compulsory admissions for treatment. Previous studies suggest this is a phenomenon related to the singularities of the legal regulations in the Canton of Zurich (Dorothee, 2013). A post hoc analysis revealed no statistically significant difference between voluntary and compulsory admissions to our department regarding severity according to CGI and sum score of the HoNOS; cut-off values were also similar.
The main strength of our study is the large and naturalistic sample population, with representative diagnostic categories resembling clinical practice. This allows for robust statistical analysis, overcoming the limitations mentioned above. The post hoc analysis, using the leave-one-out method, ruled out distortions by clinical or demographic characteristics. The corroboratory analysis showed an overlapping allocation and distribution of the severity and change categories, additionally demonstrating their validity. Nonetheless, further research is required on how clinical change and severity modifies correlations between diagnoses, symptoms, behaviour and psychosocial circumstances as determined by the HoNOS (Barbalat et al., 2019; Schmittmann et al., 2013).
Conclusion
The HoNOS is a valid and reliable scale for the measurement of global severity of psychiatric disorders. The performance of the HoNOS sum score is similar across both the severity spectrum and psychiatric diagnostic categories. The inclusion and the exclusion of factors external to the patient do not appear to influence the performance of the HoNOS regarding the assessment of severity and change. The availability of a global severity index facilitates the comparison of patients, both with other patients and their own treatment outcomes.
Footnotes
Acknowledgements
The authors thank Lorna McBroom for language editing and proofreading.
Declaration of Conflicting Interests
The author(s) declared no potential conflicts of interest with respect to the research, authorship and/or publication of this article.
Funding
The author(s) received no financial support for the research, authorship and/or publication of this article.
Data Availability
The protocol presented and approved by the ethics committee does not foresee the sharing of data. Following a reasonable request, the corresponding author will submit an amendment to the ethics committee asking for approval of data sharing in that particular case.