
Abstract
Objectives:
The Yale-Brown Obsessive-Compulsive Scale has been considered the gold standard scale to assess obsessive-compulsive disorder severity. Previous studies using exploratory factor analysis and confirmatory factor analysis with this scale showed mixed findings in terms of factor structure and fit of models. Therefore, we used confirmatory factor analysis to compare different Yale-Brown Obsessive-Compulsive Scale models in a large sample aiming to identify the best model fit.
Methods:
We assessed adult obsessive-compulsive disorder patients (n = 955) using three measures: Yale-Brown Obsessive-Compulsive Scale severity ratings, the Dimensional Yale-Brown Obsessive-Compulsive Scale and the clinical global impression scale. We tested all factor structures reported by previous studies to investigate which model best fitted the data: one-factor, two-factor, three-factor and their equivalent high-order solutions. We also investigated Yale-Brown Obsessive-Compulsive Scale items correlations with scores from the other measures of obsessive-compulsive disorder severity.
Results:
Confirmatory factor analysis models presented mediocre to fair goodness-of-fit indexes. Severity items related to resistance to obsessions and compulsions presented low factor loadings. The model with the best fit indexes was a high-order model without obsessive-compulsive disorder resistance items. These items also presented small correlations with other obsessive-compulsive disorder severity measures.
Conclusion:
The obsessive-compulsive disorder field needs to discuss further improvements in the Yale-Brown Obsessive-Compulsive Scale and/or continue to search for better measures of obsessive-compulsive disorder severity.
Keywords
Introduction
Obsessive-compulsive disorder (OCD) is a mental disorder characterized by the presence of obsessions (intrusive and unpleasant thoughts or ideas) and/or compulsions (repetitive behaviors aimed at reducing the distress caused by the obsessions) (American Psychiatric Association, 2013). It is an impairing condition marked by a chronic trajectory (Skoog and Skoog, 1999), the presence of various comorbidities and frequently associated with adverse outcomes in life (Pérez-Vigil et al., 2018; Rosa et al., 2012). Thus, early diagnosis and treatment are key to ensure patient recovery and a good prognosis (Abramowitz et al., 2009; Goodman et al., 2014; Pauls et al., 2014). OCD assessment by structured tools is key to ensure the advancement of the field toward new treatment strategies and a better understanding of the etiology of the disorder. First, diagnostic interviews, such as the Structured Clinical Interview for DSM-5 (SCID-5), are important in research settings to establish a reliable diagnosis. Structured or semi-structured interviews can help elucidate the heterogeneous clinical presentation of OCD, as well as to investigate and disentangle comorbid mental disorders. After a diagnosis is made, it is essential to assess the severity of OCD. For this, symptom severity scales are needed. These scales are designed specifically to identify and measure the functional impairment related to OCD symptoms. Even though there is a variety of OCD severity scales available, such as the National Institute of Mental Health Global Obsessive Compulsive Scale (NIMH-GOCS) and the Global Obsessive-Compulsive Scale (OCI-R), the Yale-Brown Obsessive-Compulsive Scale (Y-BOCS) is the most well known and used scale (Storch et al., 2011).
The Y-BOCS is an assessment tool ubiquitous in the OCD literature, considered to be the gold standard to assess OCD severity for the past 30 years. It is composed of a checklist with some of the most frequently reported OCD symptoms and of a 10-item scale to assess the severity of the obsessions and/or compulsions according to their frequency, impairment, subjective discomfort, resistance and control over symptoms (Goodman et al., 1989a, 1989b). Current international expert consensus suggests the use of the scale to operationalize treatment response, remission and relapse in OCD. For instance, treatment response has been operationalized as a reduction of ⩾35% in the Y-BOCS total score and Clinical Global Impression (CGI) rating of ‘very much improved’ or ‘much improved’ (Mataix-Cols et al., 2016). Therefore, the Y-BOCS is extremely important, enabling researchers to evaluate the impact of interventions in clinical trials. Although it is widely used in clinical studies, previous validation studies reported contradictory findings. Regarding its psychometric properties, there are two main concerns.
First, the factor structure, defined here by the number of latent variables and their relationship with items. Y-BOCS was developed to assess the severity of two types of symptoms: obsessions and compulsions. Consequently, it is implied that they are first-order factor loading on a second-order OCD factor, configuring a higher-order model. The total severity score (sum of all items), as well as severity scores related to obsession (sum of the first five items) and compulsion symptoms (sum of the last five items), is directly related to this structure. However, previous studies reported only first-order structures: two-factor solution (Amir et al., 1997; McKay et al., 1995, 1998; Moritz et al., 2002) and three-factor solution (Arrindell et al., 2002; Moritz et al., 2002). It is worth noting that the idea of Y-BOCS having a second-order structure is strongly based on current diagnostic manuals, clinical evidence and theory. OCD is conceptualized as a single mental disorder composed of obsession and compulsion symptoms. Patients reporting only obsessions or compulsions are very rare (approximately 1% or less), and further studies are still needed to have a better understanding of these cases since undetected mental compulsions or measurement error could explain these rare findings (Shavitt et al., 2014). As far as we know, no study has investigated a higher-order model of the Y-BOCS severity scale so far.
Furthermore, contradictory findings are not only related to the number of factor solutions but also to the constructs that each factor represents (see Table 1). The most common tested structure was the two-factor solutions with obsession and compulsion (Arrindell et al., 2002; McKay et al., 1995; Storch et al., 2005). Interestingly, some studies reported different two-factor solutions, showing disturbance and OCD symptoms severity as constructs (Amir et al., 1997; McKay et al., 1998) and OCD symptoms severity and resistance/control (Deacon and Abramowitz, 2005). Finally, a three-factor solution with obsession, compulsion and resistance to OCD symptoms was also reported (Kim et al., 1994; Moritz et al., 2002). Differences in factors/constructs are mainly related to the use of exploratory analyses, where the researcher does not define a priori the number of factors and their relation to each specific item.
Y-BOCS factor structures previously reported in the literature.
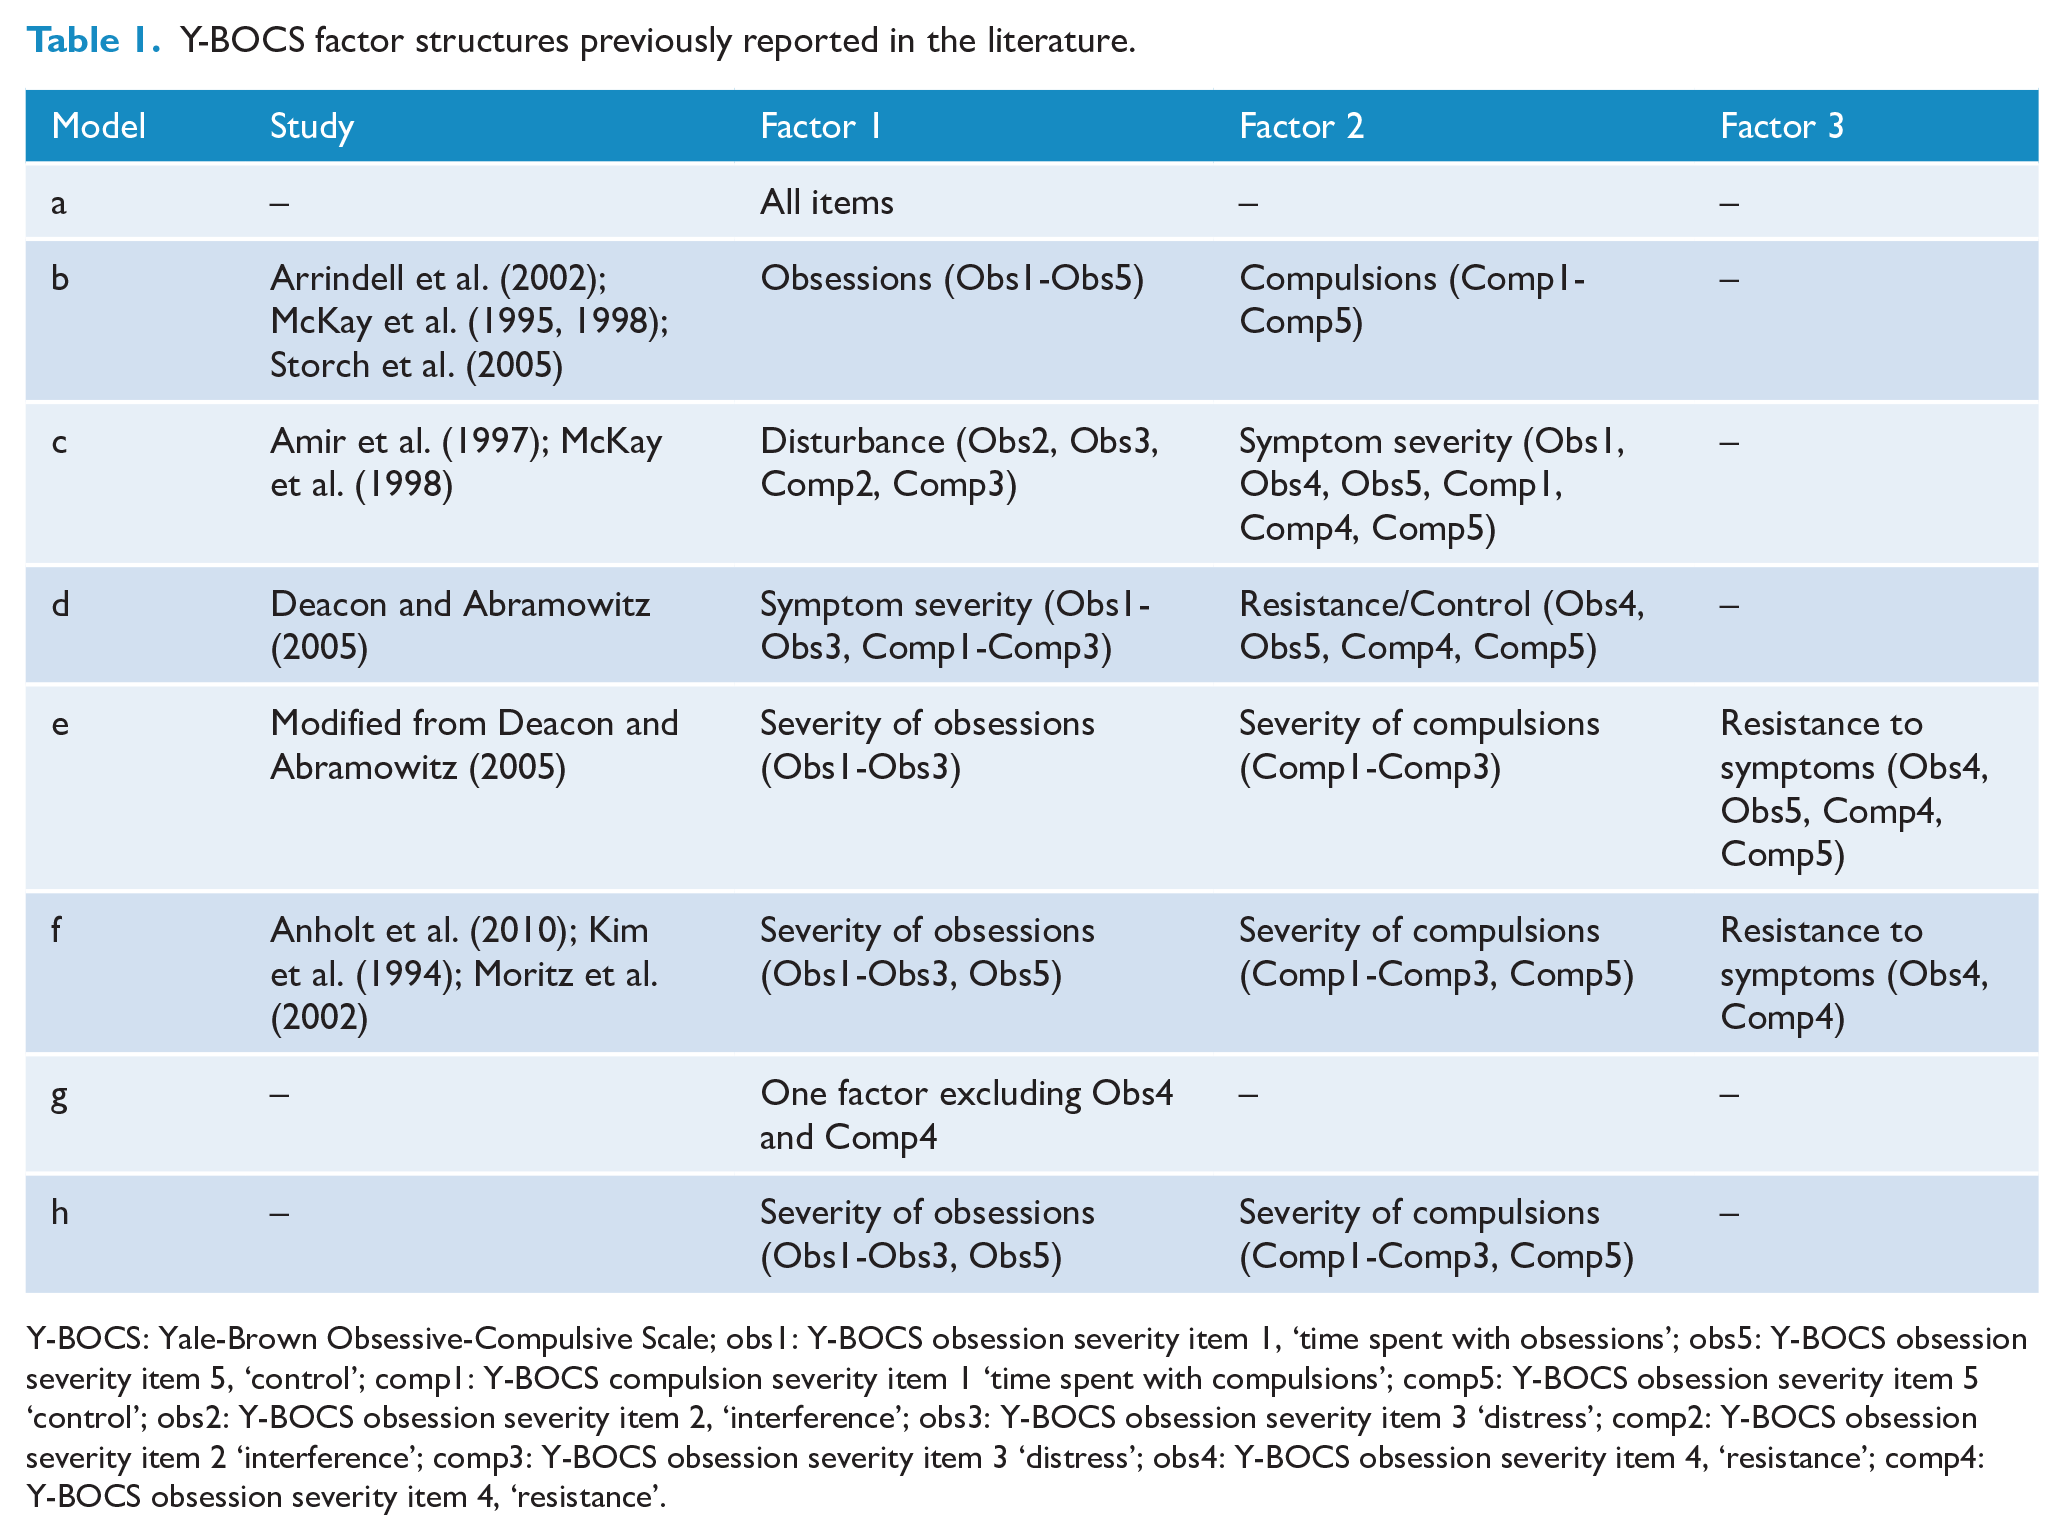
Y-BOCS: Yale-Brown Obsessive-Compulsive Scale; obs1: Y-BOCS obsession severity item 1, ‘time spent with obsessions’; obs5: Y-BOCS obsession severity item 5, ‘control’; comp1: Y-BOCS compulsion severity item 1 ‘time spent with compulsions’; comp5: Y-BOCS obsession severity item 5 ‘control’; obs2: Y-BOCS obsession severity item 2, ‘interference’; obs3: Y-BOCS obsession severity item 3 ‘distress’; comp2: Y-BOCS obsession severity item 2 ‘interference’; comp3: Y-BOCS obsession severity item 3 ‘distress’; obs4: Y-BOCS obsession severity item 4, ‘resistance’; comp4: Y-BOCS obsession severity item 4, ‘resistance’.
The second main concern regarding the Y-BOCS psychometric properties is item factor loading. Factor loading is defined by the relationship between items and latent variables, allowing the identification of items that may not be relevant because they do not fully represent the factor being measured. In this sense, items with low factor loadings could be removed from scales to reduce administration time and to improve internal consistency without adding measurement error.
Therefore, aiming to elucidate the factor structure of the Y-BOCS severity ratings, we used confirmatory factor analysis (CFA; the preferred method to investigate the factor structure of a given scale), in a large sample of adult OCD patients to compare its factor structure across models previously reported in the literature to identify the best model fit. We hypothesized that the best model fit would be a higher-order factor solution: OCD as a second-order factor, with obsessions (items 1–5) and compulsions (items 6–10) as first-order factors. We also sought to investigate the scale’s internal consistency and convergent validity. Finally, we used data from a clinical trial to assess the impact of changes made to the Y-BOCS to accommodate the best model fit in terms of treatment response classification.
Materials and methods
Our study is based on a cross-sectional multicenter study that evaluated 955 adults with OCD. Participants were seeking treatment in one of the seven centers that integrated the Brazilian Research Consortium on Obsessive-Compulsive Spectrum Disorders (Miguel et al., 2008): University of São Paulo (USP, n = 430), Federal University of São Paulo (n = 46), São Paulo State University (n = 48), Federal University of Rio de Janeiro (n = 37), Federal University of Bahia (n = 39), University of Pernambuco (n = 129) and the Federal University of Rio Grande do Sul (n = 226). All centers obtained approval by their respective local Ethics Committee, and all participants gave written informed consent. Evaluators underwent extensive training by senior psychiatrists and psychologists experts on OCD. A PhD level psychologist from USP visited all sites to conduct training and supervision of evaluators. During the time of data collection, multiple meetings between study site leaders and staff were held to practice and standardize the research procedures and assessments (see Miguel et al., 2008, for further details).
As previously mentioned, the Y-BOCS is composed of 10 questions to evaluate the severity of obsessions and compulsions symptoms (five items for each construct). Items scores range from 0 to 4 and evaluate the amount of time spent (obsession severity item ‘obs1’ and compulsion severity item ‘comp1’), interference (obsession severity item ‘obs2’ and compulsion severity item ‘comp2’), distress (obsession severity item ‘obs3’ and compulsion severity item ‘comp3’), resistance (obsession severity item ‘obs4’ and compulsion severity item ‘comp4’) and control over symptoms (obsession severity item ‘obs5’ and compulsion severity item ‘comp5’). The total score ranges from 0 to 40. The Y-BOCS has been translated to Brazilian Portuguese by one of the co-authors (F.R.A.) in 1992.
To determine the correlation of each Y-BOCS severity item to different OCD measures, we used the CGI, the Dimensional Yale-Brown Obsessive-Compulsive Scale (DY-BOCS) and the Brown Assessment of Beliefs Scale (BABS). The CGI is a scale designed to assess the clinician’s judgment about the severity of a patient’s illness or the impact of a given treatment on the patient’s illness, ranging from 1 (‘normal, not at all ill’/‘very much improved’) to 7 (‘among the most extremely ill patients’/‘very much worse’) (Guy, 1976). The DY-BOCS (Rosario-Campos et al., 2006) is an 88-item scale designed to investigate lifetime and current severity of six dimensions of OCD symptoms: aggression, religious/sexual, ordering/symmetry, cleaning/contamination, hoarding and miscellaneous symptoms. In this study, we employed the global level of impairment due to OCD, a score that ranges from ‘none’ (0 points) to ‘severe’ (15 points). Finally, BABS is a scale used to measure the level of insight regarding OCD symptoms. Item scores range from 0 to 4, with higher scores indicating a poor level of insight (Eisen et al., 1998).
Based on previous studies, we tested different factor solutions (models) to investigate which better fit the data: one-factor, two-factor, three-factor and their equivalent higher-order solutions. All tested models are described and identified in Table 1. We used CFA to evaluate models and to compare the goodness-of-fit indexes among them. CFA is a statistical procedure used to test how well the measured variables represent constructs (factors or latent variables), allowing researchers to formally evaluate the fitness of models. Despite that, some Y-BOCS validation studies used exploratory factor analysis (EFA) to investigate the factor structure of the scale, reporting models that differ from what would be expected, such as three-factor solutions (Kim et al., 1994). According to previous studies (Deacon and Abramowitz, 2005; McKay et al., 1995; Moritz et al., 2002), the residuals of paired items (Obs1-Comp1, Obs2-Comp2, Obs3-Comp3, Obs4-Comp4 and Obs5-Comp5), as well as items 4 and 5 of each subscale (Obs4-Obs5 and Comp4-Comp5), were correlated in each model. We tested models without residual correlation and fit indexes were poor. Also, we evaluated the factor loadings of the items in the model that presented the best fit. Only items with a factor loading above 0.63 were considered adequate (Comrey and Lee, 1992). Items below this threshold were removed from the model with the best fit and then CFA analysis was conducted again to assess fit improvement. Finally, we also tested a modified model from Deacon and Abramowitz (2005) study, splitting the symptom severity factor into obsessions and compulsions.
We performed CFA analyses with the weighted least square mean and variance (WLSMV) estimator. Fit indexes used were chi-square test p-value, comparative fit index (CFI), Tucker–Lewis index (TLI), root mean square error of approximation (RMSEA), RMSEA p-value and standardized root mean square residual (SRMR). We also assessed convergent validity using average variance extracted (AVE) and internal consistency using Cronbach’s alpha and MacDonald’s Omega. We considered chi-square p-value > 0.05 to indicate a good model fit. CFI values > 0.95 and TLI values > 0.90 were considered to represent good model fit, respectively. An RMSEA value < 0.08 and an RMSEA p-value > 0.05 were considered acceptable (Brown, 2015; Hu and Bentler, 1999). An SRMR value of <0.08 was considered a good fit. An AVE value higher than 0.50 was considered adequate (Fornell and Larcker, 1981). Cronbach’s alpha and McDonald’s Omega values >0.90 were considered excellent fit, >0.80 good fit and >0.70 an acceptable fit. Correlation matrices of the Y-BOCS items were generated using the Kendall rank correlation test, which is suitable for analyzing ordinal variables. Spearman correlations between the sum of obsession scores and the sum of compulsion scores and histograms with the distribution of these variables can be found in the supplementary material (Figures S1, S2 and S3). Normality assumptions were verified using the Shapiro–Wilk test.
Finally, to test the changes made to the total severity score based on the best model fit, we used data from an open-label trial designed to test the effectiveness of either group cognitive-behavioral therapy (GCBT) or fluoxetine in the treatment of adults with OCD (Belotto-Silva et al., 2012). In this study, we analyzed a subsample of participants maintained on fluoxetine for the full 12 weeks of treatment (n = 114) (Costa et al., 2013). Item-by-item Y-BOCS scores were unavailable for two subjects and CGI-improvement scores were unavailable for two subjects. Therefore, our final sample comprised 110 adults with OCD. We determined treatment response based on the current international expert consensus: 35% reduction in Y-BOCS total scores from pre- to post-treatment and CGI-I rating of ‘very much improved’ or ‘much improved’ (Mataix-Cols et al., 2016). These analyses were performed with paired t-tests and effect sizes were evaluated with Cohen’s d.
All statistics were performed with R (version 3.5.3, www.r-project.org) and r-studio (version 1.0.143, www.rstudio.com). All CFA-related procedures were conducted using lavaan 0.6.3 (Rosseel, 2012). Other R libraries used in this study were ‘foreign’, ‘semTools’ (0.5.1), ‘semPlot’ and ‘ggplot2’.
Results
Mean age of the sample was 35.8 years (standard deviation [SD] = 12.5), ranging from 18 to 82 years (n = 955). The sample was composed of 400 men (41.9%) and 555 women (58.1%), and the mean Y-BOCS total score was 25.6 (SD = 7.5), ranging from 7 to 40 (Figures S1, S2 and S3). Y-BOCS score distribution by sites can be found in the supplementary materials (Table S1 and Figure S4). Goodness-of-fit indexes of all tested models are reported in Table 2. No model showed chi-square or RMSEA p-values >0.05. CFI and TLI values showed all models had good fit, except model hi-d. Only models e and hi-e presented RMSEA values considered to represent an acceptable fit (0.8). Apart from hi-d, all models had good fit according to SRMR values. Table 2 also exhibits values of omega and AVE for each model. Notably, no model presented omega values below 0.7 and only two models were below 0.8. Regarding Cronbach’s alpha, values for all models were higher than 0.919 (information not reported in Table 2). On the other hand, AVE values ranged from 0.356 to 0.667, suggesting that models hi-c, hi-d, hi-e and hi-f did not present convergent validity.
Goodness-of-fit indexes of all models.
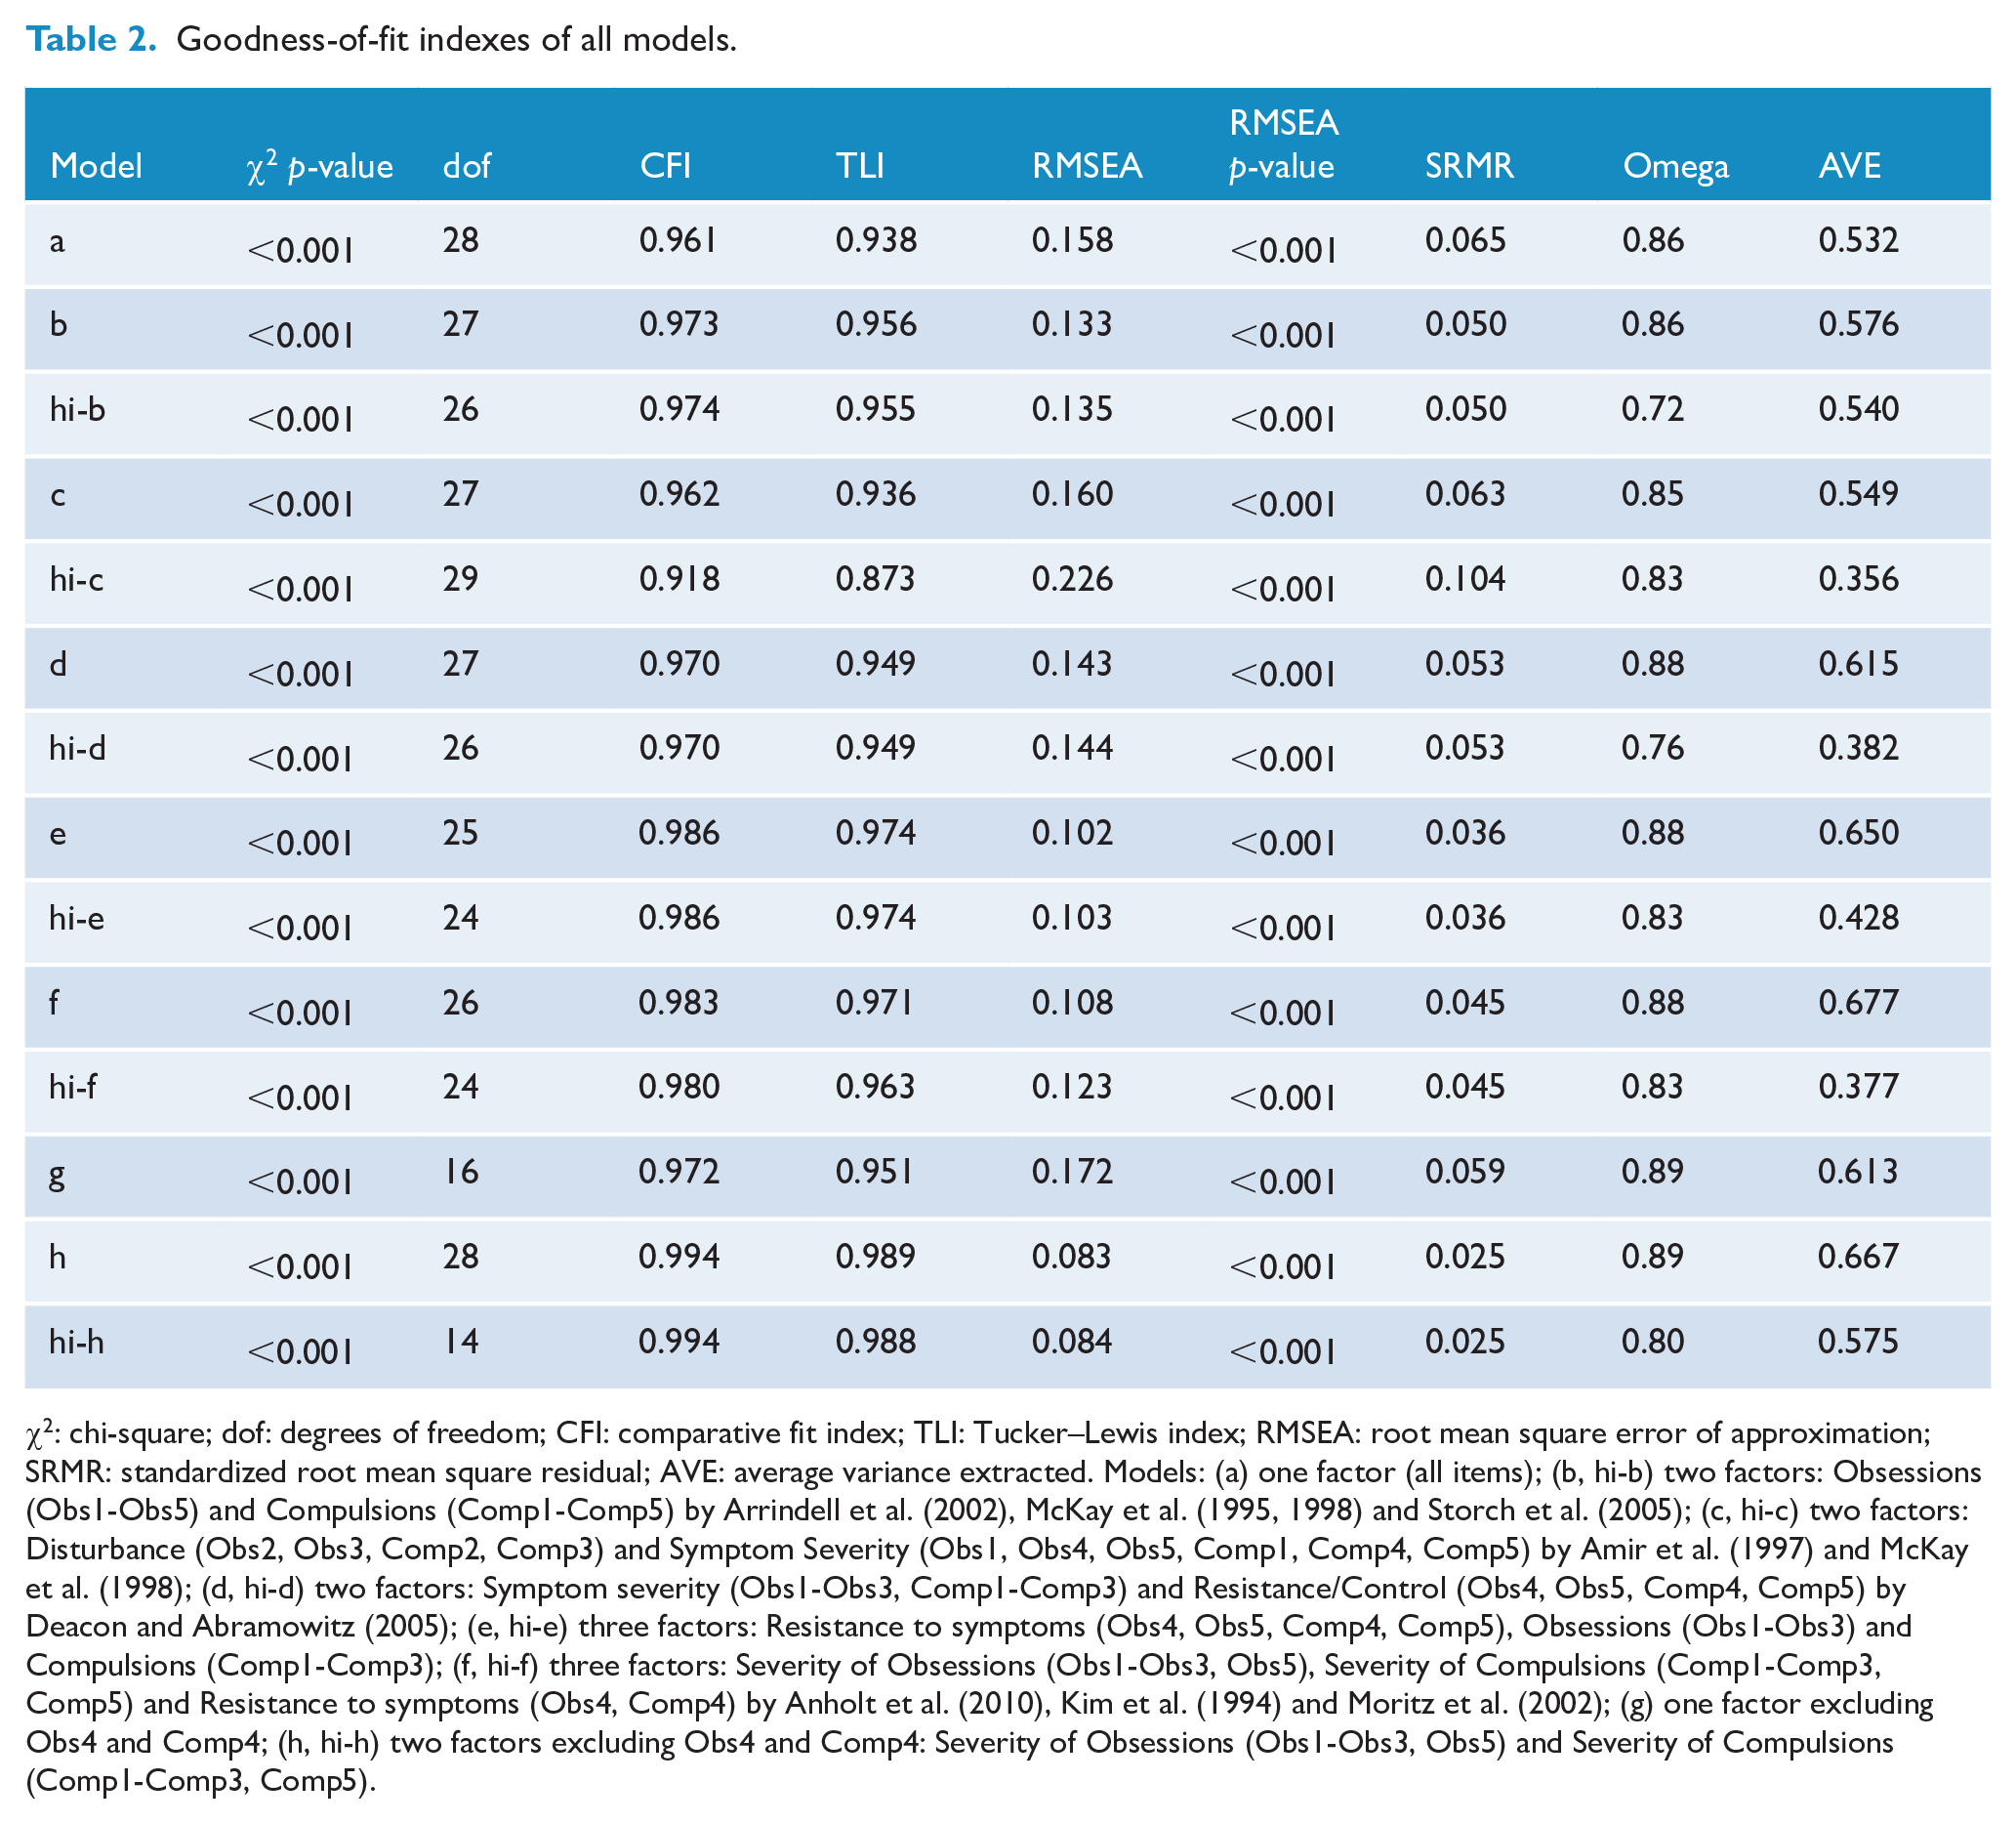
χ2: chi-square; dof: degrees of freedom; CFI: comparative fit index; TLI: Tucker–Lewis index; RMSEA: root mean square error of approximation; SRMR: standardized root mean square residual; AVE: average variance extracted. Models: (a) one factor (all items); (b, hi-b) two factors: Obsessions (Obs1-Obs5) and Compulsions (Comp1-Comp5) by Arrindell et al. (2002), McKay et al. (1995, 1998) and Storch et al. (2005); (c, hi-c) two factors: Disturbance (Obs2, Obs3, Comp2, Comp3) and Symptom Severity (Obs1, Obs4, Obs5, Comp1, Comp4, Comp5) by Amir et al. (1997) and McKay et al. (1998); (d, hi-d) two factors: Symptom severity (Obs1-Obs3, Comp1-Comp3) and Resistance/Control (Obs4, Obs5, Comp4, Comp5) by Deacon and Abramowitz (2005); (e, hi-e) three factors: Resistance to symptoms (Obs4, Obs5, Comp4, Comp5), Obsessions (Obs1-Obs3) and Compulsions (Comp1-Comp3); (f, hi-f) three factors: Severity of Obsessions (Obs1-Obs3, Obs5), Severity of Compulsions (Comp1-Comp3, Comp5) and Resistance to symptoms (Obs4, Comp4) by Anholt et al. (2010), Kim et al. (1994) and Moritz et al. (2002); (g) one factor excluding Obs4 and Comp4; (h, hi-h) two factors excluding Obs4 and Comp4: Severity of Obsessions (Obs1-Obs3, Obs5) and Severity of Compulsions (Comp1-Comp3, Comp5).
Factor loadings of items Obs4 and Comp4 were below the cutoff of 0.63, except for model i (Table 3). Considering these low factor loadings of Obs4 and Comp4 across all models, we tested models without these two items (models g and h), which showed the best goodness-of-fit indexes across all models. Figure 1 depicts the higher-order diagram with factor loadings of model hi-h.
Factor loadings of items in all tested models.
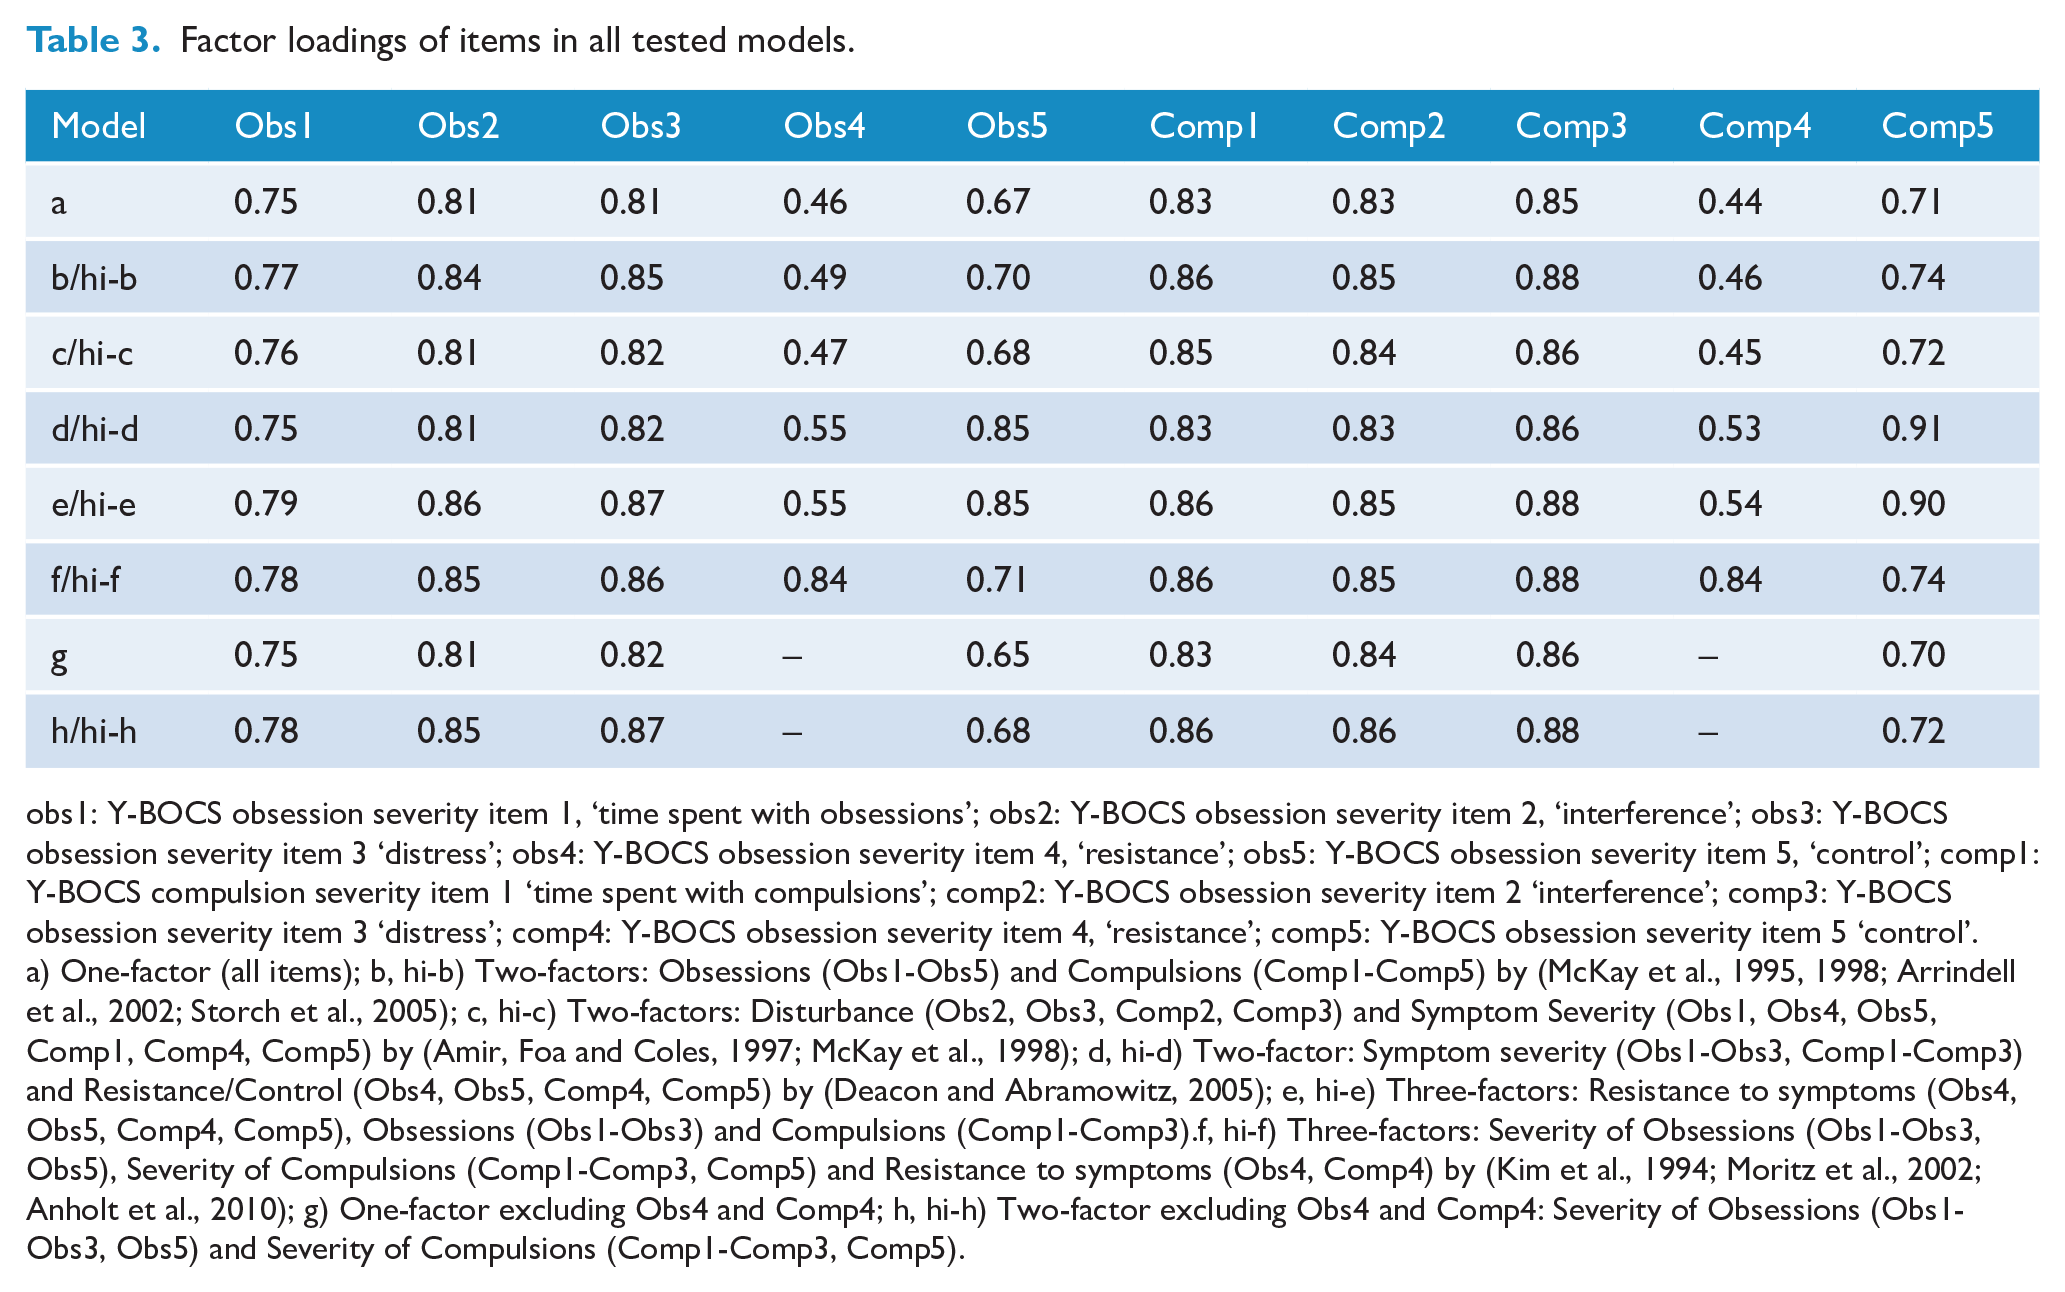
obs1: Y-BOCS obsession severity item 1, ‘time spent with obsessions’; obs2: Y-BOCS obsession severity item 2, ‘interference’; obs3: Y-BOCS obsession severity item 3 ‘distress’; obs4: Y-BOCS obsession severity item 4, ‘resistance’; obs5: Y-BOCS obsession severity item 5, ‘control’; comp1: Y-BOCS compulsion severity item 1 ‘time spent with compulsions’; comp2: Y-BOCS obsession severity item 2 ‘interference’; comp3: Y-BOCS obsession severity item 3 ‘distress’; comp4: Y-BOCS obsession severity item 4, ‘resistance’; comp5: Y-BOCS obsession severity item 5 ‘control’. a) One-factor (all items); b, hi-b) Two-factors: Obsessions (Obs1-Obs5) and Compulsions (Comp1-Comp5) by (McKay et al., 1995, 1998; Arrindell et al., 2002; Storch et al., 2005); c, hi-c) Two-factors: Disturbance (Obs2, Obs3, Comp2, Comp3) and Symptom Severity (Obs1, Obs4, Obs5, Comp1, Comp4, Comp5) by (Amir, Foa and Coles, 1997; McKay et al., 1998); d, hi-d) Two-factor: Symptom severity (Obs1-Obs3, Comp1-Comp3) and Resistance/Control (Obs4, Obs5, Comp4, Comp5) by (Deacon and Abramowitz, 2005); e, hi-e) Three-factors: Resistance to symptoms (Obs4, Obs5, Comp4, Comp5), Obsessions (Obs1-Obs3) and Compulsions (Comp1-Comp3).f, hi-f) Three-factors: Severity of Obsessions (Obs1-Obs3, Obs5), Severity of Compulsions (Comp1-Comp3, Comp5) and Resistance to symptoms (Obs4, Comp4) by (Kim et al., 1994; Moritz et al., 2002; Anholt et al., 2010); g) One-factor excluding Obs4 and Comp4; h, hi-h) Two-factor excluding Obs4 and Comp4: Severity of Obsessions (Obs1-Obs3, Obs5) and Severity of Compulsions (Comp1-Comp3, Comp5).
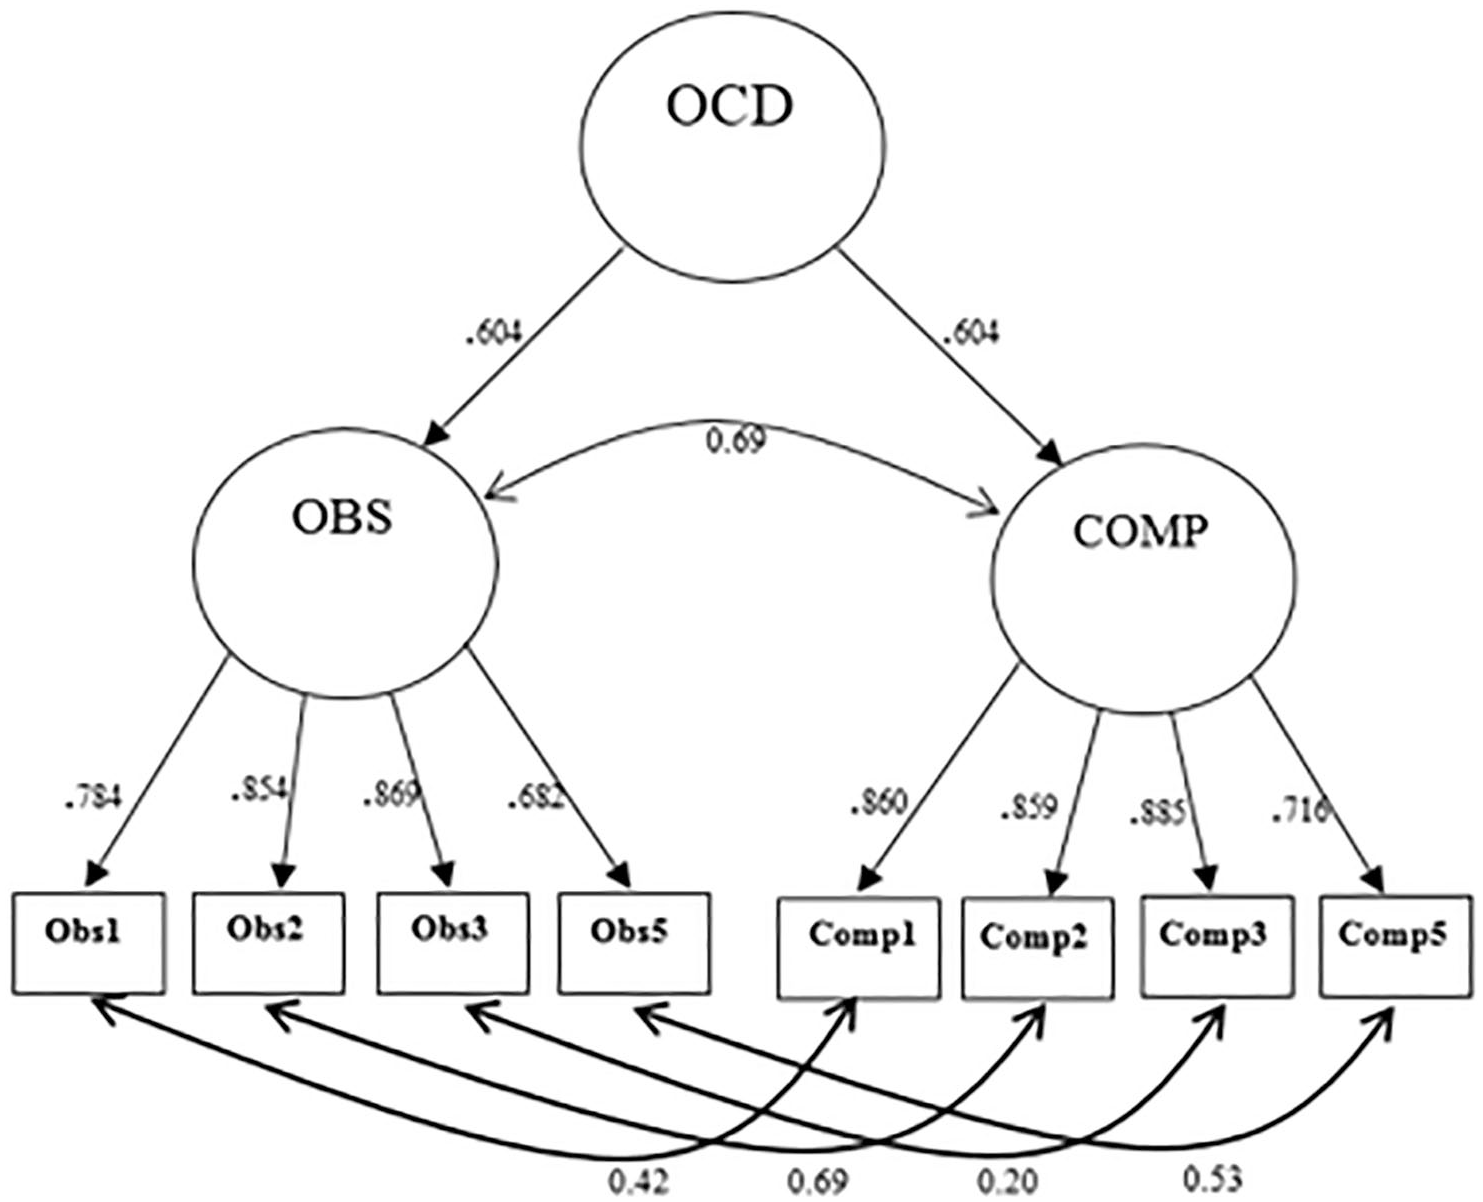
High-order diagram indicating the structure of model hi-h.
Correlations between Y-BOCS items are displayed in Figure 2. All item pairs (Obs1-Comp1, Obs2-Comp2, Obs3-Comp3, Obs4-Comp4 and Obs5-Comp5) were significantly and positively correlated (tau > 0.5, p < 0.001). Among Y-BOCS Items, Obs4 and Comp4 presented the smallest Kendall correlation coefficients (indicated by light red in Figure 2 and highlighted by dark arrows). We used the CGI score and the DY-BOCS impairment score (0–15) to understand which Y-BOCS items had a higher correlation with these measures of OCD severity. Items Obs4 and Comp4 presented small correlation coefficients with CGI score when compared to other items: both presented values ⩽0.32, when the average was 0.44 (Figure 2). A similar pattern was observed with items Obs4 and Comp4, and DY-BOCS impairment score: items Obs4 and Comp4 presented coefficients of 0.28 and 0.24 (respectively), whereas the average of the other coefficients was 0.44 (Figure 2). The association between Y-BOCS items and the level of insight measured by the BABS can be found in the supplementary material. Briefly, items Obs4 (tau = 0.26) and Comp4 (tau = 0.20) presented the highest correlation coefficients (Table S2).
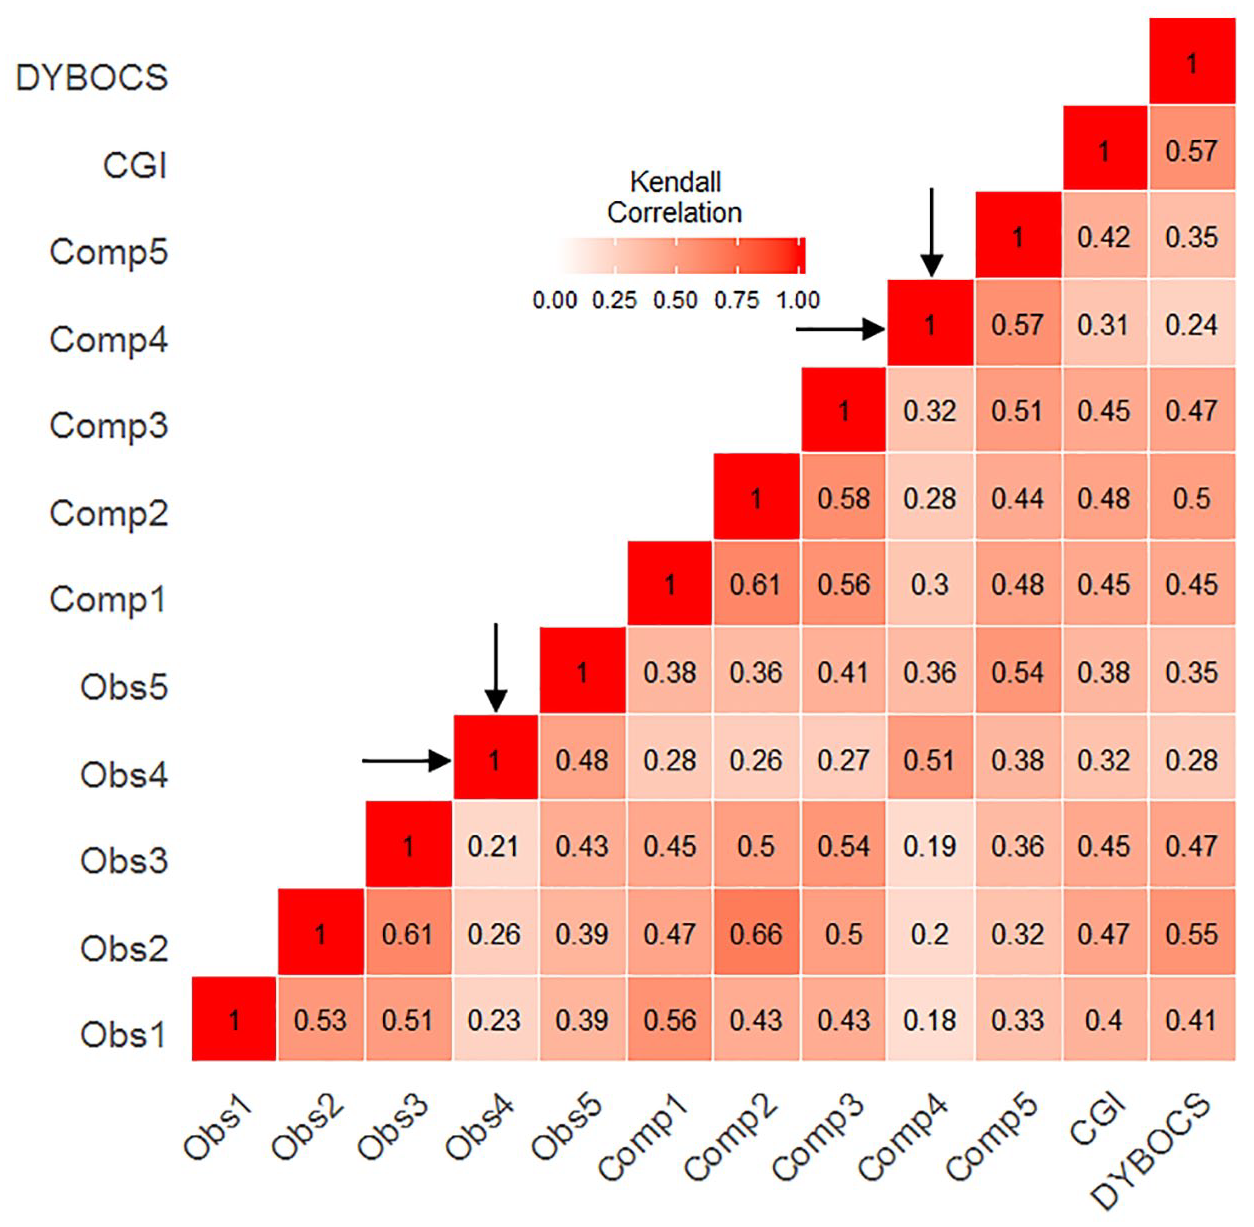
Heatmap showing Kendall’s tau coefficients of Y-BOCS items, CGI and DY-BOCS impairment score.
Since the model with the best fit indexes and adequate factor loadings had two items from the scale removed (Obs4 and Comp4), we decided to explore the potential differences in Y-BOCS total severity scores in a sample of adult patients that underwent evidence-based treatment (Belotto-Silva et al., 2012). Taking into account the original structure of the Y-BOCS (10 items), from a total of 110 patients, 40 were considered responders, with an average reduction of 28% in the Y-BOCS scores (mean-pre = 26.13, SD = 5.24; mean-post = 18.85, SD = 8.16, paired t-test: t = 10.8, p-value < 0.001, Cohen’s d = 1.03). Excluding Y-BOCS items 4 and 9 led to similar findings: 43 subjects were considered responders, with an average reduction of 29% in the Y-BOCS scores (mean-pre = 22.60, SD = 4.4; mean-post = 16.09, SD = 6.94, paired t-test: t = 11.7, p-value < 0.001, Cohen’s d = 1.12). In total, only seven subjects (6.4%) had a change in their response status when comparing both models: five (4.6%) patients classified as non-responders according to the original Y-BOCS structure were considered responders in the Y-BOCS version without items Obs4 and Comp4. On the other hand, two subjects (1.8%) classified as responders by the original Y-BOCS were classified as non-responders using the modified version.
Discussion
In this study, we used CFA in a large sample of patients with OCD to determine the best Y-BOCS factor structure among different models previously reported in the literature. Resistance items (Obs4 and Comp4) presented the lowest factor loadings (<0.60) across the majority of models. Excluding items Obs4 and Comp4 or considering them as a separate factor resulted in better fit indexes. Furthermore, excluding these items lead to a better RMSEA value when compared to the model that considered them as a separate factor.
Evidence from previous studies has shown that resistance items may, in fact, measure a different construct when compared to other items (Anholt et al., 2010; Kim et al., 1994; Moritz et al., 2002). Adding further evidence to this argument, a recent study examined which Y-BOCS items best discriminated the reduction in total scores after 4 and 12 weeks of fluoxetine (Costa et al., 2017). Resistance items showed the lowest correlation coefficients among all items. More importantly, resistance items did not reach the correlation coefficient threshold of 0.7 set to indicate a significant contribution to reductions in the total scores at 4 and 12 weeks of treatment.
Findings derived from statistical analyses add to a growing discussion on some conceptual aspects of the Y-BOCS. Individuals with OCD who always make an effort to resist, as well as those who do not need to resist their obsessions, receive a lower score, that is, have less severe symptoms than those who willingly yield to the unwanted thoughts. In this sense, these items do not add information about the phenomena the scale is trying to measure (symptom severity). Therefore, these items may be adding noise to the Y-BOCS severity score. In our analyses, both resistance items presented the lowest correlation coefficients among all items with the OCD severity scores measured by different widely used and accepted scales (CGI—severity and improvement subscales and the DY-BOCS impairment item). These results suggest that resistance items may not explain OCD severity adequately.
Furthermore, resistance items are not in line with the current evidence-based psychological treatment for OCD, cognitive-behavioral therapy (CBT) (Stein et al., 2019). In CBT, therapists teach patients that thoughts may be uncontrollable and suggest other techniques to deal with obsessions, including cognitive reappraisal, the process of rethinking once the obsession appears rather than not thinking or resisting an obsession (Emmelkamp and Beens, 1991; Van Oppen and Arntz, 1994; Van Oppen et al., 1995). Therefore, patients reporting less resistance to obsession and/or compulsions because of treatment instructions may have higher severity scores, consequently adding measurement error.
In addition, resistance to OCD symptoms may be more related to insight, a secondary aspect of OCD. In the OCD literature, insight is related to the level of one’s ability to recognize how exaggerated, absurd and ego-dystonic are his or her OCD symptoms. It is estimated that 4–36% of OCD patients have poor or no insight about their symptoms (Catapano et al., 2010; Shavitt et al., 2014). In our study, all Y-BOCS items and the total Y-BOCS score were positively correlated with insight measured by the BABS, indicating that OCD severity is related to the level of insight. Specifically, Y-BOCS resistance to obsessions and compulsions items showed the highest correlations with the BABS total score among all items (see Supplementary Material), which could be an indicator that these items are measuring a secondary aspect of OCD, instead of OCD severity. This hypothesis should be further evaluated in future studies.
Another potential explanation for the low factor loadings of the resistance items may be related to its phrasing, response options and interpretation. Subjects need to grasp and quantify a concept that is inherently abstract. Not only can it be difficult for a patient to estimate the degree of resistance he or she can exert, but it is also highly subjective and prone to different interpretations. Available response options with unclear objective meaning (e.g. ‘most of the time’ and ‘some effort’) add another layer of subjectivity. Interestingly, the items related to time, interference and distress have response options with more clear boundaries (e.g. ‘1 to 3 hours per day’, ‘causes substantial impairment in social or occupational performance’). One potential avenue to improve factor loadings of resistance items could be rephrasing response options in order to make them more clear and objective.
In our study, even though a higher-order model excluding resistance items resulted in marginally better fit indexes, AVE and omega coefficients were slightly reduced. In addition, even when we consider the best model fit in our study, it is important to notice that fit indexes, such as RMSEA, RMSEA p-value and chi-square p-value, showed values indicating a fair to mediocre fit, especially when in comparison to other traditional scales (Uher et al., 2008; Vindbjerg et al., 2019). Previous studies also showed mediocre model fit and low to moderate factor loadings (Deacon and Abramowitz, 2005; Storch et al., 2005). The sum of the evidence suggests that OCD severity should be conceptualized and measured in an alternative way. First, OCD severity could be more adequately measured, interpreted and analyzed in two separate dimensions: obsessions and compulsions. In the context of the growing field of precision psychiatry (Fernandes et al., 2017), studying the impact of interventions on obsessions and compulsions separately may lead to findings that could help to personalize treatments. Intervention studies testing treatments for schizophrenia are an interesting example. Researchers have been able to determine which medications have a more positive impact on specific types of symptoms (Huhn et al., 2019). In the case of OCD, adaptive treatment strategies could be developed based on the impact of specific or multiple interventions on obsessions or compulsions. Also, risk factors and psychopathological trajectories may have different associations with obsessions and compulsions. Studying these differences can only be achieved by analyzing the Y-BOCS subscores separately. Using Y-BOCS subscores separately, especially in clinical trials, is not by any means a novel idea (Storch et al., 2005), but few researchers have applied and advanced this approach.
Another approach would be to start using other measures of OCD severity. The second version of the Y-BOCS (Storch et al., 2010) could be an interesting option, especially considering that the resistance to obsessions item has been removed. However, the RMSEA and CFI values reported in the first validation study of Y-BOCS-II were below the cutoff used in our study. Moreover, resistance to and control over compulsions items presented very low factor loadings. Surprisingly, despite available for almost a decade and having been translated and validated in several countries (e.g. Italy, Portugal, Thailand) (Castro-Rodrigues et al., 2018; Hiranyatheb et al., 2014; Melli et al., 2015), the Y-BOCS-II has not been systematically used worldwide, especially in the context of clinical trials. Further studies investigating its psychometric properties are warranted to understand if this version is able to measure OCD more accurately. Another interesting option would be the DY-BOCS (Rosario-Campos et al., 2006), a scale that measures the presence and severity of six distinct OCD symptom dimensions. Since OCD symptom dimensions are known to influence illness trajectory, compliance and response to treatment (Mataix-Cols et al., 2002), comorbidity profiles (Hasler et al., 2005), heritability (Hasler et al., 2007) and neurobiological correlates (Gilbert et al., 2008), among other aspects, quantifying OCD severity can be very important in clinical and research settings. The DY-BOCS has a global impairment scale comprising three items (time, distress and interference), but without items assessing resistance symptoms. However, future studies assessing the factor structure of the DY-BOCS using criteria similar to this study in a large sample are warranted.
Our findings have some implications for future OCD studies. Considering that resistance items showed low factor loadings and that removing them resulted in better fit indexes, one proposal would be to remove these items from the scale. It would reduce administration time, as well as provide scores with a better representation of OCD severity. However, a major drawback would be the inability to do direct comparisons of a Y-BOCS version without resistance items with decades of previous studies on OCD, especially clinical trials—which could be mitigated using standardized effect sizes. In addition, previously validated cutoff criteria using the Y-BOCS total score would be impacted by the removal of these items. Additional studies would be needed to adjust the cutoff criteria. As we have shown in the analyses of a sample of OCD patients that underwent evidence-based treatment, it is unlikely that treatment outcomes would be significantly impacted by the withdrawal of resistance items since the effect sizes and rate of responders were similar when results were compared with and without the resistance items.
Some limitations must be acknowledged. First, we used the Brazilian Portuguese version of the Y-BOCS, which has been translated and back-translated, but not previously validated in terms of content validity, inter-rater reliability or test–retest reliability. Although it is possible that the translation has made it difficult for evaluators and patients to understand certain items, especially items 4 and 9, these two items can be difficult to interpret, requiring standardization in the way the evaluators pose the question. However, this hypothesis is unlikely, considering that studies from diverse countries have found similar results (fair to mediocre model fit, as well as low factor loadings for these items). More importantly, the Brazilian Portuguese version has been used in several studies since the 1990s, showing consistent results, even in the context of multinational studies (Brakoulias et al., 2017, 2019; Boedhoe et al., 2017, 2018; Fouche et al., 2017; Kong et al., 2019). Furthermore, our findings derive from a multicenter study with dozens of evaluators that assessed patients with OCD in different Brazilian regions. Differences in Y-BOCS severity scores between sites is an indicator of sample heterogeneity. However, these differences may be directly related to discrepancies between sample sizes of study sites (ranging from n = 37 to n = 430). Considering our objective is to identify the best factor structure of the Y-BOCS severity ratings, not infer causation between variables and outcomes, heterogeneity between study sites in our study could be considered a strength since our sample is more similar to a real-world setting. Moreover, even though all evaluators involved in the assessment across all sites underwent an extensive reliability training and on-site supervision by senior experts in OCD research, changes in reliability among evaluators over time were not recorded, making it difficult to assess the impact of putative reliability changes on the measurements.
We have investigated the factor structure of the Y-BOCS to determine the best model fit in a large sample of OCD patients. Resistance items (Obs4 and Comp4) presented low factor loadings even in models with better fit indexes. Excluding these items or considering them as a separate factor resulted in better fit indexes. A higher-order model excluding these items led to marginally better model fit indexes. We emphasize that our findings showed fit indexes indicating mediocre to fair models. It seems relevant to the OCD field to propose further improvements in the Y-BOCS and/or to continue in the search for better measures of OCD severity, preferably measures that could exert a positive impact in clinical decision making.
Supplemental Material
Supplementary_Material – Supplemental material for Is it time to change the gold standard of obsessive-compulsive disorder severity assessment? Factor structure of the Yale-Brown Obsessive-Compulsive Scale
Supplemental material, Supplementary_Material for Is it time to change the gold standard of obsessive-compulsive disorder severity assessment? Factor structure of the Yale-Brown Obsessive-Compulsive Scale by Daniel Fatori, Daniel LC Costa, Fernando R Asbahr, Ygor A Ferrão, Maria Conceição Rosário, Euripedes C Miguel, Roseli G Shavitt and Marcelo C Batistuzzo in Australian & New Zealand Journal of Psychiatry
Footnotes
Acknowledgements
We thank the Brazilian Research Consortium on Obsessive-Compulsive Spectrum Disorders (C-TOC) researchers and leaders. We also thank Professor Diógenes de Souza Bido from Mackenzie Presbyterian University for providing statistical analysis support during the conceptual stage of the study.
Declaration of Conflicting Interests
The author(s) declared no potential conflicts of interest with respect to the research, authorship and/or publication of this article.
Ethical Standards
The authors assert that all procedures contributing to this work comply with the ethical standards of the relevant national and institutional committees on human experimentation and with the Helsinki Declaration of 1975.
Funding
The author(s) received no financial support for the research, authorship and/or publication of this article.
Availability of Data and Materials
The data that support the findings from this study are available upon request. After receiving a reasonable request, the Brazilian Research Consortium on Obsessive-Compulsive Spectrum Disorders board/committee will proceed with the decision of sharing the data.
Supplemental Material
Supplemental material for this article is available online.
References
Supplementary Material
Please find the following supplemental material available below.
For Open Access articles published under a Creative Commons License, all supplemental material carries the same license as the article it is associated with.
For non-Open Access articles published, all supplemental material carries a non-exclusive license, and permission requests for re-use of supplemental material or any part of supplemental material shall be sent directly to the copyright owner as specified in the copyright notice associated with the article.