
Abstract
Background:
Lithium remains the gold standard treatment for bipolar disorder. However, it has a very narrow therapeutic index (0.6–0.8 mmol/L). It has been suggested that high environmental temperature can lead to dehydration, elevated plasma lithium concentration and then lithium toxicity.
Objectives:
We aimed to investigate the effect of seasonal and short-term changes in temperature on serum lithium concentrations in Sydney, Australia.
Methods:
We retrospectively analysed data from all patients who had serum lithium concentrations taken from the Prince of Wales and Sutherland Hospitals between 2008 and 2018. Temperature data came from the Bureau of Meteorology. We examined correlations between lithium concentrations and the preceding 5 days maximum temperatures, month and season. We also performed a longitudinal analysis of the effect of temperature and seasons within selected patients who had repeated levels.
Results:
A total of 11,912 serum lithium concentrations from 2493 patients were analysed. There was no significant association between higher lithium concentration and preceding higher temperatures (r = –0.008, p = 0.399). There was also no important seasonal or monthly variation, across all patients or in the smaller cohort with longitudinal data (n = 123, r = 0.008, 95% confidence interval: [–0.04, 0.06]).
Conclusion:
There were no clinically important differences in serum lithium concentration related to seasons, months or temperatures, which suggests that patients on lithium are able to adequately maintain hydration during hot weather in Sydney.
Background
Lithium remains the gold standard for the treatment and prophylaxis of bipolar affective disorder (BPAD) as stated in clinical practice guidelines of over 12 countries and international bodies (Malhi et al., 2017) for over 60 years. It is also indicated in schizoaffective disorder, recurrent major depressive disorder and antidepressant non-responders (Haussmann et al., 2015). However, lithium has a narrow therapeutic index and range of 0.8–1.2 mmol/L in acute phase and 0.5–0.8 mmol/L in maintenance phase (Malhi et al., 2016). It also has a very significant adverse effect profile in therapeutic doses and a risk of irreversible neurotoxicity with much higher concentrations (Geddes et al., 2004; Gershon et al., 2009). Maintaining patients within the therapeutic range reduces these risks.
The key predisposing factor to the development of chronic lithium toxicity is dehydration. A link between high temperatures, elevated serum lithium concentrations and increased incidence of drug toxicity has been demonstrated in some studies from the Northern Hemisphere (Bakim et al., 2013; Beersma et al., 2002; Cusin et al., 2002; Medhi et al., 2008; Wilting et al., 2007). High temperatures can change blood flow distribution and total body water, thereby altering lithium pharmacokinetics, including absorption, distribution and elimination (Hajat et al., 2010; Vanakoski and Seppälä, 1998). Specifically, renal elimination of lithium could be reduced during dehydration as water homeostasis would promote lower renal blood flow, increased reabsorption and reduced urine output.
This study aimed to determine the relationship between ambient temperatures, months, seasons and lithium concentration in patients from Sydney, Australia.
Methods
Design and setting
We conducted a retrospective review of serum lithium concentrations obtained from the SEATS (South Eastern Area Toxicology Service) and NSWHP (NSW Health Pathology) databases and the corresponding medical records from patients managed at the Prince of Wales and Sutherland Hospitals. Patient data were entered into a Microsoft Access database and included patient demographics, lithium doses, medications, comorbidities, serum lithium concentrations, clinical features and outcome. The data were collected by one researcher (S.C.) who was not blinded to the aims of the study.
Temperature data, sourced from the nearest meteorological site (within 15 km of both hospitals) of the Australian Bureau of Meteorology, was recorded as follows: first, for samples taken after midday, the maximum temperature on the day of collection was recorded; for samples taken before midday, the maximum temperature of the previous day was recorded. Second, the average daily maximum temperature of the 5 days prior to the date of collection was recorded. Third, season and month of collection was recorded (as done in previous studies examining seasonal effects: Bakim et al., 2013; Beersma et al., 2002; Cusin et al., 2002; Medhi et al., 2008; Wilting et al., 2007). Seasonal transitions were marked by March 21 (Autumn), June 21 (Winter), September 21(Spring) and December 21(Summer).
We excluded some data from the analysis of seasonal/temperature effects:
Serum lithium concentrations indicating non-adherence (<0.3 mmol/L),
All data on documented accidental or intentional lithium overdoses,
Data on the repeated concentrations over a short time frame due to monitoring following an elevated concentration,
Sampling error (e.g. lithium heparin tube used),
A lack of medical records.
Thirteen randomly selected patient chart reviews were conducted and cross-checked by an objective third party to confirm the accuracy and reliability of initial data collection. No significant variances were found.
Longitudinal study of seasonal effect on serum lithium concentration
The longitudinal data was analysed by selecting people with lots of lithium samples (⩾15). Then, the difference from that individual’s overall mean lithium concentration across all their samples was calculated for each test (excluding those with a gap of less than 14 days from the prior test). We then calculated the Pearson’s correlation between all those differences for each sample and the temperature on the day of those samples. Note that the recommended maintenance serum lithium concentration reported by the laboratory changed on 25 January 2017 from 0.6–1.0 mmol/L to 0.5–0.8 mmol/L.
Statistical analysis
Statistical analysis was conducted using the Statistical Packages for the Social Sciences (SPSS). The associations between serum lithium concentrations and temperature variables were investigated using Pearson correlation analysis. As data were generally positively skewed, we analysed data using non-parametric tests (Kruskal–Wallis and Mann–Whitney tests).
The protocol was submitted to the Human Research Ethics Committee (HREC) and was assessed as a quality improvement project (Ref Number: 17/201). Consent from patients was not required.
Results
Seasonal and temperature effect on serum lithium levels
From 2008 to 2018, there were 11,912 serum lithium concentrations taken from 2493 patients (Table 1), after excluding 3168 samples for various reasons (Figure 1). This patient cohort included 1071 patients with lithium concentrations ⩾1.3 mmol/L. The median age was 45 years (range: 11–97 years). There were more females (51.9%) than males (39.5%); 8.6% of the samples did not have a corresponding gender recorded. The median serum lithium concentration was 0.7 mmol/L (interquartile range [IQR]: 0.5–0.9; range: 0.3–3.6). The number of samples recorded for each patient varied significantly, ranging from 1 to 323 records (median = 2, IQR: 1–4).
Distribution of serum lithium concentrations (N = 11,912) and maximal daily temperatures from 2008 to 2018.
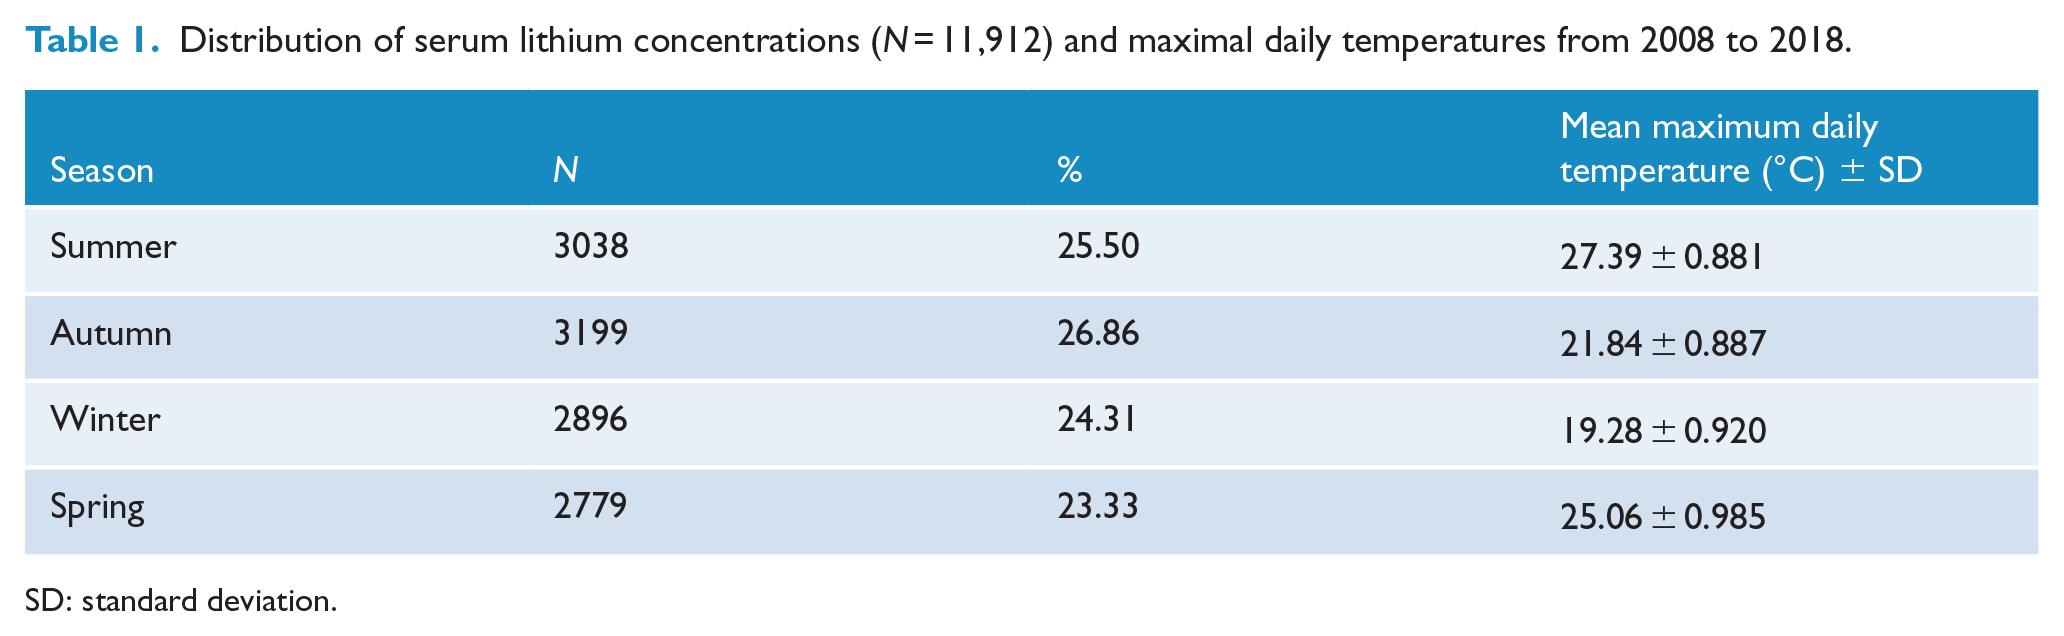
SD: standard deviation.
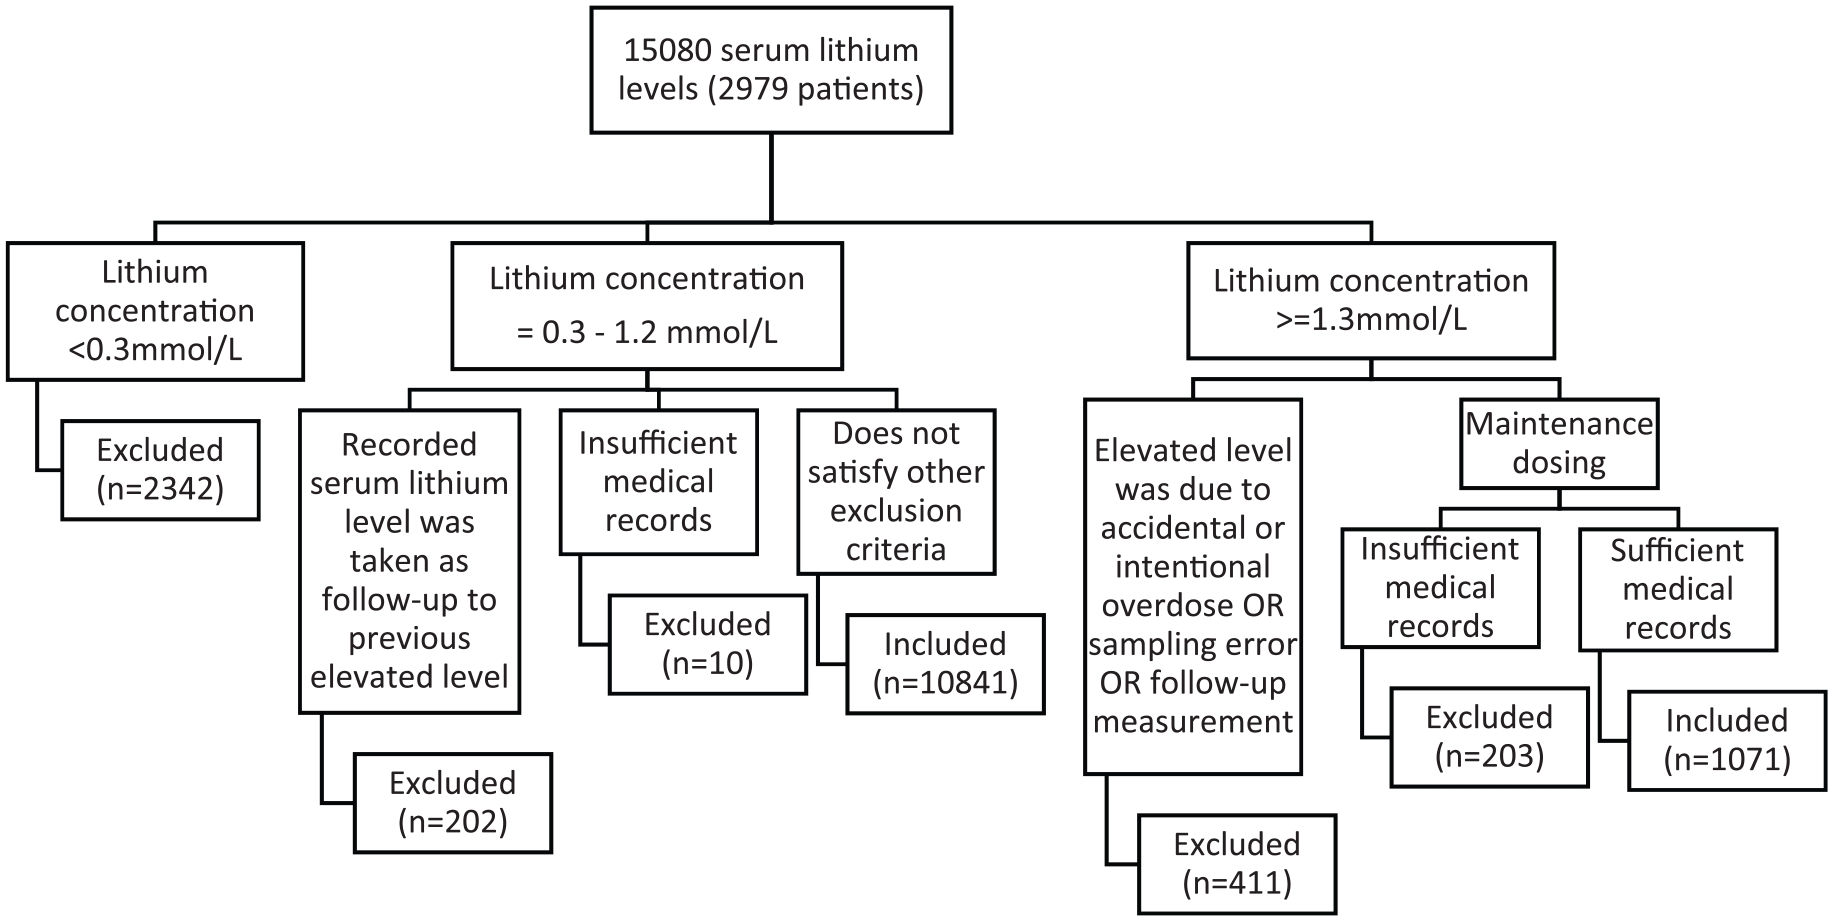
Patient selection flowchart – all years 2008–2018.
Pearson correlation showed no correlation between lithium concentration and temperature on the day of presentation (r = –0.008, n = 11,912, p = 0.399) and the average maximum daily temperature of the 5 days prior to admission (r = –0.007, p = 0.454). The median lithium concentration remained stable at 0.7 mmol/L in all seasons (Figure 2). There was also no important change in distribution across months (Figure 3). There was no correlation between serum lithium concentration and age (r = 0.003, p = 0.755), but there were slightly higher concentrations in females (median = 0.7 mmol/L for females vs 0.6 mmol/L for males, difference = 0.1 mmol/L, p < 0.001) (Figure 4). There was no relationship between the proportion of toxic (⩾1.3) or high (0.9–1.2) concentrations and higher temperatures (p = 0.97, chi-square test) (Figure 5).
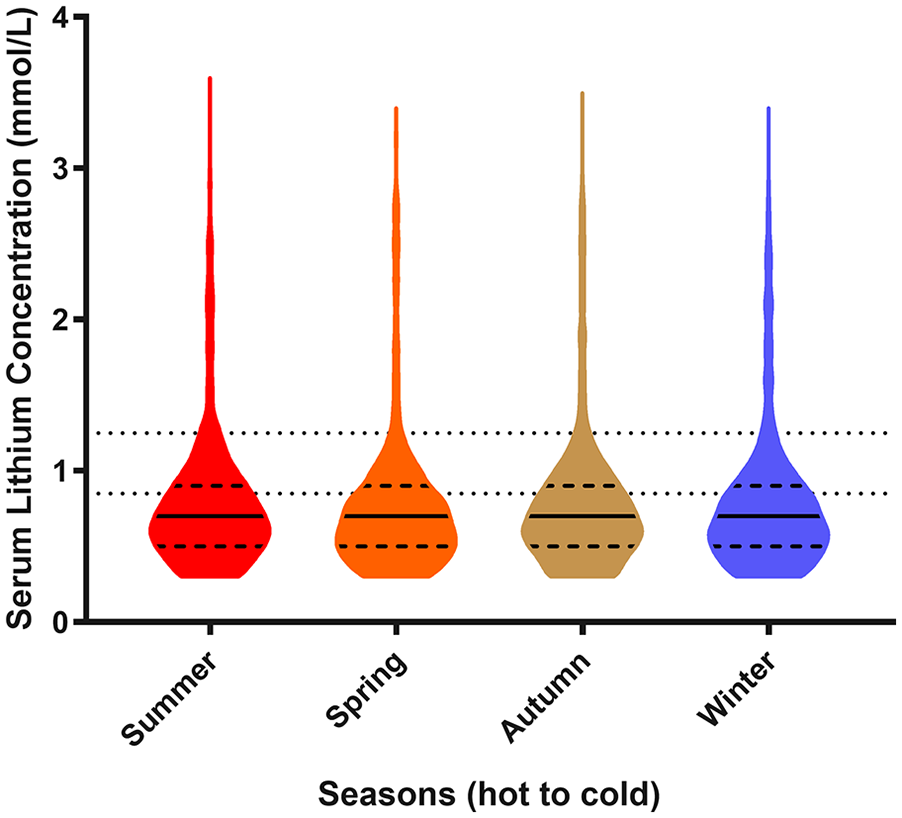
Violin plots of 11,912 serum lithium measurements across seasons.
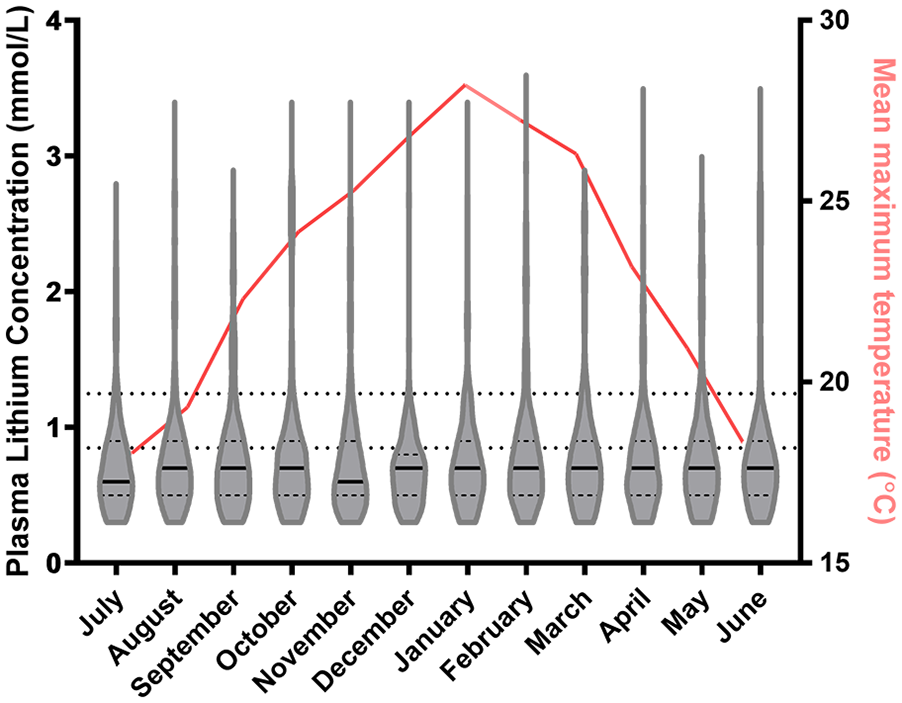
Monthly mean temperature and violin plots of 11,912 serum lithium measurements across different months.
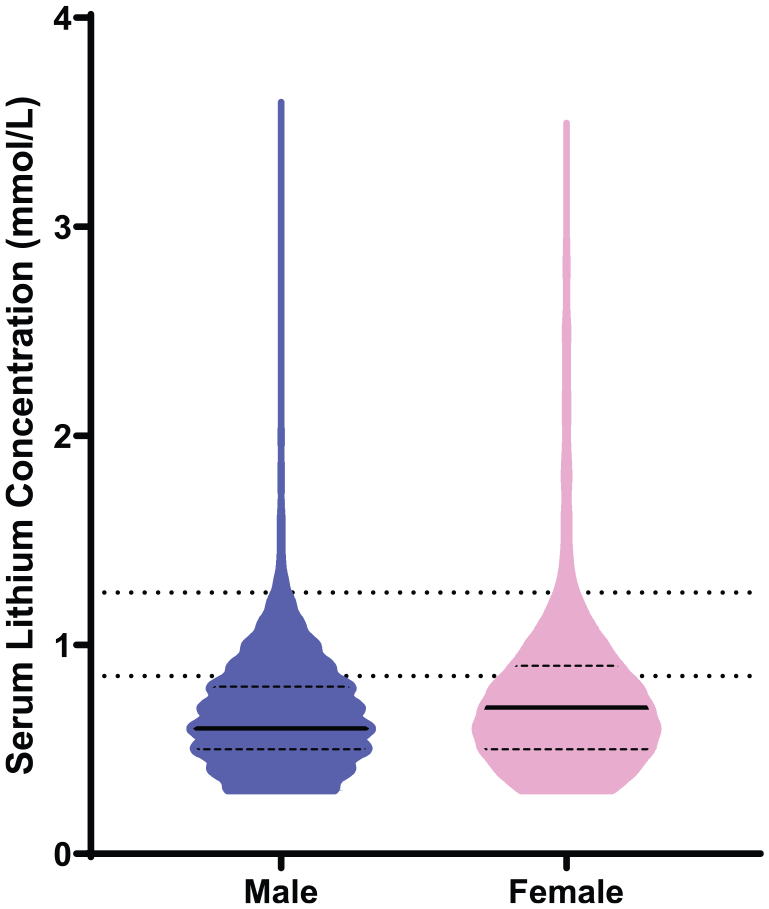
Violin plots of serum lithium concentration from 11,912 serum lithium measurements for males and females.
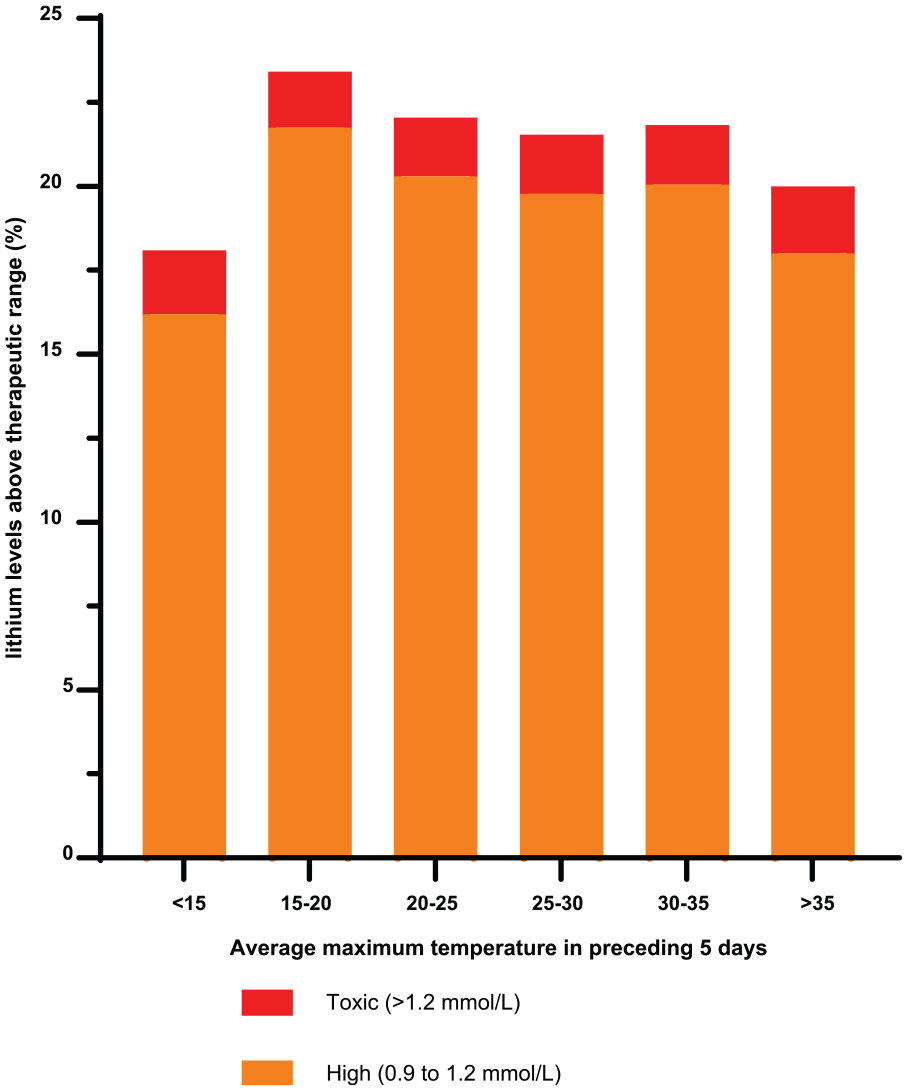
Distribution of temperature for toxic and high non-toxic serum lithium concentrations.
Longitudinal study of seasonal effect on serum lithium concentration
A total of 123 patients met the criteria to be included in the longitudinal study. The median age was 43 years (range: 18–84 years), with 58% females (n = 72) and an average mean lithium concentration of 0.69 mmol/L (standard deviation [SD]: 0.10). There were no directional fluctuations in these individual’s serum lithium according to daily temperature, r = 0.008 (95% confidence interval [CI] = [–0.04, 0.06]) (Figure 6).
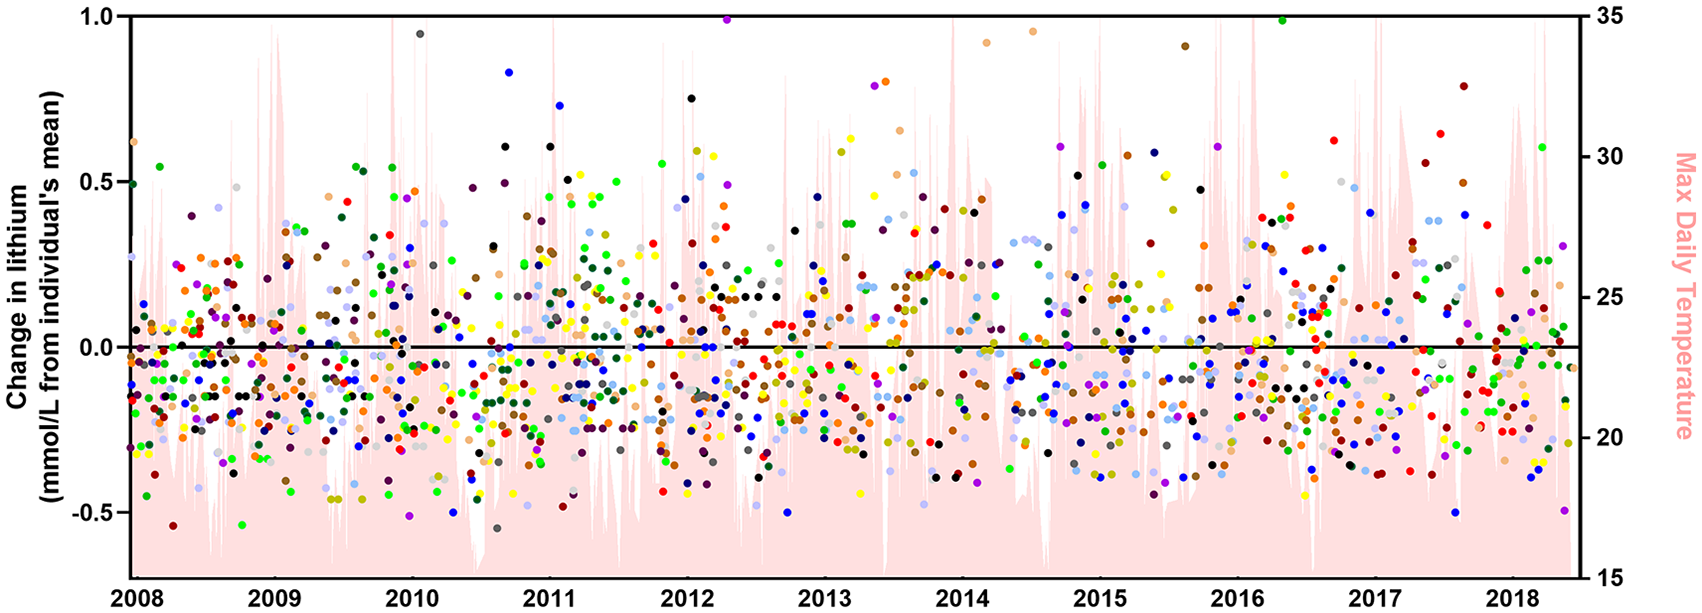
A longitudinal plot of lithium concentration versus time. There were 123 patients with >15 lithium concentrations taken.
Discussion
This is the first Australian study to explore the seasonal- and temperature-dependent variation in lithium concentrations. In contrast to previous European and Indian studies, we found no important differences over the years (Figures 2 and 5). These studies found higher serum lithium concentrations in summer months compared to winter/autumn with a variability between seasons of 25% in India (Medhi et al., 2008), 12% in Turkey (Bakim et al., 2013), 10% in Italy (Cusin et al., 2002) and 2–5% in the Netherlands (Beersma et al., 2002; Wilting et al., 2007). However, little clinical significance was demonstrated despite these reported differences. Cusin et al. (2002) determined there was no relationship between serum lithium and mood (Spearman rank correlation coefficient > 0.05) and levels of mania and hypomania were not increased with lower lithium concentrations. Wilting et al. (2007) reported that a temperature difference of 10°C conferred a change of only 0.008 mmol/L in the Netherlands. The lower variability in the Netherlands was argued to be due to its temperate climate compared to the hotter summers in India (Medhi et al., 2008) and Italy (Cusin et al., 2002). We suggest a similar rationalisation when considering the results found in Sydney. There is a lower median for the average seasonal temperatures and smaller range in Sydney (median: 23.9°C, range: 19.9°C–28.7°C) when compared to Chandigarh (median: 24.3°C, range: 15.7°C–30.3°C) in 2017. Furthermore, the relative affluence of Sydney (and the Netherlands) and air-conditioning may mean that most patients can avoid suffering from the full extent of ambient temperature fluctuations. Other interventional strategies, such as use of fans, and increased oral intake of fluids (Wilting et al., 2007) may also be useful. These suggest local success in preventing heat-related exacerbation of lithium toxicity. It is possible that patient education may help to minimise episodes of dehydration and could therefore avoid the fluctuations of lithium concentration with changes in ambient temperature. Conversely, reduced intake of fluid in colder months and higher rates of viral infections may have counterbalanced a positive summer trend.
Seasonal variation in hospital admissions from mood and behaviour disorders have been observed in the Northern (Amr and Volpe, 2012; Morken et al., 2002; Wang et al., 2014) and Southern hemispheres (Mulder et al., 1990; Parker and Graham, 2016; Sayer et al., 1991). This may affect serum lithium concentrations due to self-adjusted dosing or increased prescription. Specifically for BPAD patients, increased admissions for mania and self-reported fluctuations in mood have been reported in spring, summer and with higher ambient temperatures (Amr and Volpe, 2012; Clarke et al., 1999; Medici et al., 2016; Shapira et al., 2004; Shin et al., 2005). It is unclear if this might explain some of the positive seasonal associations seen in other studies.
We observed higher median lithium concentrations in females compared to males (Figure 4). This might indicate differences in drug pharmacokinetics and pharmacodynamics. Generally, females have a smaller volume of distribution, higher sensitivity as a result of altered receptor number and binding, and lower clearance (Soldin and Mattison, 2009). If similar doses are given, then larger volume of distribution is sufficient to explain the higher concentrations. For example, for a given 1 g lithium carbonate dose (equivalent to 27 mmol lithium), the respective estimated lithium concentration will be estimated to be 0.5 mmol/L for male (median body weight for male: 86 kg, Vd: 0.6 L/kg) and 0.76 mmol/L for females (median body weight for female: 71 kg, Vd: 0.5 L/kg) (Australian Bureau of Statistics, 2013).
Limitations
As with any retrospective study, there were limitations in the accuracy and completeness of patient medical records. However, only 1.7% of the lithium concentrations were excluded from analysis on this basis. There was also a decrease in the recommended lithium therapeutic range in Australia from 25 January 2017 onwards, from 0.6–1.0 mmol/L to 0.5–0.8 mmol/L. The median lithium concentration was 0.7 mmol/L (IQR: 0.5–0.9, range: 0.3–3.6) before 25 January 2017 and the median lithium concentration dropped to 0.6 mmol/L after 25 January 2017 (IQR: 0.5–0.8, 0.3–3.3). This result suggests that clinicians did adjust lithium dosage in accordance with the therapeutic range advised. We examine temperature over 1- and 5-day time frames and also month and season. Previous studies of health effects of temperature have used 1 day (Rej et al., 2014; Wang et al., 2014; Wilting et al., 2007), 3 days (Ye et al., 2012), 5–10 days (Gasparrini and Armstrong, 2010) or even a month (Chang et al., 2004). However, there is no established time frame for higher temperatures to have an impact on health outcomes, generally or for this particular problem. We found no differences over any of our four time frames; we believe it is unlikely that we have missed an important effect.
Conclusion
We found no clinically important correlation between serum lithium concentrations and short-term or seasonal variation in temperature. This may indicate the success of current strategies to minimise risk from heat-related lithium toxicity.
Footnotes
Acknowledgements
We would like to thank Professor Boaz Shulruf for his statistical advice; Mr Soloman Saleh and the medical records administration staff at the Prince of Wales and The Sutherland Hospitals. They facilitated the completion of this study which would not have been possible without their help.
Declaration of Conflicting Interests
The author(s) declared no potential conflicts of interest with respect to the research, authorship and/or publication of this article.
Funding
The author(s) received no financial support for the research, authorship and/or publication of this article.