
Abstract
Objective:
This study used machine learning techniques combined with peripheral biomarker measurements to build signatures to help differentiating (1) patients with bipolar depression from patients with unipolar depression, and (2) patients with bipolar depression or unipolar depression from healthy controls.
Methods:
We assessed serum levels of interleukin-2, interleukin-4, interleukin-6, interleukin-10, tumor necrosis factor-α, interferon-γ, interleukin-17A, brain-derived neurotrophic factor, lipid peroxidation and oxidative protein damage in 54 outpatients with bipolar depression, 54 outpatients with unipolar depression and 54 healthy controls, matched by sex and age. Depressive symptoms were assessed using the Hamilton Depression Rating Scale. Variable selection was performed with recursive feature elimination with a linear support vector machine kernel, and the leave-one-out cross-validation method was used to test and validate our model.
Results:
Bipolar vs unipolar depression classification achieved an area under the receiver operating characteristics (ROC) curve (AUC) of 0.69, with 0.62 sensitivity and 0.66 specificity using three selected biomarkers (interleukin-4, thiobarbituric acid reactive substances and interleukin-10). For the comparison of bipolar depression vs healthy controls, the model retained five variables (interleukin-6, interleukin-4, thiobarbituric acid reactive substances, carbonyl and interleukin-17A), with an AUC of 0.70, 0.62 sensitivity and 0.7 specificity. Finally, unipolar depression vs healthy controls comparison retained seven variables (interleukin-6, Carbonyl, brain-derived neurotrophic factor, interleukin-10, interleukin-17A, interleukin-4 and tumor necrosis factor-α), with an AUC of 0.74, a sensitivity of 0.68 and 0.70 specificity.
Conclusion:
Our findings show the potential of machine learning models to aid in clinical practice, leading to more objective assessment. Future studies will examine the possibility of combining peripheral blood biomarker data with other biological data to develop more accurate signatures.
Introduction
Bipolar disorder (BD) and major depressive disorder (MDD) are among the main contributors to the global burden of diseases (Collins et al., 2011; World Health Organization [WHO], 2017), with a prevalence of 2.4% and 16.2% worldwide, respectively (Merikangas et al., 2011; Kupfer et al., 2012). Only 20% of the patients with BD who experience a depressive episode are correctly diagnosed within the first year of seeking treatment (Goldberg et al., 2001). In addition, it has been shown that 40% of bipolar patients are usually first diagnosed with MDD (Ghaemi et al., 2001), and latency from illness onset to diagnosis and appropriate treatment for BD patients averages 5–10 years (Baldessarini et al., 2007). These are important findings since patients with BD are much more likely to present to clinicians when they are depressed in outpatient settings (Hirschfeld et al., 2005; Swartz et al., 2012). Moreover, these findings also suggest that the current diagnostic system, which is based only on subjective clinical judgments, lacks the required sensitivity and specificity to differentiate patients with bipolar depression from unipolar depression.
According to Diagnostic and Statistical Manual of Mental Disorders (5th ed.; DSM-5), there are no differences between diagnostic criteria for major depressive episodes in the context of unipolar depression or bipolar depression (American Psychiatric Association [APA], 2013). Because the treatment approach for these conditions is quite different, it is crucial that they can be differentiated and properly addressed to. There is clinical data suggesting a few differences across these disorders. For instance, patients with BD were more likely to have a younger age of onset of depression, higher rates of suicide attempts, hypersomnia, mood relapse (Angst et al., 2003), weight gain, leaden paralysis and interpersonal rejection sensitivity (Amsterdam et al., 2000), as well as more comorbid anxiety, physical complaints and anger (Bowden, 2005), compared to patients with unipolar depression. However, these clinical features lack the needed accuracy to precisely identify patients with BD from patients with MDD.
Prior studies in depressed patients have looked into several biomarkers based on the pathophysiology of these disorders, such as immune dysfunction, alterations in oxidative stress parameters and neuroplasticity (Domenici and Muglia, 2007; Fernandes et al., 2009; Szczepankiewicz et al., 2014). In this sense, the peripheral changes in cytokines, the content of lipid peroxidation, oxidative damage to proteins and neurotrophic factors have been consistently associated with mood disorders (Berk et al., 2011; Black et al., 2015; Köhler et al., 2017; Modabbernia et al., 2013; Pfaffenseller et al., 2013; Rosenblat et al., 2014). However, what is not known is how such biological underpinnings interact to determine mood disorders and whether they can play a role in differentiating bipolar depression from unipolar depression. Lack of such knowledge is an important research question given that clinical observations are subjective in nature and often inaccurate, leading to delayed treatment or inadequate exposure to potentially harmful treatments (Nasrallah, 2015). Based on these previous findings, in this study, we selected inflammatory markers (interleukin [IL]-2, IL-4, IL-6, IL-10, tumor necrosis factor-α [TNF-α], interferon-γ [IFN-γ], IL-17A), oxidative stress markers (lipid peroxidation and oxidative protein damage) and a neurotrophic marker (brain-derived neurotrophic factor [BDNF]) since these biological markers have been shown to be changed in both disorders during depressive episodes.
Machine learning, also known as pattern recognition, represents a range of computational techniques used to analyze complex data by identifying patterns of interaction among several variables (Passos et al., 2016a). The use of these techniques has been increasing in the psychiatric field in the past years and may provide predictive models for clinical practice with the potential to improve diagnosis and treatment (Librenza-Garcia et al., 2017). Recently, a composite biomarker was able to discriminate moderately well between patients with rapid-cycling BD and healthy control (HC) individuals and between a manic and a depressed state (Munkholm et al., 2019). Moreover, studies have used neuroimaging to distinguish between bipolar and unipolar depression using machine learning algorithms (Fung et al., 2015; Redlich et al., 2014). Nonetheless, to our knowledge, there are no machine learning studies so far who were able to differentiate these disorders using peripheral biological markers. In this sense, we used machine learning combined with peripheral biomarker measurements to build clinically useful signatures to help differentiate (1) patients with bipolar depression from patients with unipolar depression and (2) patients with bipolar depression or unipolar depression from HC. We hypothesize that patients with unipolar and bipolar depression will present different biomarker signatures using a machine learning approach.
Methods
Patients
We selected a total of 54 patients with bipolar depression and 54 patients with unipolar depression. Subjects with bipolar depression were recruited at the Bipolar Disorders Program (PROTAHBI) and patients with unipolar depression at the Mood Disorders Program (PROTHUM), two specialized outpatient programs from Hospital de Clinicas de Porto Alegre (HCPA), Brazil. We also recruited 54 HC with no previous history of psychiatric illness and no history of psychiatric or neurologic disorders in first-degree relatives. All three groups were paired according to age and sex. Exclusion criteria included the history of autoimmune diseases or a history of chronic infection/inflammatory disorders, any severe systemic disease, or use of immunosuppressive therapy.
The diagnosis of BD and unipolar depression were performed according to the diagnostic criteria of Structured Clinical Interview for DSM-IV-Axis I (SCID-I). Depressive symptoms were evaluated using the Hamilton Depression Rating Scale (HDRS; Hamilton, 1960), where patients with a score higher than seven were considered in a depressive episode (Zimmerman et al., 2013). The ethics committee of HCPA approved this protocol (number 11-0176), and all subjects provided their written informed consent before inclusion in the study. All biochemical experiments were performed at the Laboratory of Molecular Psychiatry, HCPA.
Collection and processing of blood
Ten milliliters of blood were collected from each patient and HC included in the study by venipuncture into a free-anticoagulant vacuum tube. Immediately after the withdrawal, the blood was centrifuged at 4000 r/min for 10 minutes, and serum was aliquoted, labeled and stored at −80°C until assayed.
Cytokine assay
The concentration of serum cytokines was determined by flow cytometry using the BD™ Cytometric Bead Array (CBA) Th1/Th2/Th17 Human Cytokine kit (BD Biosciences, San Diego, CA). The CBA kit employed allows the discrimination of the following cytokines: IL-2, IL-4, IL-6, IL-10, TNF-α, IFN-γ and IL-17A. Sample processing and data analysis were performed following the manufacturer’s guidelines. Briefly, serum samples were incubated with the seven cytokine capture beads for 1.5 hours, then washed and incubated for 1.5 hours with PE-conjugated detection antibodies, both incubations at room temperature (RT) and protected from light. Afterward, samples were washed and sample data were acquired using a FACSCalibur flow cytometer (BD Biosciences). Results were generated in a graphical and tabular format using the BD CBA Analysis Software FCAP Array™ (BD Biosciences).
BDNF measurement
Serum concentrations of BDNF were measured by sandwich-ELISA assay using monoclonal antibodies specific for BDNF from R&D Systems (Minneapolis, MN). Human BDNF MAb (Clone 37129) was used as the capture antibody, and the human BDNF biotinylated MAb (Clone 37141) was used as the detection antibody. Briefly, microtiter plates (96-well flat-bottom) were coated overnight with the monoclonal anti-BDNF antibody at 4 µg/mL in phosphate-buffered saline (PBS). Then, plates were washed with wash buffer (PBS, pH 7.4, with 0.05% Tween 20) and were blocked for 1 hour at RT with PBS containing 5% nonfat milk powder. After washing, plates were coated for 2 hours with the samples diluted 1:200 in sample diluent (PBS with 1% bovine serum albumin) and a standard curve ranged from 7.8 to 500 pg/mL of BDNF. Plates were washed and a biotinylated anti-BDNF antibody (0.2 µg/mL) was added, which was incubated for 2 hours. After washing, incubation with streptavidin–peroxidase conjugate (diluted 1:200 in sample diluent) for 20 minutes at RT was performed. Afterward, plates were washed and incubated with a substrate solution, followed by stop solution (H2SO4 1 M). After 20 minutes of incubation, the amount of BDNF was determined by absorbance at 450 nm with correction at 540 nm. The standard curve demonstrated a direct relationship between optical density and BDNF concentration.
Thiobarbituric acid reactive substances assay
The levels of lipid peroxidation were measured by the method of TBARS (thiobarbituric acid reactive substances) using the TBARS assay kit (Cayman Chemical Company, Ann Arbor, MI), according to the manufacturer’s instructions. In this method, the quantification of lipid peroxidation products is performed by plasma formation of substances reacting to thiobarbituric acid, which is the analysis of the final products of lipid peroxidation (lipid peroxides, malondialdehyde and other aldehydes of low molecular weight) that react with 2-thiobarbituric acid (TBA) form Schiff bases. These complexes exhibit color and its concentration were determined spectrophotometrically at 535 mm. The results are expressed in µM of MDA.
Protein carbonyl content
Oxidative damage to proteins was analyzed by the determination of carbonyl groups (PCC method—carbonyl content in proteins), as previously described by Levine et al. (1990). This method is based on the reaction of carbonyl groups of proteins with dinitrophenylhydrazine reagent (DNPH) to form Schiff bases that absorb at 380 nm wavelength. Analyses were performed in serum samples and the values expressed in nmol/mg of protein.
Statistical analysis
Statistical analysis was performed using Statistical Product and Service Solutions (SPSS) Version 18.0. The normality of data distribution was assessed with the Shapiro–Wilk test (Shapiro and Wilk, 1965). One-way analysis of variance (ANOVA) followed by Tukey post hoc test was used for comparison of parametric variables, and the Kruskal–Wallis test was used for non-parametric variables. The quantitative variables were expressed as mean ± standard deviation or median and interquartile range (25th–75th percentiles) according to the samples’ distribution. In all experiments, p-values less than 0.05 were considered to indicate statistical significance.
Machine learning approach
We used the caret package in R version 6.0-73 to create three predictive models to distinguish bipolar depression, unipolar depression and HC in a pairwise fashion. The input variables in the model consisted in 10 serum biomarkers (IL-2, IL-4, IL-6, IL-10, TNF-α, IFN-γ, IL-17A, BDNF, the content of lipid peroxidation by TBARS assay and oxidative damage to proteins assessed by carbonyl levels), that were selected according to previous knowledge in the field (Black et al., 2015; Köhler et al., 2017; Modabbernia et al., 2013; Pfaffenseller et al., 2013; Rosenblat et al., 2014).
Feature selection was performed with recursive feature elimination, a multivariate wrapper technique in which we train multiple classifiers on subsets of features, eliminating those that rank lower in the variable importance and retaining the ones that improve the model. New models are successively constructed with the relevant variables that remain until it reaches a termination criterion or the model experiences performance degradation (Guyon and Elisseeff, 2003; Mwangi et al., 2014). Feature selection can be used to increase model performance, eliminating variables not relevant for the model and to improve applicability (Lantz, 2015).
To train the models we used a support vector machine (SVM) algorithm with a linear kernel. SVM processes the input variables into a similarity matrix through a ‘kernel mapping’ procedure, which is used in the learning process (Guyon et al., 2002). There was no restriction on the number of variables that the model could select. No further analysis was needed for correcting the class imbalance, as the outcome classes had the same number of subjects.
To validate the model, we used a leave-one-out cross-validation. In this procedure, we train the model with all but one subject, which is left out of the analysis to be used as the testing data set (Cristianini and Shawe-Taylor, 1999). To evaluate model performance, we obtained the area under the receiver operating characteristics (ROC) curve (AUC), sensitivity and specificity, as well as the number of selected variables, for the best model for each comparison.
Results
Demographic and clinical variables are presented in Table 1. There were no significant differences regarding the degree of depressive symptoms (HDRS scores) or duration of illness between the two groups of patients. All patients were on psychiatric medications (mood stabilizers, antipsychotics, benzodiazepines and/or antidepressants). More than 50% of individuals with bipolar depression were using lithium, while over 90% of patients with unipolar depression were taking antidepressants.
Clinical and demographic characteristics.
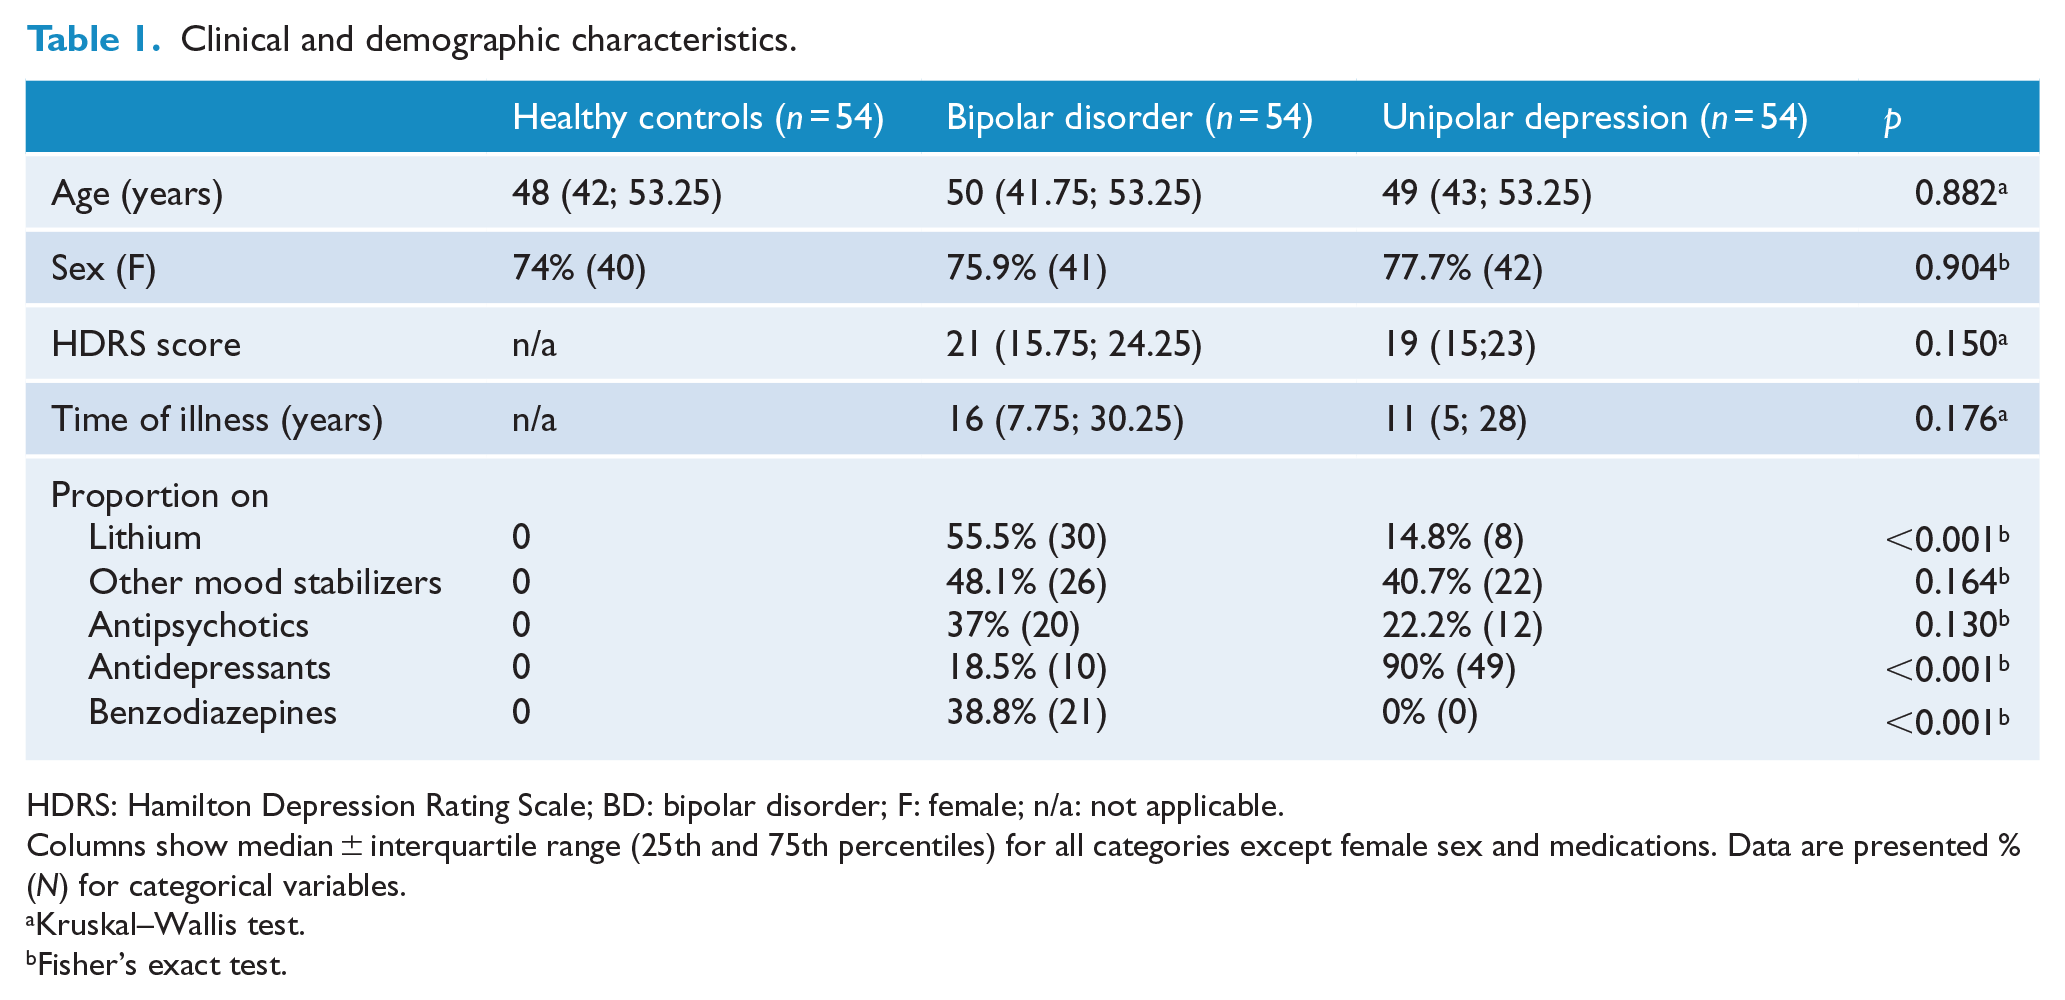
HDRS: Hamilton Depression Rating Scale; BD: bipolar disorder; F: female; n/a: not applicable.
Columns show median ± interquartile range (25th and 75th percentiles) for all categories except female sex and medications. Data are presented % (N) for categorical variables.
Kruskal–Wallis test.
Fisher’s exact test.
The machine learning analysis showed that bipolar vs unipolar depression classification achieved an AUC of 0.69, with 0.62 sensitivity and 0.66 specificity using three selected biomarkers (IL-4, TBARS and IL-10) (Figure 1). For the comparison bipolar depression vs HC, the model retained five variables (IL-6, IL-4, TBARS, carbonyl and IL17-A), with AUC 0.70, 0.62 sensitivity and 0.70 specificity (Figure 2). Finally, unipolar depression vs HC comparison retained seven variables (IL-6, carbonyl, BDNF, IL-10, IL17-A, IL-4 and TNF-α), with AUC of 0.74, a sensitivity of 0.68 and 0.70 specificity (Figure 3).
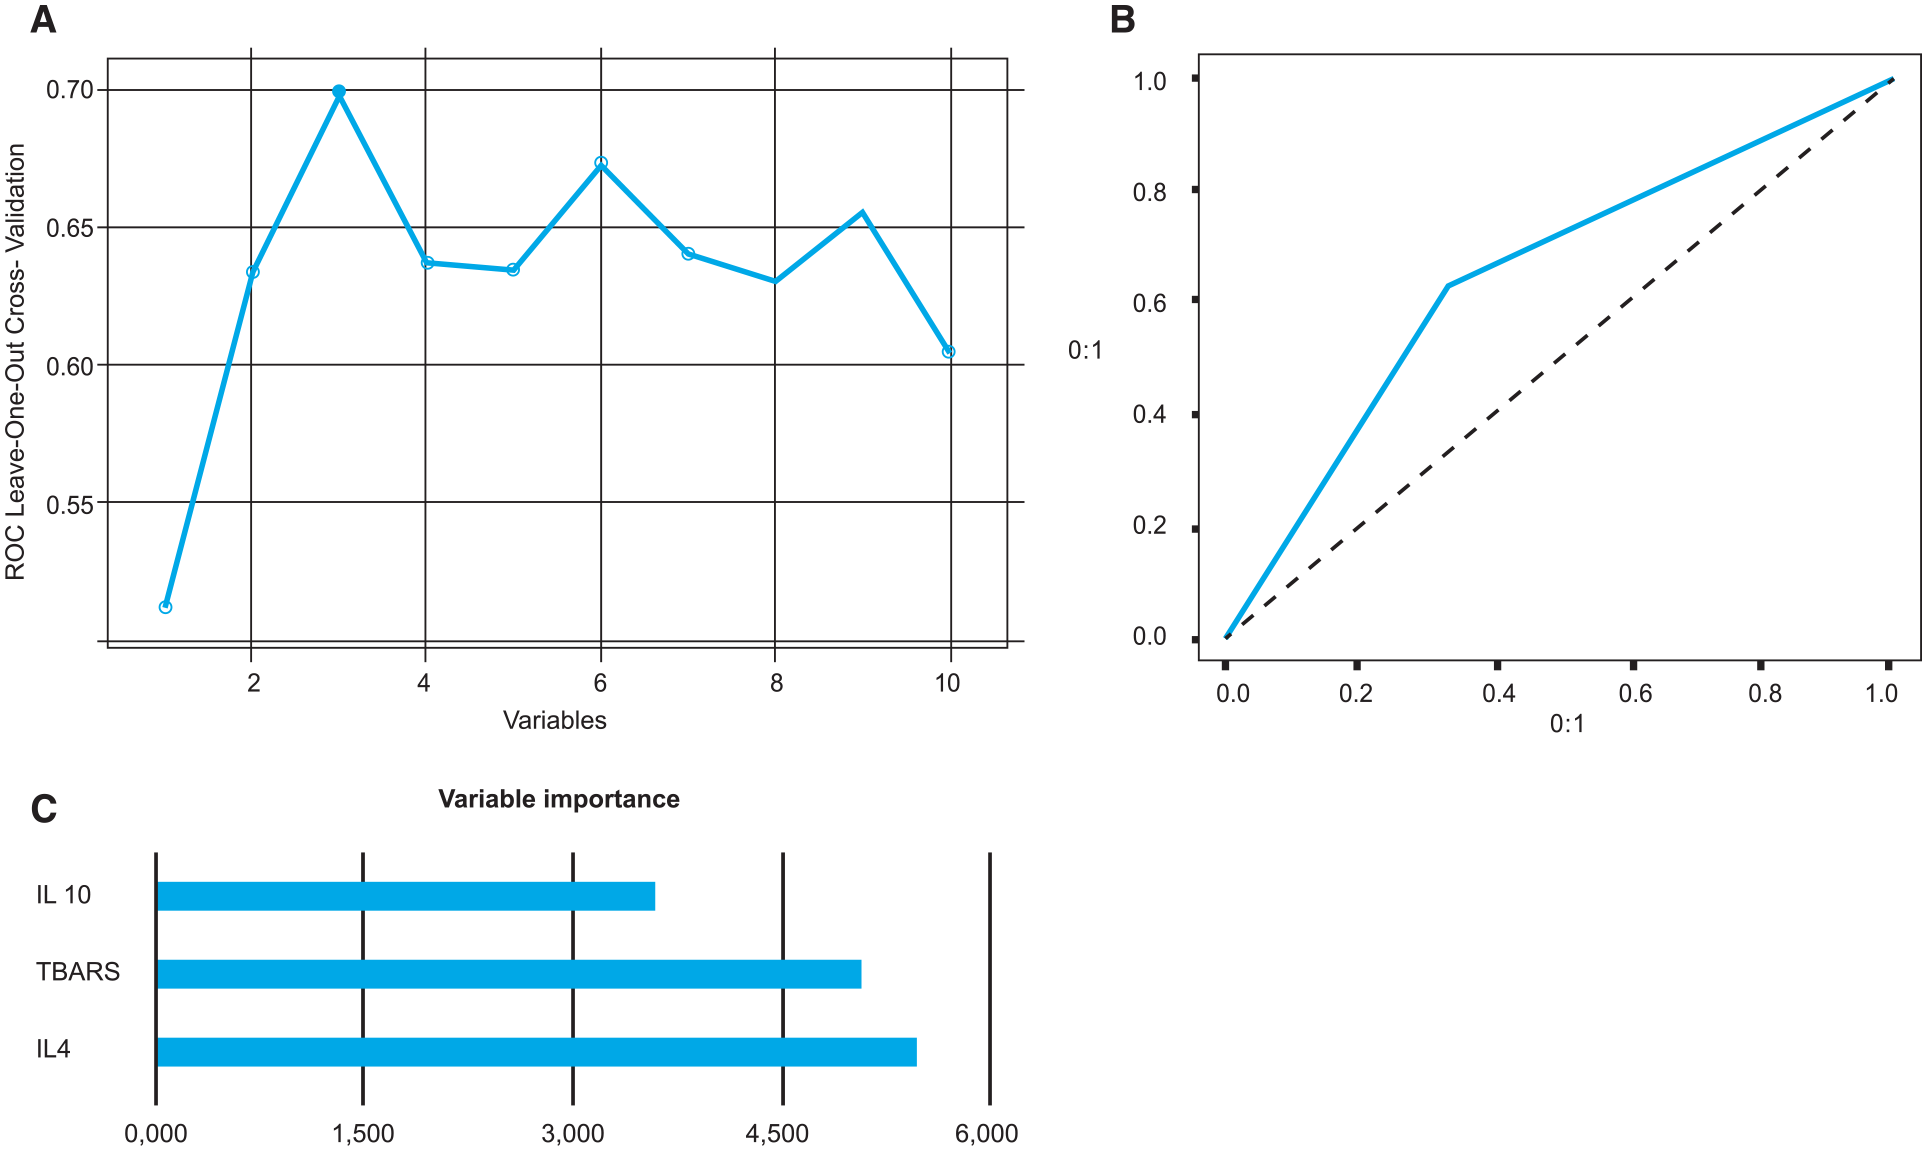
Analyses between patients with bipolar depression and unipolar depression. (A) ROC measures in recursive feature elimination according to the number of selected variables; (B) AUC-ROC curve for the best model (AUC of 0.69); and (C) bar graph of variable importance based on their importance in differentiating bipolar patients from unipolar patients for the best model.
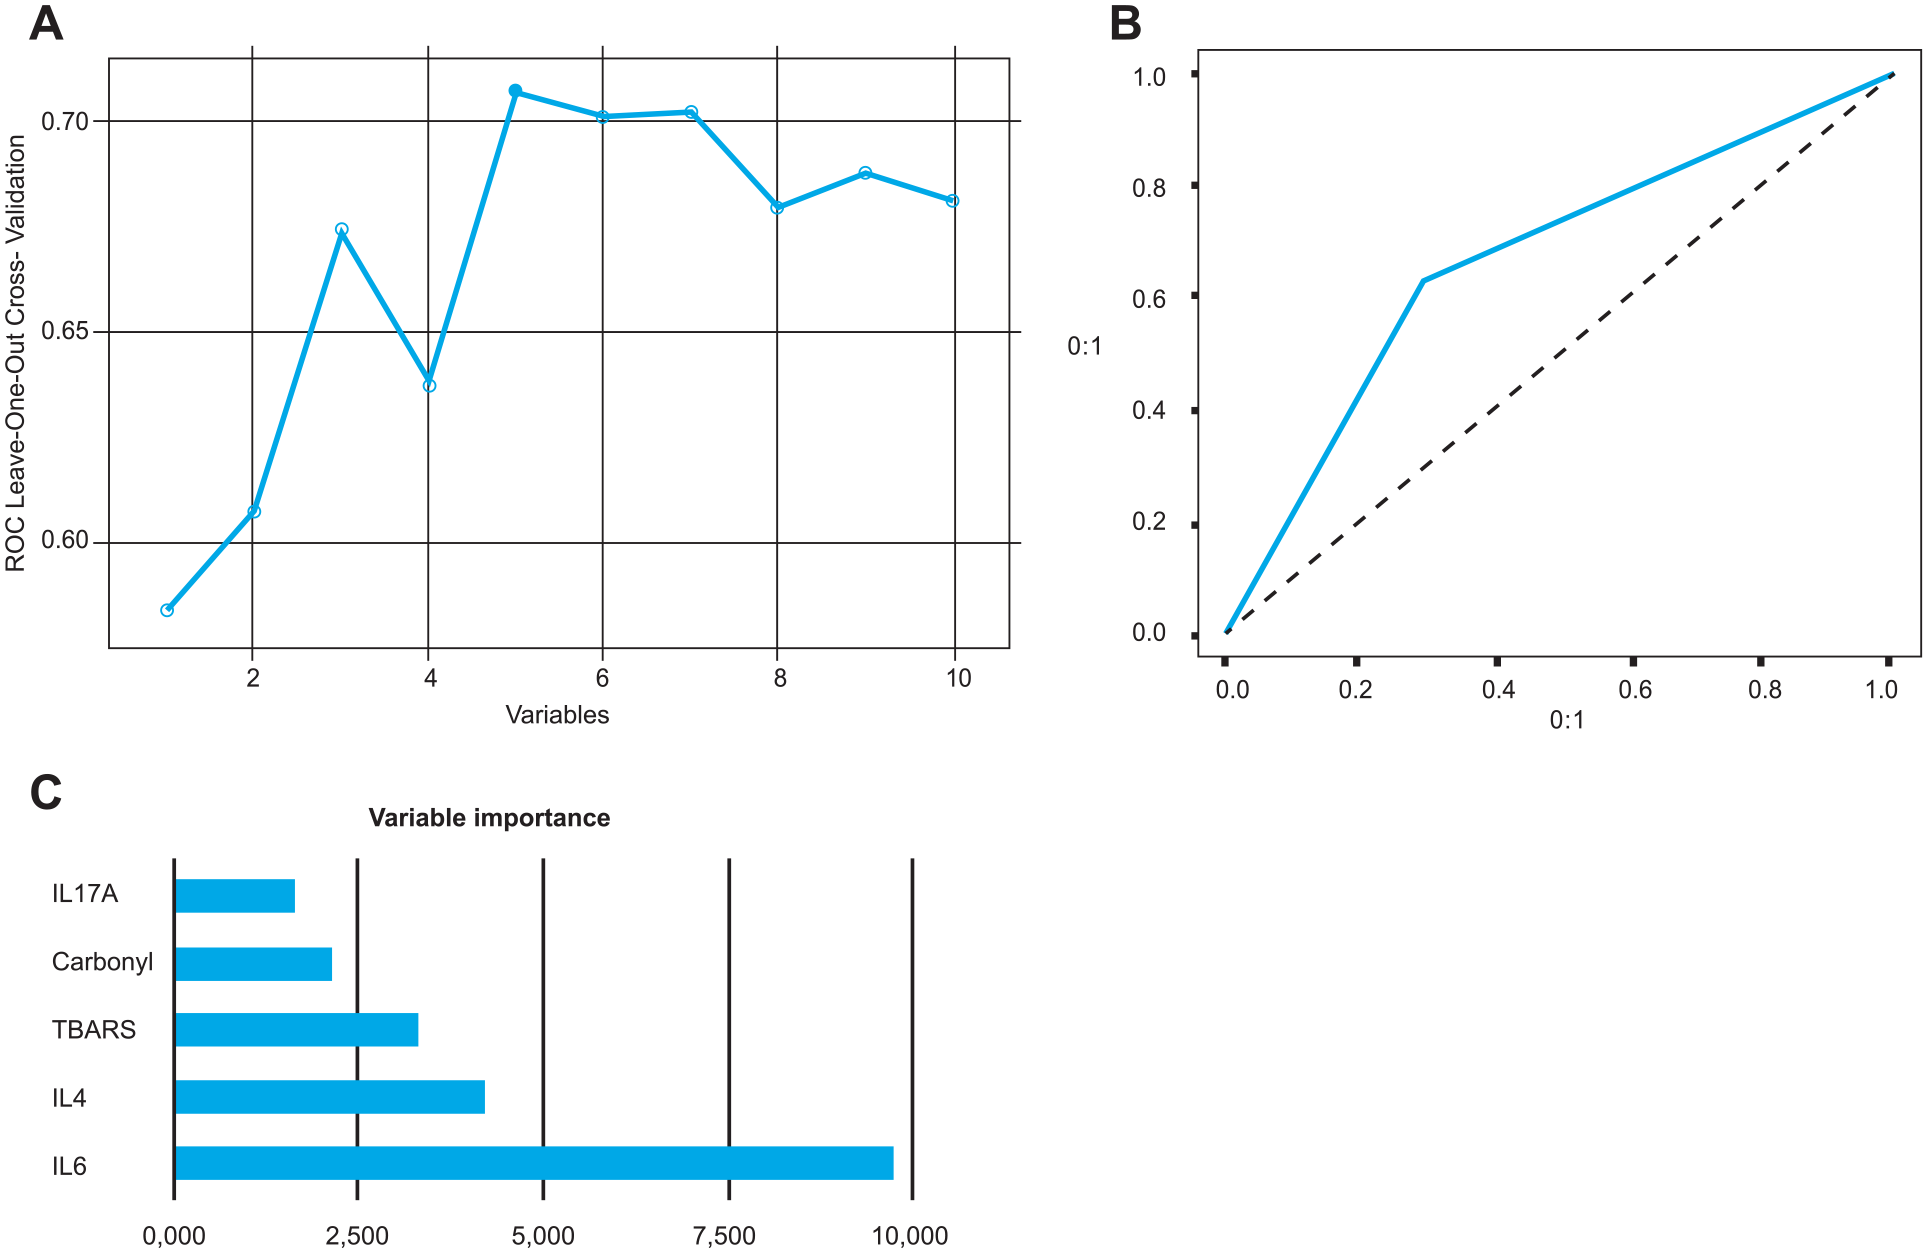
Analyses between patients with bipolar depression and healthy controls. (A) ROC measures in recursive feature elimination according to the number of selected variables; (B) AUC-ROC curve for the best model (AUC of 0.70); and (C) bar graph of variable importance based on their importance in differentiating bipolar patients from healthy controls for the best model.
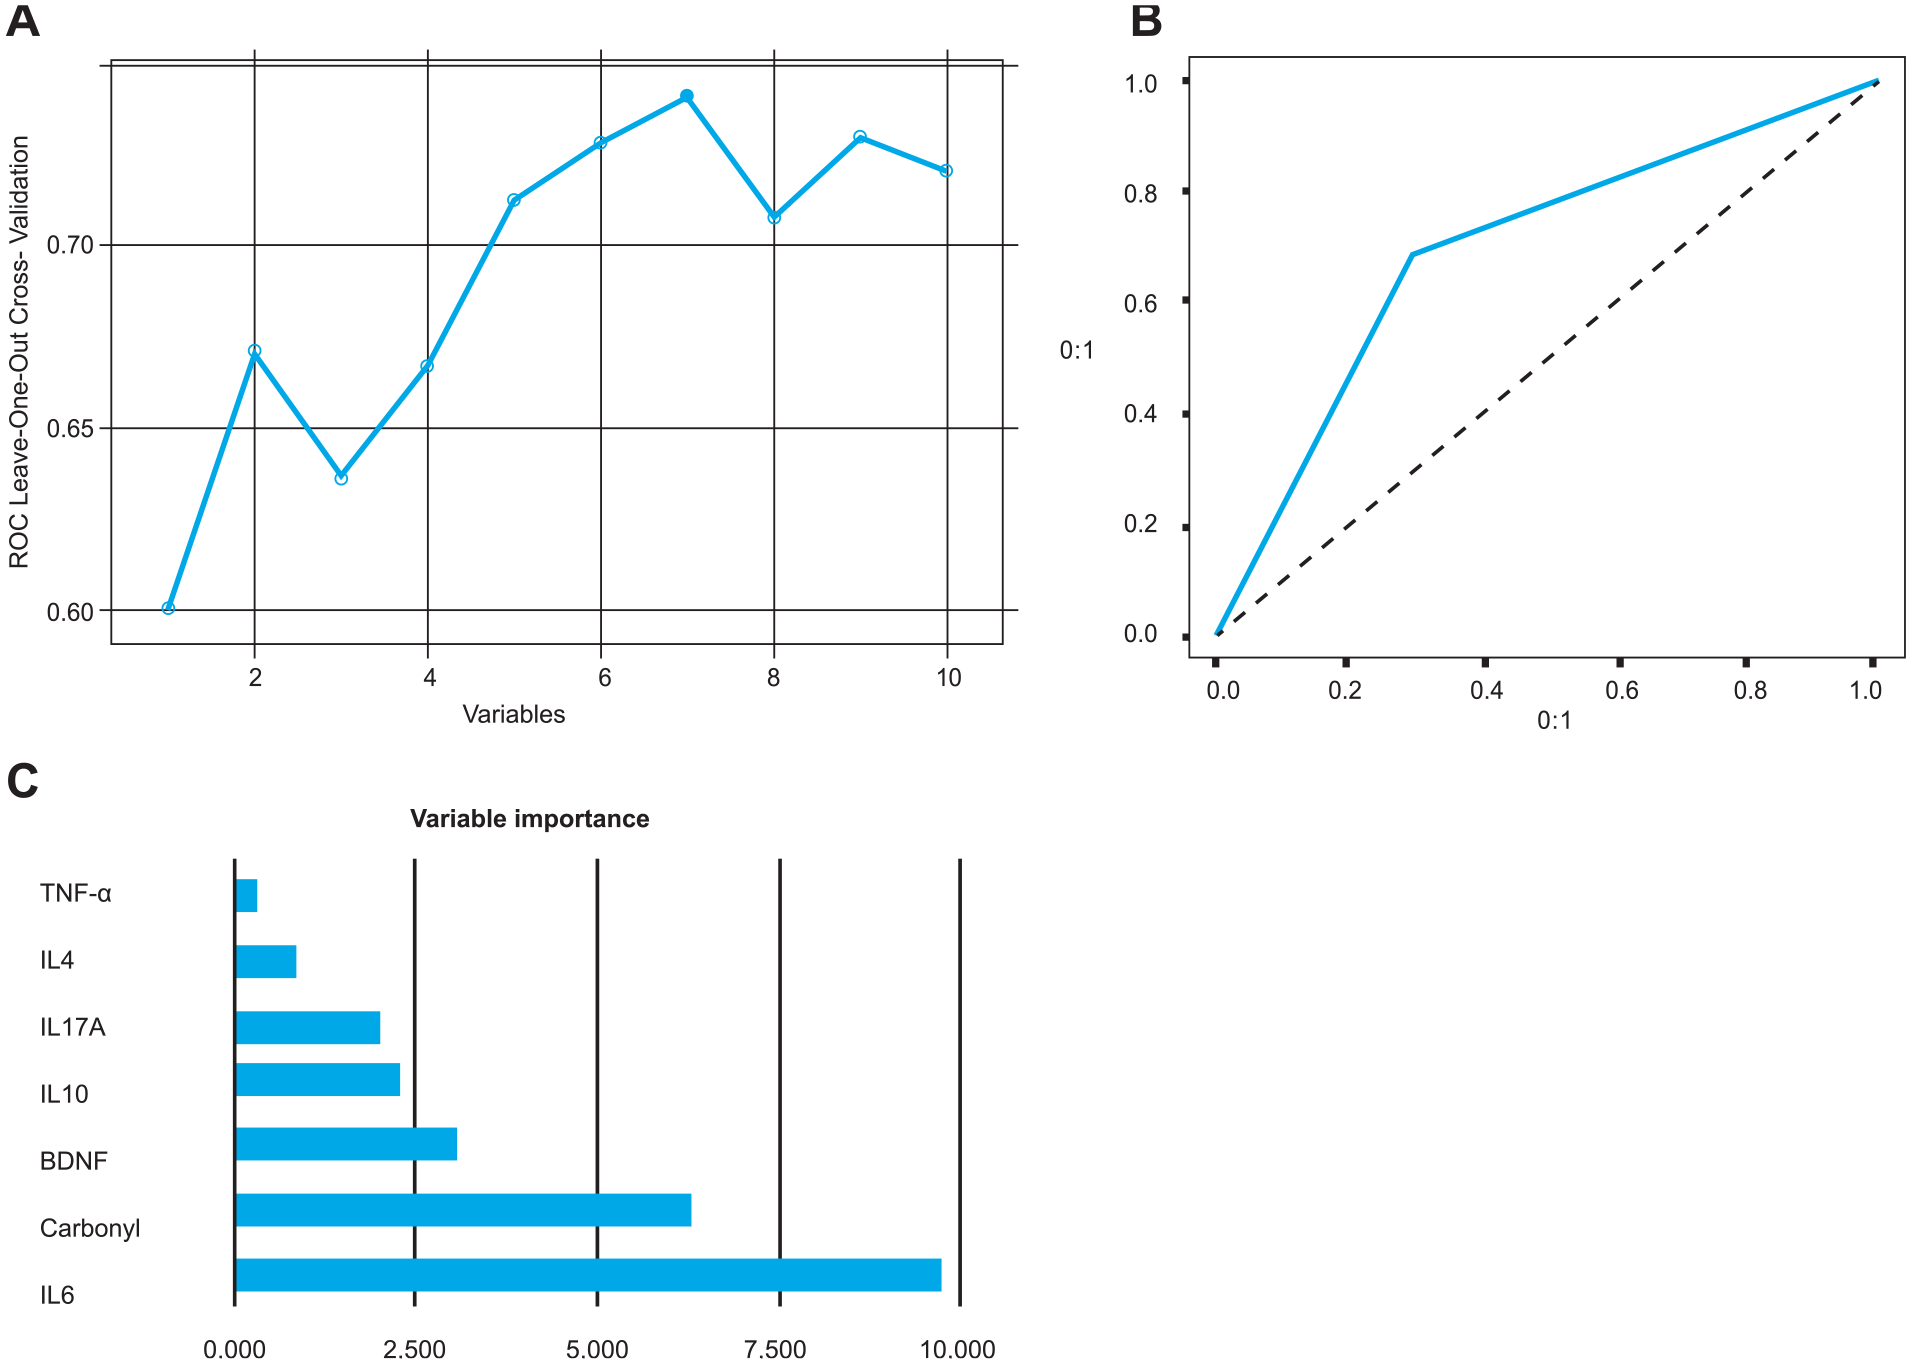
Analyses between patients with unipolar depression vs healthy controls. (A) ROC measures in recursive feature elimination according to the number of selected variables; (B) AUC-ROC curve for the best model (AUC of 0.74); and (C) bar graph of variable importance based on their importance in differentiating between unipolar patients from healthy controls for the best model.
Discussion
This study analyzed several peripheral biological markers in a sample of bipolar depressed patients, unipolar depressed patients and HC to assess the feasibility of identifying the diagnosis of bipolar depression or unipolar depression using advanced machine learning algorithms. Our data showed that machine learning techniques can discriminate between these disorders and HC. Among our panel of analysis, the SVM algorithms used achieved good accuracy. The prediction accuracy, sensitivity and specificity of the machine learning algorithm in identifying previously ‘unseen’ patients with BD or unipolar depression were determined through a robust leave-one-out cross-validation approach. Our results showed that the most relevant predictor variables to differentiate patients with bipolar depression from unipolar depression were IL-10, TBARS and IL-4, while IL17-A, carbonyl, TBARS, IL-4 and IL-6 were the most relevant in distinguishing patients with BD from HC. Regarding unipolar patients and HC, the most relevant predictor variables were TNF-alpha, IL-4, IL17-A, IL-10, BDNF, carbonyl and IL-6.
Immune abnormalities are associated with the pathophysiology of chronic psychiatric disorders including unipolar depression (Köhler et al., 2017) and BD (Brietzke et al., 2011). In this sense, our data are in line with the literature, where meta-analyses have shown significant alterations in interleukins in BD patients compared to HC, including IL-4, IL-6 and IL-10 (Modabbernia et al., 2013; Munkholm et al., 2013). Moreover, these alterations in patients with BD have been linked to severity of symptoms (Mukherjee et al., 2018), mood episodes (Kapczinski et al., 2010), staging (Kauer-Sant’Anna et al., 2009) and medication use (Lim et al., 2016). Regarding MDD, a meta-analysis has shown that IL-1, IL-6 and TNF-α levels in peripheral blood are increased in patients compared to HC (Dowlati et al., 2010), while another meta-analysis has described alterations in IL-10 levels while findings in IL-4 and IL17-A levels are still heterogeneous (Köhler et al., 2017).
Oxidative stress is the imbalance between oxidant processes and antioxidant defenses, which leads to excessive production of free radicals, the reactive oxygen species (ROS). The ROS is a normal process in aerobic metabolism and has many physiological roles in cellular signaling and the defense against pathogens. However, when present in excess, ROS cause damage to lipids, proteins and DNA, and can ultimately result in cell death (Black et al., 2015). There is evidence that MDD and BD are associated with changes in oxidative pathways, including lipid peroxidation as measured in the TBARS assay and protein carbonylation as measured by carbonyl assay (Siwek et al., 2013). A recent study showed that severity of depression, number of episodes and suicidal attempts are associated with activated immune and oxidative pathways, highlighting that increased TBARS levels were the single best predictor of BD/MDD atypical depression, melancholia and current suicidal ideation (Sowa-Kućma et al., 2018).
The machine learning approach is a powerful tool for pattern recognition and has been used in psychiatry in most of the processes for finding useful patterns in data that have translational meaning and can be incorporated in day-to-day practice (Passos et al., 2019). Using machine learning approaches, it is possible to model complex non-linear patterns of association between predictors and outcomes (Librenza-Garcia et al., 2017). Furthermore, by incorporating feature selection in the process, we can automatically select subgroups of predictors that are most relevant for a model, providing simpler and more clinically useful results (Passos et al., 2019). In this sense, the machine learning techniques used in this study represent an innovative tool, with the potential to bring personalized care to mental health (Kapczinski et al., 2019; Passos et al., 2016a and b). Several studies so far have been conducted using machine learning approaches aiming to aid in the clinical practice (Librenza-Garcia et al., 2017); however, translation to clinical practice is still a major challenge (Passos et al., 2019). Therefore, our findings reinforce the potential of using biomarkers to aid in the understanding of the pathophysiology of mood disorders and in creating biological signatures to assist in discriminating between patients with BD and MDD.
Our work, however, has some limitations. Its design does not allow an assessment of the impact of different treatments on peripheral markers due to the fact that all patients were medicated. Even though, in our study, no individual medication was associated with the biomarkers assessed, future studies would benefit from a drug-free sample. However, it is worth mentioning that, in clinical practice, most of the patients with depression are already medicated and therefore any clinically meaningful distinction between unipolar and bipolar depression using peripheral biomarkers will face this sort of limitation. Of note, in our sample, we did not include information regarding tobacco or alcohol use in our analyzes, which limits our discussion regarding the potential association of these substances and the changes in biomarkers. Moreover, it is important to note that our findings apply only to patients in a depressed state since all participants in our study were depressed. In addition, our study does not have a replication sample to independently test the signatures. Future studies should replicate these findings using larger samples to independently test our signature; and conduct a fusion data approach to combine clinical data with the biological markers, also including proteomics and/or genomics, to build biological signatures with higher accuracy. Regardless of these limitations, this study was able to distinguish patients with bipolar depression from unipolar depression and from HC with significant prediction accuracy using peripheral biological markers.
In conclusion, we have shown that machine learning techniques, coupled with peripheral biomarkers, provide a diagnostic tool to potentially aid the clinical assessment to distinguish depressed patients with BD from MDD and HC. Therefore, future studies should test additional biological markers using a machine learning model in order to build multimodal signatures with higher accuracy.
Supplemental Material
TABLE_2_Supplemental_file – Supplemental material for Differential biomarker signatures in unipolar and bipolar depression: A machine learning approach
Supplemental material, TABLE_2_Supplemental_file for Differential biomarker signatures in unipolar and bipolar depression: A machine learning approach by Bianca Wollenhaupt-Aguiar, Diego Librenza-Garcia, Giovana Bristot, Laura Przybylski, Laura Stertz, Renan Kubiachi Burque, Keila Mendes Ceresér, Lucas Spanemberg, Marco Antônio Caldieraro, Benicio N Frey, Marcelo P Fleck, Marcia Kauer-Sant’Anna, Ives Cavalcante Passos and Flavio Kapczinski in Australian & New Zealand Journal of Psychiatry
Footnotes
Declaration of Conflicting Interests
FK has received grants/research support from AstraZeneca, Daiichi Sankyo, Janssen-Cilag, Servier, NARSAD and the Stanley Medical Research Institute; has been a member of the speakers’ boards of AstraZeneca, Eli Lilly, Janssen and Servier; and has served as a consultant for Servier. MK-S has received research grants from CNPq-INCT-TM, CNPq Universal, CAPES, SMRI, NARSAD, AstraZeneca, Eli Lilly and FIPE-HCPA. BNF has received a research grant from Pfizer. The other authors declare no competing financial interests.
Funding
The author(s) disclosed receipt of the following financial support for the research, authorship and/or publication of this article: This work was supported by the Conselho Nacional de Desenvolvimento Científico e Tecnológico (CNPq-INCT-TM 573671/2008-7), Coordenação de Aperfeiçoamento de Pessoal de Nível Superior (CAPES) and Fundo de Incentivo a Pesquisas e Eventos (FIPE-HCPA).
Supplemental Material
The values of the serum markers according to the groups can be found in Table 2, in Supplementary Material.
References
Supplementary Material
Please find the following supplemental material available below.
For Open Access articles published under a Creative Commons License, all supplemental material carries the same license as the article it is associated with.
For non-Open Access articles published, all supplemental material carries a non-exclusive license, and permission requests for re-use of supplemental material or any part of supplemental material shall be sent directly to the copyright owner as specified in the copyright notice associated with the article.