
Abstract
Objectives:
Subsyndromal depression is prevalent and associated with poor outcomes in late life, but its epidemiological characteristics have barely been investigated. The aim of this prospective cohort study is to compare the prevalence, incidence and risk factors of subsyndromal depression with those of syndromal depression including major and minor depressive disorders in community-dwelling elderly individuals.
Methods:
In a nationwide community-based study of randomly sampled Korean elderly population aged 60 years or older (N = 6640), depression was assessed with standardized diagnostic interviews. At baseline and at 2-year and 4-year follow-ups, the authors diagnosed subsyndromal depression by the operational criteria and syndromal depression by the Diagnostic and Statistical Manual of Mental Disorders (4th ed.) diagnostic criteria. Multivariate logistic regression analyses were conducted to identify the risk factors for incident depression.
Results:
The age- and gender-adjusted prevalence rate of subsyndromal depression was 9.24% (95% confidence interval = [8.54, 9.93]), which was 2.4-fold higher than that of syndromal depression. The incidence rate of subsyndromal depression was 21.70 per 1000 person-years (95% confidence interval = [19.29, 24.12]), which was fivefold higher than that of syndromal depression. The prevalence to incidence ratio of subsyndromal depression was about half that of syndromal depression. The risk for subsyndromal depression was associated with female gender, low socioeconomic status, poor social support and poor sleep quality, while that of syndromal depression was associated with old age and less exercise.
Conclusion:
Subsyndromal depression should be validated as a clinical diagnostic entity, at least in late life, since it has epidemiological characteristics different from those of syndromal depression.
Introduction
Subsyndromal depression (SSD) is more prevalent than major depressive disorder (MDD) in the elderly aged over 65 years (Judd and Kunovac, 1998) and associated with functional disability (Hybels et al., 2009), cognitive impairment (Boyle et al., 2010), poor physical health (Beekman et al., 1997) and mortality (Meeks et al., 2011). However, it is still debated whether SSD is an independent diagnostic entity from syndromal depression including MDD and minor depressive disorder (mDD). Most previous studies defined SSD dimensionally using a cutoff score after the completion of self-rated questionnaires by patients, and thus, their definitions were overinclusive and susceptible to cultural differences (Lee et al., 2011; Meeks et al., 2011). Although several studies defined SSD using operational diagnostic criteria, their criteria were again overinclusive because they included neither the presence of core symptoms of syndromal depression (Judd and Kunovac, 1998) nor the absence of other causes such as physical conditions or other major psychiatric illnesses in their operational criteria (Lyness et al., 2007).
Furthermore, the incidence rate and risk factors of SSD have not been investigated in community settings. In addition, many previous studies assumed that SSD is a prodrome or high-risk condition of MDD and largely focused on the conversion rate of SSD to MDD (Meeks et al., 2011). The conversion rates of SSD to MDD were 10–25% in the general population (Broadhead et al., 1990; Wells et al., 1992), but only 5.8% in the elderly population (Cuijpers et al., 2006), suggesting that SSD may be more than just a prodromal or high-risk condition of MDD, at least in late life.
In our previous studies, we proposed operational diagnostic criteria for SSD (Park et al., 2007). We developed the criteria using the Diagnostic and Statistical Manual of Mental Disorders (4th ed.; DSM-IV) diagnostic criteria of depressive disorders such that conceptual overlaps among SSD, mDD and MDD were avoided, but the conceptual continuity was maintained. As a result, we expected our operational criteria to be less susceptible to cultural influences and less inclusive than those proposed in previous studies. In this study, using these operational criteria, we compared the prevalence, incidence and risk factors for SSD with those of mDD and MDD in a representative nationwide elderly population.
Methods
Participants
This study was part of the Korean Longitudinal Study on Cognitive Aging and Dementia (KLOSCAD) (Han et al., 2018). In the KLOSCAD, we randomly sampled 30 villages and towns in 13 districts across South Korea. Using residential rosters of elderly residents aged 60 years or older on October 2010, we randomly selected 10% of residents from urban areas and 20% from rural areas. Finally, 12,694 individuals were invited, 6818 agreed to participate (response rate = 53.7%) and 6640 (response rate = 52.3%) completed the baseline assessment conducted from November 2010 to October 2012. Follow-up assessments were conducted every 2 years; the first was conducted from November 2012 to October 2014 and the second was conducted from November 2014 to October 2016. The protocol of this study was explained to all participants. Each participant provided written informed consent signed either by the participant or his or her legal guardian. This study was approved by the Institutional Review Board of the Seoul National University Bundang Hospital.
Assessments
Geriatric psychiatrists conducted a face-to-face standardized diagnostic interview on depressive disorders using the Korean version of the Mini-International Neuropsychiatric Interview (MINI-K) (Yoo et al., 2006), and diagnosed mDD and MDD according to the DSM-IV diagnostic criteria and SSD according to the operational diagnostic criteria. The operational diagnostic criteria we proposed were as follows: (a) the occurrence of two or more symptoms of depression within the same 2-week period listed in criterion A of major depressive episode in the DSM-IV; (b) the presence of at least a depressed mood or anhedonia; (c) each depressive symptom should be present for more than half a day or more than 7 days during the 2-week period; (d) participants must not fulfill the criteria for the diagnosis of MDD or mDD; (e) the symptoms must not be due to the direct physiological effects of a substance or a general medical condition; (f) the symptoms must not be attributable to bereavement, dementia, or schizophrenia and other psychotic disorders; and (g) there should not be a history of the occurrence of a manic or hypomanic episode. These criteria did not necessarily require the presence of significant impairment in social or occupational functioning.
We evaluated the level of social support using the Medical Outcomes Study Social Support Survey (MOS-SSS) questionnaire (Sherbourne and Stewart, 1991) and considered participants to have poor social support when they had an MOS-SSS score that was less than 25% of that of the participants (Sherbourne et al., 1992). A participant was considered to have a low socioeconomic status when the participant is covered by the National Medicaid Program. We categorized exercise into three levels using the metabolic equivalent task (MET). The low exercise group comprised participants with MET scores less than 600 minutes/week. Those with MET scores from 600 to 3000 minutes/week were placed in the moderate exercise group, and participants with MET scores of at least 3000 minutes/week were placed in the high exercise group (Ainsworth et al., 2000). Participants were considered to have poor sleep quality if they had a Pittsburgh Sleep Quality Index (PSQI) of 6 or more (Buysse et al., 1991). We evaluated the burden of comorbid illnesses using the Cumulative Illness Rating Scale (CIRS) (Miller et al., 1992). We administered laboratory tests including complete blood cell counts, chemistry profiles, a serologic test for screening syphilis, a thyroid function test, vitamin B12 and folate.
Statistical analysis
We compared the baseline demographic and clinical characteristics between groups using Pearson’s chi-square tests for categorical variables and analyses of variance (ANOVAs) for continuous variables.
We estimated prevalence rates using the responses of the 6640 participants who completed the baseline assessment in the KLOSCAD, and incidence rates using the responses of the 3955 participants who completed both the baseline and one or more follow-up assessments in the KLOSCAD. The participants who were included in the estimation of incidence rates did not have depressive disorders (SSD, mDD and MDD), a history of any depressive disorder or antidepressant use, and other major psychiatric or neurological disorders during the baseline assessment (Figure 1). We stratified the participants into three age groups (60–69 years, 70–79 years and 80 years or older) and two gender groups (men and women), and estimated prevalence rates (%) and incidence rates (number of 1000 person-years) with 95% confidence intervals (95% CI) using the Wald method. We estimated age- and gender-adjusted prevalence and incidence rates by direct standardization using the 2010 National Census of South Korea. Participants were censored by one of the following events: death, dementia, follow-up loss, or the end of the 4-year follow-up assessment.
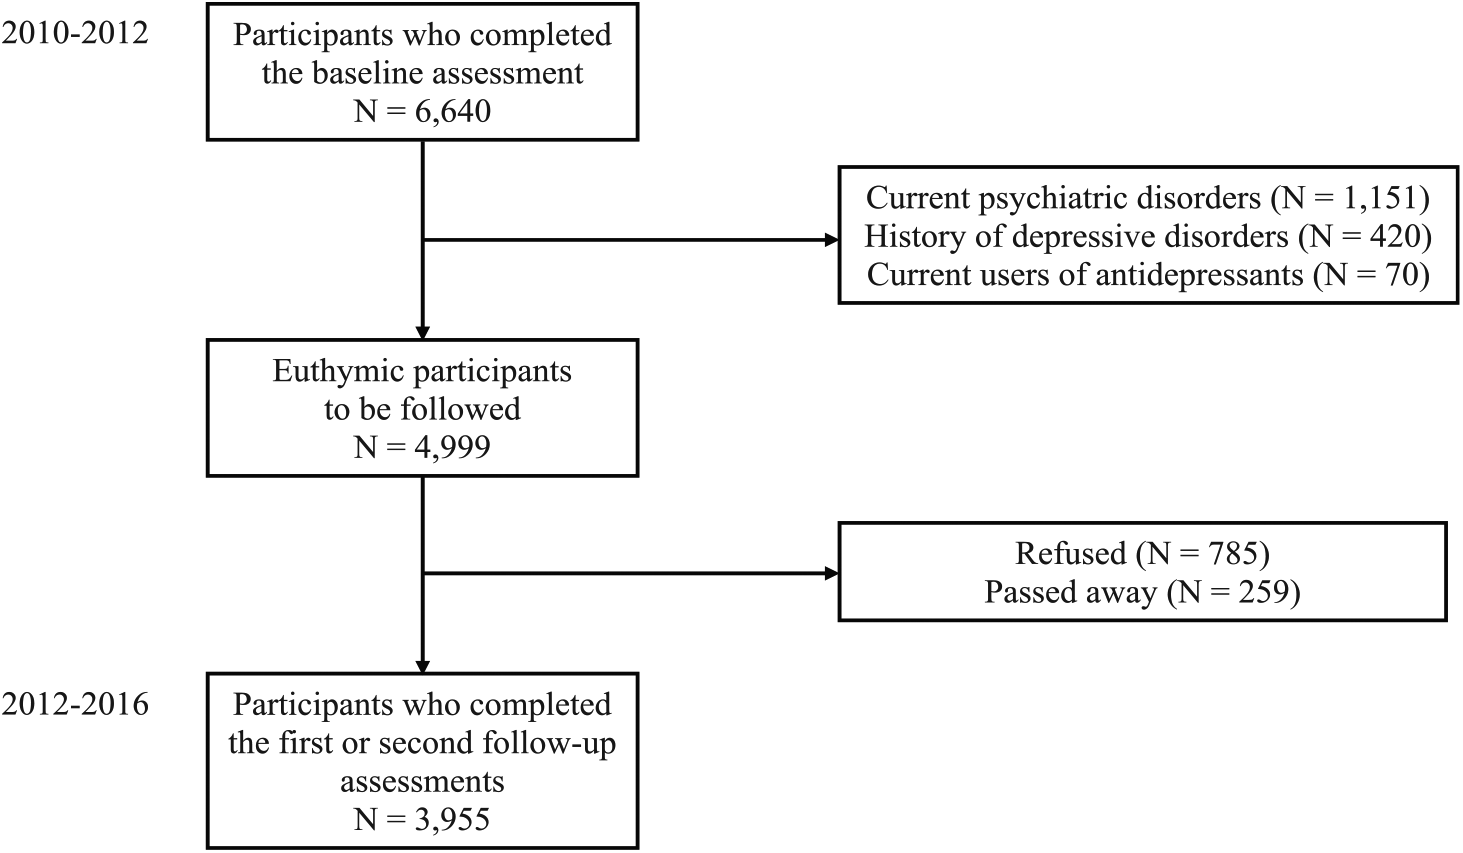
Flowchart of the study.
We identified the risk factors for incident depressive disorders using multinomial logistic regression analyses. These analyses involved the 3873 participants who did not develop any major psychiatric or neurological disorders during the follow-up period.
Results
Prevalence of SSD
Among the 6640 participants who underwent the baseline assessment, 608 (194 men and 414 women), 105 (33 men and 72 women) and 144 (34 men and 107 women) were diagnosed with SSD, mDD and MDD, respectively. Participants with SSD were older, less educated and more likely to be women than non-depressed participants. Participants who were diagnosed with SSD had lower socioeconomic status, less social support and exercised less often compared to non-depressed participants. In addition, these participants experienced more insomnia, had more comorbidities and often had a prior history of MDD compared to non-depressed participants. However, the socioeconomic status of and social support received by participants with SSD were better than those of participants with mDD or MDD. Moreover, participants with SSD had less comorbidities, better sleep quality and rarely had a prior history of MDD compared to participants with mDD or MDD (Table 1). The distribution of depressive symptoms in SSD, mDD and MDD was described elsewhere (Supplementary Table 1).
Baseline characteristics of the participants.
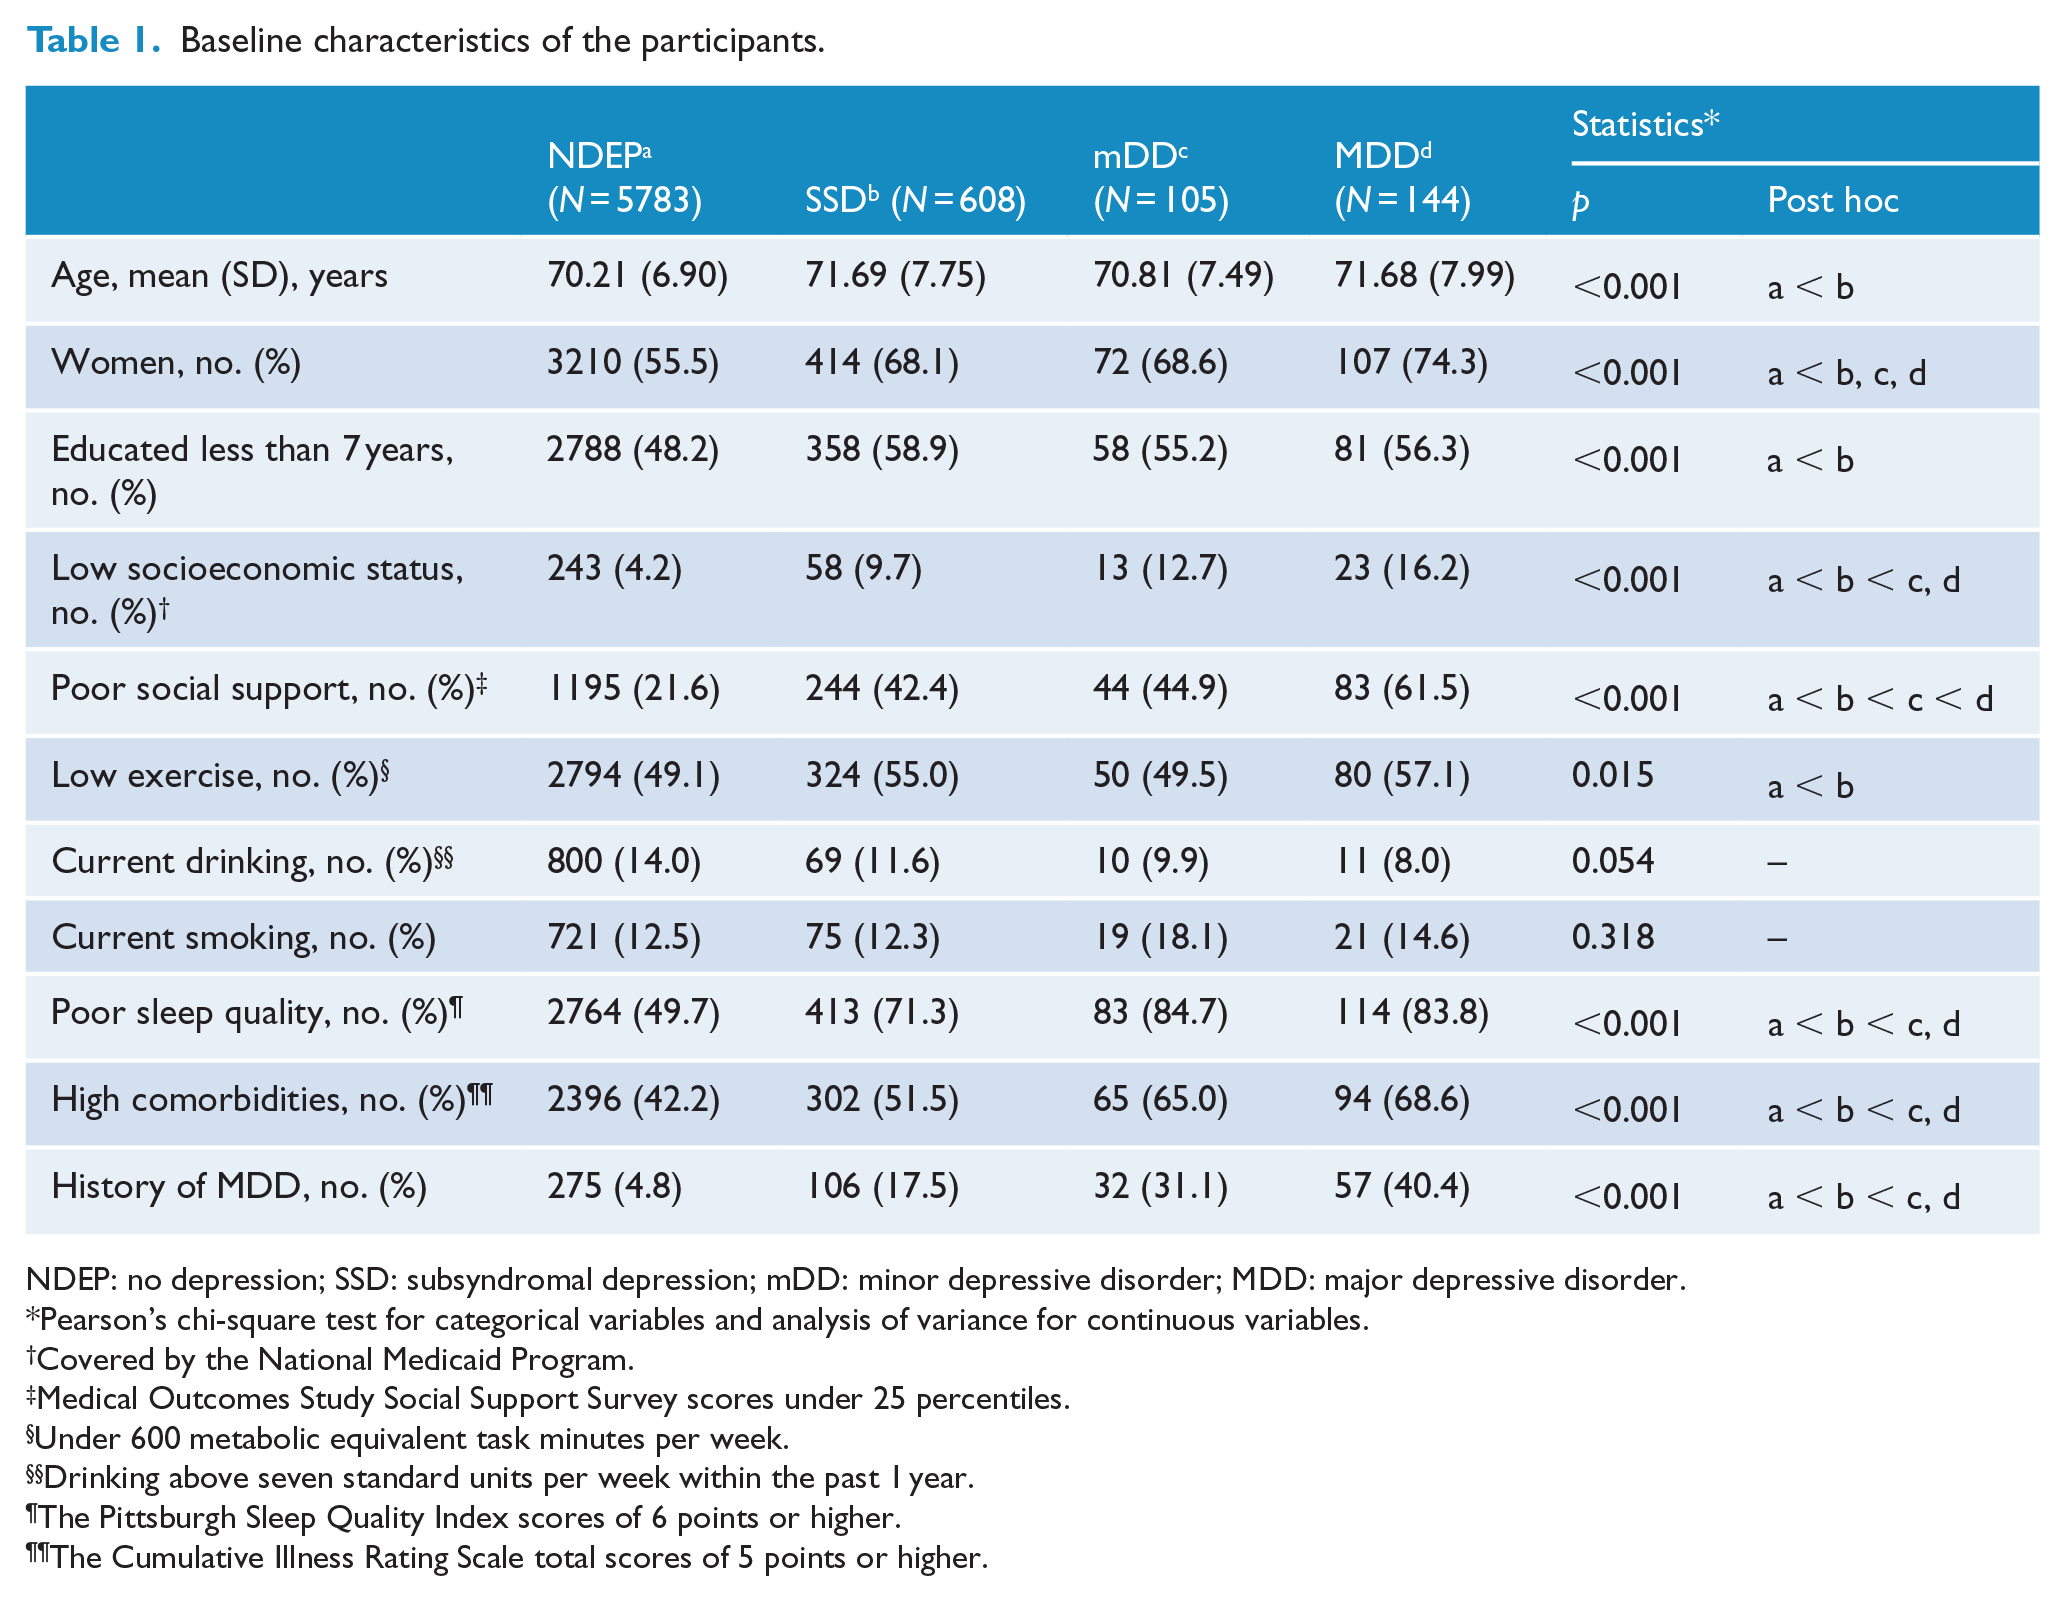
NDEP: no depression; SSD: subsyndromal depression; mDD: minor depressive disorder; MDD: major depressive disorder.
Pearson’s chi-square test for categorical variables and analysis of variance for continuous variables.
Covered by the National Medicaid Program.
Medical Outcomes Study Social Support Survey scores under 25 percentiles.
Under 600 metabolic equivalent task minutes per week.
Drinking above seven standard units per week within the past 1 year.
The Pittsburgh Sleep Quality Index scores of 6 points or higher.
The Cumulative Illness Rating Scale total scores of 5 points or higher.
The age- and gender-adjusted prevalence rate of SSD was estimated to be 9.24% (95% CI = [8.54, 9.93]), which was much higher than that of mDD (1.60%, 95% CI = [1.29, 1.90]) and MDD (2.19%, 95% CI = [1.83, 2.54]) (Table 2). The prevalence rate of SSD increased with age (p < 0.001, chi-square test) and reached 13.40% (95% CI = [10.94, 15.85]) in participants who were 80 years of age or older. SSD was approximately 1.6 times more prevalent in women than in men (p < 0.001, chi-square test). A larger gender disparity was observed in the prevalence estimates of MDD (female-to-male ratio = 2.2:1, p < 0.001, chi-square test).
Prevalence and incidence estimates of subsyndromal depression, minor depressive disorder and major depressive disorder.
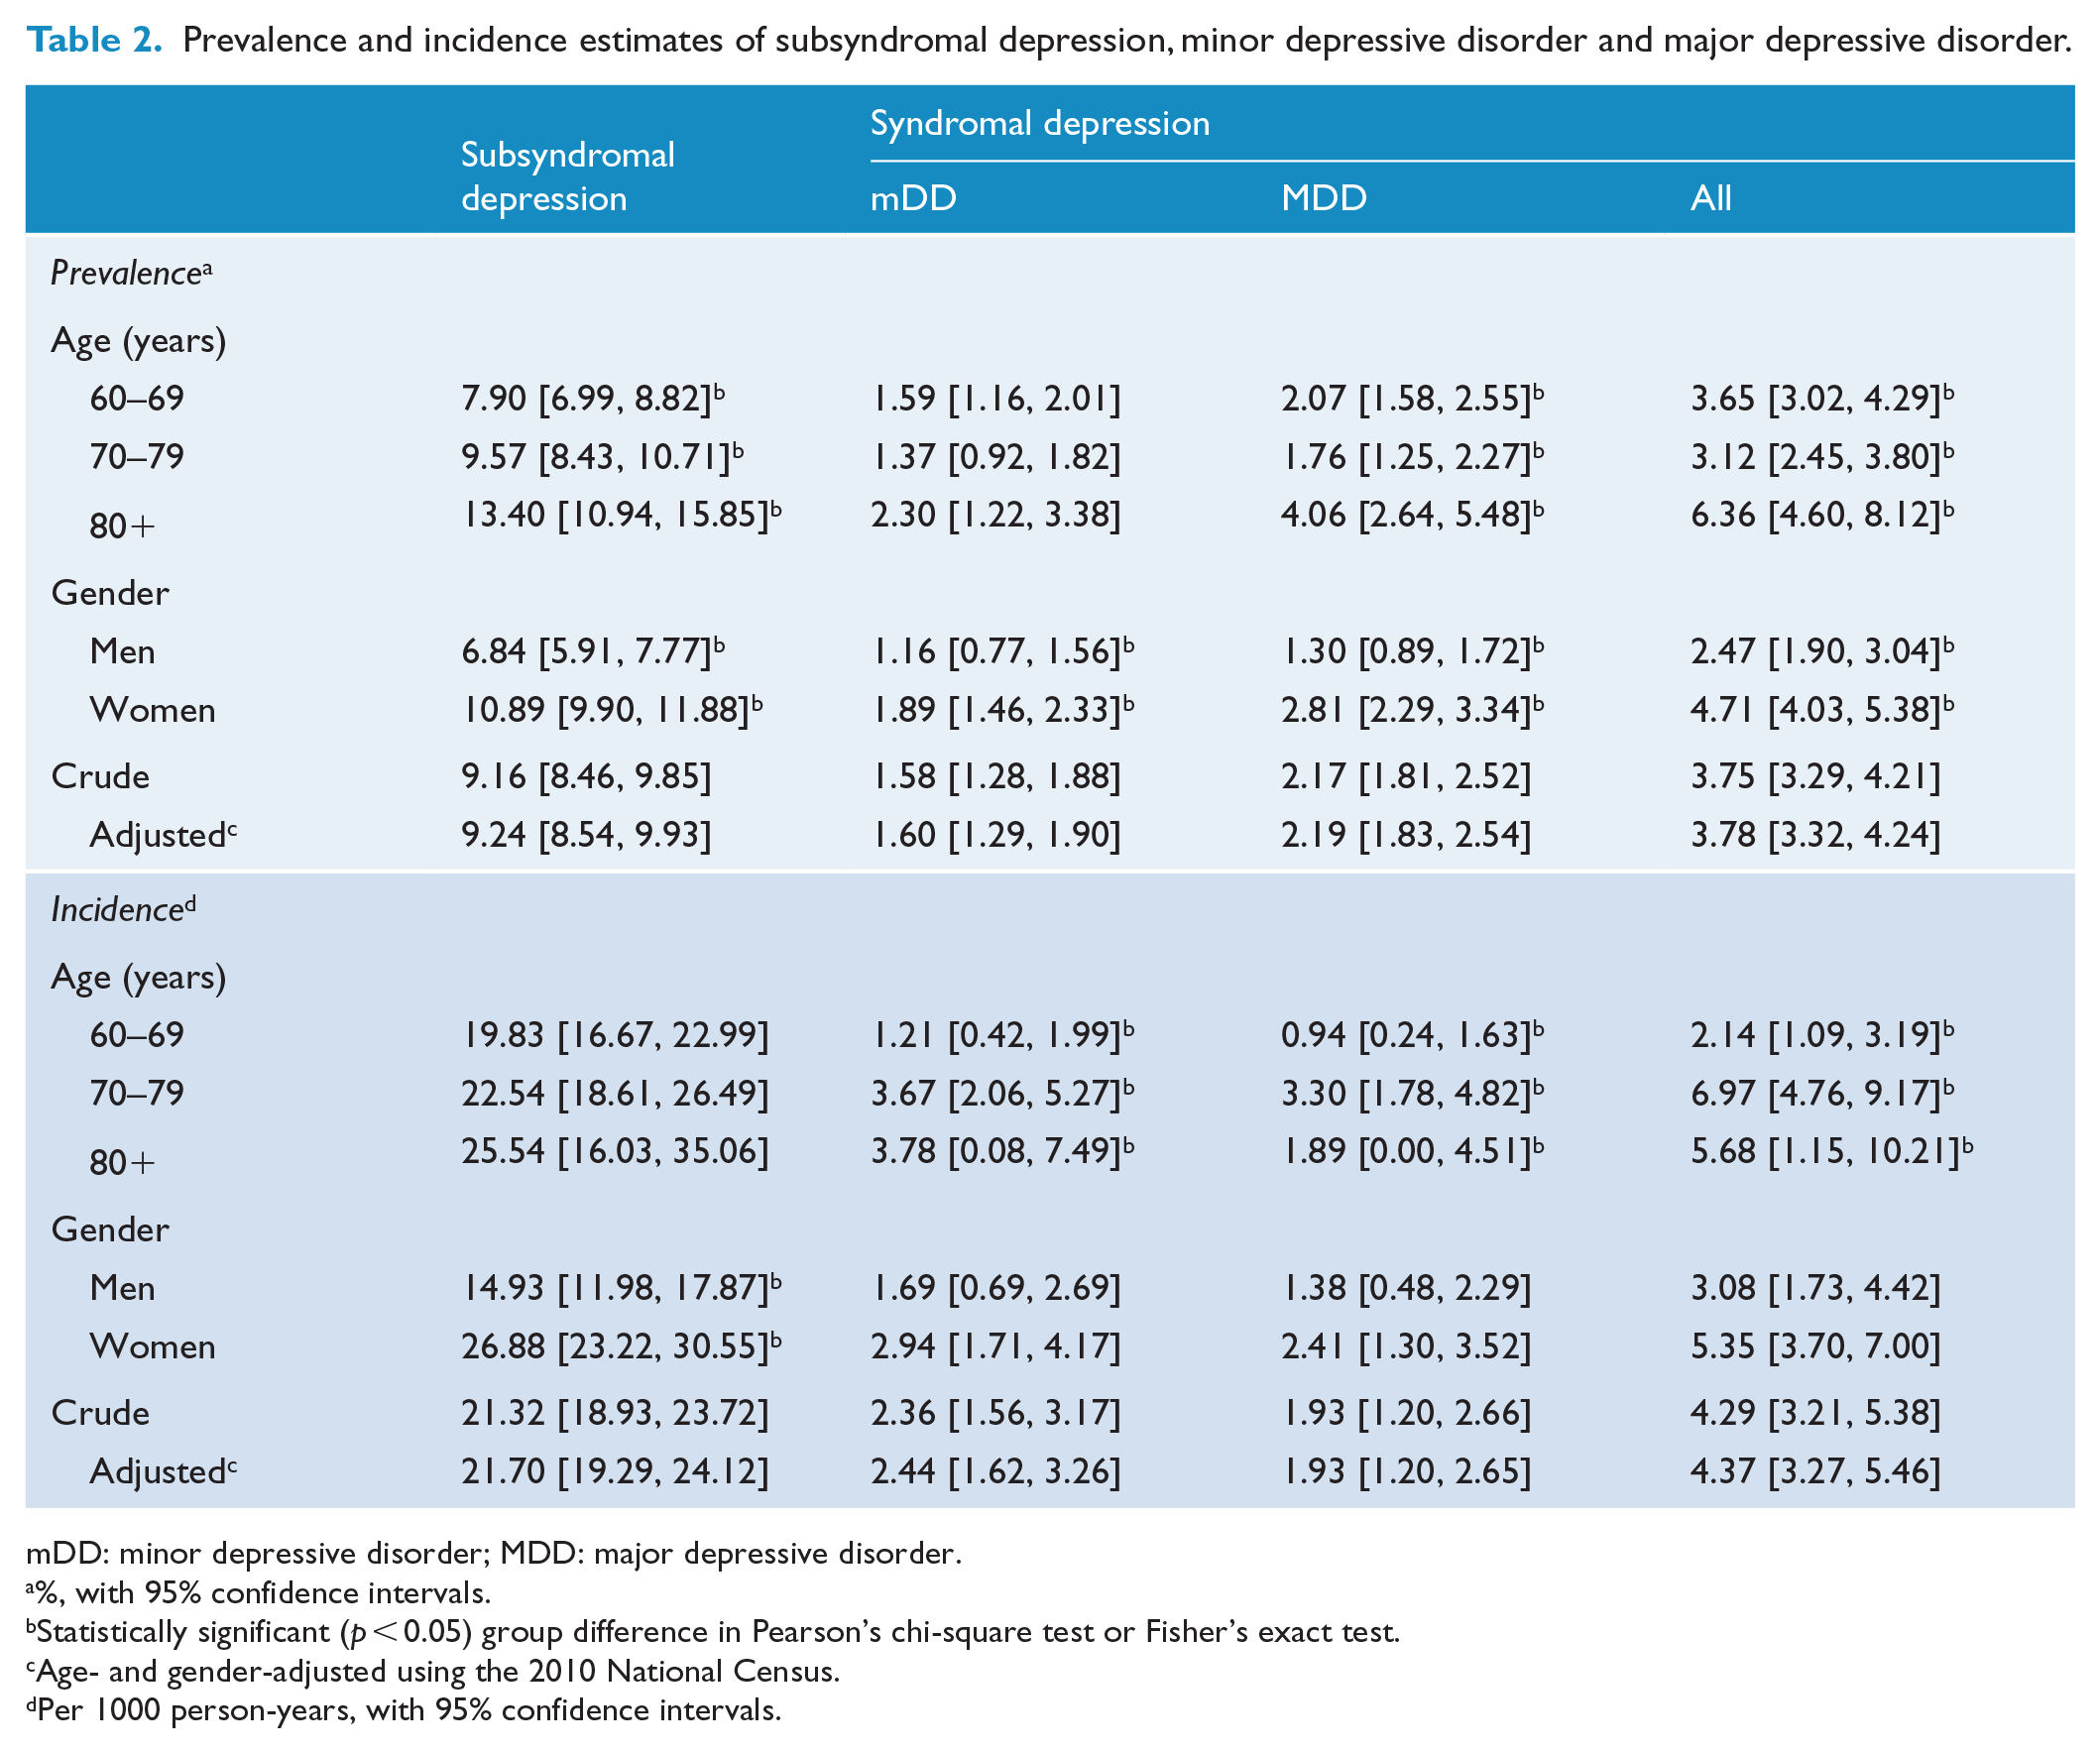
mDD: minor depressive disorder; MDD: major depressive disorder.
%, with 95% confidence intervals.
Statistically significant (p < 0.05) group difference in Pearson’s chi-square test or Fisher’s exact test.
Age- and gender-adjusted using the 2010 National Census.
Per 1000 person-years, with 95% confidence intervals.
Incidence of SSD
Among the 4999 non-depressed participants who completed the baseline assessment, 3955 responded to every follow-up assessment (response rate = 79.1%) during the 4-year period of study, 785 refused and 259 passed away. The mean duration of follow-up was 3.3 years. The responders to the follow-up assessments were more educated and smoked less, but also had more comorbidities than the non-responders (Table 3).
Baseline characteristics of the responders and non-responders to the follow-up evaluation.
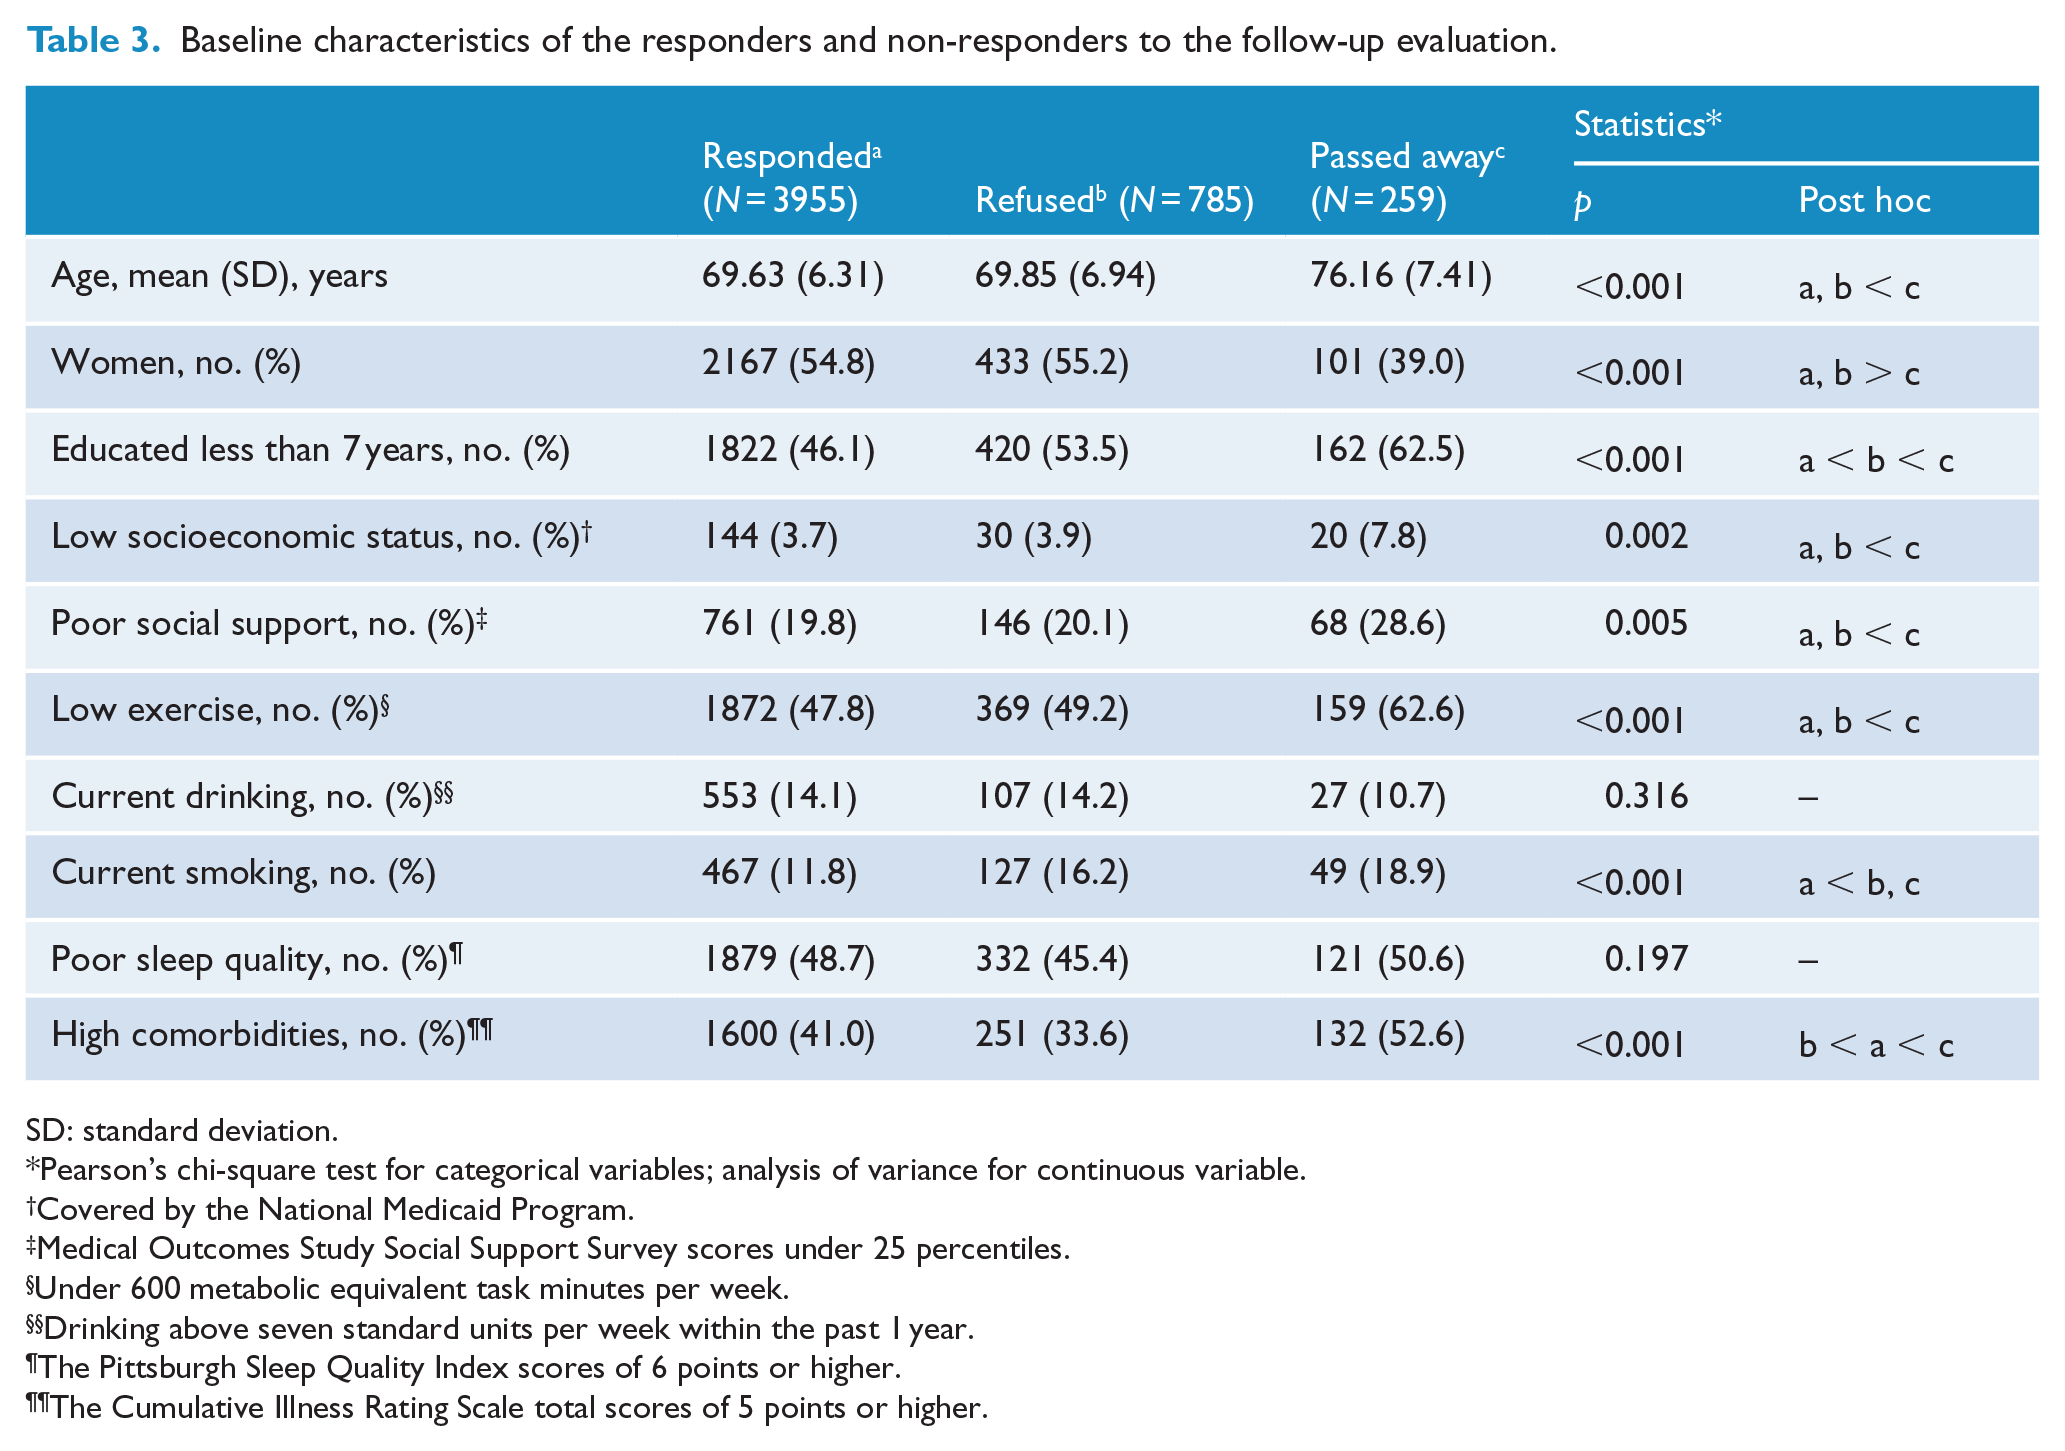
SD: standard deviation.
Pearson’s chi-square test for categorical variables; analysis of variance for continuous variable.
Covered by the National Medicaid Program.
Medical Outcomes Study Social Support Survey scores under 25 percentiles.
Under 600 metabolic equivalent task minutes per week.
Drinking above seven standard units per week within the past 1 year.
The Pittsburgh Sleep Quality Index scores of 6 points or higher.
The Cumulative Illness Rating Scale total scores of 5 points or higher.
During the follow-up period, 298 developed SSD, whereas 33 and 27 developed mDD and MDD, respectively. The age- and gender-adjusted incidence rate of SSD was 21.70 per 1000 person-years (95% CI = [19.29, 24.12]), which was much higher than those of mDD (2.44, 95% CI = [1.62, 3.26]) and MDD (1.93, 95% CI = [1.20, 2.65]) (Table 2). The incidence rate of SSD increased with age. However, differences in the incidence rates of SSD between age groups were not statistically significant (p = 0.745, chi-square test). The incidence rates of mDD (p = 0.013, Fisher’s exact test) and MDD (p = 0.012, Fisher’s exact test) significantly increased after the age of 70 years. Gender disparity was also observed in the incidence of SSD. SSD was approximately two times more incident in women than in men (p < 0.001, chi-square test). Gender disparity in the incidence of mDD (p = 0.144, chi-square test) and MDD (p = 0.186, chi-square test) was not significant.
In the multivariate logistic regression models used in this study, the female gender (odds ratio [OR] = 1.42, 95% CI = [1.04, 1.95]), low socioeconomic status (OR = 1.86, 95% CI = [1.13, 3.06]), poor social support (OR = 1.90, 95% CI = [1.45, 2.50]) and poor sleep quality (OR = 2.14, 95% CI = [1.64, 2.79]) increased the risk for SSD while alcohol use (OR = 0.56, 95% CI = [0.34, 0.90]) decreased this risk (Table 4). Old age and less exercise, which increased the risk for mDD or MDD did not influence the risk for SSD.
Risk factors of incident subsyndromal depression, minor depressive disorder and major depressive disorder.
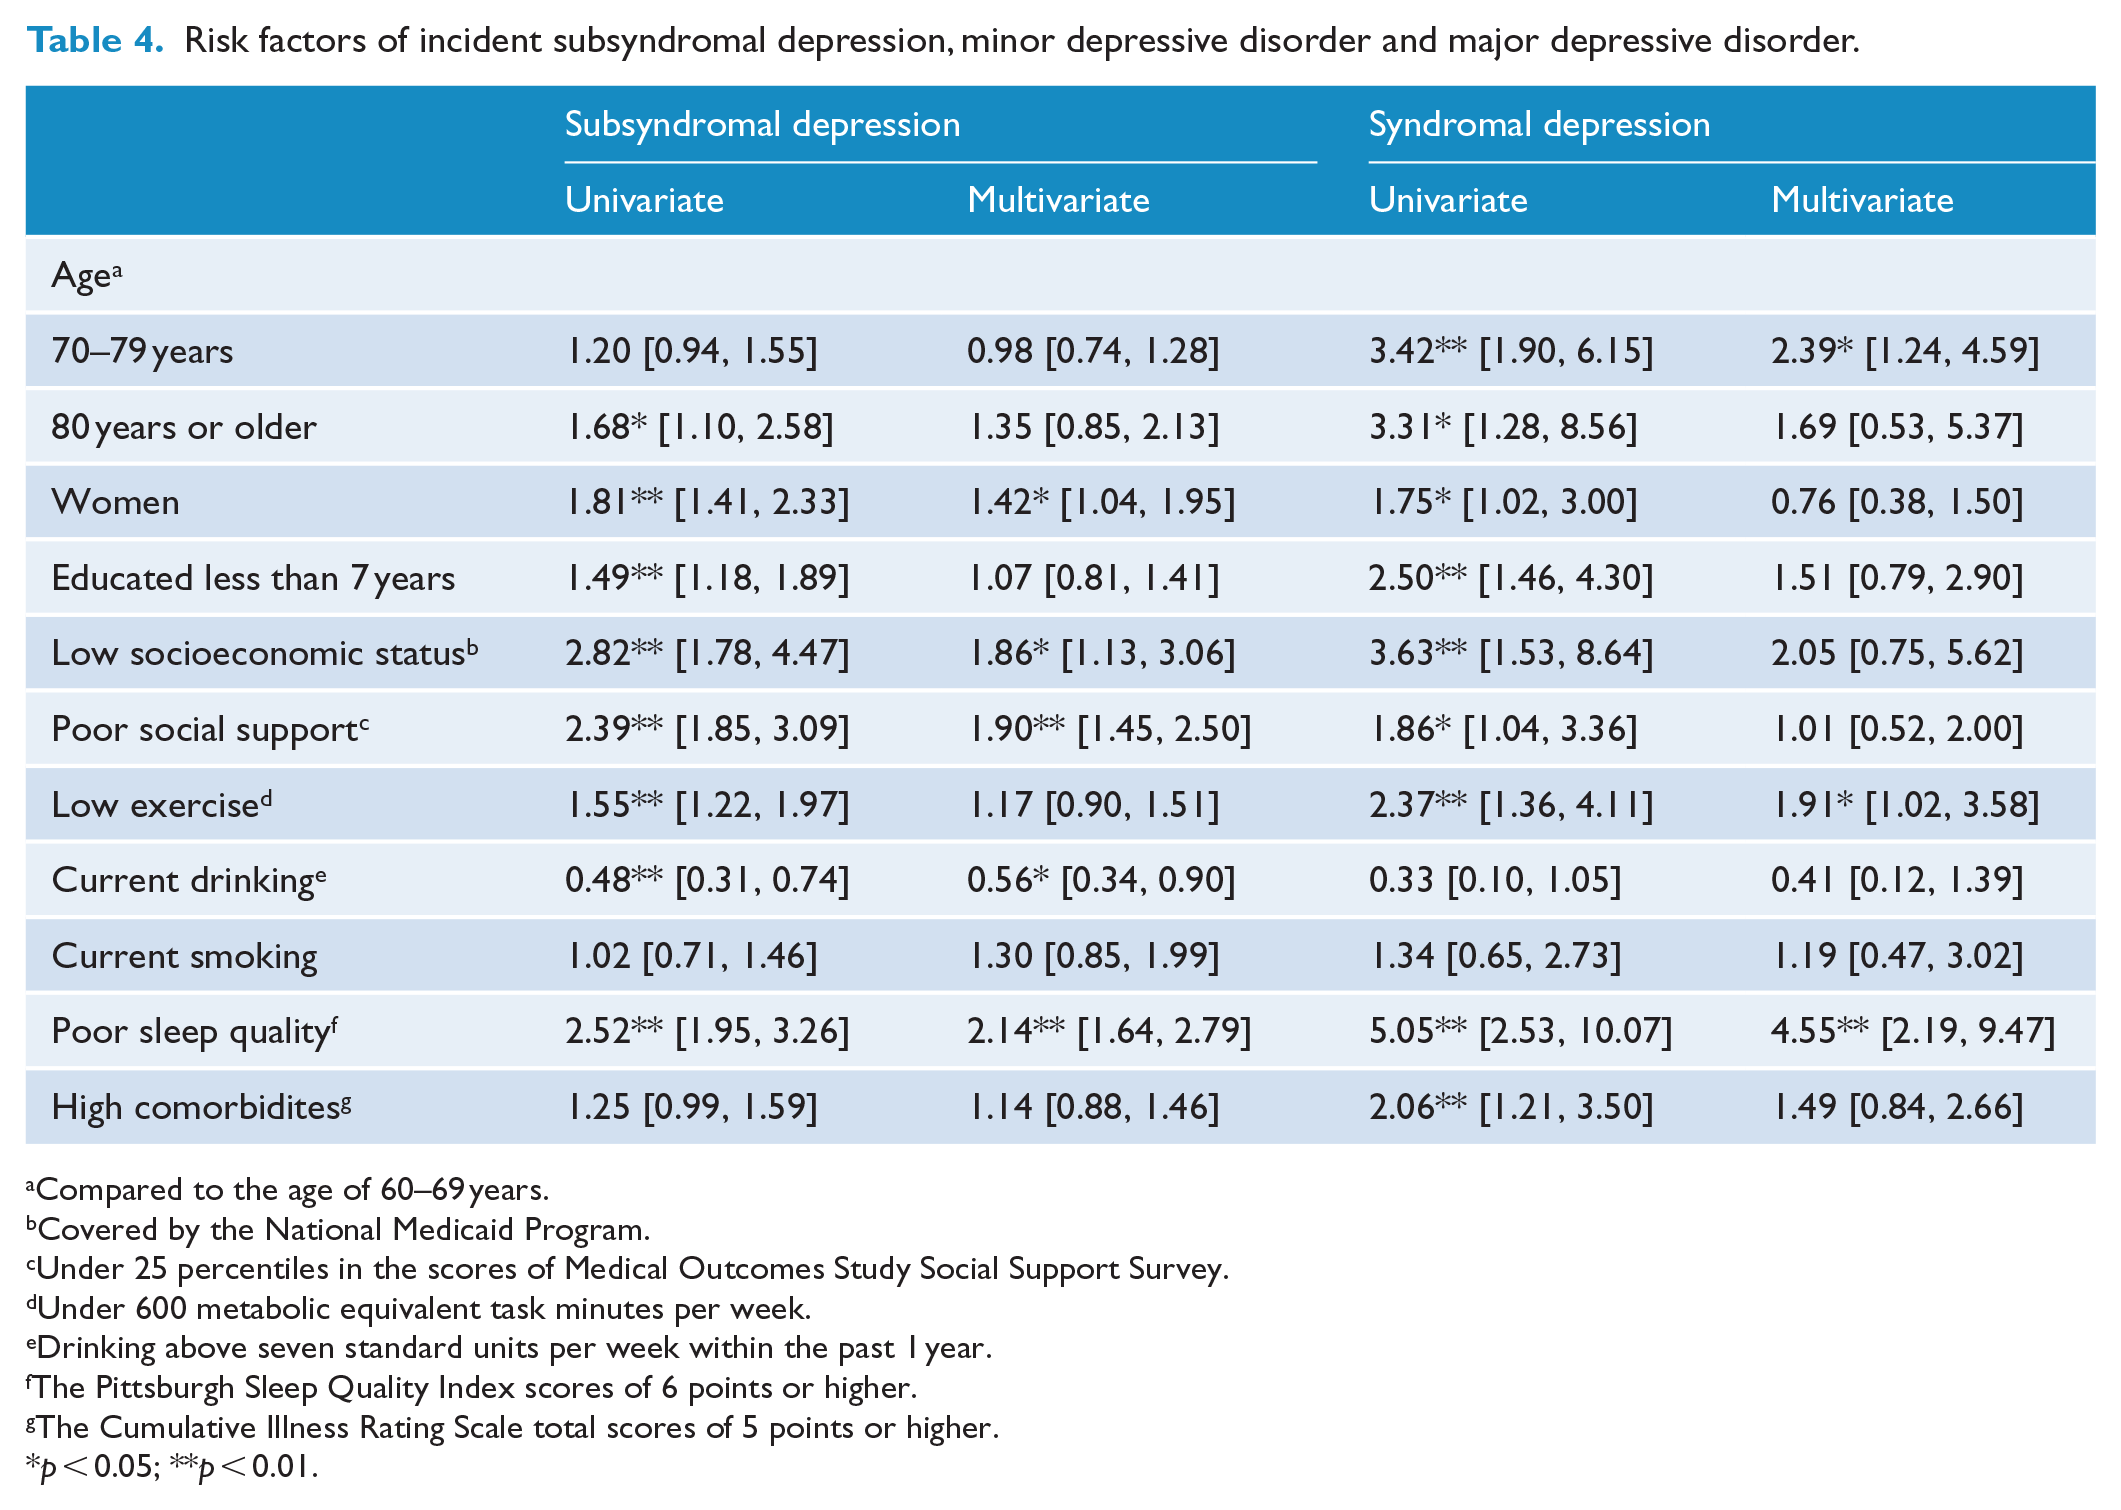
Compared to the age of 60–69 years.
Covered by the National Medicaid Program.
Under 25 percentiles in the scores of Medical Outcomes Study Social Support Survey.
Under 600 metabolic equivalent task minutes per week.
Drinking above seven standard units per week within the past 1 year.
The Pittsburgh Sleep Quality Index scores of 6 points or higher.
The Cumulative Illness Rating Scale total scores of 5 points or higher.
p < 0.05; **p < 0.01.
Discussion
To our knowledge, this is the first study to investigate both the prevalence and incidence of subsyndromal and syndromal depression simultaneously in an elderly population nationwide. This study proposed operational diagnostic criteria for SSD that were unambiguous in operation and showed that the SSD patients diagnosed by our criteria were clearly different from euthymic controls in late life.
In this study, SSD was approximately 2.5 times more prevalent than syndromal depression in late life, which was similar to the results of previous cross-sectional studies involving community-dwelling individuals (Meeks et al., 2011). However, SSD was approximately five times more incident than syndromal depression in late life. The incidence rates of SSD and syndromal depression have never been estimated simultaneously in a single population. The ratio of prevalence to incidence of syndromal depression was approximately twice that of SSD. Therefore, in late life, SSD may have a higher remission rate, lower recurrence rate, or higher mortality rate than those for syndromal depression (Freeman and Hutchison, 1980). Previous studies revealed that the remission rate of both conditions were comparable (Beekman et al., 2002) and that the mortality rate was slightly higher for syndromal depression than in SSD (Cuijpers et al., 2013). Although, to the best of our knowledge, there is no study on the recurrence rate of SSD in late life, a large population-based study reported that the recurrence rate was approximately four times higher than the incidence rate of syndromal depression in late life (Luijendijk et al., 2008). Further studies on the detailed course of SSD are warranted.
The prevalence and incidence estimates of SSD and syndromal depression increased with advancing age. However, in the multivariate logistic regression models used in this study, the effect of age on the risk for syndromal depression was significant, but this effect did not significantly influence the risk for SSD while the effects of socioeconomic status and social support significantly influenced the risk for SSD but not syndromal depression. These results suggest that the age-associated increase in the prevalence and incidence of SSD may be more attributable to age-associated socio-environmental factors such as the economic state or social support than to aging itself. In contrast to our observation, several previous studies reported that economic problems and poor social support were associated with a high risk for MDD in late life (Beekman et al., 2001; Green et al., 1992; Gureje et al., 2011; Harris et al., 2006; Koster et al., 2006; Lue et al., 2010). However, the patients enrolled in these studies might have included SSD patients because patients in these studies were diagnosed with MDD using a cutoff score after the completion of self-rated questionnaires by patients instead of using diagnostic criteria (Beekman et al., 2001; Harris et al., 2006; Koster et al., 2006; Lue et al., 2010). Differences in the methods of evaluating risk factors could have also contributed to the discrepancies in the results. For example, the association of social support with the risk for MDD was significant in studies that evaluated social support according to the size of one’s social network (Green et al., 1992; Gureje et al., 2011), but not significant in studies that evaluated social support based on emotional and instrumental support (Koster et al., 2006; Lue et al., 2010). In addition, a study that defined economic status as perceived financial stress found an effect of economic status on the risk for MDD (Lue et al., 2010), but this effect was not observed in another study which defined economic status as objective household incomes (Gureje et al., 2011).
Both SSD and syndromal depression were more prevalent and incident in women than in men. This gender disparity in the prevalence estimates was statistically significant in both SSD and syndromal depression. However, the gender disparity in the incidence estimates was significant in SSD only. In the multivariate logistic regression models used in this study, the effect of gender was significant on the risk for SSD but not on the risk for syndromal depression. The gender disparity in the incidence of MDD is consistent in younger populations (Kuehner, 2003), but varies in older populations (Buchtemann et al., 2012). The gender disparity in the prevalence of syndromal depression may be attributable to the gender disparity in the duration of illness associated with syndromal depression since the incidence of syndromal depression is comparable between men and women. Since the duration of illness is determined by the rates of remission and mortality (Centers for Disease Control and Prevention (CDC), 2012), we can speculate that MDD-related mortality may be higher in men because the remission rate of MDD is known to be similar across genders (Beekman et al., 2001; Harris et al., 2006). Ryan et al. (2008), and a study conducted by our research group (Jeong et al., 2013) revealed that MDD increased the risk of mortality in elderly men, but not in women. However, according to the reports of previous community-based studies (Hybels et al., 2002; Jeong et al., 2012; Ryan et al., 2008), SSD has no effect on mortality in both genders. Although only one study found a higher SSD-related mortality in men than in women, the diagnostic cutoff used in that study was much higher than that used in other studies (Penninx et al., 1999). Thus, in contrast to cases involving syndromal depression, gender disparity in the prevalence of SSD may be largely attributable to the gender disparity in its incidence rather than mortality.
Many epidemiological studies suggested that alcohol consumption above one standard drink per day in older adults might be beneficial (Corrao et al., 2004); however, the effect of alcohol use on the risk for late life depression has barely been investigated. In a previous prospective study, participants who consumed alcohol above one standard drink per day had a better subjective well-being and fewer depressive symptoms compared to those who never consumed any alcohol (Lang et al., 2007). In this study, we also found that alcohol use above seven standard drinks per week reduced the risk for SSD and syndromal depression, and its effect on the risk for SSD was statistically significant. In the elderly, regular alcohol consumption may reflect a healthy physical condition (Holdsworth et al., 2016) and may reduce the feeling of loneliness (Canham et al., 2016).
Although this study is the first nationwide prospective study focusing on the epidemiology of SSD diagnosed by clinical interview, it has several limitations. First, we did not examine the homogeneity, treatment responses and prognosis of the SSD diagnosed by our operational criteria. SSD diagnosed by our criteria warrants further research to get a peer consensus on its validity as a clinical entity. Second, the high dropout rate and the limited number of incident cases over even 4 years (33 mDD and 27 MDD) might have biased the results. Third, recall biases might have led to inaccurate estimation of the person-time at risk.
Conclusion
Although the concept of SSD between euthymia and syndromal depression has been discussed in the literature for many years, there are some controversies regarding the precise definition of SSD and its application in various clinical settings. We found that SSD can be diagnosed by the method similar to that used to diagnose syndromal depression, and was quite common in late life. We also found that SSD may be not merely a prodromal or preclinical state of syndromal depression, at least in late life, since it has epidemiological characteristics that differ from syndromal depression as well as euthymic controls.
Supplemental Material
Supplementary_table – Supplemental material for Epidemiological characteristics of subsyndromal depression in late life
Supplemental material, Supplementary_table for Epidemiological characteristics of subsyndromal depression in late life by Dae Jong Oh, Ji Won Han, Tae Hui Kim, Kyung Phil Kwak, Bong Jo Kim, Shin Gyeom Kim, Jeong Lan Kim, Seok Woo Moon, Joon Hyuk Park, Seung-Ho Ryu, Jong Chul Youn, Dong Young Lee, Dong Woo Lee, Seok Bum Lee, Jung Jae Lee, Jin Hyeong Jhoo and Ki Woong Kim in Australian & New Zealand Journal of Psychiatry
Footnotes
Declaration of Conflicting Interests
The author(s) declared no potential conflicts of interest with respect to the research, authorship and/or publication of this article.
Funding
The author(s) disclosed receipt of the following financial support for the research, authorship and/or publication of this article: This study was supported by a grant from the Korean Health Technology R&D Project, Ministry for Health, Welfare, & Family Affairs, Republic of Korea (grant no. A092077).
Supplemental Material
Supplemental material for this article is available online.
References
Supplementary Material
Please find the following supplemental material available below.
For Open Access articles published under a Creative Commons License, all supplemental material carries the same license as the article it is associated with.
For non-Open Access articles published, all supplemental material carries a non-exclusive license, and permission requests for re-use of supplemental material or any part of supplemental material shall be sent directly to the copyright owner as specified in the copyright notice associated with the article.