
Abstract
Objectives:
We aimed to investigate whether severity of cannabis dependence is associated with the neuroanatomy of key brain regions of the stress and reward brain circuits.
Methods:
To examine dependence-specific regional brain alterations, we compared the volumes of regions relevant to reward and stress, between high-dependence cannabis users (CD+, n = 25), low-dependence cannabis users (CD−, n = 20) and controls (n = 37).
Results:
Compared to CD− and/or controls, the CD+ group had lower cerebellar white matter and hippocampal volumes, and deflation of the right hippocampus head and tail.
Conclusion:
These findings provide initial support for neuroadaptations involving stress and reward circuits that are specific to high-dependence cannabis users.
Keywords
Introduction
Cannabis dependence (CD) affects over 13 million individuals worldwide and has the second highest global treatment burden for illicit substances (United Nations Office on Drugs and Crime [UNODC], 2016). Over 28% of admissions to treatment services for drug use problems are cannabis-specific (UNODC, 2016). Individuals with CD represent the most vulnerable of cannabis users and experience impaired mental health and well-being relative to recreational cannabis users and non-using controls (Pol et al., 2013). A key feature of dependence is compulsive drug use driven by negative reinforcement (i.e. negative emotions or distress when one cannot access drugs), despite the physical or psychological problems associated with maladaptive use patterns (e.g. neglect of obligations and impaired quality of life; American Psychiatric Association [APA], 2013). Drug dependence has been linked to neuroadaptations in neural circuits involved in reward, stress and motivation (Everitt and Robbins, 2016; Koob, 2009; Volkow et al., 2013). Neuroanatomical alterations of structures within these circuits (e.g. hippocampus, amygdala, striatum, and cerebellum) have been found in neuroimaging studies of regular cannabis users (Lorenzetti et al., 2016). However, neuroimaging studies of regular cannabis users have not consistently differentiated cannabis users with and without dependence/problematic use. Rather, they have compared regular cannabis users poorly characterised for levels of dependence to non-cannabis using controls. It is unclear whether cannabis users with and without CD show dissociable neural alterations as postulated by neuroscientific models of addiction (Everitt and Robbins, 2016; Koob, 2009; Volkow et al., 2013).
To address this knowledge gap, we compared neuroanatomical features between cannabis users with high-dependence (CD+), low-dependence (CD−) and controls. Specifically, we examined whether the volumes of brain regions that neuroscientific models of addiction implicate in reward, stress regulation, learning and memory, and emotion regulation differ between these groups. Regions included the amygdala, hippocampus, pituitary, nucleus accumbens (NAc), caudate, putamen, pallidum and the cerebellum (total, grey matter [GM] and white matter [WM]). We hypothesised that CD+ relative to CD− and controls would show reduced medial temporal and cerebellar volumes, and larger volumes of reward and stress regions (i.e. pituitary and striatal regions). We followed up hippocampal volume results with shape analyses to identify alterations specific to hippocampal subregions.
Methods
We recruited 45 regular cannabis users, which included 25 CD+ and 20 CD− defined using the cut-off of the Severity of Dependence Scale (SDS) ⩾ 4 (Gossop et al., 1995). We also recruited 37 non-user controls. All participants had no recent or past medical or psychiatric conditions and had limited illicit substance use (apart from cannabis use in users). All assessments were conducted by trained researchers and student researchers. Global Assessment of Functioning scores were estimated as part of the Structured Clinical Interview for DSM-IV-TR (SCID) assessment (Bodlund et al., 1994). Intelligence quotient was assessed with the Wechsler Abbreviated Scale of Intelligence (Wechsler, 1999). Depressive, and positive and negative psychotic symptoms were measured using the Community Assessment of Psychic Experiences (CAPE; Konings et al., 2006), and trait anxiety was assessed with the Spielberger State-Trait Anxiety Inventory (STAI; Spielberger, 2010). Past month alcohol dosage in standard drinks was estimated using the Timeline Followback procedure (Sobell and Sobell, 1992). Lifetime cannabis use was assessed with a detailed semi-structured interview used in previous works (Lorenzetti et al., 2015; Solowij et al., 2002, 2011a, 2011b; Takagi et al., 2011a, 2011b; Yücel et al., 2008). This provided information on cannabis use frequency (days/month), duration of regular cannabis use and lifetime cannabis dosage (daily dosage × smoking days/month × months of regular use). Lifetime cannabis dosage was standardised to cones via the following method – https://ncpic.org.au/static/pdfs/assessment-tools/timeline-followback.pdf. CD severity scores were obtained using the SDS (Budney et al., 1999).
MRI data acquisition
T1-weighted structural magnetic resonance (MR) images were acquired with a 3T Siemens TIM Trio scanner with a 32-channel head coil. Images were acquired sagittally with a high-resolution imaging three-dimensional (3D) magnetization-prepared rapid acquisition with gradient echo (MPRAGE) sequence (time to repetition [TR] = 1900 ms, time to echo [TE] = 2.15 ms, field of view [FOV] = 256 mm) and were resized to 1 mm3 isotropic voxels.
MRI data processing
Each amygdala, hippocampus and pituitary were manually delineated in the coronal plane where these regions are best visualised, using validated protocols. The same investigator (V.L.) performed all tracings while blind to group status and using Analyze 11.0 (AnalyzeDirect, Overland Park, KS). Volumetric estimates were obtained by summing all voxels within traced regions of interest on consecutive coronal slices. For each region, inter- and intra-rater reliabilities for manual tracings were computed using intraclass correlation coefficients (ICCs), absolute agreement based on 10 randomly selected images.
We defined the boundaries of the amygdala using the protocol developed by Velakoulis et al. (1999, 2006), with slight modifications based on Watson et al.’s (1992) protocol for defining the boundary between the amygdala and the hippocampus. In addition, we considered the anterior boundary of the amygdala as either the slice posterior to where the optic chiasm joins or where the lateral sulcus closes to form the entorhinal sulcus, whichever was more posterior. ICCs for right and left amygdala volumes were 0.96 and 0.91, respectively, for intra-rater reliability, and 0.95 and 0.88, respectively, for inter-rater reliability, as compared with an experienced amygdala tracer (SLW).
The hippocampus was traced following reliable and validated protocols (Convit et al., 1999; Cook et al., 1992; Velakoulis et al., 2006). The hippocampal boundaries were as follows: posterior, the slice with the greatest length of continuous fornix; medial, the open end of the hippocampal fissure posteriorly, the uncal fissure in the hippocampal body and the medial aspect of the ambient gyrus anteriorly; lateral, the temporal horn of the lateral ventricle; inferior, the WM inferior to the hippocampus; superior, the superior border of the hippocampus; and anterior, the alveus was used to differentiate the hippocampal head from the amygdala. The anterior border was the most difficult to identify consistently and was aided by moving between slices before and after the index slice. ICC for right and left hippocampal volumes were 0.95 and 0.93, respectively, for intra-rater reliability, and 0.92 and 0.84, respectively, for inter-rater reliability, compared to an experienced hippocampus tracer (SLW).
The pituitary gland was traced using a modified version (Pariante et al., 2004) of a reliable and validated method (MacMaster et al., 2006; MacMaster and Kusumakar, 2004; Sassi et al., 2001). We excluded the infundibular stalk from the tracing, but included the hyper-intense region in the posterior pituitary, which is thought to represent high levels of vasopressin concentrations (Garner et al., 2005; Pariante et al., 2004; Sassi et al., 2001). The borders of the pituitary were clearly defined superiorly by the diaphragma sellae, inferiorly by the sphenoid sinus and bilaterally by the cavernous sinuses (Garner et al., 2005; Pariante et al., 2004). ICCs for intra- and inter-rater reliabilities (compared to an experienced tracer, SLW) were 0.94 and 0.98, respectively.
Finally, the caudate, NAc, pallidum, putamen, cerebellar cortex and cerebellar GM and WM were automatedly extracted with FreeSurfer v.4.1.0 (http://surfer.nmr.mgh.harvard.edu/). These regions were visually inspected in the coronal plane to confirm the validity of the allocated boundaries, and for outliers using scatter plots of their volumes, following standardised and publicly available protocols (http://enigma.ini.usc.edu/protocols/imaging-protocols/).
Statistical analyses
Chi-square tests were run to compare groups by sex distribution. A series of analyses of variance (ANOVAs) were run to compare groups on demographics (i.e. age), global function, psychopathology symptom scores (e.g. CAPE depressive, positive and negative psychotic symptoms), STAI-Trait anxiety and substance use (e.g. alcohol standard drinks/month, cannabis smoking days/month, cumulative lifetime dosage in cones, duration of regular use and SDS severity of CD).
Separate analyses of covariance (ANCOVAs) were run for each brain region to assess for the main effect of CD, with hemisphere as repeated-measure (except pituitary), and group (i.e. controls, CD−, and CD+) and sex as between-subject factors. Of the possible covariates – age, intracranial volume (ICV), global functioning, level of alcohol use, and depressive and anxiety symptom scores, we kept those that were significant predictors in the models. We explored the role of dosage and dependence on brain volumes separately in CD+ and CD− using hierarchical linear regressions with ICV and sex included as block one predictors, and cumulative lifetime dosage in cones and SDS score as block two predictors.
An exploratory analysis of hippocampal shape was run, to compare subregional differences between groups. This analysis was motivated by the considerable evidence of hippocampal volume alteration (Lorenzetti et al., 2019) and emerging evidence of potential shape alteration associated with cannabis use (Chye et al., 2019; Solowij et al., 2013). We sought to verify previous hippocampal shape findings and extend upon these by examining CD-related associations. The manually traced hippocampi were transformed into a mesh output using the SPHARM shape analysis pipeline. Group differences were assessed, controlling for sex and ICV, using SPHARM-PDM (http://www.nitrc.org/projects/spharm-pdm). Use of the manually traced (i.e. the gold standard for brain analysis) hippocampal region affords us more confidence in the sensitivity of the delineated boundary shape.
Results
Sample characteristics and brain volumes are shown in Tables 1 and 2, respectively. All groups were matched by age, sex and monthly standard drinks. The CD− group had lower global functioning than controls. The CD+ group had lower IQ than controls, and lower global functioning and higher trait anxiety than the CD− and control groups. The CD+ and CD− groups were matched on lifetime cannabis dosage in cones and years of regular cannabis use, but the CD+ group had higher smoking days/month and higher CD scores.
Sample characteristics of non-cannabis using controls, low-dependence cannabis users (CD−) and high-dependence cannabis users (CD+), presented as mean (SD).
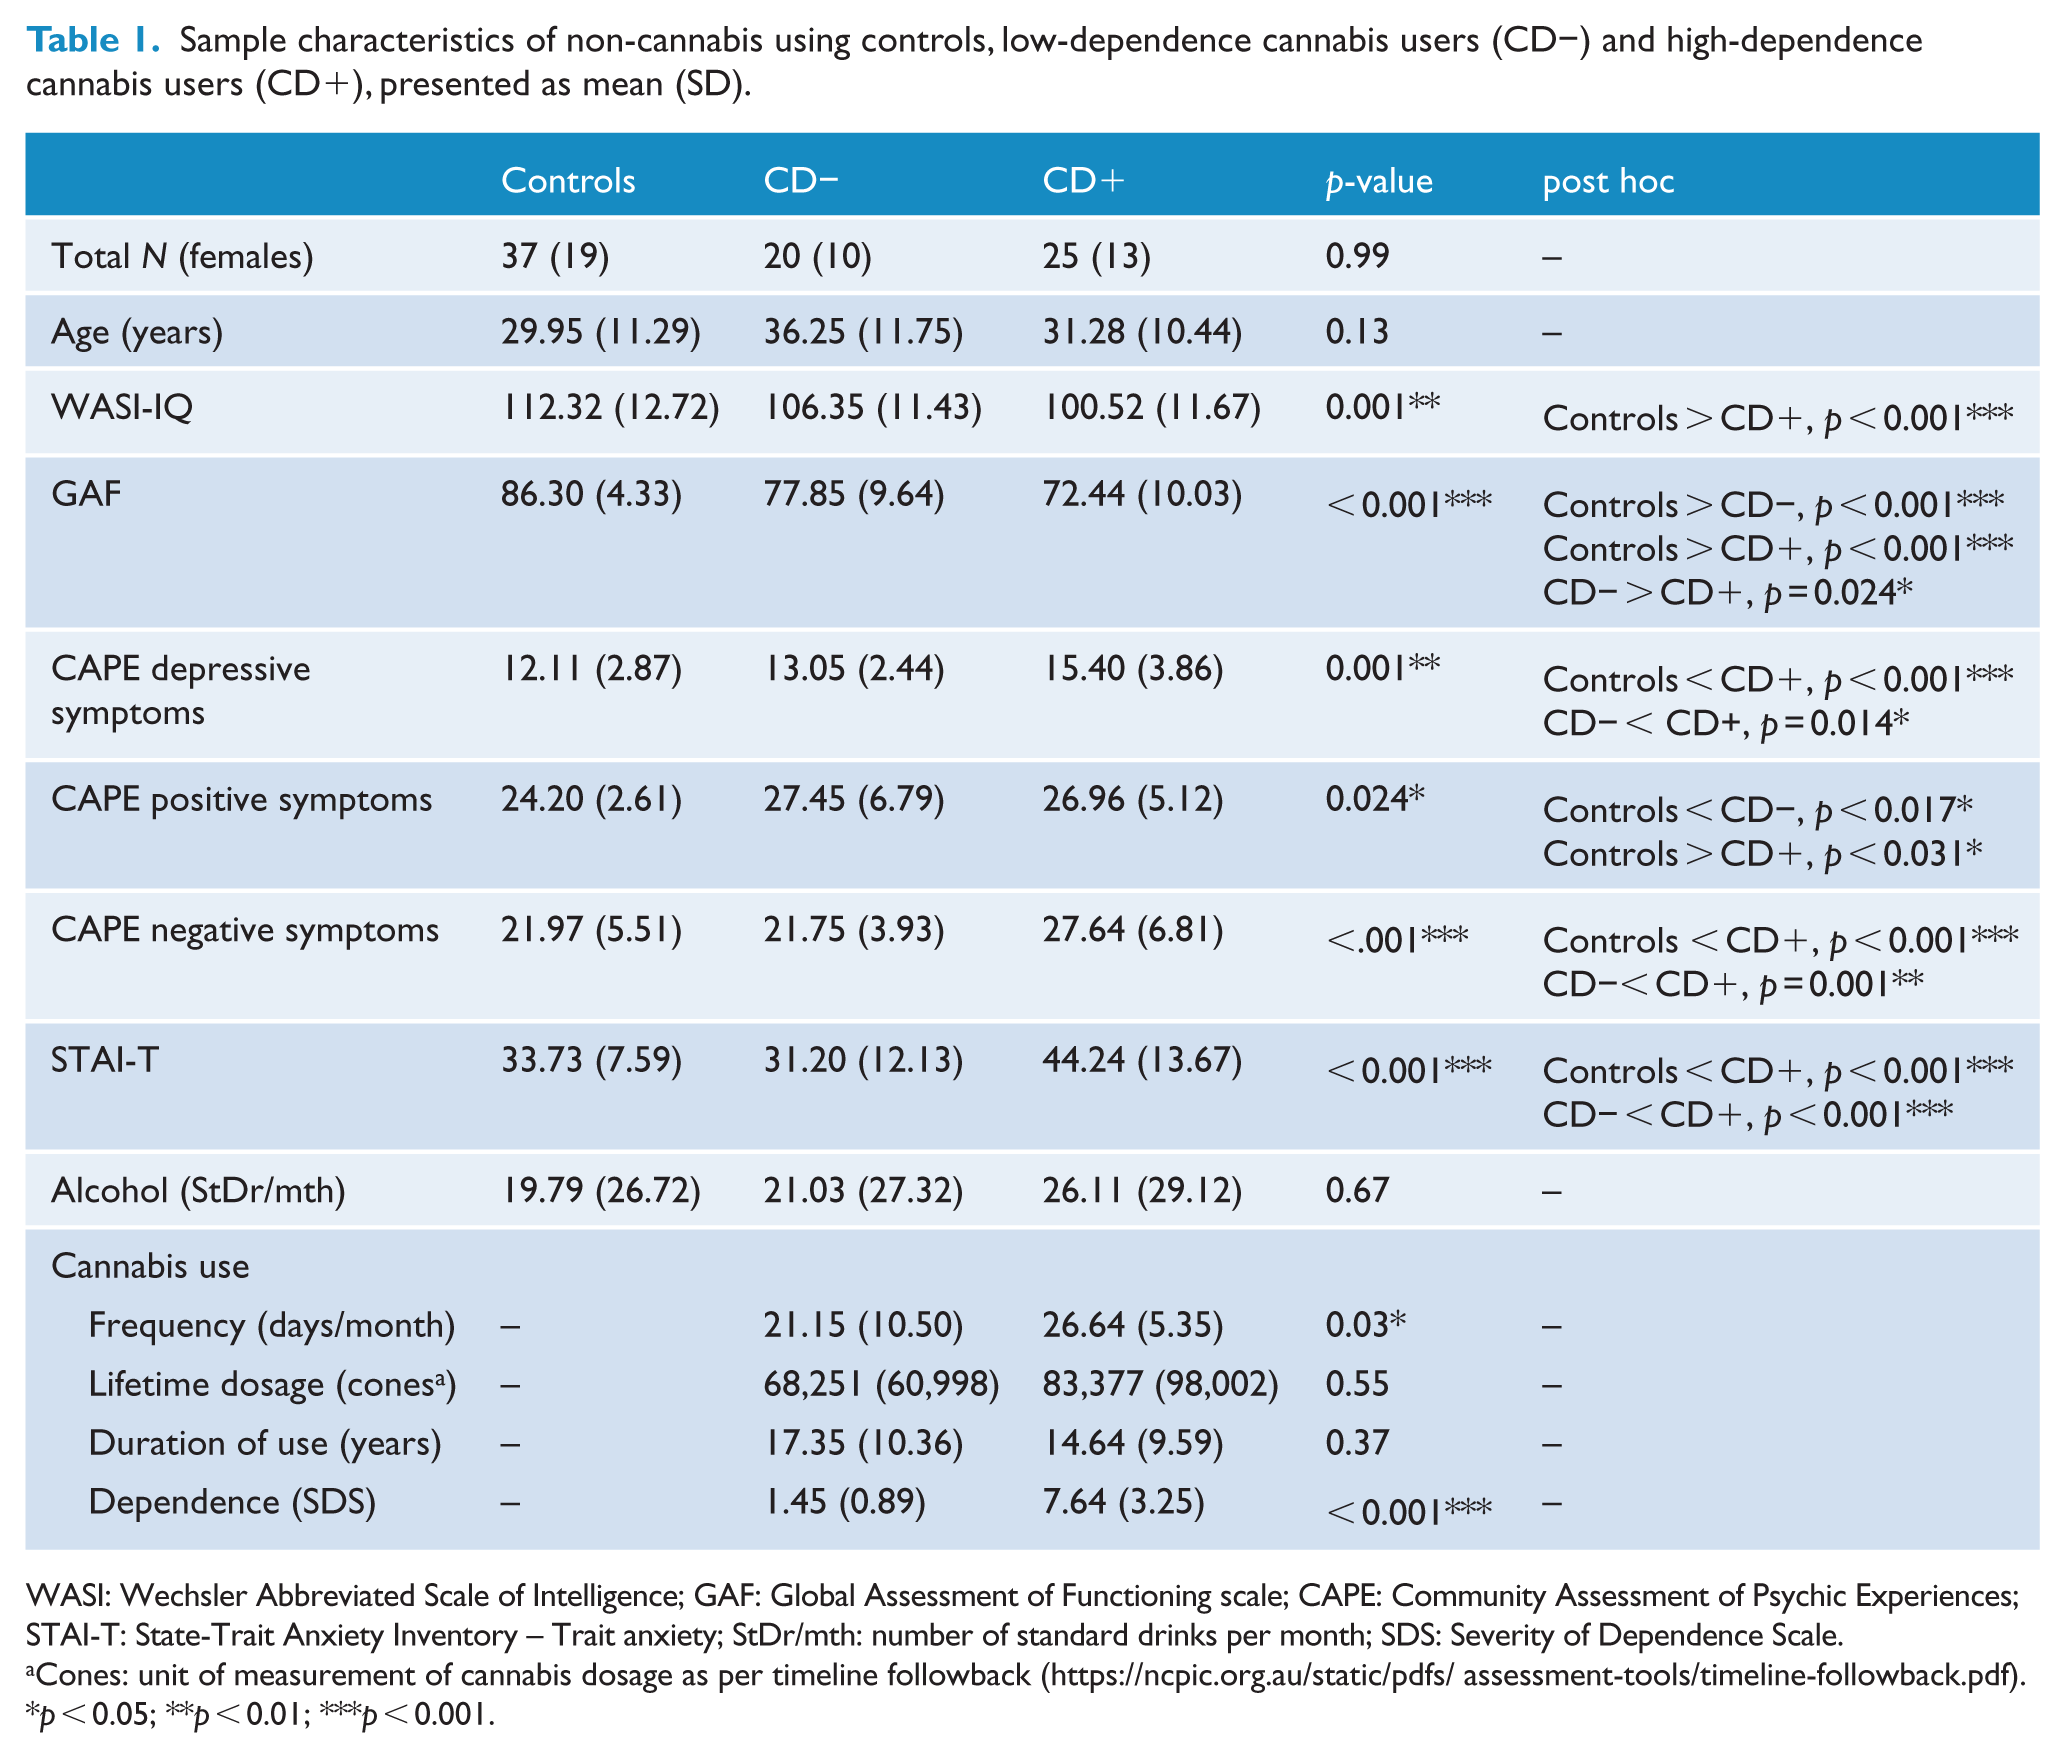
WASI: Wechsler Abbreviated Scale of Intelligence; GAF: Global Assessment of Functioning scale; CAPE: Community Assessment of Psychic Experiences; STAI-T: State-Trait Anxiety Inventory – Trait anxiety; StDr/mth: number of standard drinks per month; SDS: Severity of Dependence Scale.
Cones: unit of measurement of cannabis dosage as per timeline followback (https://ncpic.org.au/static/pdfs/assessment-tools/timeline-followback.pdf).
p < 0.05; **p < 0.01; ***p < 0.001.
Subcortical volumes in non-cannabis using controls, low-dependence cannabis users (CD−) and high-dependence cannabis users (CD+), presented as mean (SD).
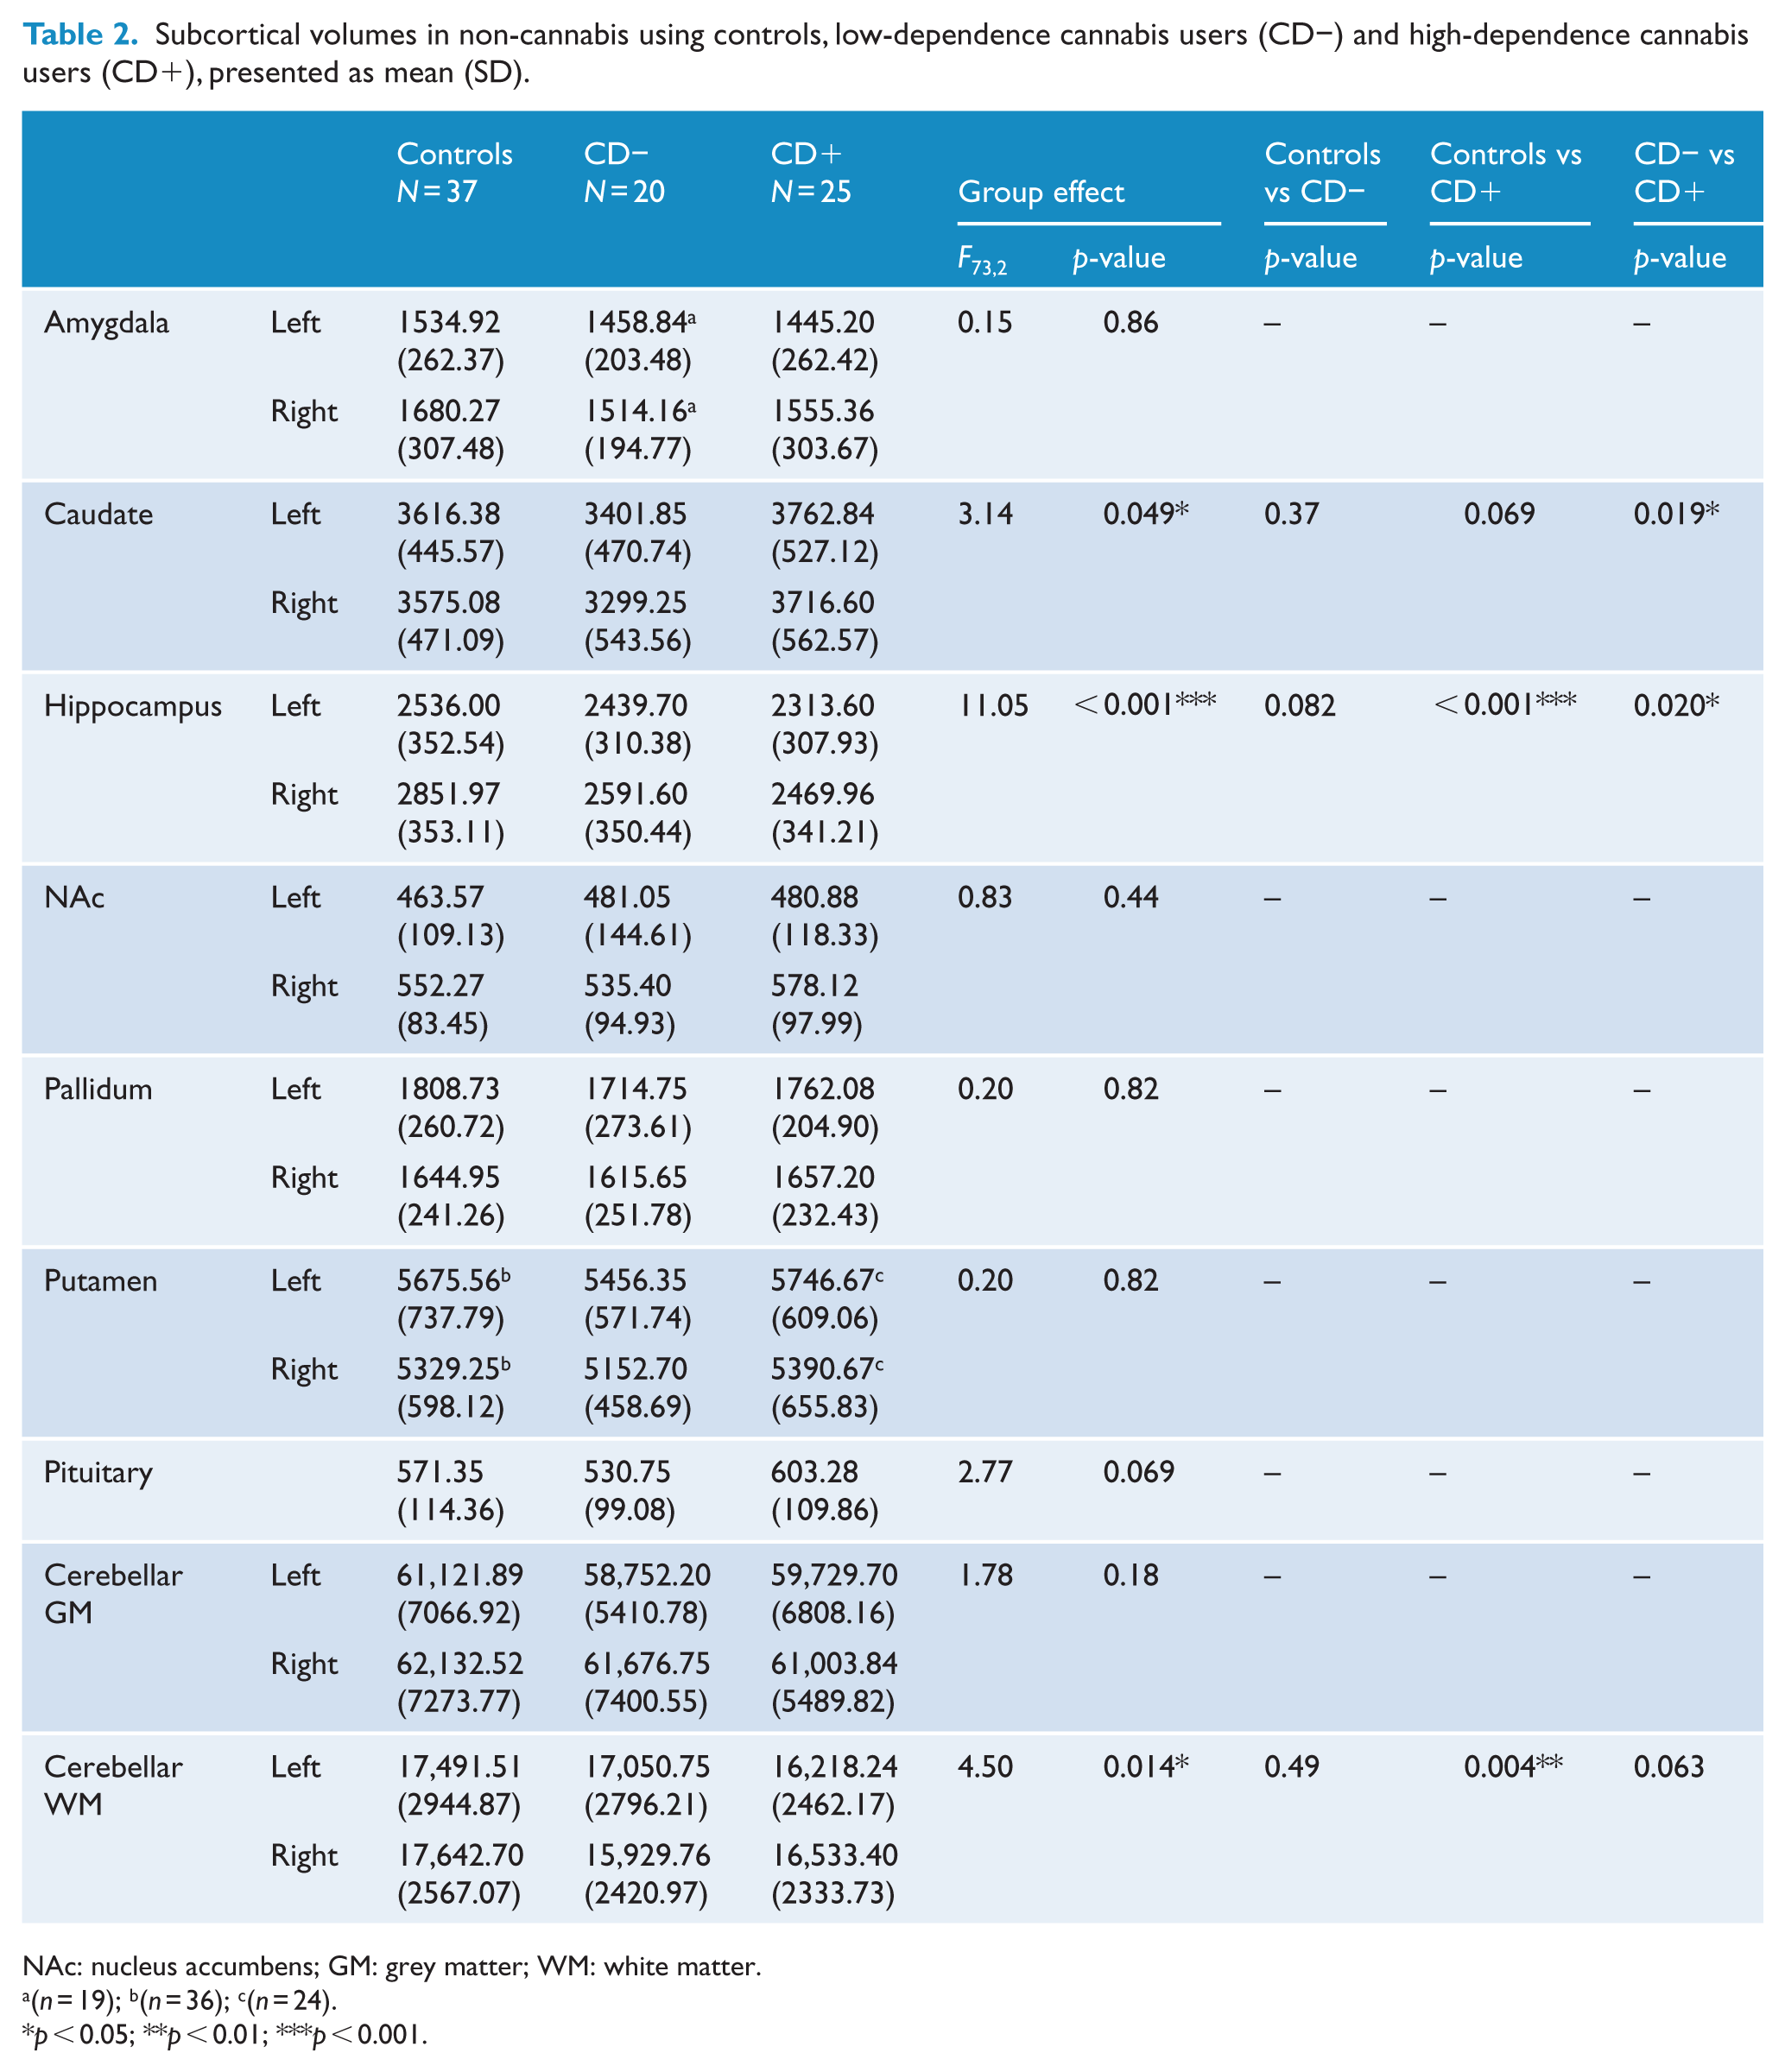
NAc: nucleus accumbens; GM: grey matter; WM: white matter.
(n = 19); b(n = 36); c(n = 24).
p < 0.05; **p < 0.01; ***p < 0.001.
There was a significant main effect of group on the volumes of cerebellar WM (p = 0.014,
Exploratory shape analysis (i.e. group comparison between healthy controls [HC], CD+ and CD−, controlling for xyz) was conducted on the hippocampus, given the strength of hippocampal volumetric findings. The right hippocampal head and tail shape was altered in CD+ compared to controls (i.e. inward shape deformation; Figure 1). There were no other significant effects.
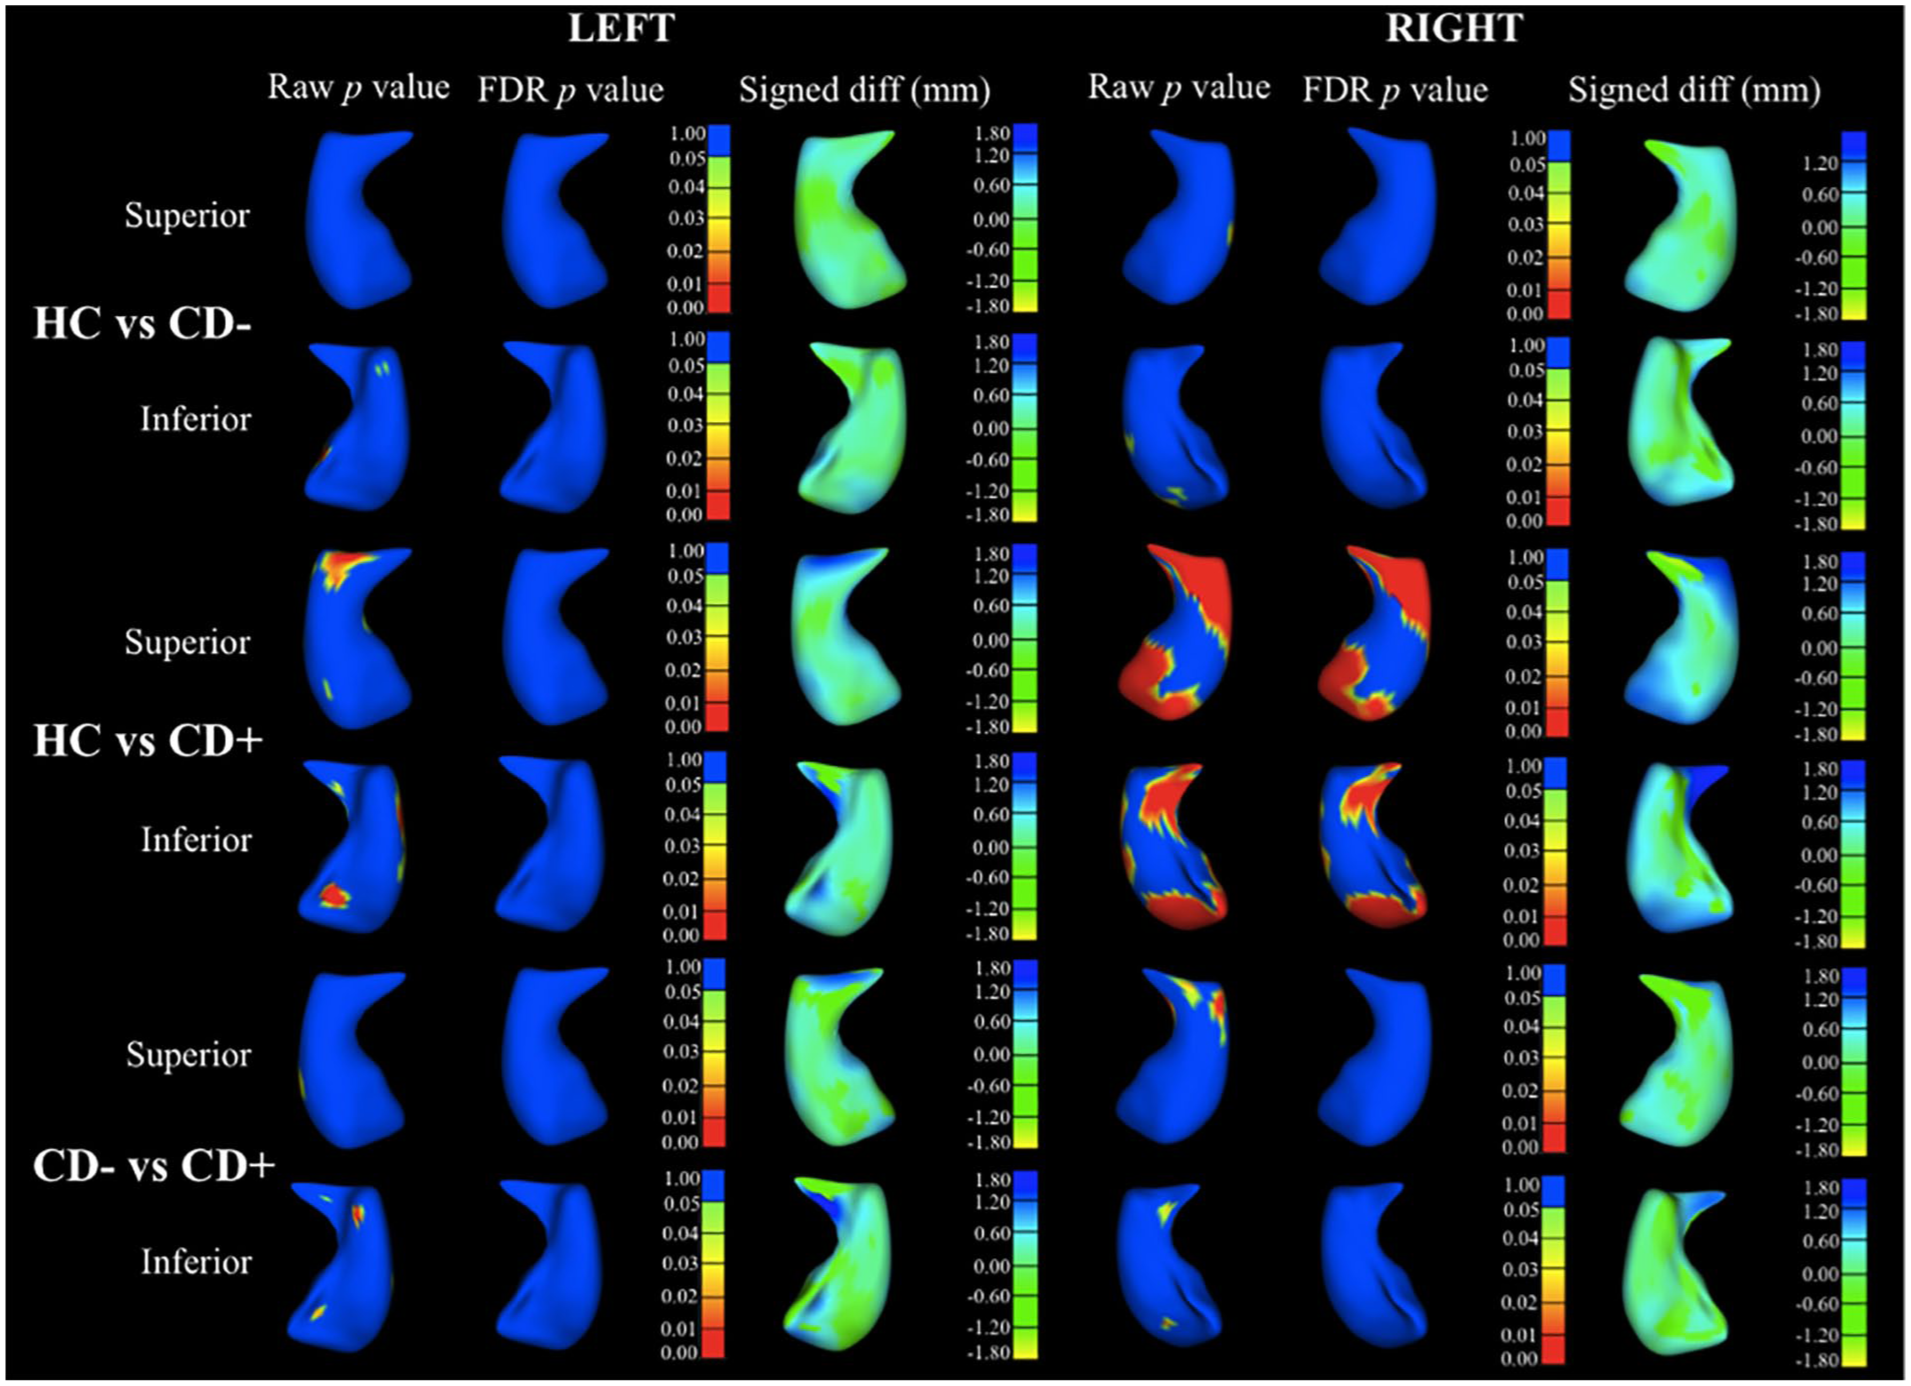
Significance map of shape analysis showing comparison in right and left hippocampus (superior and inferior view) between healthy controls (HC) versus low-dependence cannabis users (CD−), HC versus high-dependence cannabis users (CD+) and CD− versus CD+, including raw and false discovery rate (FDR)-corrected group differences, and their visual representation using heat maps plotted into deformable models of hippocampal surface (signed difference).
Discussion
In line with previous findings in regular cannabis users (Lorenzetti et al., 2016), we found that cannabis use was related to the structural integrity of the cerebellum, hippocampus and caudate. However, we found that alterations in some structures were specific to those with more severe dependence. Specifically, we found that CD+ had lower cerebellar WM volumes, and deflation within the hippocampus head and tail, relative to controls. CD+ had lower hippocampal volumes relative to CD− and controls. In addition, CD+ had larger caudate volumes relative to CD− (Chye et al., 2017). No significant group differences emerged for the volumes of the amygdala, NAc, pallidum, putamen, pituitary and cerebellar cortex.
Volumetric alterations in individuals with high levels of CD may be specific to regions involved in substance dependence. The hippocampus and the cerebellum have been involved in the formation of drug-related and emotional memories involved in craving and drug-taking (Everitt and Robbins, 2016; Koob, 2009; Volkow et al., 2013). The cerebellum has been implicated in aberrant reward processing and motivation in drug dependence (Casajuana et al., 2016) and the hippocampus in altered stress, reward, and learning and memory in cannabis users. Volumetric reductions of the hippocampus are consistent with the results of a recent meta-analysis comparing brain volumes between cannabis users and controls (Lorenzetti et al., 2019). This meta-analysis did not segregate dependent and non-dependent cannabis users as this information was lacking in most studies (Lorenzetti et al., 2019). The meta-analysed samples of regular cannabis users may have comprised both dependent and non-dependent cannabis users (Budney et al., 2019), and it is possible that dependent cannabis users may have driven the observed hippocampal volume reduction.
Alteration of cerebellar neuroanatomy has been reported in several structural neuroimaging studies of regular cannabis users (Blithikioti et al., 2019; Solowij et al., 2011b). It is unclear whether specific cerebellar regions are vulnerable to cannabis use and dependence. The literature to date has examined heterogeneous cerebellar regions (e.g. total volume, vermis, grey and/or WM, and distinct lobules) and has relied on distinct methods to parcellate the cerebellum in different portions. Also, knowledge of the role of the cerebellum in addiction and other psychopathology is limited as its inferior portion is commonly cut off or ‘sacrificed’ in MRI acquisition sequences, to include higher order cortical regions.
CD+ had larger caudate volumes than CD−. The caudate is part of the corticostriatal circuit implicated in addiction models of maladaptive reward-learning and behaviour (Volkow et al., 2013). Our finding suggests that CD severity affects caudate volume, as recently reported (Chye et al., 2017), and adds to a body of inconclusive work on drug-related alteration in this area. Caudate volumes were not significantly different in a recent meta-analysis that compared brain volumes in regular cannabis users and controls (Lorenzetti et al., 2019). The volume of the caudate may be affected in dependent users specifically (i.e. not in recreational non-problem users), and this alteration may be conflated because the cannabis using samples examined to date included both people with and without CD.
The impact of CD on neuroanatomy may be regionally specific and driven by distinct mechanisms. Effect sizes and FDR correction showed that group differences in caudate volumes were less marked than those in the hippocampus and cerebellum. The hippocampus and cerebellum have a higher concentration of cannabinoid receptors than the caudate (Glass et al., 1997) and may be more vulnerable to the effects of tetrahydrocannabinol (THC), the key cannabinoid compound which determines cannabis potency and addiction liability. In contrast, alterations of the caudate may reflect a neuroadaptation resulting from habitual substance use (Schwabe and Wolf, 2011) as observed in samples dependent on substances other than cannabis, such as cocaine (Pierce and Vanderschuren, 2010), alcohol (Sjoerds et al., 2013) and gaming (Ko et al., 2009).
The CD-specific effects that we report here add to emerging evidence that dependence drives brain structural and functional differences in regular cannabis users (Chye et al., 2017; Filbey and Dunlop, 2014). Previous work has emphasised a lack of dose-dependent relationships in brain areas that differ between cannabis users and non-users, pointing towards a need to carefully re-evaluate the role of dosage versus dependence in the neuroalterations reported in cannabis users. Alteration of striatal dopaminergic pathways (Bloomfield et al. 2016; van de Giessen et al. 2017), which have been associated with dependence severity (Volkow et al., 2013), may underlie the neuroanatomical differences between cannabis users and controls (Woodward et al. 2009). However, to our knowledge, no study has specifically examined the association between CD, dopaminergic function and striatal (including caudate) volume.
Our sample did not show volumetric alterations of several brain regions (e.g. amygdala, ventral striatum) implicated in neuroscientific theories of addiction (Casajuana et al., 2016; Everitt and Robbins, 2016; Koob, 2009; Volkow et al., 2013). As these theories rely mostly on preclinical studies of substance use and on drugs other than cannabis (e.g. alcohol), our results suggest that exposure to cannabis versus other substances implicates partially distinct neural pathways. This notion needs validation in larger samples and systematic comparison between users of cannabis and other substances.
Our findings warrant examination of CD – rather than dosage/frequency/age of onset alone – in future studies of cannabis users. The previously reported hippocampal and cerebellar volume alterations in samples of recreational/regular cannabis users (not segregated by dependence level) may be driven by a subgroup of more severely dependent users. Notably, CD+ in this study smoked cannabis more frequently (5 days/month on average or more) than CD−, but otherwise the groups did not differ on duration of cannabis use or cumulative lifetime dosage (see Table 1). Lifetime dosage encapsulated frequency of use (calculated as cannabis quantity used/month × number of smoking days/month × years of use), and yet was not a significant predictor of brain volumes in regression analyses.
This study is limited by the lack of a rigorous diagnostic assessment of cannabis use disorder (CUD; Diagnostic and Statistical Manual of Mental Disorders [5th ed.; DSM-5]; APA, 2013). Replication is warranted in larger samples with varying levels of CUD severity (i.e. mild, moderate and severe) and sensitive measures of cannabis dosage, frequency, duration, onset and dependence. Another limitation is that our exploratory shape analyses were not performed for brain regions other than the hippocampus (e.g. cerebellum, caudate). The hippocampus is most often implicated in cannabis use–related neuroalterations (both volume and shape), where studies have shown consistently stronger effect size in comparison with other structures (Lorenzetti et al., 2019). As such, the shape analysis in this paper allowed us to extend hippocampal findings to understand surface-related differences associated with CD. Finally, we did not assess the neural effects of distinct cannabinoid compounds with neuroprotective and neurotoxic properties (e.g. THC and cannabidiol), motivation for using cannabis and self-medication, and perceived beneficial effects from using. These factors are largely unexplored and should be assessed in future work to inform a detailed understanding of the neural correlates of cannabis use and policies on the decriminalisation of cannabis products.
Our findings indicate that CD is related to volumetric alterations in specific brain regions, including the hippocampus and the cerebellum (where group differences had the strongest effect sizes) and the caudate. This work complements emerging structural neuroimaging findings showing that the structure of other cortical brain regions (i.e. orbitofrontal cortex) is associated with CD, rather than recreational non-dependent use (Chye et al., 2017). Future work will be necessary to verify whether alterations in reward, stress and addiction-relevant brain circuits are associated more with dependence on cannabis (i.e. dependence-related effects) than regular non-problem cannabis use per se (e.g. effects due to exposure to cannabinoids), and how CD-related alterations may differ from those of dependence on other drugs.
Footnotes
Acknowledgements
This research was conducted at the Children’s MRI Centre, Royal Children’s Hospital, Melbourne Victoria. It was supported by the Murdoch Children’s Research Institute and Royal Children’s Hospital.
Declaration of Conflicting Interests
The author(s) declared no potential conflicts of interest with respect to the research, authorship and/or publication of this article.
Funding
The author(s) received the following financial support for the research, authorship and/or publication of this article: This study was supported by a NHMRC Project Grant (#459111). Yann Chye was supported by a Monash Postdoctoral Bridging Fellowship. Sarah Whittle was supported by a National Health and Medical Research Council (NHMRC) Career Development Fellowship L2 (APP1125504). Christos Pantelis was supported by a NHMRC Senior Principal Research Fellowship (1105825). Alex Fornito was supported by the Sylvia and Charles Viertel Foundation.