
Abstract
Background:
Mood disorders likely occur in someone with a genetic predisposition who encounters a deleterious environmental factor leading to dysregulated physiological processes due to genetic mutations and epigenetic mechanisms altering gene expression. To gain data to support this hypothesis, we measured levels of gene expression in three cortical regions known to be affected by the pathophysiologies of major depression and bipolar disorders.
Methods:
Levels of RNA were measured using the Affymetrix™ Human Exon 1.0 ST Array in Brodmann’s areas 9, 10 and 33 (left hemisphere) from individuals with major depression, bipolar disorder and age- and sex-matched controls with changed expression taken as a fold change in RNA ⩾1.2 at p < 0.01. Data were analysed using JMP® genomics 6.0 and the probable biological consequences of changes in gene expression determined using Core and Pathway Designer Analyses in Ingenuity Pathway Analysis.
Results:
There were altered levels of RNA in Brodmann’s area 9 (major depression = 424; bipolar disorder = 331), Brodmann’s area 10 (major depression = 52; bipolar disorder = 24) and Brodmann’s area 33 (major depression = 59 genes; bipolar disorder = 38 genes) in mood disorders. No gene was differentially expressed in all three regions in either disorder. There was a high correlation between fold changes in levels of RNA from 112 genes in Brodmann’s area 9 from major depression and bipolar disorder (r2 = 0.91, p < 0.001). Levels of RNA for four risk genes for major depression were lower in Brodmann’s area 9 in that disorder.
Conclusion:
Our data argue that there are complex regional-specific changes in cortical gene expression in major depression and bipolar disorder that includes the expression of some risk genes for major depression in those with that disorder. It could be hypothesised that the common changes in gene expression in major depression and bipolar disorder are involved in the genesis of symptoms common to both disorders.
Introduction
Concordance rates between monozygotic twins for major depression (MD; ~40%) and bipolar disorders (BD; ~50%) argue that the causes of these disorders are not wholly genetic. To accommodate these observations, it is currently hypothesised that MD and BD occur in a genetically predisposed individual and are triggered by exposure to a deleterious environmental factor (Craddock, 2006). It is now known that environmental factors can change the activity of biochemical pathways through the modulation of epigenetic mechanisms, which act to change gene expression, and therefore, it is likely that the aetiologies of MD and BD involve changes in gene expression brought about by a combination of the actions of inherited risk genes and changes in epigenetic mechanisms occurring in response to environmental factors. This notion has led to studies to identify changes in gene expression in the central nervous system (CNS) from individuals with MD and BD, particularly in the cortex as cortical dysfunction is present in both disorders (Drevets et al., 2008).
Following the posit that changes in cortical gene expression contribute to the aetiologies of mood disorders, a number of studies used gene expression arrays to compare levels of gene expression in the cortex of individuals with MD and BD to that in individuals with no history of psychiatric disorders (Controls). These studies report that changes in gene expression in the cortex from individuals with MD would impact on glutamatergic signalling, GABAergic signalling (Aston et al., 2004; Sequeira et al., 2009), synaptic function, oligodendrocyte function (Choudary et al., 2005), cell proliferation (Klempan et al., 2009; Tochigi et al., 2008), RNA processing (Sequeira et al., 2007), signal transduction, metabolism (Kang et al., 2007), gene transcription and myelination (Klempan et al., 2009). In BD, changes in gene expression would impact on the transforming growth factor β1, caspase 8 (Bezchlibnyk et al., 2001), oligodendrocytes, myelination (Tkachev et al., 2003), mitochondrial function (Sun et al., 2006) and nervous system development (Nakatani et al., 2006). In addition, some studies have argued that there are commonalities in changes in cortical gene expression between MD and BD (Iwamoto et al., 2004; Tkachev et al., 2003), which may reflect some shared aetiologies (Cuellar et al., 2005). Finally, studies have not found omnibus changes in gene expression across multiple cortical regions in MD (Choudary et al., 2005; Evans et al., 2004; Klempan et al., 2009; Sequeira et al., 2007; Sequeira et al., 2009) or BD (Evans et al., 2004). Hence, taken together, these microarray-based expression studies suggest that there are cortical-region-specific changes in gene expression in MD and BD and that there are differences and commonalities in the underlying biochemical pathways driving the aetiologies of those disorders.
Recently, results from the merging of expression array data from nine independent studies for re-analyses have been reported (Gandal et al., 2018a). The headline outcome from this reanalysis of data was that there is a shared molecular neuropathology across major psychiatric disorders. For example, it was suggested that there were changes in gene expression in the cortex from subjects with autism spectrum disorder, schizophrenia and BD involving glial cell differentiation and fatty acid metabolism. Notably, the reanalysis did suggest that in MD the changes in gene expression were enriched for genes involved with G-protein-coupled receptors, cytokine–cytokine interactions and hormone activity. The conclusion drawn from these finding was that the pathophysiology of MD, as has been suggested previously (Dean, 2011), involves inflammatory pathways and the hypothalamic-pituitary axis.
More recently, RNA sequencing (RNAseq) has been used to identify changes in gene expression in the CNS from subjects with mood disorders. An early study examined gene expression in the dorsolateral prefrontal cortex from subjects with BD and particularly focussed on the lower level of expression of two genes, prominin 1 (PROM1) and ATP binding cassette subfamily G Member 2 (ABCG2), because these genes are strongly expressed in neural stem cells and other highly plastic tissues (Akula et al., 2014). These data lead the authors to the posit that the pathophysiology of BD included reduced neuroplasticity. In addition, the finding of lower levels of mRNA encoding the gene Fli-1 proto-oncogene, ETS transcription factor (FL1), which is involved in neuronal crest development, suggests that BD may have a neurodevelopment component. One study found changes in levels of gene expression that would impact on the activity of lysosomes, Fc gamma receptor–mediated phagocytosis and regulation of the actin cytoskeleton pathways in the anterior cingulate cortex (Brodmann’s area (BA) 24) from subjects with BD (Zhao et al., 2015). The authors stressed the importance of changes in lysosomal function as these could impact on endocytosis, exocytosis, neuronal maturation and migration, neurite outgrowth, phagocytosis, synaptic density and plasticity as well as vesicle trafficking. Another study found that changes in gene expression in the anterior cingulate from subjects with BD would have a much more focussed impact because of changes in expression of G protein–coupled receptors and their regulatory pathways (Cruceanu et al., 2015). In a study using tissue from subjects with MD, BD and Sz, it was suggested that there was evidence for lower expression of neuron-specific genes and higher expression of astrocytic genes in the anterior cingulate cortex from subjects with BD and schizophrenia (Ramaker et al., 2017). This study was somewhat unusual as it found no significant changes in gene expression in the dorsolateral prefrontal cortex from subjects with BD and schizophrenia and found no significant changes in gene expression in any CNS region from subjects with MD. By contrast, another study using RNAseq reported large numbers of changes in gene expression in six CNS regions from subjects with MD (Labonte et al., 2017). Significantly, this study found that overall, changes in gene expression in MD would impact on extracellular signal-regulated kinase (ERK) signalling. In addition, the study found that many changes in gene expression were gender specific, with more changes in gene expression occurring in females compared to males with only relatively small (45–163 genes) gender-independent changes in gene expression in the CNS regions studied. It was argued that the gender-specific nature of gene expression in MD could be due to differential changes in dual specificity phosphatase 6 (DUSP6) in the ventromedial cortex (BA 25) from female subjects with MD as that gene acts as a key hub gene affecting what the authors identify as a female specific gene expression module. By contrast, the authors emphasise the potential important of a higher level of expression of empty spiracles homeobox 1 (EMX1) in males with MD as this is a gene of importance in the development of the male cortex.
A recent transcriptome-wide isoform-level study has reported RNAseq data for two cortical regions in subjects with BD, schizophrenia and autism spectrum disorder (Gandal et al., 2018b). This study has generated a rich dataset with the authors suggesting that it has a scope and complexity that does not lend itself to ‘simple mechanistic reduction’. However, their early analyses of the data confirmed previous findings suggesting that changes in cortical gene expression should downregulate neuronal function and synaptic signalling as well as upregulating neuroinflammatory pathways. Changes in levels of expression of genes involved in microglial function were also reported as enriched in BD as well as schizophrenia. Notably, the authors concluded that while the study was a unique large-scale study, other studies profiling gene expression in additional cases across a number of CNS regions would still be informative on the pathophysiology of psychiatric disorders.
To add data to the number of CNS studies in mood disorders, we decided to measure levels of cortical gene expression in tissue from subjects with MD and BD. We have recently reported extensive changes in gene expression across three cortical regions (the rostral prefrontal cortex (BA 10), dorsolateral prefrontal cortex (BA 9) and the anterior cingulate (BA 33)) from individuals with schizophrenia (Scarr et al., 2018a). Given it has been suggested that there are similarities in changes in gene expression in the cortex of subjects with schizophrenia compared to those with mood disorders, we decided to complete our studies on mood disorders in the same three cortical regions. We hypothesised that such a study would have added value in that all of these three cortical regions have been shown to be dysfunctional in subjects with MD and BD (Drevets et al., 2008).
Methods
Human tissue collection and processing
Human CNS tissue was collected postmortem at the Victorian Institute of Forensic Medicine after gaining approval from the Ethics Committee at that institute. For each case, written approval to collect tissue was obtained from the next-of-kin. Case history reviews were completed using the Diagnostic Instrument for Brain Studies (DIBS) leading to a diagnosis, made by consensus between two clinicians, according to Diagnostic and Statistical Manual of Mental Disorders (4th ed.; DSM-IV) criteria (Scarr et al., 2018b). Using data from the DIBS, postmortem interval (PMI) was calculated as the time from death to autopsy. Where death was not witnessed, tissue was only collected when the donor had been seen alive 5 hours prior to being found dead and PMI was taken as the time from being found to autopsy plus half the time between the donor been last seen and found dead.
Duration of illness (DI) was calculated as the time from first acknowledgment of a presentation with a mental illness by a treating clinician until death.
On removal, CNS tissue was rapidly processed using a standardised procedure (Scarr et al., 2018b), and tissue pH was measured as described previously as this is the best indicator of good tissue preservation.
Following our study design, tissue from BA 9, 10 and 33 was collected using the parameters described in our study in schizophrenia (Scarr et al., 2018a) but from CNS from individuals with MD, BD and age- and sex-matched controls.
Cortical gene expression
Total RNA was prepared from ∼100 mg of frozen grey matter from each of the three cortical regions to be studied and RNA prepared as described previously (Scarr et al., 2018a; Supplementary Methods).
After another on-site check of RNA quality, signal intensity at each probe was measured for all cases in each cortical region using the Affymetrix™ Human Exon 1.0 ST Arrays (Affymetrix, Santa Clara, CA, USA) at the Ramaciotti Centre for Genomics using the manufacturers’ recommended procedures; the resulting data were processed as described previously (Scarr et al., 2018a; Supplementary Methods).
Results
Demographics and sample collection data
For this study, tissue was collected from three cortical regions from subjects with MD (n = 15), BD (n = 15) and controls (n = 15). There were no significant differences in age, gender ratio, PMI or brain weight between the diagnostic groups (Table 1). There was a significant variation of CNS pH with diagnoses due to higher CNS pH (+4%) in MD and lower CNS pH in BD (−0.6%) compared to controls. The ratio of suicide completion to other forms of death was higher in MD and BD compared to controls. In addition, the ratio of suicide completion to other forms of death were higher in MD compared to BD. RNA integrity numbers (RINs) did not vary with diagnoses in any of the three CNS regions studied.
Demographic, CNS collection and suicide status data for subjects with no history of psychiatric history disorders (Controls) and subjects with major depression (MD) or bipolar disorders (BD) from whom tissue was used in this study.
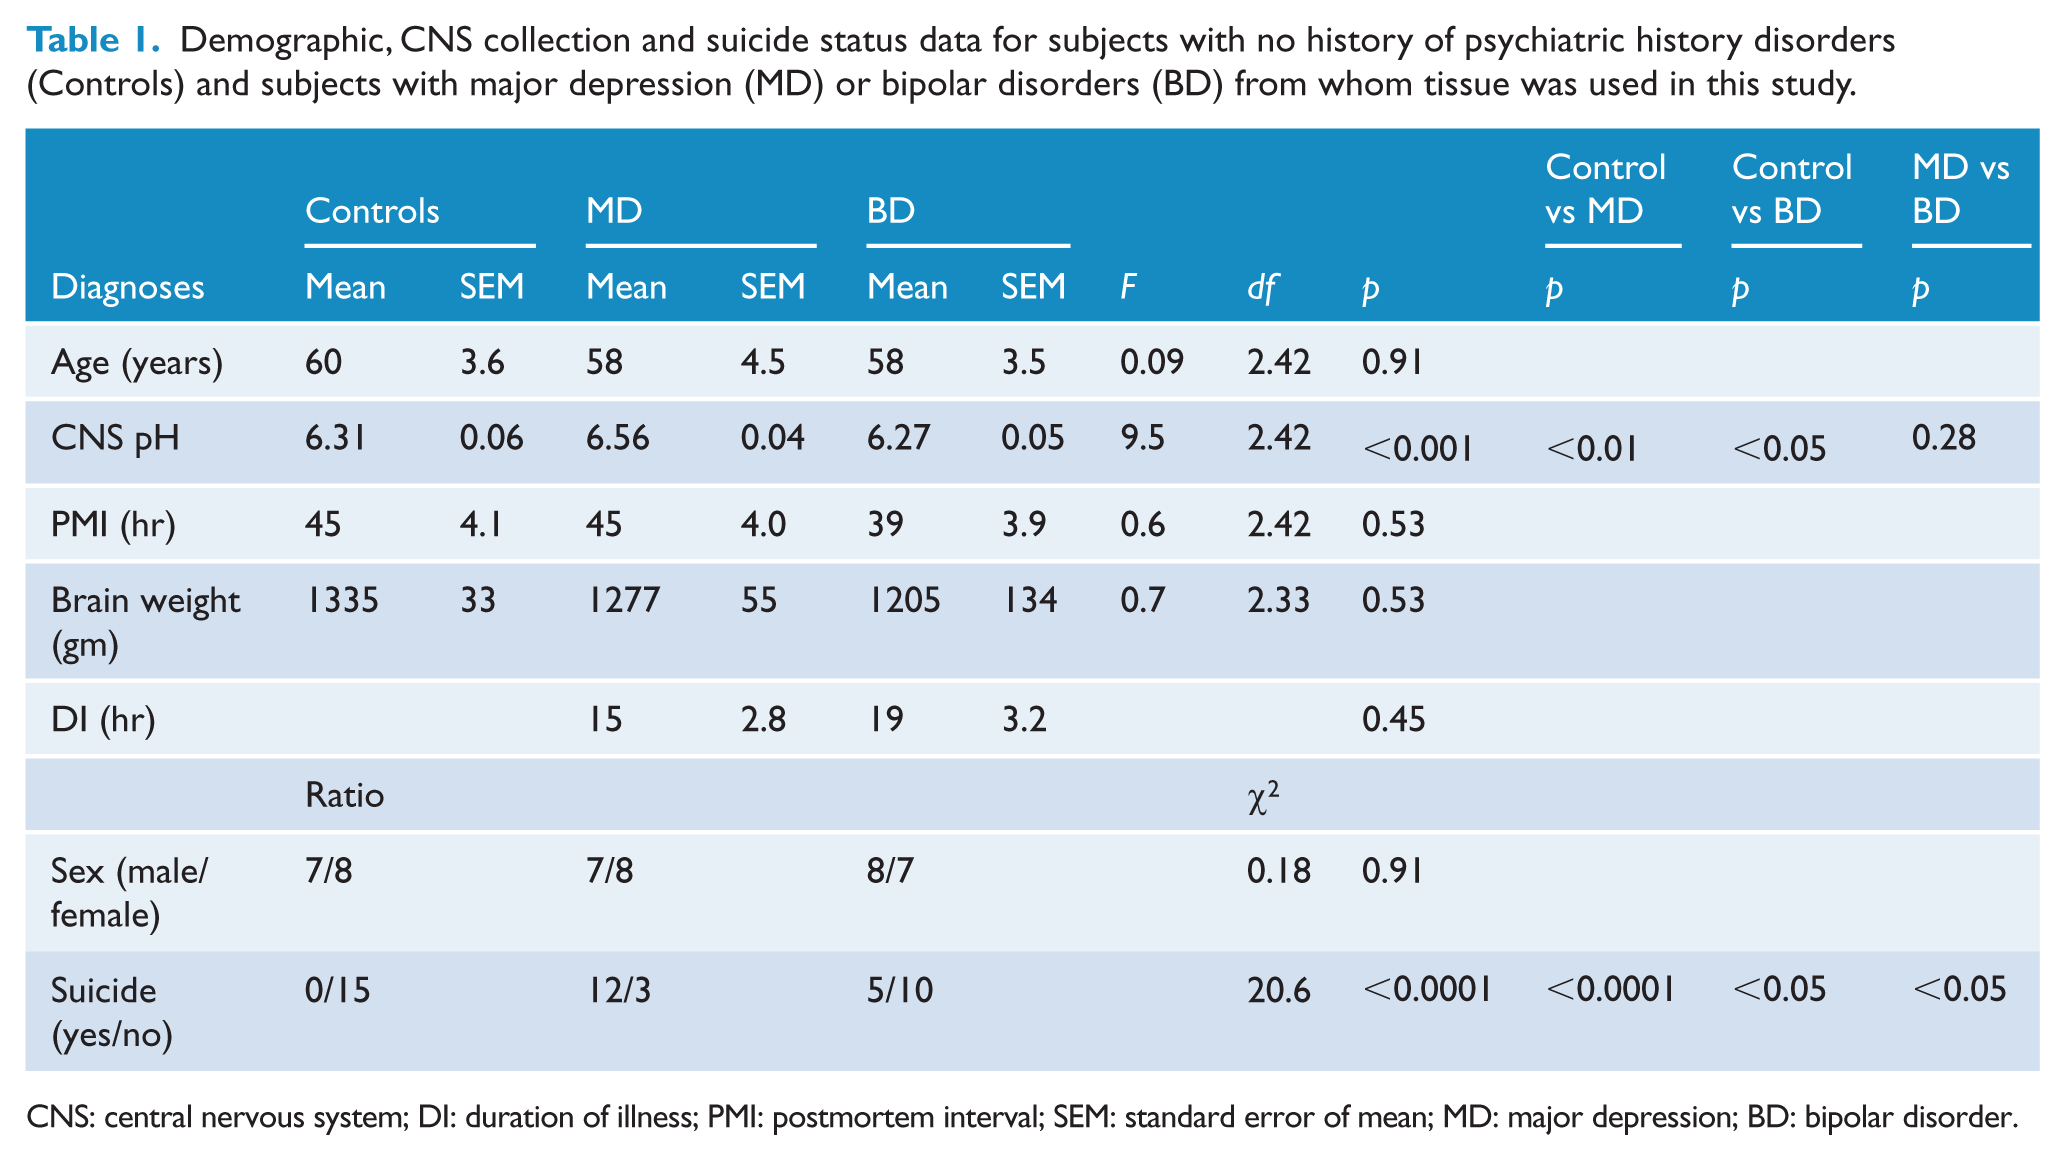
CNS: central nervous system; DI: duration of illness; PMI: postmortem interval; SEM: standard error of mean; MD: major depression; BD: bipolar disorder.
Gene expression in MD
Compared to controls, the level of RNA for 424 genes (Figure 1(A), Supplementary Table 1) differed significantly (43 higher; Figure 1(B)) in BA 9 from individuals with MD compared to changed levels of RNA for 52 genes in BA 10 (41 higher; Figure 1(C)) and 59 genes in BA 33 (7 higher; Figure 1(D)). Levels of RNA for three genes were different between MD and controls in BA 9 and 10 from individuals with MD (higher: ankyrin repeat domain 18D, pseudogene [ANKRD18DP], syndecan 4 (SDC4); lower: purinergic receptor P2Y12 (P2RY12)). Levels of RNA for five genes differed in BA 9 and 33 (lower: family with sequence similarity 182 member A [FAM182A], galactose-3-O-sulfotransferase 4 [GAL3ST4], olfactory receptor family 1 subfamily F member 1 [OR1F1], prostate and testis expressed 2 [PATE2], solute carrier family 5 member 10 [SLC5A10]) and levels of RNA for one gene was different in BA 10 and 33 (higher: haemoglobin subunit beta [HBB]) between MD and controls. Levels of no RNA differed significantly in all the cortical regions studied.
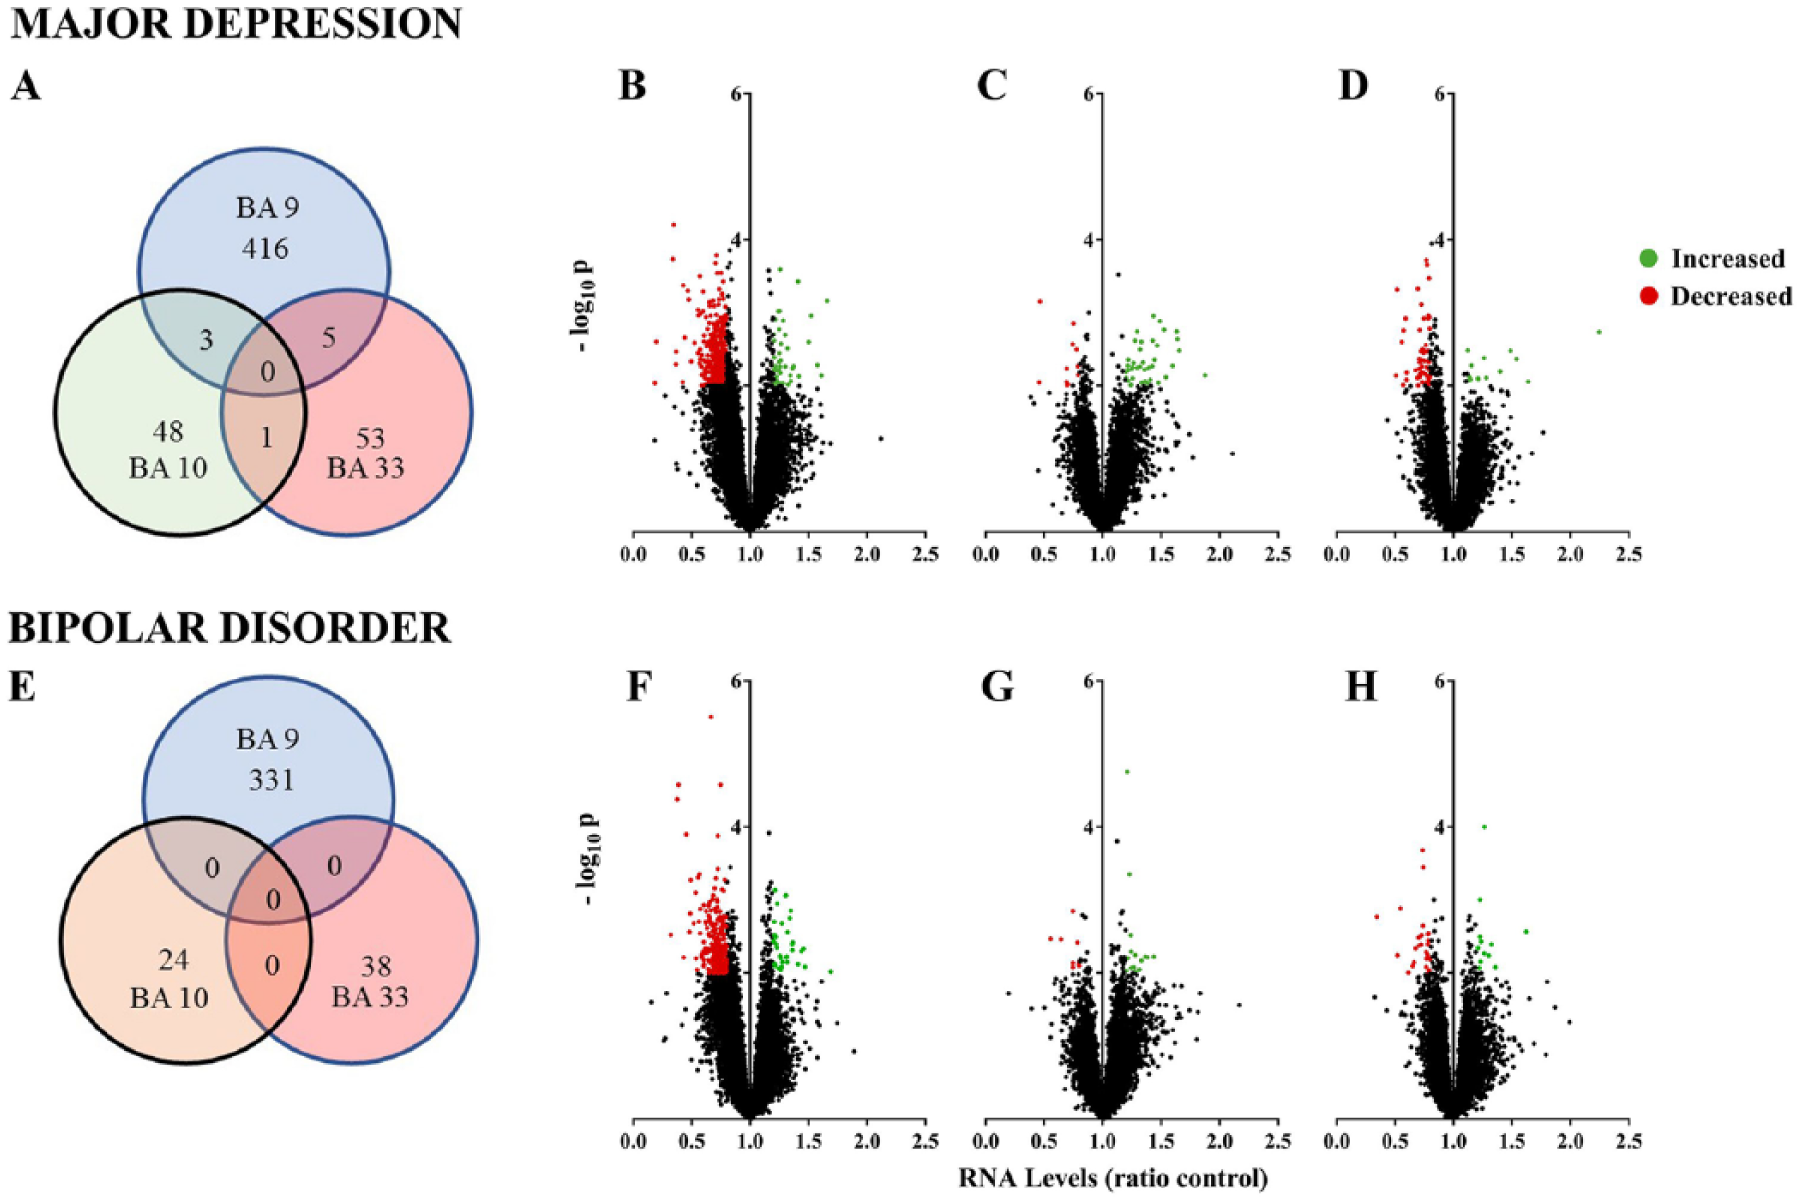
Cortical gene expression in mood disorders: (A) Venn diagram showing the number of genes differentially expressed in Brodmann’s areas (BA) 9, 10 and 33 from individuals with major depression (MD). (B–D) Volcano plots of changes in gene expression in (B) BA 9, (C) BA 10 and (D) BA 3 from individuals with MD. (E) Venn diagram showing the number of genes differentially expressed in BA 9, 10 and 33 from individuals with bipolar disorders (BD). (F–H) Volcano plots of changes in gene expression in (F) BA 9, (G) BA 10 and (H) BA 3 from individuals with BD.
Ingenuity Pathway Analysis (IPA) core analysis showed an over-representation of genes with altered levels of expression in BA 9 from individuals with MD in canonical pathways involved in oestrogen biosynthesis, ceramide biosynthesis, antioxidant actions of vitamin C and bupropion degradation, glutamate receptor signalling in BA 10 and glutathione redox reactions and communications between immune cells in BA 33 (Supplementary Table 2). Notably, in all three cortical regions from individuals with MD, changes in levels of RNA would be expected to be associated with organismal injury and abnormalities. Only in BA 9 were changes in levels of RNA in MD associated with inflammatory disease, whereas in BA 10 they were associated with neurological and psychological disorders (Supplementary Table 2).
While there were no changes in the expression of the same gene across three cortical regions from individuals with MD, the differential changes in levels of RNA in each cortical region would impact on cell morphology (Supplementary Table 2). In addition, changes in gene expression would impact on molecular transport (BA 9 and BA 10) and cell signalling (BA 9 and BA 33) in two cortical regions. However, some changes in gene expression would have within cortical region effect on cellular development and cellular growth and proliferation in BA 9; cellular function and maintenance, cellular compromise and nucleic acid metabolism in BA 10 and carbohydrate metabolism, cell death and survival and cell-to-cell signalling and interaction in BA 33.
Notably, IPA Pathway Designer analysis showed no substantial interactions between genes with altered levels of expression within any of the three cortical regions in MD.
There were lower levels of RNA from 4 MD risk genes (cleavage polyadenylation factor subunit CLP1 [CLP1], MHC class I polypeptide-related sequence B [MICB], psoriasis susceptibility 1 candidate 2 [PSORS1C2] and transmembrane protein 42 [TMEM42]) identified in a large gene-wide association study (GWAS) in MD (Wray et al., 2018) in BA 9, but not 10 or 33. Further analyses of gene interactions in BA 9 using IPA Pathway Designer showed that allowing one connecting gene (epidermal growth factor receptor [EGFR]) allowed MICB to be incorporated into an interactome of 54 genes with altered levels of expression in BA 9 from individuals with MD (Figure 2; Supplementary Table 3). Creating an EGFR-containing interactome could be justified as it clearly past the fold criteria for significance (ratio = 1.24) but fell marginally short of the probability criteria (p = 0.03).
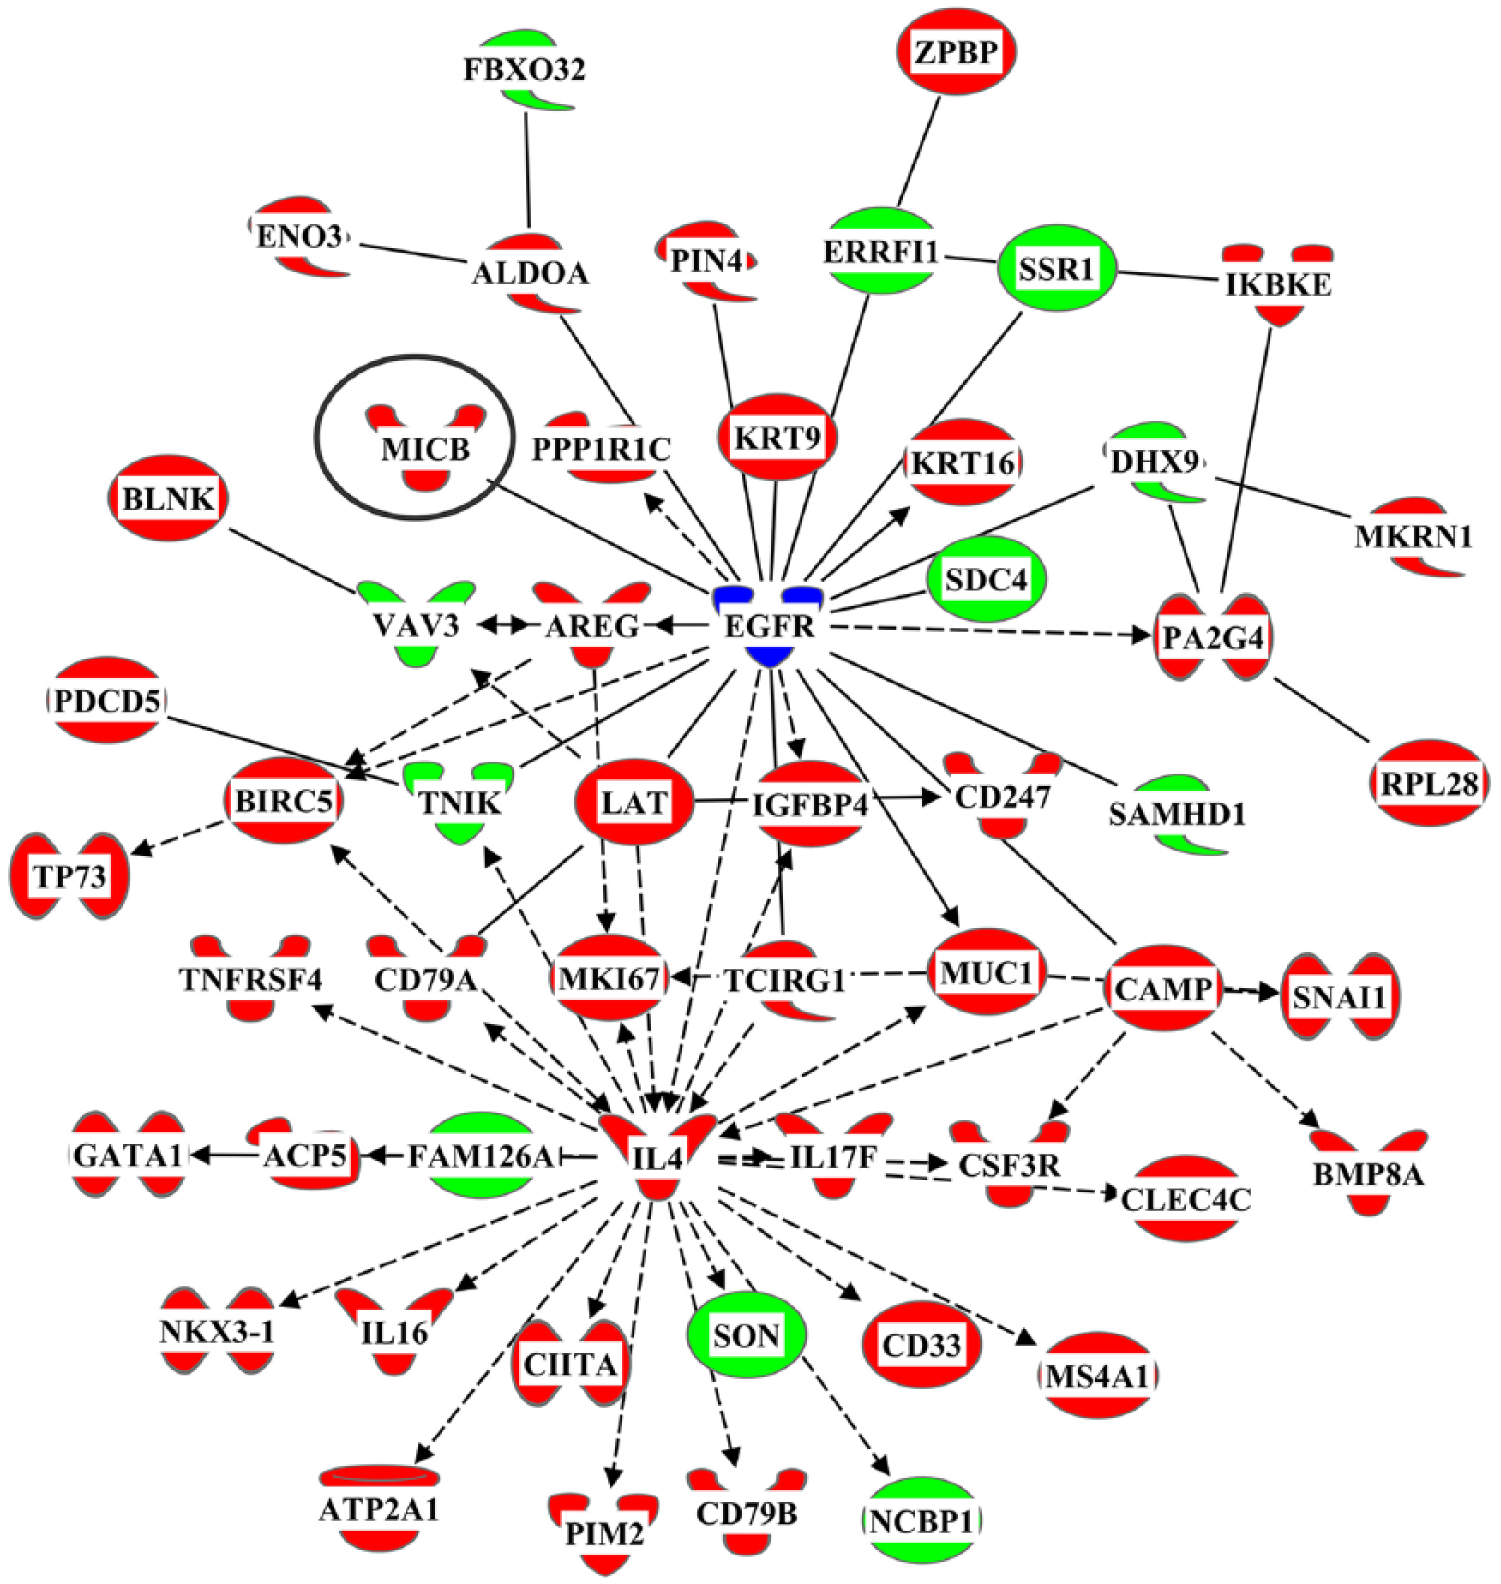
An interactome of genes that were differentially expressed in Brodmann’s area 9 from individuals with major depression that includes the risk gene MHC class 1 polypeptide-related sequence B (MICB) and the connecting gene epidermal growth factor receptor (EGFR).
The 54 genes present in the interactome of genes containing the risk gene MICB were subjected to a core analysis, which showed that the genes in the interactome would have a marked impact on inflammatory-related pathways and that cytokines interleukin 4, interleukin 6 and colony stimulating factor 2 were key drivers in the pathway (Supplementary Table 4). At the molecular and cellular levels, these genes would strongly impact on cell death and survival, cellular development, cellular growth and proliferation, cell morphology and cellular movement.
Gene expression in BD
In BD, levels of RNA for 331 genes (Figure 1(E), Supplementary Table 5: 35 higher; Figure 1(F)) differed significantly in BA 9 compared to 24 (16 higher; Figure 1(G)) genes in BA 10 and 38 (12 higher; Figure 1(H)) genes in BA 33; levels of RNA for no gene differed in more than one cortical region. By contrast to MD, there were no genes with changed levels of expression in the cortex of subjects with BD listed as being associated with an altered risk for the disorder in a large GWAS study (Stahl et al., 2019).
Notably, many of the canonical pathways with an over-representation of genes with a changed level of expression in BA 9 from individuals with BD were related to inflammation and immunity (Supplementary Table 6). In BA 10, neuroinflammation and circadian rhythm were canonical pathways that could be affected by gene changes in BD. In addition, changes in gene expression in BA 33 would affect ceramide biosynthesis and the effects of oestrogen. In BD, changes in levels of RNA in BA 9 and BA 10 would be expected where there was organismal injury. In addition, changes in gene expression in BA 9 from individuals with BD would be expected in inflammatory disease, whereas in BA 10 they would be expected in those with neurological or psychological disorders (Supplementary Table 6).
Despite the absence of changes in expression of any gene across the three cortical regions studied, changes in gene expression in BD would be expected to affect cell death and survival (BA 9 and 10) and cell morphology (BA 10 and 33) in two cortical regions (Supplementary Table 6). Other outcomes from changes in gene expression would be restricted to a single cortical region and would include cell signalling, molecular transport, vitamin and mineral metabolism as well as nucleic acid metabolism in BA 9; cellular function and maintenance, carbohydrate metabolism and cell cycle in BA 10 and protein synthesis, cell-to-cell signalling and interaction, cellular movement and cellular assembly and organisation in BA 33.
Finally, it is of interest that some of the genes with changed levels of expression in BA 9 and BA 10 from individuals with BD are involved in cholinergic activity as well as dopaminergic activity in BA 9 (Supplementary Table 6).
Gene expression in MD and BD
Levels of RNA for 112 genes (9 higher) differed in BA 9 from both MD and BD (Supplementary Table 7), and there was a high level of correlation between fold change in levels of expression of these genes between diagnoses (r2 = 0.91, p < 0.001; Figure 3). By contrast, the level of RNA for only one gene, BICD cargo adaptor 1 (BICD1), was lower in BA 10 and another gene ITPRIP like 1 (ITPRIPL1) was lower in BA 33 from individuals with MD and BD. IPA Core Analyses suggested that the genes with altered levels of expression in BA 9 from individuals with MD and BD had an over-representation in canonical pathways involved in bupropion degradation and oestrogen biosynthesis. Finally, at the level of diseases and disorders, it was notable that the changes in gene expression in BA 9 that were common to MD and BD would be expected in an inflammatory response and in neurological disease (Supplementary Table 8).
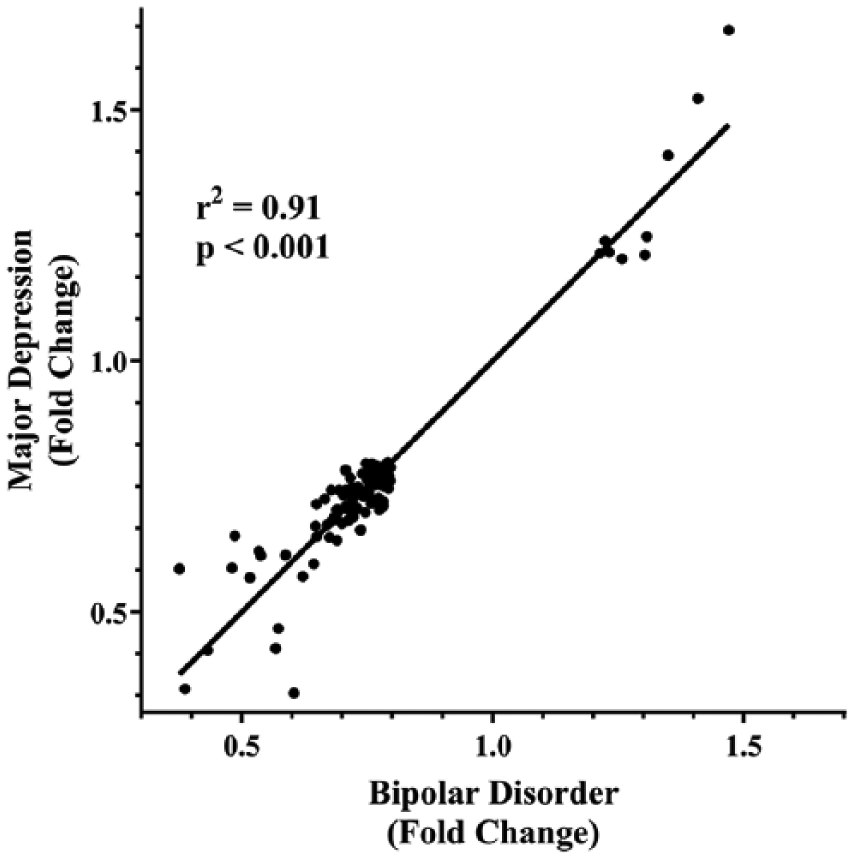
The correlation between changes in gene expression of 112 genes in Brodmann’s area 9 from individuals with major depression and bipolar disorders.
At the molecular level, the genes with changed level of expression in BD and MD would affect cell-to-cell signalling, lipid metabolism, small molecule biochemistry, cell morphology and cellular assembly and organisation (Supplementary Table 8).
Discussion
This study has resulted in three major findings. First, changes in cortical gene expression in mood disorders differ between cortical regions, with by far the largest number of changes being in BA 9. This differs from our finding in the same three cortical regions from individuals with schizophrenia where by far and away the greatest number of changes in gene expression was in BA 10 (Scarr et al., 2018a). Second, the levels of expression of four risk genes (CLP1, MICB, PSORS1C2 and TMEM42) for MD (Wray et al., 2018) are lower in BA 9, but not in BA 10 or 33, from individuals with that disorder. Third, there were highly correlated changes in levels of expression of 112 genes in BA 9, but not BA 10 or 33, from individuals with MD and BD.
Showing regionally specific changes in cortical gene expression agrees with previous studies in MD (Choudary et al., 2005; Evans and Heather, 2016; Klempan et al., 2009; Labonte et al., 2017; Ramaker et al., 2017; Sequeira et al., 2007; Sequeira et al., 2009) and BD (Evans et al., 2004; Ramaker et al., 2017). Given these data, it can be concluded that unique changes in gene expression within many cortical regions are probably contributing to the region-specific changes in cortical dysfunction known to occur in MD and BD (Drevets et al., 2008). Of interest in our study were differences in the prevalence in gene expression between BA 9 and 10, which are adjacent cortical regions, in both MD and BD. These data differ markedly from our data in schizophrenia where we showed by far and away the most prevalent changes in gene expression in BA 10. Such regional differences are important because BA 10 is now recognised to control diverse functions that include risk and decision making, odour evaluation, reward and conflict, pain and working memory (Fuster, 2015). Our data now suggest that such functions could be more affected by changes in gene expression in schizophrenia compared to individuals with MD or BD. By contrast, BA 9 is important in memory, evaluating recency, overriding automatic responses, verbal fluency, error detection, auditory verbal attention, inferring the intention of others, inferring deduction from spatial imagery, inductive reasoning, attributing intention and sustained attention (Fuster, 2015). Therefore abnormalities in these cortical functions may be more affected by changes in gene expression in MD and BD. In addition, the high prevalence of regionally specific changes in gene expression in different psychiatric disorders means the outcomes from pooling gene expression data from multiple cortical regions for reanalysis (Gandal et al., 2018a) should be treated with some caution.
In our study, at the level of canonical pathways, changes in gene expression are predicted to affect the biosynthesis of oestrogen and ceramide, the antioxidant actions of vitamin C and the degradation of bupropion. These findings suggest that gene expression changes in BA 9 may be important in linking the impact of oestrogen on cognitive and emotional dysfunction in MD (Albert and Newhouse, 2019). Ceramide is an important component of sphingolipids pathways, and therefore, gene expression changes affecting ceramide biosynthesis could be contributing to the changes in lipid biosynthesis in MD (Walther et al., 2018). In addition, changes in gene expression affecting the actions of vitamin C and the degradation of bupropion could be important in regulating how individuals with MD respond to treatment with those two compounds. By contrast, in BA 10, changes in gene expression would be expected to affect glutamate receptor signalling which is thought to be important in the aetiology of the disorder (Niciu et al., 2014). In BA 33, the impact of gene expression on glutathione redox reactions suggests that oxidative stress could be a component of the aetiology of MD and why treatment with antioxidants can lessen symptom severity (Berk et al., 2014). Given existing data implicating inflammatory pathways in MD (Dean, 2011), it was surprising that inflammation-related pathways were not suggested to be affected by changes in gene expression in any of the three cortical regions studied. In a Core Analyses, there needs to be a change in the level of expression of more genes in a pathway than expected by chance. Thus, in our overall data from BA 9 from subjects with MD, there were changes in expression of inflammatory-related genes such as interleukins 4, 16 and 17F, and TNRSF 4, 13C and 14 (Supplementary Table 1) but these must have not been numerous enough to be judged as over representative of inflammatory processes. However, in the more focussed analyses of changes in gene expression in BA 9 from subjects with MD associated with the changed expression of a risk gene, changes in inflammatory-related pathways cannot be excluded from contributing to the pathophysiology of the disorder.
In BD, changes in gene expression in BA 9 and BA 10 would affect inflammation-related pathways that have been strongly implicated in the aetiology of that disorder (Stertz et al., 2013). Interestingly, changes in gene expression in BA 10 are predicted to affect circadian rhythm, which is known to be affected in individuals with BD (Allison and Harvey, 2008). Finally, changes in gene expression in BA 33 in BD, rather than BA 9 as in MD, would affect ceramide biosynthesis and the effects of oestrogen with both these being implicated in the aetiology of BD (Meinhard et al., 2014; Schwarz et al., 2008). Thus, at least at the level of canonical pathways, our data are giving a new insight into how cortical-region specific changes in gene expression could impact on the genesis of specific symptoms and drug responsiveness in individuals with mood disorders.
It is particularly significant that our data show lower levels of expression for four risk genes for MD in BA 9 from individuals with the disorder. One of the risk genes with lower level of expression in MD is CLP1, which encodes a multifunctional kinase which is a component of the transfer RNA (tRNA) splicing endonuclease complex and a component of the pre-mRNA cleavage complex II and is therefore implicated in tRNA, messenger RNA (mRNA) and small interfering RNA (siRNA) maturation (Hanada et al., 2013). MICB is a MD risk gene which activates cells which express the NKG2D type II receptor. We have now shown this gene is part of an interactome of genes with altered levels of expression in BA 9 from individuals with MD and that this interactome of changed gene expression will impact on cortical inflammatory pathways that have been suggested to be important in the aetiology of MD (Dean, 2011). Although little seems to be known about the function of PSORS1C2, it was reported as increased in mice after Rb family inactivation which forces neurons to undergo S-phase leading to cell death (Oshikawa et al., 2013), and hence, PSORA1C2 could be important in the development of the human CNS. Finally, TMEM42 is a transmembrane protein of no known function that is ubiquitously expressed but is more highly expressed in the cortex during foetal development (Guedj et al., 2015). Thus, our data showing decreased expression of four risk genes for MD in the BA 9 from individuals with the disorder is of interest as all of these genes appear to have potential to affect the development of the cortex. Our cohort size was too small to determine whether the decrease in expression of the four risk genes for MD was associated with the risk variant of those genes, but given the low frequency of the risk variants, our data could argue that there is changed cortical expression of risk genes for MD and that these changes could be further modified by the inheritance of a risk variant.
We also show a strong correlation between levels of expression of genes between individuals with MD and BD. This raises the possibility that the same genes contribute to a cortical pathology or some intrinsic functional connectivity patterns that have been reported in both disorders. At the level of canonical pathways, the genes with correlated levels of expression across mood disorders would have effects on immunity and inflammation which have been associated with the aetiologies of such disorders (Dean, 2011). Whatever the outcome, our data are the first to suggest that a significant number of the same genes could be contributing to the aetiologies of both MD and BD, but this commonality of gene action may be limited to specific cortical regions such as BA 9.
Focussing on changes in gene expression in the cortex of individuals with MD at the level of molecular and cellular functions, our data show some agreement with other studies predicting changes in cell signalling (Kang et al., 2007; Sequeira et al., 2009), molecular transport (Klempan et al., 2009; Sequeira et al., 2009; Zhurov et al., 2012), cell-to-cell signalling (Aston et al., 2005; Kang et al., 2007; Sequeira et al., 2009; Zhurov et al., 2012), cellular development (Aston et al., 2005; Kang et al., 2007; Klempan et al., 2009) and carbohydrate metabolism (Klempan et al., 2009). In BD, our data agree with other studies that suggest pathways involved in cell death (Shao and Vawter, 2008), cellular growth and proliferation (Shao and Vawter, 2008) would be affected by changed levels of gene expression.
There are some limitations to this study. As with any study using tissue from individuals with MD and BD who have been treated, there is a possibility that the changes in gene expression reported are associated with drug treatment before death. However, studies examining gene CNS expression changes in human cells and rodents after treatment with antidepressant drugs (Lin and Tsai, 2016) or mood stabilisers (Squassina et al., 2010) have not shown that such drug treatments alter levels of expression of the genes we have shown to be differentially expressed in the cortex from MD or BD suggesting our data are not simply due to drug affects. Cohort sizes in this study are equivalent to others examining cortical gene expression in mood disorders but are relatively small. There was a 3.35% study-wide difference in CNS pH with diagnoses, which is unlikely to be a significant confound. Suicide rates varied across diagnostic cohorts, which is a confound that could not be resolved because of our cohort sizes. Hence, our findings should be considered as preliminary, but suggesting that understanding the impact of changes in cortical gene expression in mood disorders will advance understanding of their aetiologies.
Despite the limitations of our study, like others, we show that differential changes in gene expression are present in different cortical regions from individuals with MD (Choudary et al., 2005; Evans et al., 2004; Klempan et al., 2009; Sequeira et al., 2007; Sequeira et al., 2009) and BD (Choudary et al., 2005; Evans et al., 2004). We also report that the highest number of genes with altered levels of expression in both MD and BD is in BA 9 and that there are highly correlated changes in the expression of 112 genes in BA 9 from individuals with both disorders. In addition, for the first time, we have linked a risk gene for MD to an interactome of genes with altered levels of expression in BA 9 from individuals with MD. This interactome suggests that this gene, MICB, can have profound effects on inflammation-related pathways in the dorsolateral prefrontal cortex. This finding is also significant because a large-scale transcriptomic study using postmortem CNS from subjects with psychiatric disorders argued that the data from that study did not lend itself to mechanistic reduction (Gandal et al., 2018b). By contrast, our study has provided a pathway of immediate interest that can be the starting point for establishing some of the biological underpinnings of MD, confirming the proposition that ongoing studies of gene expression in the CNS from subjects with psychiatric disorders are of value (Gandal et al., 2018b). In this pathway in particular, what remains to be established is whether the impact of inheritance of a risk genotype of MICB acts to accentuate the impact of an already changed level of gene expression.
Supplemental Material
Supplementary_Methods_1 – Supplemental material for Changed cortical risk gene expression in major depression and shared changes in cortical gene expression between major depression and bipolar disorders
Supplemental material, Supplementary_Methods_1 for Changed cortical risk gene expression in major depression and shared changes in cortical gene expression between major depression and bipolar disorders by Elizabeth Scarr, Madhara Udawela and Brian Dean in Australian & New Zealand Journal of Psychiatry
Supplemental Material
Supplementary_Table_1 – Supplemental material for Changed cortical risk gene expression in major depression and shared changes in cortical gene expression between major depression and bipolar disorders
Supplemental material, Supplementary_Table_1 for Changed cortical risk gene expression in major depression and shared changes in cortical gene expression between major depression and bipolar disorders by Elizabeth Scarr, Madhara Udawela and Brian Dean in Australian & New Zealand Journal of Psychiatry
Supplemental Material
Supplementary_Table_2 – Supplemental material for Changed cortical risk gene expression in major depression and shared changes in cortical gene expression between major depression and bipolar disorders
Supplemental material, Supplementary_Table_2 for Changed cortical risk gene expression in major depression and shared changes in cortical gene expression between major depression and bipolar disorders by Elizabeth Scarr, Madhara Udawela and Brian Dean in Australian & New Zealand Journal of Psychiatry
Supplemental Material
Supplementary_Table_3 – Supplemental material for Changed cortical risk gene expression in major depression and shared changes in cortical gene expression between major depression and bipolar disorders
Supplemental material, Supplementary_Table_3 for Changed cortical risk gene expression in major depression and shared changes in cortical gene expression between major depression and bipolar disorders by Elizabeth Scarr, Madhara Udawela and Brian Dean in Australian & New Zealand Journal of Psychiatry
Supplemental Material
Supplementary_Table_4 – Supplemental material for Changed cortical risk gene expression in major depression and shared changes in cortical gene expression between major depression and bipolar disorders
Supplemental material, Supplementary_Table_4 for Changed cortical risk gene expression in major depression and shared changes in cortical gene expression between major depression and bipolar disorders by Elizabeth Scarr, Madhara Udawela and Brian Dean in Australian & New Zealand Journal of Psychiatry
Supplemental Material
Supplementary_Table_5 – Supplemental material for Changed cortical risk gene expression in major depression and shared changes in cortical gene expression between major depression and bipolar disorders
Supplemental material, Supplementary_Table_5 for Changed cortical risk gene expression in major depression and shared changes in cortical gene expression between major depression and bipolar disorders by Elizabeth Scarr, Madhara Udawela and Brian Dean in Australian & New Zealand Journal of Psychiatry
Supplemental Material
Supplementary_Table_6 – Supplemental material for Changed cortical risk gene expression in major depression and shared changes in cortical gene expression between major depression and bipolar disorders
Supplemental material, Supplementary_Table_6 for Changed cortical risk gene expression in major depression and shared changes in cortical gene expression between major depression and bipolar disorders by Elizabeth Scarr, Madhara Udawela and Brian Dean in Australian & New Zealand Journal of Psychiatry
Supplemental Material
Supplementary_Table_7 – Supplemental material for Changed cortical risk gene expression in major depression and shared changes in cortical gene expression between major depression and bipolar disorders
Supplemental material, Supplementary_Table_7 for Changed cortical risk gene expression in major depression and shared changes in cortical gene expression between major depression and bipolar disorders by Elizabeth Scarr, Madhara Udawela and Brian Dean in Australian & New Zealand Journal of Psychiatry
Supplemental Material
Supplementary_Table_8 – Supplemental material for Changed cortical risk gene expression in major depression and shared changes in cortical gene expression between major depression and bipolar disorders
Supplemental material, Supplementary_Table_8 for Changed cortical risk gene expression in major depression and shared changes in cortical gene expression between major depression and bipolar disorders by Elizabeth Scarr, Madhara Udawela and Brian Dean in Australian & New Zealand Journal of Psychiatry
Footnotes
Acknowledgements
The authors gratefully acknowledge Geoff Pavey for his technical assistance and curation of the human brain tissue. Tissue was sourced from the Victorian Brain Bank, supported by the Mental Health Research Institute, The Alfred, Victorian Forensic Institute of Medicine, The University of Melbourne, Australia’s National Health & Medical Research Council, the Helen Macpherson Smith Trust, Parkinson’s Victoria and Perpetual Philanthropic Services.
Declaration of Conflicting Interests
The author(s) declared no potential conflicts of interest with respect to the research, authorship and/or publication of this article.
Funding
The author(s) disclosed receipt of the following financial support for the research, authorship and/or publication of this article: This research was funded by the National Health and Medical Research Council (Australia; project grant 566967, Fellowship APP1002240), the Australian Research Council (Fellowship [ES] FT100100689) and the Victorian Government’s Operational Infrastructure Support Programme.
Supplemental Material
Supplemental material for this article is available online.
References
Supplementary Material
Please find the following supplemental material available below.
For Open Access articles published under a Creative Commons License, all supplemental material carries the same license as the article it is associated with.
For non-Open Access articles published, all supplemental material carries a non-exclusive license, and permission requests for re-use of supplemental material or any part of supplemental material shall be sent directly to the copyright owner as specified in the copyright notice associated with the article.