
Abstract
Objective:
As two common neurodevelopmental disorders, autistic spectrum disorder and attention deficit hyperactivity disorder frequently occur together. Until now, only a few studies have investigated the co-occurrence of attention deficit hyperactivity disorder and autistic spectrum disorder, this is due to restrictions associated with previous Diagnostic and Statistical Manual of Mental Disorders, Fourth Edition, Text Revision. Most previous research has focused on the developmental trajectories for autistic spectrum disorder and attention deficit hyperactivity disorder separately, while the neural mechanisms underpinning the co-occurrence of autistic spectrum disorder and attention deficit hyperactivity disorder remain largely unknown.
Methods:
We studied 162 autistic spectrum disorder individuals (including 79 co-attention deficit hyperactivity disorder and 83 non-attention deficit hyperactivity disorder patients) and 177 typical developing individuals using resting-state functional magnetic resonance imaging data from the Autism Brain Imaging Data Exchange II, an aggregated magnetic resonance imaging dataset from 19 centers. Independent component analysis was used to extract sub-networks from the classic resting-state networks. Functional connectivity values within (intra-iFC) and between (inter-iFC) these networks were then determined. Subsequently, we compared the ASD_coADHD group with the ASD_nonADHD group in relation to the abnormal intra-iFC and inter-iFC of autistic spectrum disorder group relative to the typical developing group.
Results:
The ASD_coADHD group showed more severe social impairment and decreased intra-iFC in the bilateral posterior cingulate cortex of the default mode network (independent component 17) and increased inter-iFC between the default mode network (independent component 8) and the somatomotor networks (independent component 2) compared to the ASD_nonADHD group. In addition, the strength of the intra-iFC in the default mode network was associated with the severity of autistic traits across the entire autistic spectrum disorder group and particularly the ASD_coADHD group.
Conclusion:
Our results showed that dysfunction of the default mode network is a central feature in the co-occurrence of autistic spectrum disorder and attention deficit hyperactivity disorder, including connectivity within the default mode network as well as between the default mode network and the somatomotor networks, thus supporting the existence of a clinically combined phenotype (autistic spectrum disorder + attention deficit hyperactivity disorder).
Keywords
Introduction
Autism spectrum disorder (ASD) and attention deficit hyperactivity disorder (ADHD) are both types of neurodevelopmental disorders. According to the Diagnostic and Statistical Manual of Mental Disorders (DSM)-5, ASD is characterized by impaired social communication and social interaction, repetitive behaviors and restricted interests. ADHD manifests as deficits in attention, organization, activity levels and impulse control, and is classified into three subtypes: inattentive, hyperactive-impulsive and combined presentation (American Psychiatric Association, 2013). ASD and ADHD both represent the most prevalent developmental disorders which can cause severe functional impairment across an individual’s lifespan. Both disorders frequently co-occur with estimates for the presence of ADHD within ASD ranging from 30% to 80%, while the presence of ASD in ADHD is estimated at 20–50% (Rommelse et al., 2010; Steijn et al., 2012). Within the Diagnostic and Statistical Manual of Mental Disorders, Fourth Edition (DSM-IV), the diagnosis of ASD and ADHD in the same individual is restricted. Consequently, only a few studies have attempted to study the comorbidity of ASD and ADHD. As supported in the new edition of the DSM-5, rather than a separate condition with distinct impairments, the diagnosis of comorbidity is allowed in clinical practice (Taurines et al., 2012). Existing publications reveal scarce and inconsistent findings with regard to delineating the phenotypic variability of individuals with the co-occurrence of ASD and ADHD. The majority of studies report that children with the co-occurrence of ASD and ADHD display deficits associated with both disorders and that cognitive and social impairment in these individuals may be more severe (Leitner, 2014). One previous study found that individuals suffering from the co-occurrence of ASD and ADHD showed a cognitive delay which was more than twice that of patients with ASD alone (Rao and Landa, 2014).
The present diagnostic criteria and differentiation for these mental disorders are only based on clusters of signs and symptoms. To be more specific, children with the co-occurrence of ASD and ADHD are normally identified because they have social communication impairments, restricted interests and repetitive behavior. However, it is difficult to identify comorbid inattention and/or hyperactivity since there is no objective test to identify such factors. Clinicians are often impeded in their diagnosis and struggle to decide if one or both disorders best describe a patient’s problems. Studies of structural and functional brain connectivity in ADHD or ASD patients independently have provided insight into the functional and structural neuroanatomy of these disorders (Brieber et al., 2007; Rommelse et al., 2017). Over recent years, Rs-fMRI has been widely used to study the human brain functional networks in both ADHD (Ray et al., 2014) and ASD (Kern et al., 2015), and has identified some shared brain connectivity issues. Default mode network (DMN) dysfunction was a significant component of social impairments in ASD (Padmanabhan et al., 2017) and aberrant connectivity within salience network (SN), central executive network (CEN), DMN and attention networks were also found to be related to abnormal cognitive control and state switching in ADHD (Sidlauskaite et al., 2016a, 2016b). Besides, three main variation factors characterized by distinct coupling patterns of the temporoparietal cortices in the DMN with the dorsal attention and SN might be identified the shared brain network dysfunction in ASD and ADHD (Kernbach et al., 2018). However, there have been few studies relating to the co-occurrence of ASD and ADHD with regard to functional connectivity until now.
In the present study, we attempted to elucidate the particular differences in functional brain connectivity in patients suffering from the co-occurrence of ASD and ADHD (the ASD_coADHD group) compared with that in ASD patients without ADHD (the ASD_nonADHD group) and typical developmental (TD) children. We predicted that certain functional connections would mediate the dimensional brain-behavior relationship and thus explain the phenotypes in the group of co-morbid ASD and ADHD patients, thus providing clues which may help clinicians to diagnose and treat such patients.
Materials and methods
Participants from the ABIDE II database
The Autism Brain Imaging Data Exchange II (ABIDE II) currently features 1114 sets of data (age range: 5–64 years) including 521 individuals with ASD and 593 controls from 19 sites. This database was openly released to the scientific community in June 2016 (http://fcon_1000.projects.nitrc.org/indi/abide/abide_II). Our study included individuals with a diagnosis of either autism or Asperger syndrome from the ABIDE II database, collectively referred to as the ASD group. In addition, we selected a control group matched with the ASD group. Then, the ASD group was divided into an ASD_coADHD group and an ASD_nonADHD group according to information related to psychiatric disorder comorbidity collected by each site. Analyses were performed on subjects who met the following inclusion criteria: (1) the patient dataset included a T1-weighted image and an Rs-fMRI scan with near full-brain coverage which could be successfully normalized to Montreal Neurological Institute (MNI) space, (2) the patient dataset included information relating to the comorbidity of psychiatric disorders and (3) the dataset featured a mean framewise displacement (FD) of less than 0.30 mm. These criteria yielded 339 participants (162 ASD patients [including 79 ASD_coADHD and 83 ASD_nonADHD patients] and 177 TD individuals) from 7 sites, in which either the ASD and TD group, or the two groups within the ASD group, were matched by age, gender, performance IQ, mean FD, and eye status (open or closed) in the scanner (Table 1 and Supplementary Table 1). Further details relating to the demographics, and a selection flowchart for the final sample, are provided in Supplementary Figure 1.
Participant demographics.
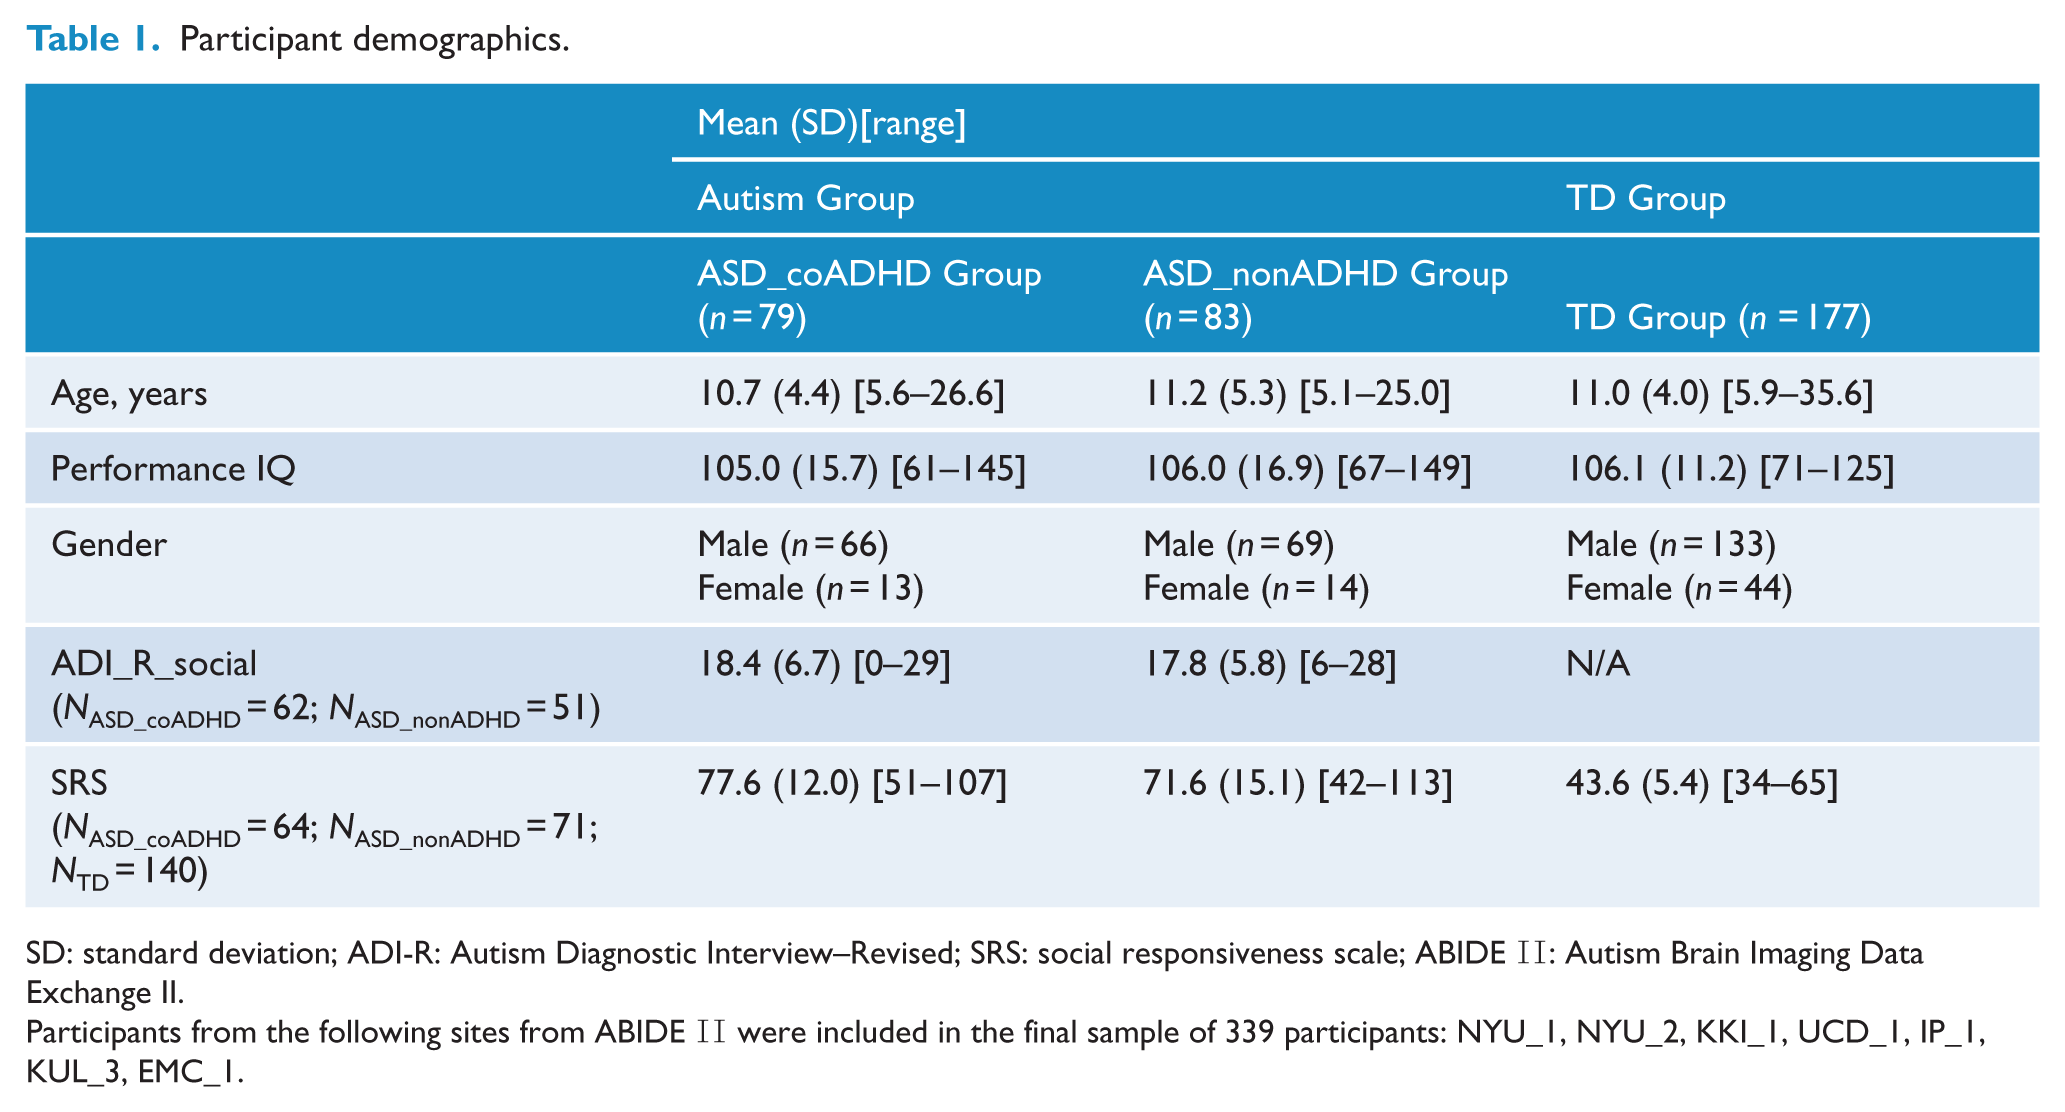
SD: standard deviation; ADI-R: Autism Diagnostic Interview–Revised; SRS: social responsiveness scale; ABIDE II: Autism Brain Imaging Data Exchange II.
Participants from the following sites from ABIDE II were included in the final sample of 339 participants: NYU_1, NYU_2, KKI_1, UCD_1, IP_1, KUL_3, EMC_1.
Magnetic resonance imaging data acquisition and preprocessing
All data were collected with 3 T magnetic resonance imaging (MRI) scanners, although the sequence parameters, and the type of scanner, varied across sites; these are described on the ABIDE website (Supplementary Table 2). Image processing was conducted using Data Processing Assistant for Resting-State fMRI (DPARSF V2.3) software (Yan et al., 2016). We removed the first 5 volumes from each subject’s series, and aligned the slice timing, and then corrected head motion. Participants who displayed excessive head motion, mean FD > 0.3 mm, were excluded from further analysis. The Diffeomorphic Anatomical Registration Through Exponentiated Lie algebra (DARTEL) tool (Ashburner, 2007) was used to transform functional data from individual native space to MNI space. The images were then spatially normalized to the MNI space, resampled to a voxel size of 3 × 3 × 3 mm3, and spatially smoothened with a Gaussian kernel (5 × 5 × 5 mm3 full-width at half maximum), and high-pass filtered (0.01 Hz threshold).
Independent component analysis
Spatial independent component analysis (ICA) was conducted for resting-state fMRI data from all 339 participants using the Infomax algorithm with the Group ICA 4.0 of fMRI toolbox (GIFT, www.icatb.sourceforge.net). The minimum description length criteria tool in GIFT was used to estimate the number of components based on the aggregate dataset (Rissanen, 1978), suggesting that 23 was the optimal number of independent components (ICs). The dimensions of the functional data were then reduced using principal component analysis (Calhoun et al., 2001a), followed by an IC estimation that produced spatial maps and time courses with the Infomax algorithm (Calhoun et al., 2001b). Next, 100 ICA (ICASSO, implemented in GIFT software) was applied to ensure stability of the decomposition (Himberg et al., 2004). This resulted in a set of mean group components, which were then back-constructed into single subject space using GICA3 (Erhardt et al., 2011). After all these steps, we obtained a spatial z-map and its corresponding time course (TC) for each subject, as well as the mean z-map and TC for each IC. The TC of each component represented a pattern of synchronized brain activity, whose coherency pattern across voxels was represented in the associated spatial map. To display voxels relevant to a particular IC, the intensity values in each map were converted to z values (Stevens et al., 2009).
Selection of networks-of-interest
The preceding procedure yielded 23 spatiotemporal components (Supplementary Figure 2). We statistically compared the spatial map of each IC to a set of 7 well-established resting-state networks (RSNs) by analyzing resting-state data from approximately 1000 participants (Choi et al., 2012). We then calculated Pearson’s r statistic (Sort Components, implemented in GIFT software) for each pairwise relationship and kept only those ICs that yielded a significant spatial correlation (Pearson’s r > 0.264) with one of the RSNs mentioned above (Choi et al., 2012). This procedure identified 15 ICs, and the remaining ICs, which did not significantly correlate with a reference RSN, were eliminated from further analysis.
Outcome measures
Intra-iFC
The 15 ICs corresponding to the six networks were extracted from all participants. For each participant, each component’s z-map, and its corresponding TC, reflected intra-iFC measurements. To analyze ASD-TD group differences of intra-iFC, for each network, the participant’s spatial z-maps were entered into two-sample t-tests with age, site, gender, PIQ, eye status and mean FD as covariates. To ensure that only highly connected regions were analyzed, we used an explicit mask created by combining the results of the one-sample t-test, <0.01, false discovery rate (FDR) correction, of ASD and TD groups (Figure 3(A)). The significance level for each network in between-group comparison was corrected for multiple comparisons with 5000 permutations and threshold free cluster enhancement (TFCE) (Smith and Nichols, 2009).
At the cluster-level, we extracted FC values of the above detected clusters with significant group differences. Multivariate analysis of variance (MANOVA) was then conducted to explore differences in the FC values of the altered clusters between the ASD_coADHD group and ASD_nonADHD group. Gender, age, performance IQ, eye status and mean FD were considered as covariates.
Inter-iFC
The Functional Network Connectivity (FNC) Toolbox was an extension of the GIFT toolbox that can load the GIFT parameter file and calculate lags between components that were correlated to each other (http://mialab.mrn.org/sofware). Prior to FNC analysis, fMRI data were band-pass filtered with a Butterworth filter with cutoff frequencies of 0.008–0.15 Hz (Meda et al., 2012). Then, all 15 RSNs were paired with one another to yield a total of 105 pair-wise combinations. Pair-wise correlation coefficients from all groups were extracted into Statistical Product and Service Solutions (SPSS) 19.0 software. Resulting correlation data were transformed to Fisher’s z values and subjected to two-sample t-tests with a significance threshold at q < 0.05 with FDR correction.
Within the ASD group, we further tested the differences in abnormal inter-iFC values between the two groups (ASD_coADHD and ASD_nonADHD) by using MANOVA, after regressing out age, gender, performance IQ, eye status at scan, and mean FD. Finally, the final results were corrected for multiple comparisons using FDR correction.
Brain-behavior analysis
Multiple regression analyses were conducted for the ASD group to detect associations between extracted values or z-scores of abnormal intra-iFC and inter-iFC values and autistic traits, measured using the scores of the Autism Diagnostic Interview–Revised (ADI-R) social scale (Lord et al., 1994), after controlling for several variables (site, age, gender, performance IQ, eye status and mean FD). This analysis was restricted to the 67.5% of ASD (n = 112) participants (7.2% of ASD_coADHD (n = 61) and 61.4% of ASD_nonADHD(n = 51)) whose ADI_R_social data were available (Table 1).
Statistical analysis
Differences in demographic and clinical characteristics between the ASD and TD groups, as well as differences between the ASD_coADHD and ASD_nonADHD group, were detected with two-sample t-tests (continuous data) or the chi-square test (categorical data), as appropriate.
Statistical analysis of z-maps was performed with the DPARSF (Yan et al., 2016). Demographic, clinical, and extracted z-score data analyses were conducted in SPSS 19.0.
The data processing pipeline for resting state data, and the method and process of statistical analysis, is shown in Figure 1.
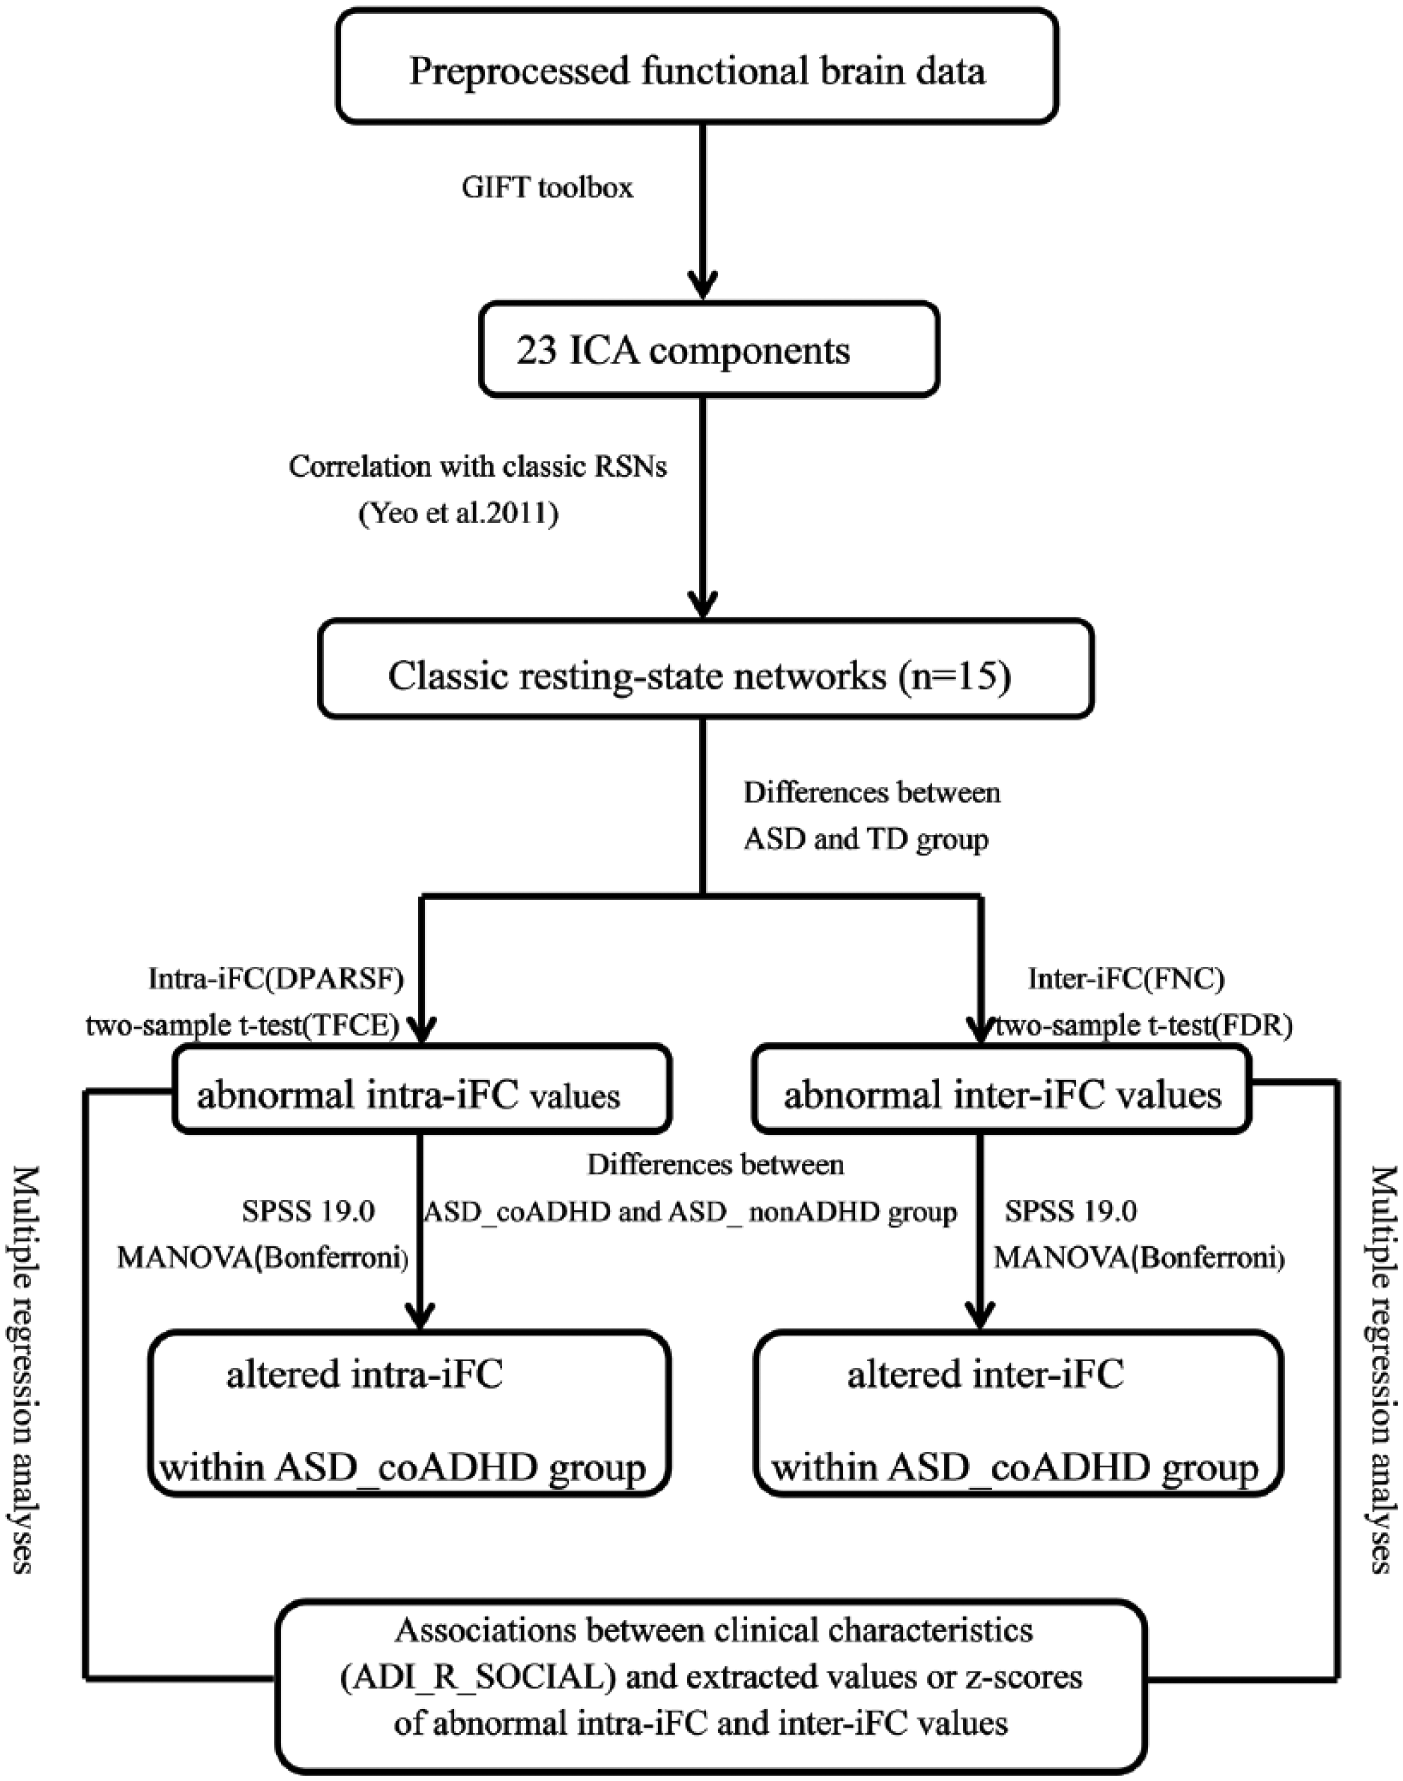
Analysis plan of the current study.
Results
Demographic and clinical variables
Demographic and clinical characteristics of our patients are summarized in Table 1 and Supplementary Table 1. The ASD and TD groups were well matched, with no significant difference in age, gender, performance IQ, mean FD and eye status (open or closed) in the scanner. Within the ASD group, the ASD_coADHD and ASD_nonADHD groups were not significantly different in terms of age, gender, performance IQ, mean FD and eye status. The ASD_coADHD group had significantly higher SRS_T scores compared with the ASD_nonADHD group (p = 0.003), but there was no significant difference on the ADI-R between the two groups.
Identification of networks of interests
The 15 selected ICs in our study were subsets of the large six major RSNs: visual, somatomotor, dorsal attention, ventral attention, default and frontoparietal networks identified by a previous study based on resting-state data from approximately 1000 participants (Choi et al., 2012); within this patient cohort, there was not one IC that correlated significantly with the limbic network. In the present study, we show IC numbers from the GIFT output under the label of the reference networks. Any IC that significantly correlated with more than one template network was grouped into the template network with which it was most strongly correlated (Figure 2(A)). There was more than a single RSN that correlated significantly with template network masks except for ventral attention network. The three networks (ICs 3, 5 and 23) were correlated with a visual network composed of regions extending from the occipital pole through the cuneal cortex and lingual gyrus. The three networks were correlated with the somatomotor network consisting of the superior pre- and postcentral gyrus (IC 2), primary auditory cortex and superior temporal pole (IC 11) and pre- and postcentral gyrus (IC 9). The two networks (ICs 4 and 7) were correlated with the dorsal attention network consisting of part of the dorsolateral frontal, parietal and occipital regions. The single network (IC 18) was correlated with the ventral attention network and consisted of a conglomerate of ventral and dorsal anterior cingulate cortex and part of the dorsolateral prefrontal cortex regions. The two networks (ICs 8 and 17) were correlated with the DMN and consisted of medial prefrontal cortex, posterior cingulate cortex (PCC) and part of the precuneus. Finally, there were four networks that correlated with frontoparietal networks: classic right and left frontoparietal networks (ICs 13, 20, 21 and 22). We also showed the ICs from the current study (plotted in multiple colors) next to the template networks (plotted in red) (Figure 2(B)).
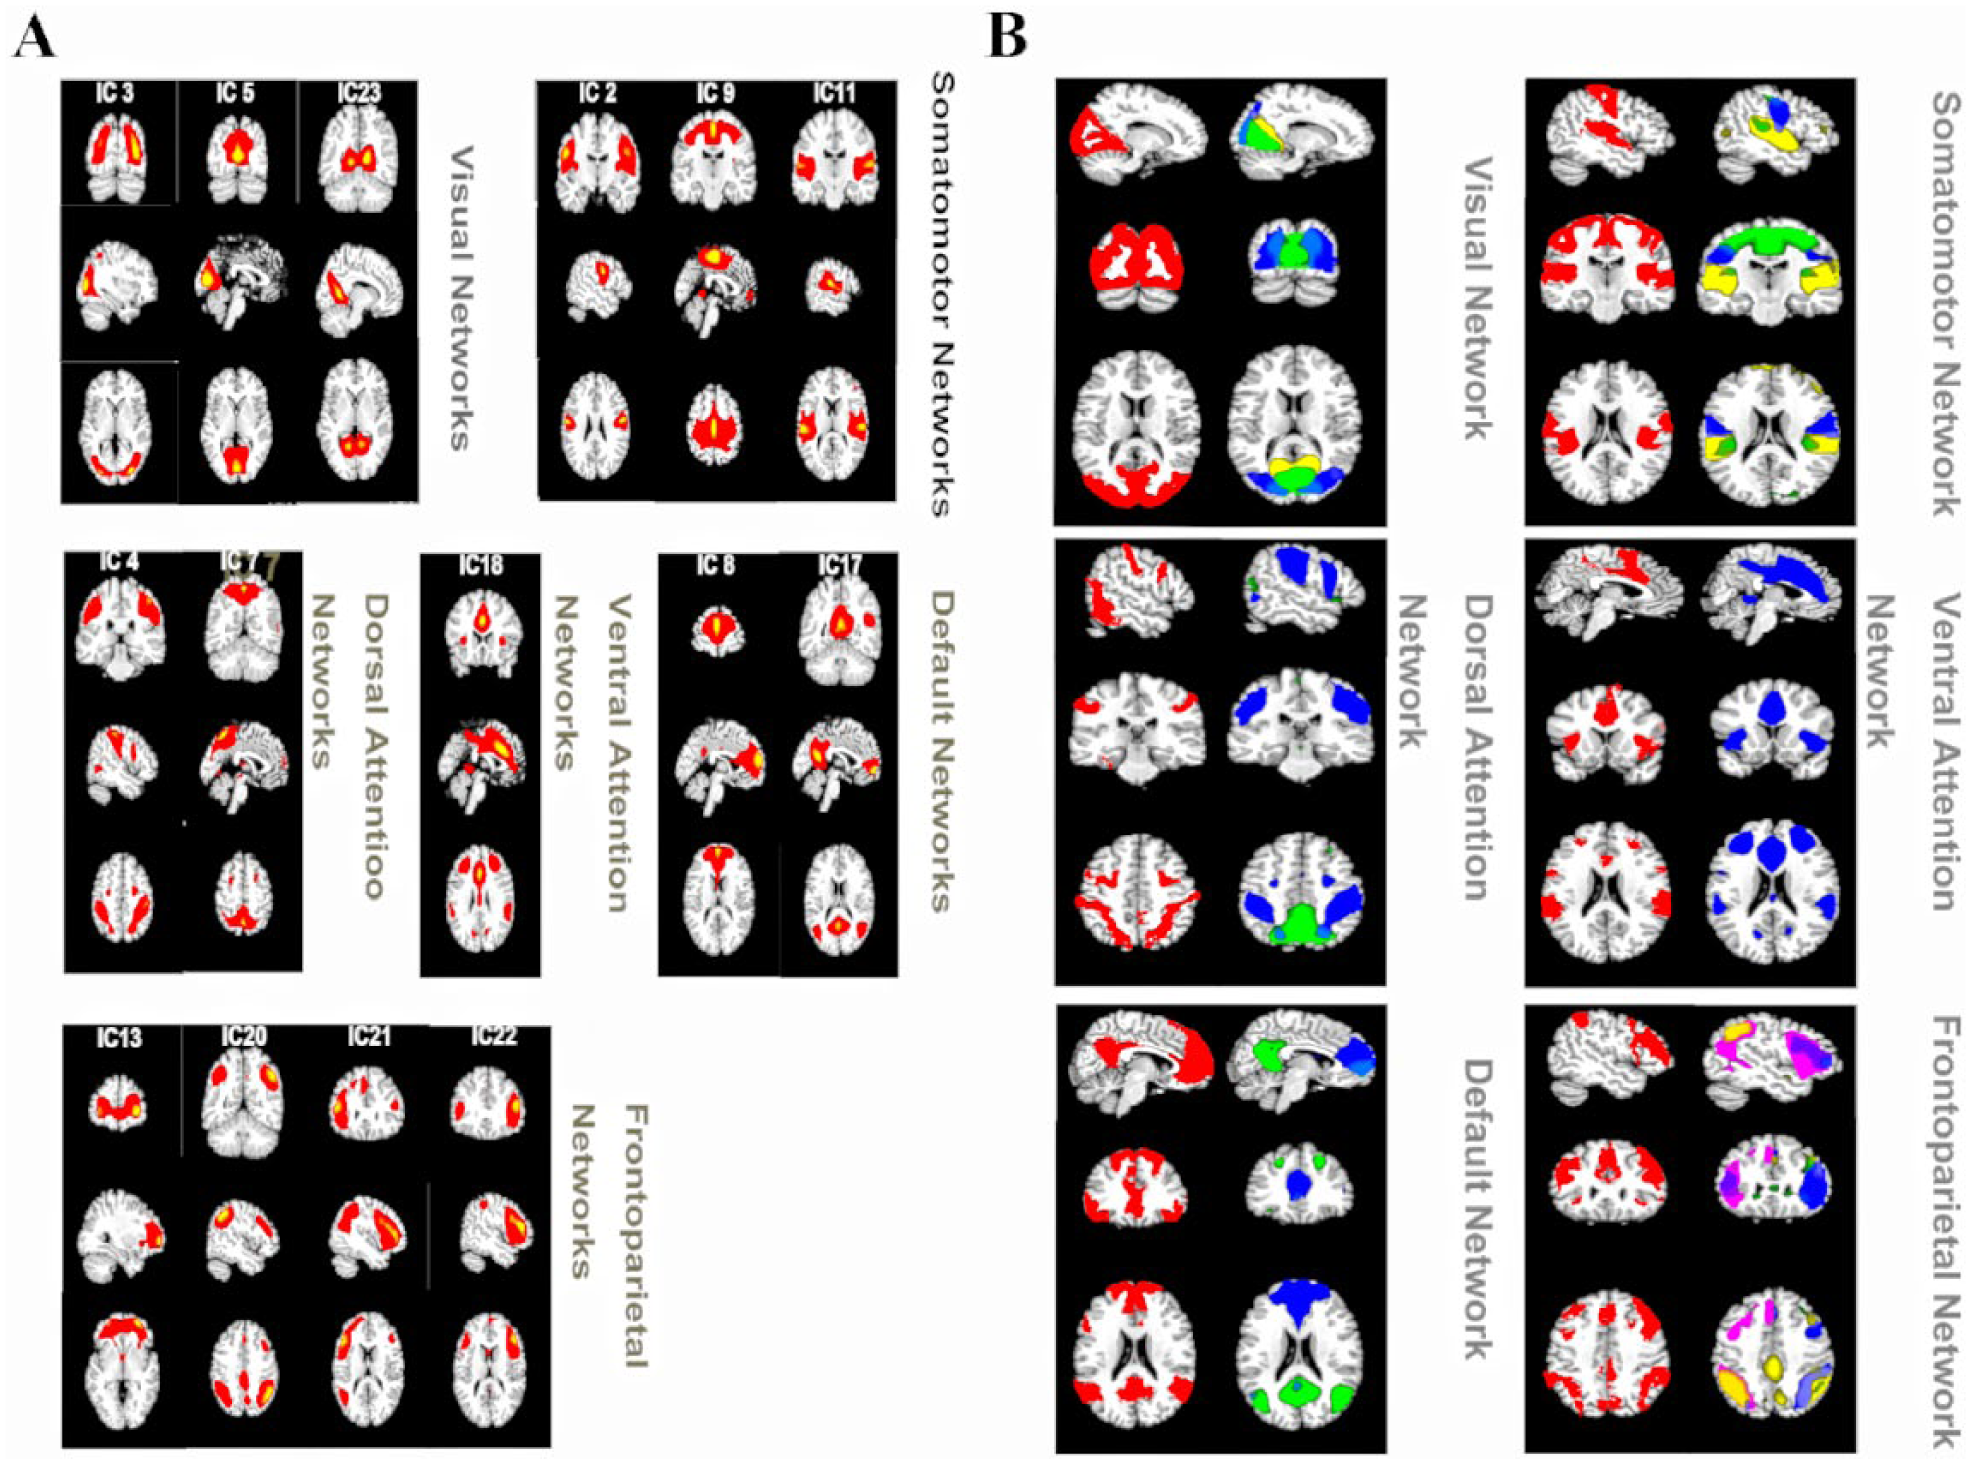
(A) Resting-state networks from the current study were grouped into six categories based on their relationship to reference networks (visual, somatomotor, dorsal attention, ventral attention, default, and frontoparietal). Independent components that significantly overlapped with more than one template were grouped with the template they correlated with most strongly. (B) Resting state networks from the current study compared to reference networks. Reference networks are shown on the left in red. RSNs from the current study were spatially combined into a single image and plotted in contrasting colors.
Group differences in intra-iFC
Compared to TDs, ASD patients exhibited significantly decreased FC in the bilateral PCC of the IC 17, which was identified as the DMN (TFCE corrected; Figure 3(B), Table 2). No group differences in the intra-iFCs of the other ICs were detected. Within the ASD group, MANOVA revealed a significant interaction between the group and the extracted FC value of two altered clusters. The ASD_coADHD group had significantly lower intra-iFC values than the ASD_nonADHD group, left: F(1, 160) = 4.985, p = 0.027; right: F(1, 160) = 7.004, p = 0.009 (Figure 3(C)).
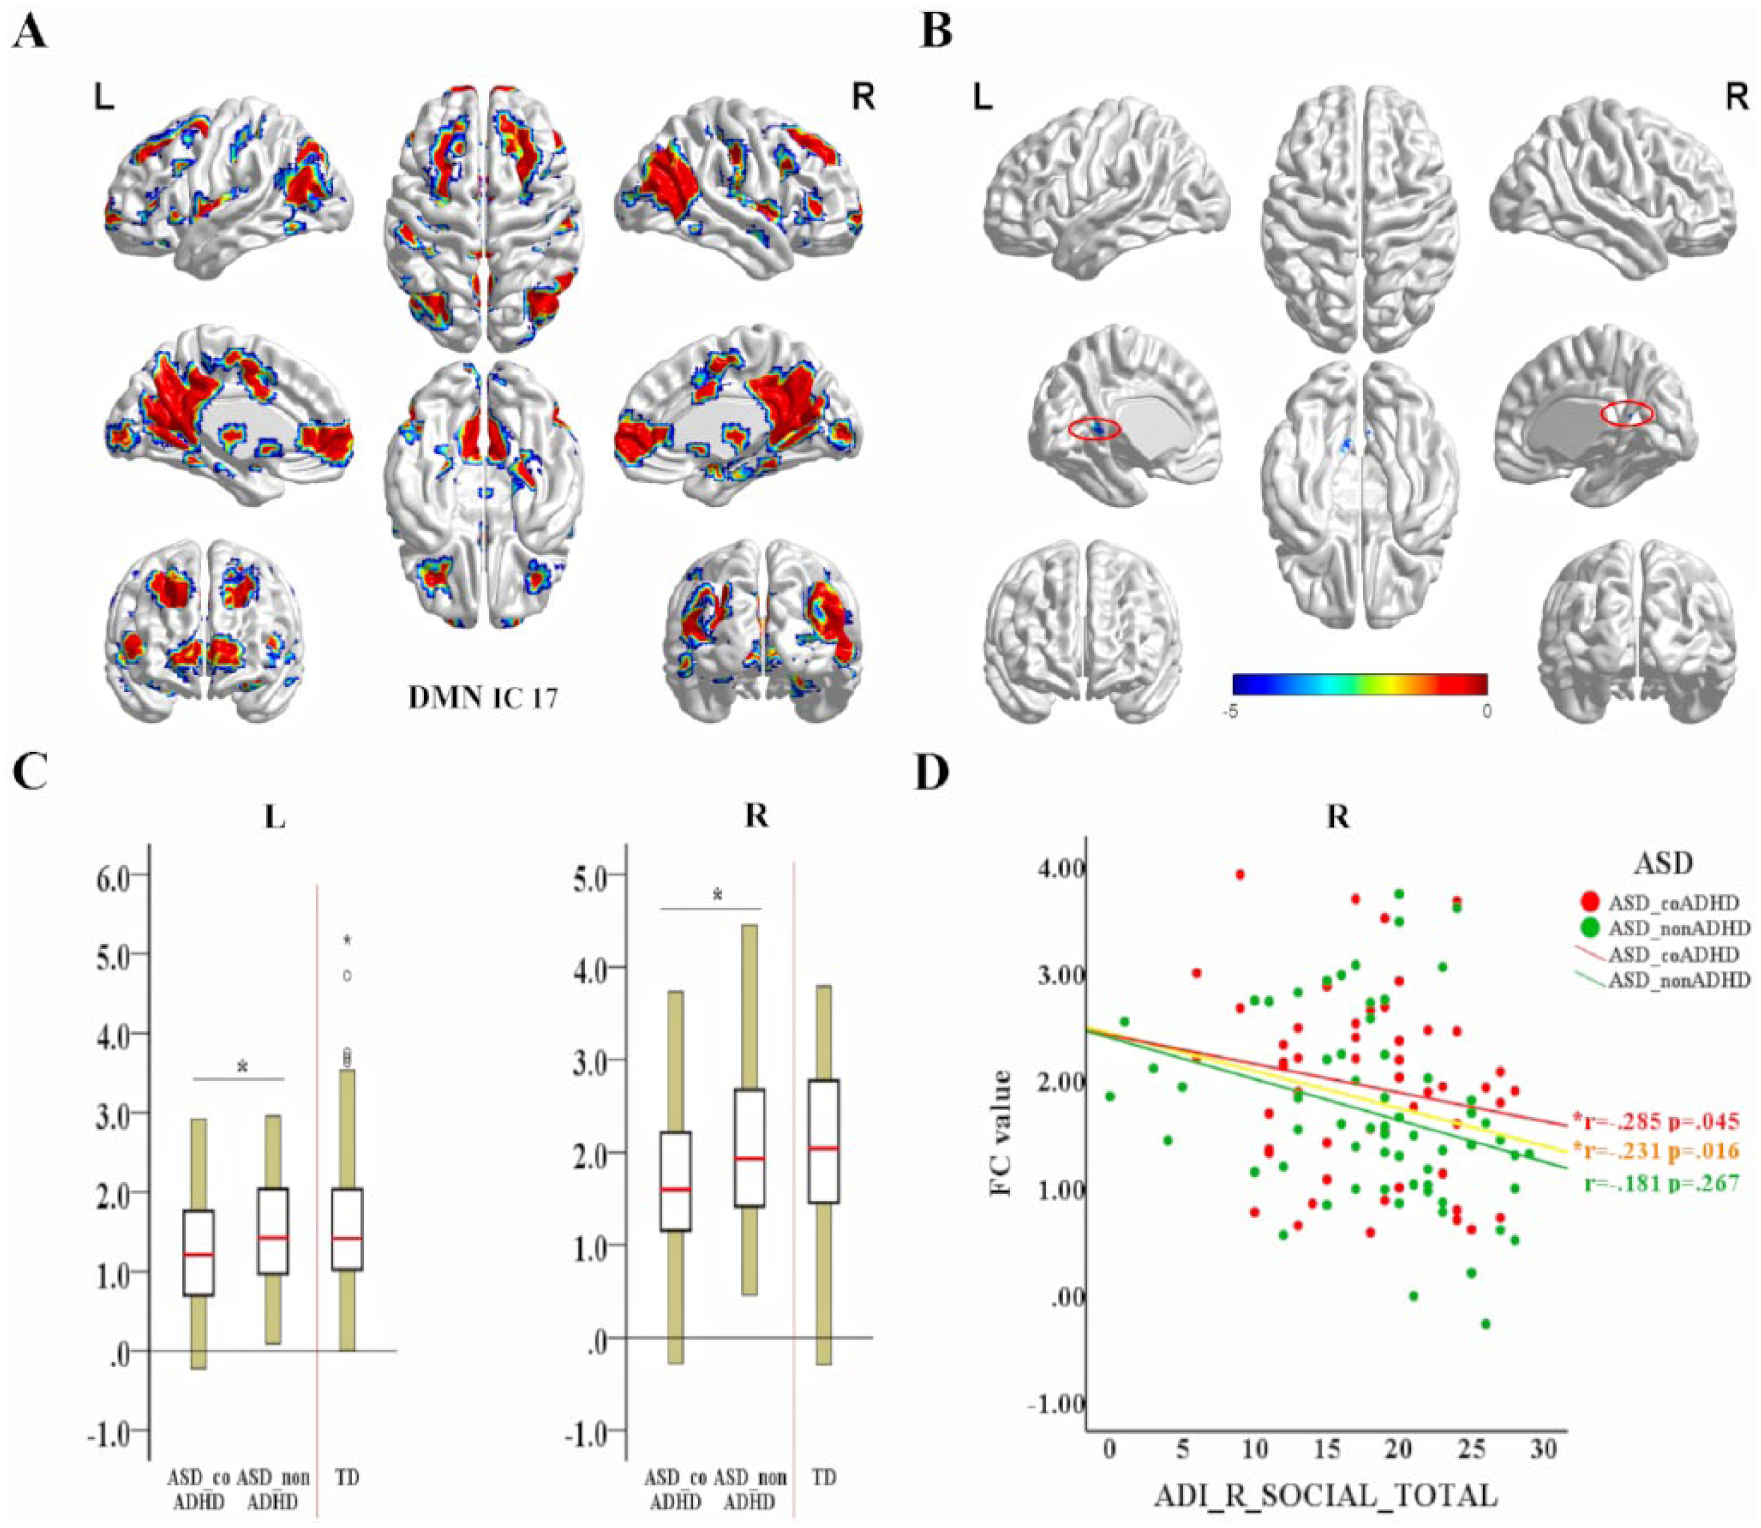
Group differences in connectivity within each network and the associations between clinical characteristics (ADI_R_social score) and extracted values of abnormal intra-iFC within the ASD group. (A) The DMN_RSN (IC 17) mask created by combining the results of a one-sample t-test (FDR correction, q < 0.01) of each group. (B) Altered functional connectivity within brain networks in participants with ASD. Compared with TDs, patients with ASD showed decreased functional connectivity (FC) in the left and right posterior cingulate cortex (PCC) within the DMN (TFCE correction with 5000 permutations). For the size of significant clusters identified by the t-test analysis, see Table 2. (C) Extracted altered DMN intra-iFC within the ASD group; the ASD_coADHD group showed decreased intra-iFC compared to the ASD_nonADHD group. (D) Partial correlation between ADI_R_social scores and right altered DMN intra-iFC, controlling for demographic variables (age, gender, site, PIQ, eye status and mean FD) (significant at p < 0.05).
Altered intra-network functional connectivity in patients with ASD as compared to TDs.
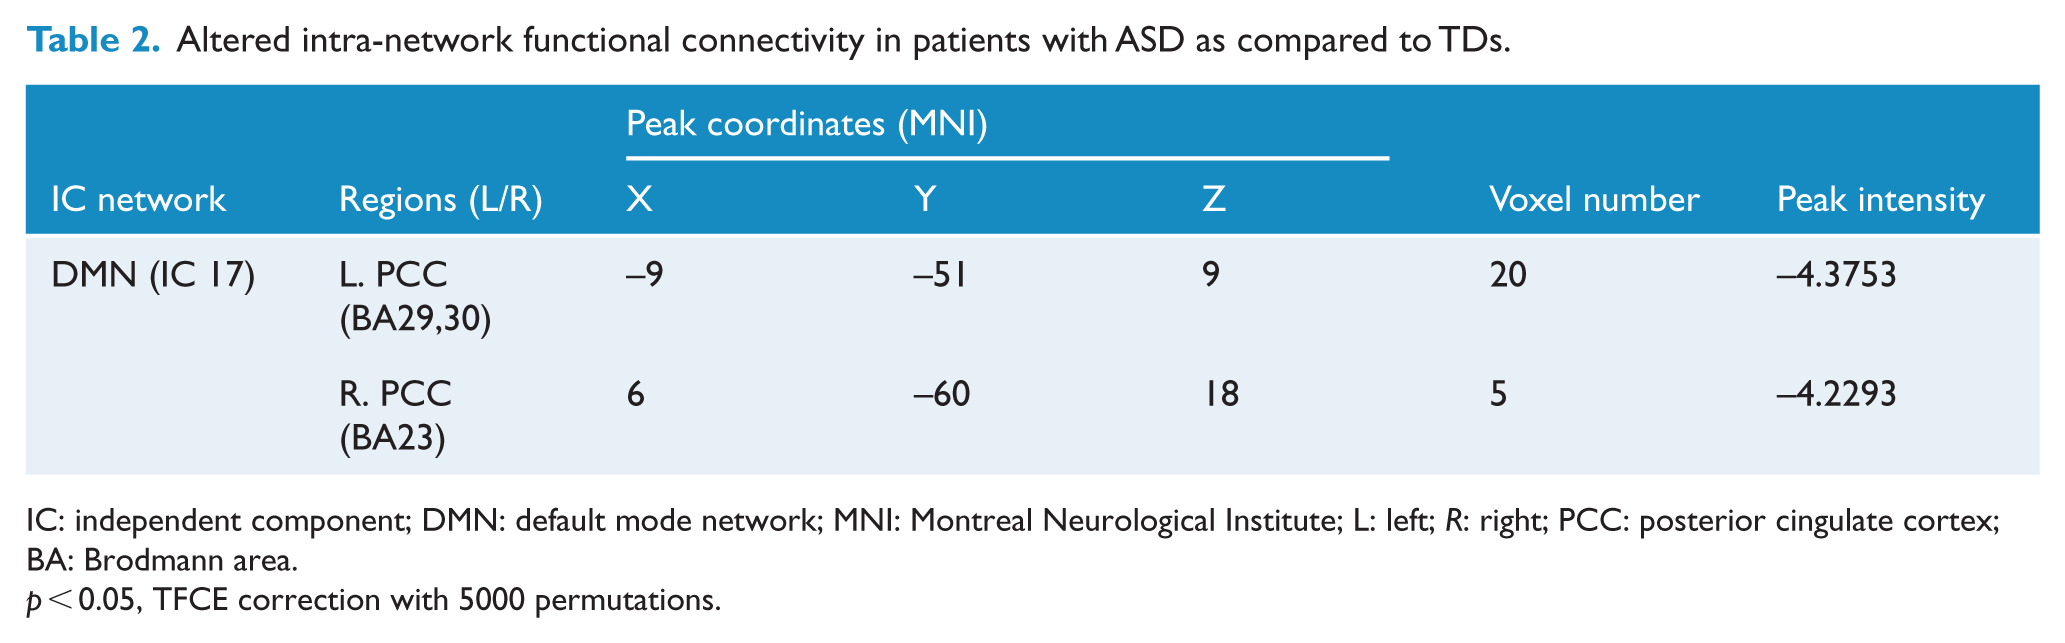
IC: independent component; DMN: default mode network; MNI: Montreal Neurological Institute; L: left; R: right; PCC: posterior cingulate cortex; BA: Brodmann area.
p < 0.05, TFCE correction with 5000 permutations.
Group differences in inter-iFC
The FNC analysis carried out on the inter-FC between 15 brain networks revealed significantly increased or decreased FC between 14 pairs of correlation coefficients in patients with ASD compared with TDs, < 0.05, FDR correction; Figure 4(A) and Supplementary Table 3. Of the 14 pairs with altered inter-iFC in the ASD group, MANOVA showed that ASD_coADHD patients had increased inter-iFC between the somatomotor network (IC 2) and the DMN (IC 8); these alterations indicated impaired FC between the DMN and the somatomotor network (p < 0.05, FDR corrected) (Figure 4(B), Table 3).
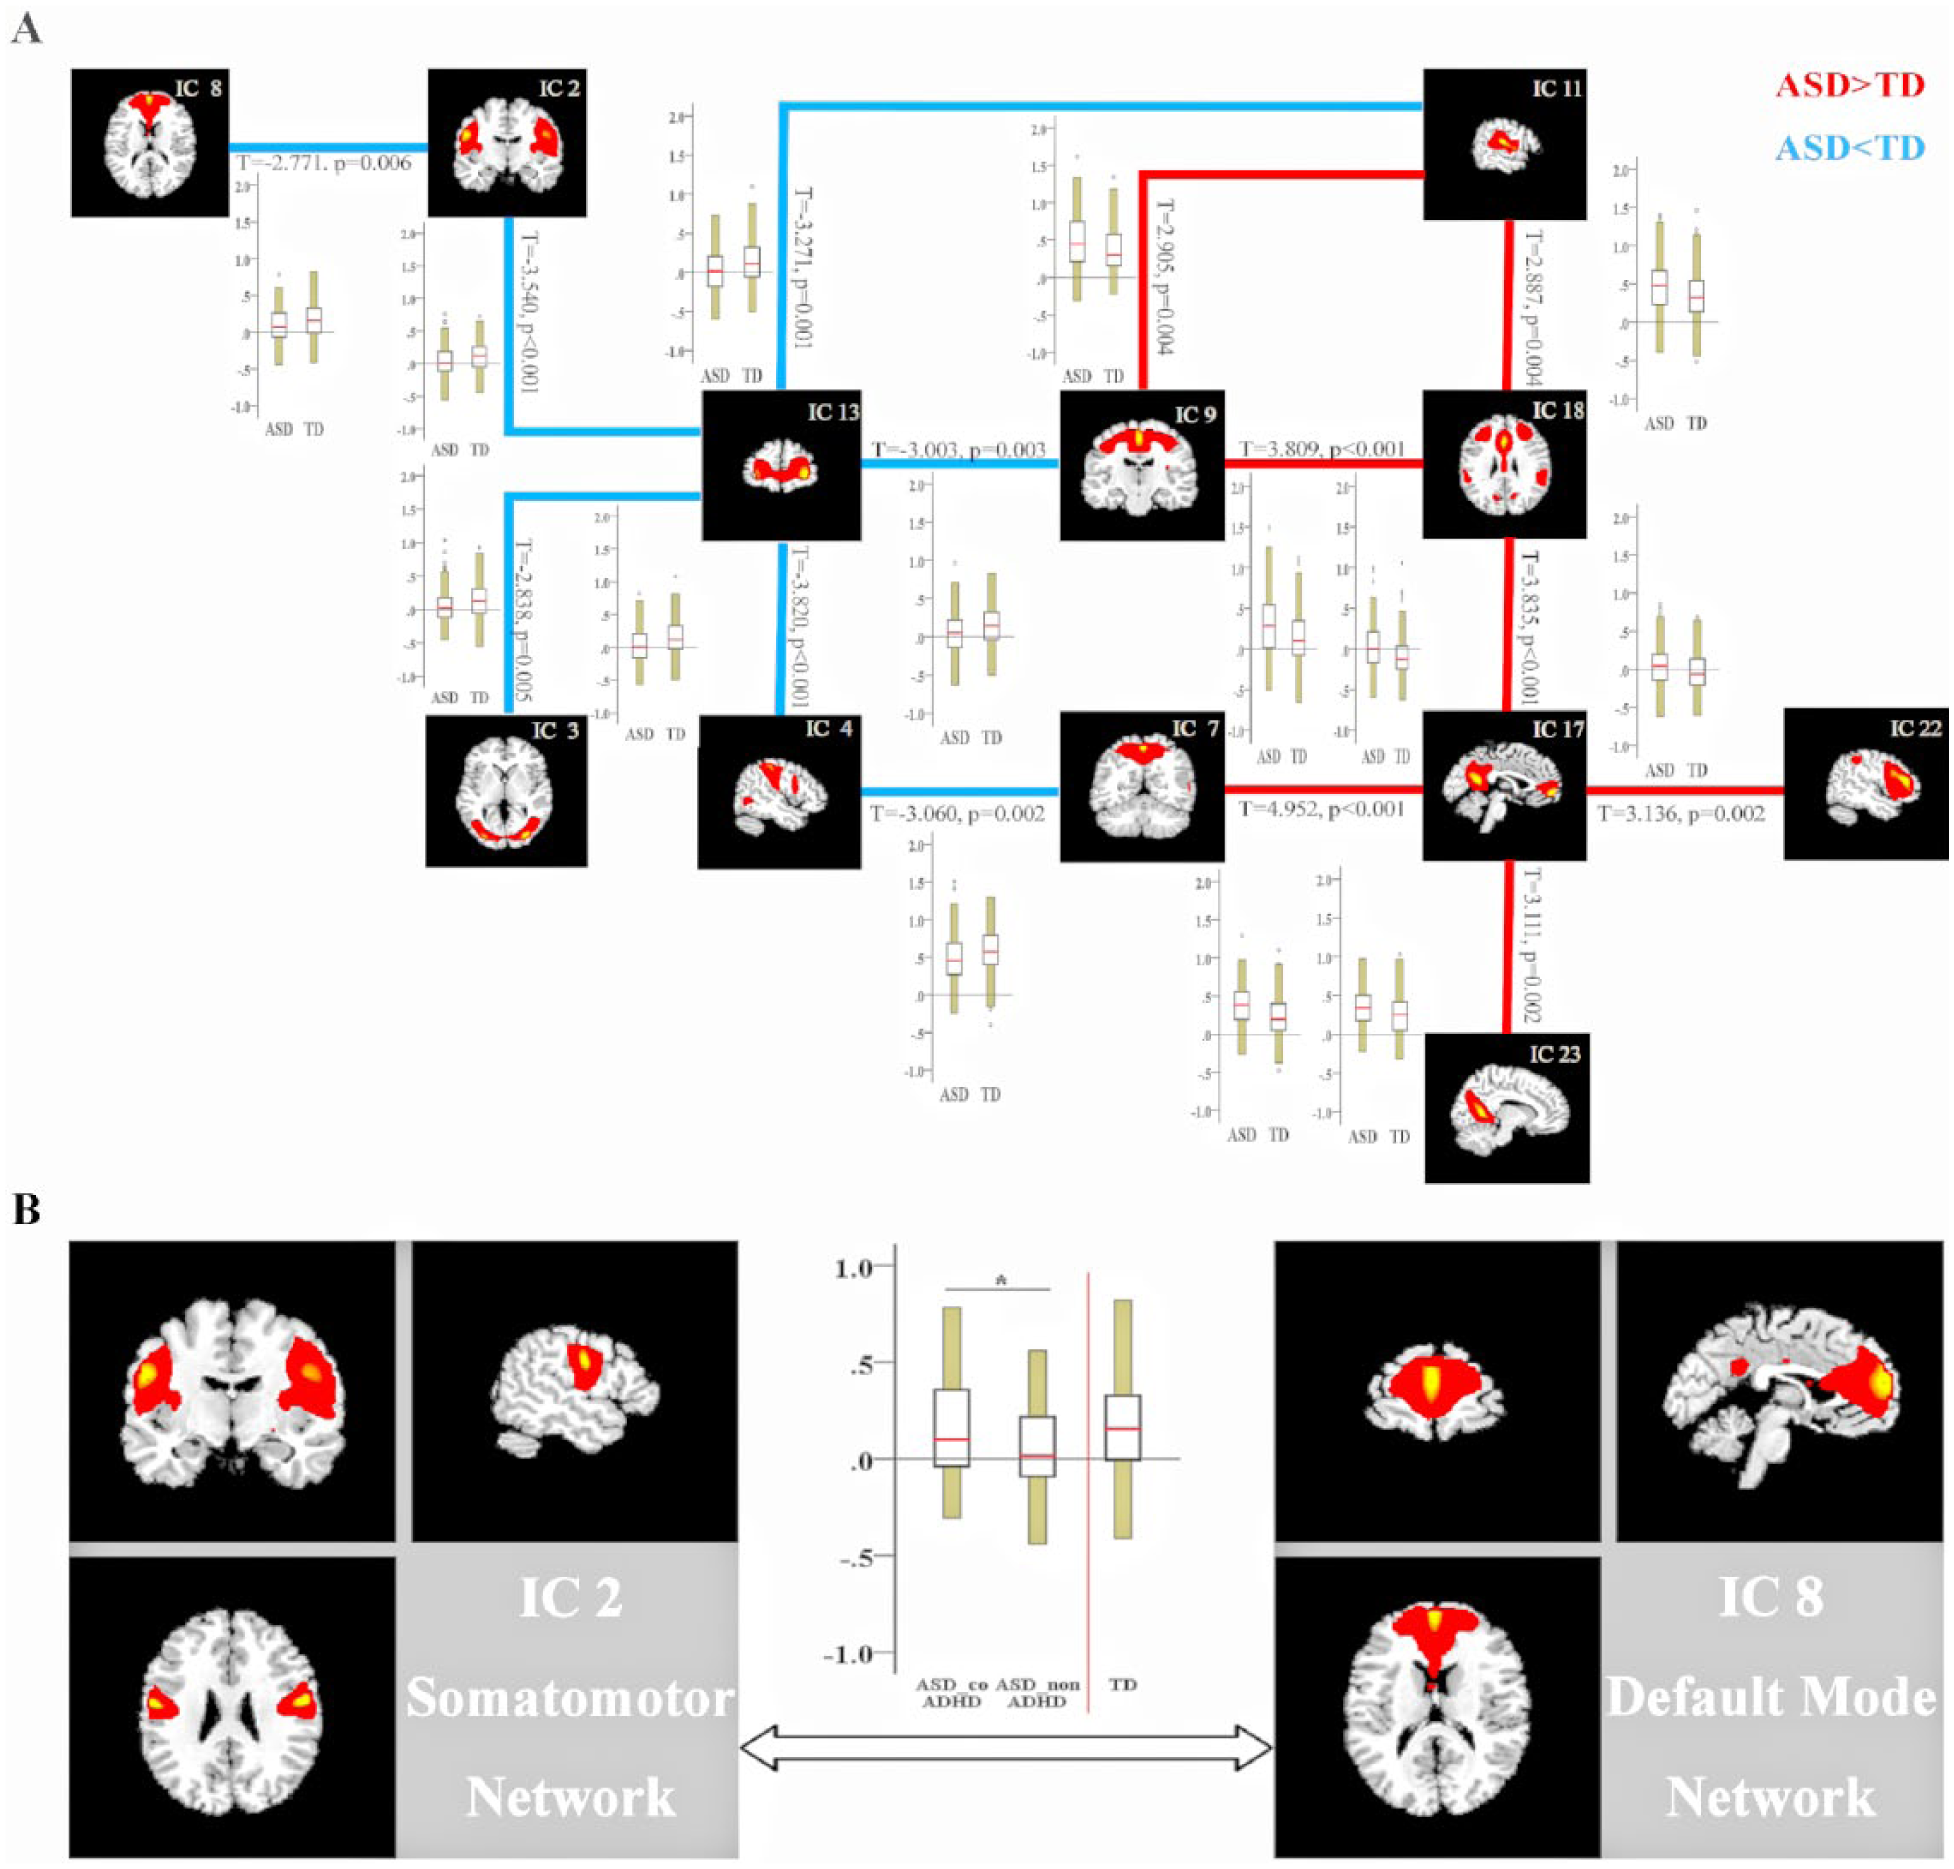
Group differences in between-network connectivity. (A) Group differences in FNC strength are shown as lines (red indicates increased FNC in ASD with respect to TD participants; blue shows the reverse situation) together with boxplots for each group. Boxplots report the mean (red line), standard deviation (yellow bars) and standard error of the mean (black rectangle around the mean) of group-level FNC values. Results were obtained by comparing the between-network functional connectivity of 162 ASD and 177 TD participants, using FDR correction, leading to 14 pairs of correlation coefficients (q < 0.05, FDR correction). For further details, see Supplementary Table 3. (B) Brain maps of the default mode network (DMN) and somatomotor network derived from independent component analysis; boxplots and column graph indicate increased aberrant functional DMN-somatomotor interactions in ASD_coADHD patients compared to ASD_nonADHD patients (q < 0.05, FDR corrected) within the ASD group. *Significant at q < 0.05 after FDR correction.
Altered inter-network functional connectivity in patients with ASD_coADHD as compared to ASD_nonADHD.
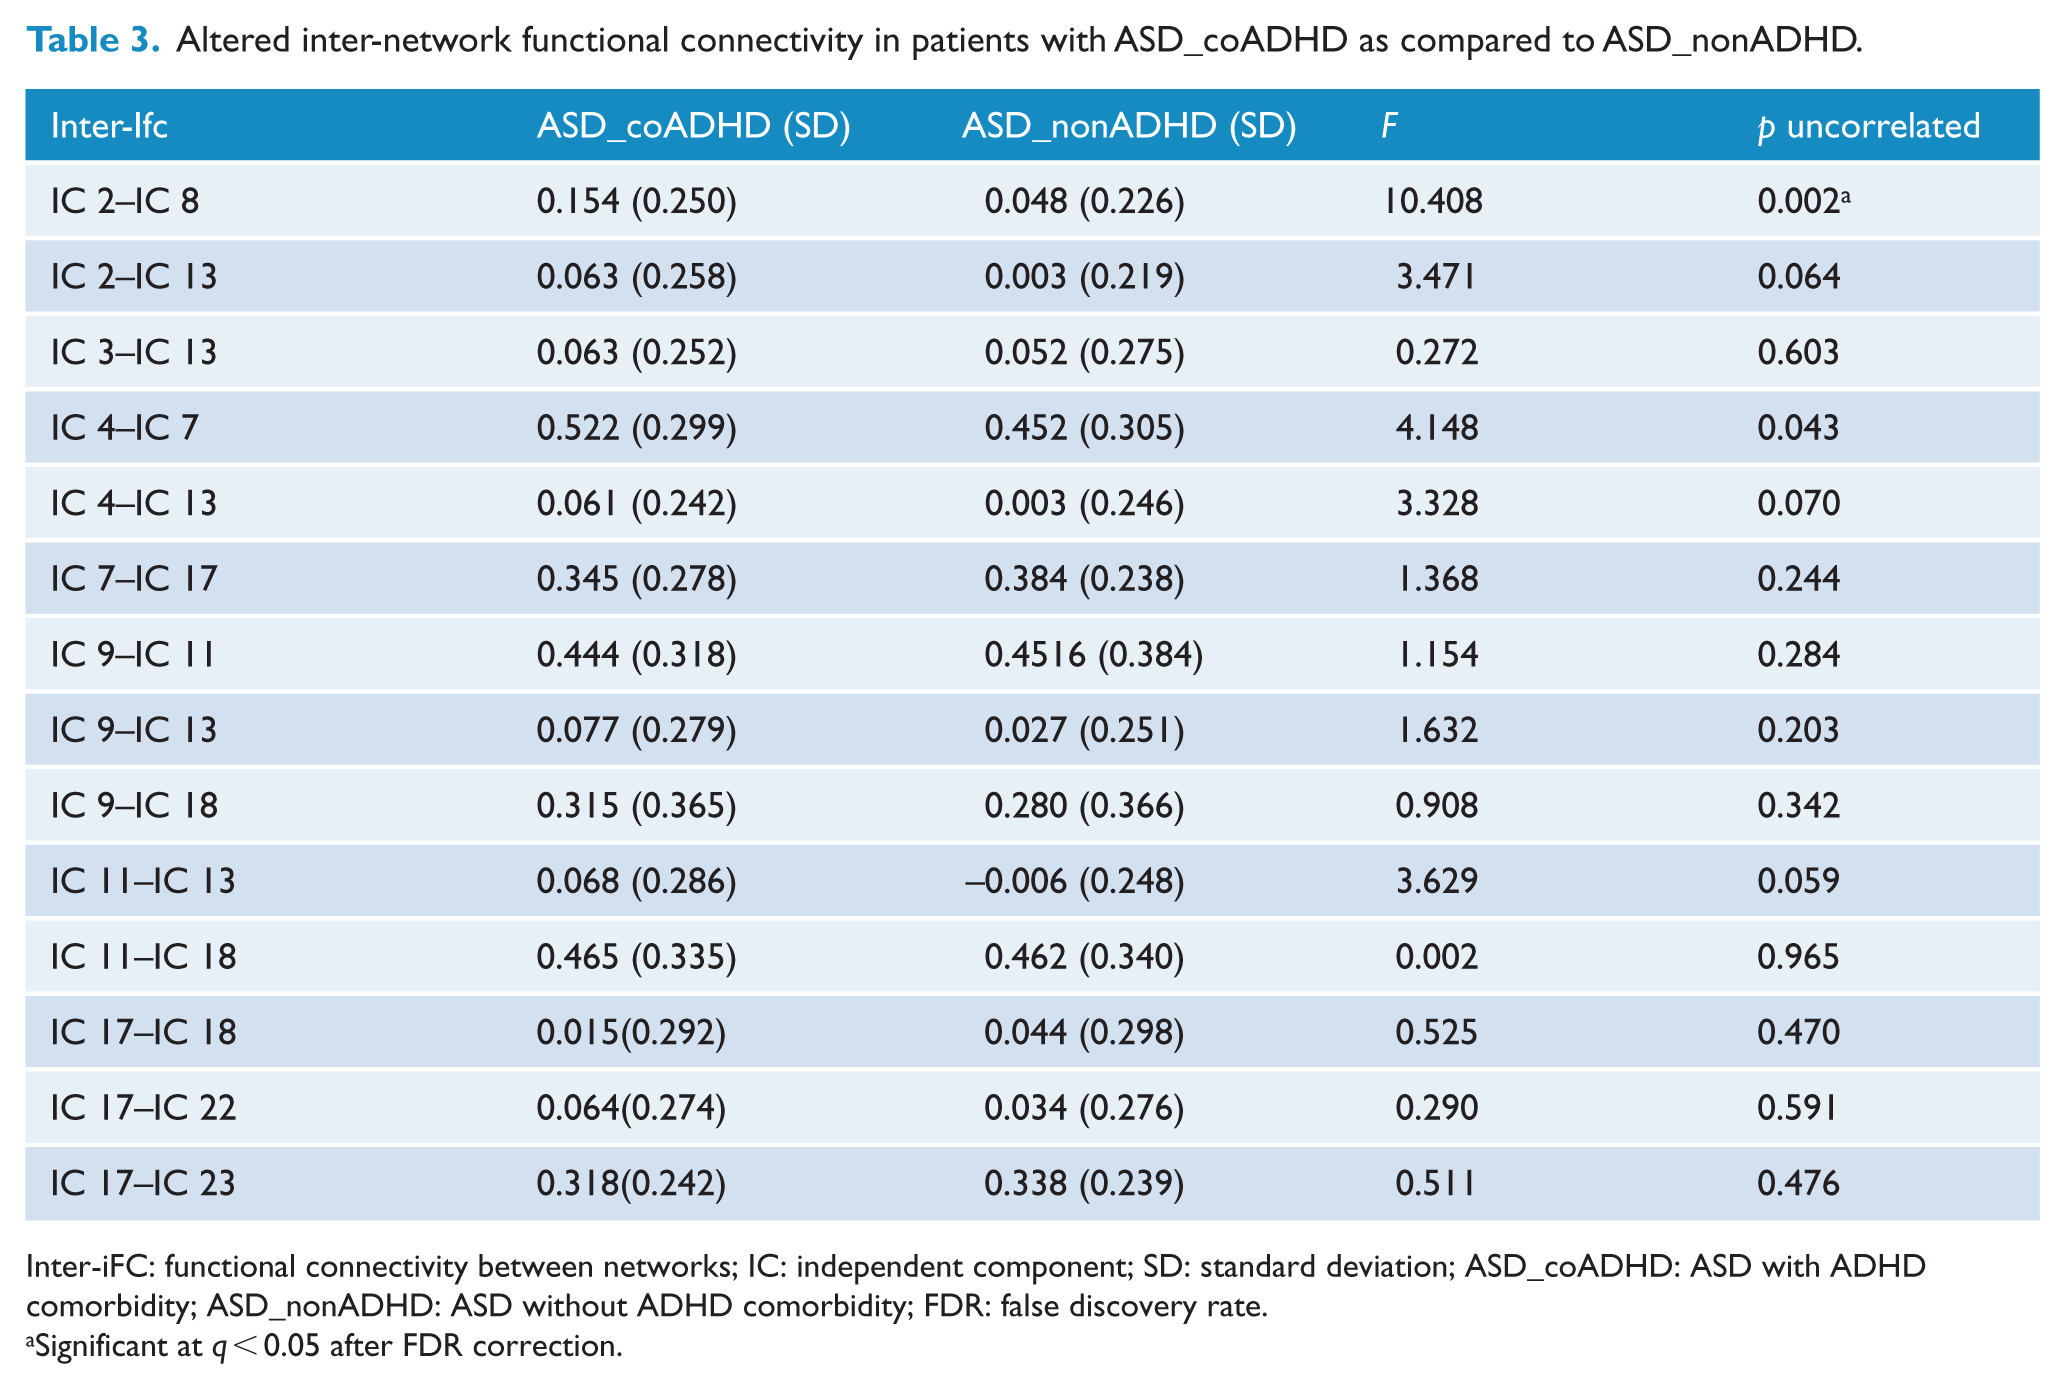
Inter-iFC: functional connectivity between networks; IC: independent component; SD: standard deviation; ASD_coADHD: ASD with ADHD comorbidity; ASD_nonADHD: ASD without ADHD comorbidity; FDR: false discovery rate.
Significant at q < 0.05 after FDR correction.
Additional analyses on the significant connectivity findings with site and age are shown in Supplemental Materials
Brain-behavior analysis
As shown in Figure 3(D), the altered intra-iFC of the DMN in the right hemisphere was negatively correlated with ADI_R_social scores in the ASD group (r =−0.231, p = 0.016, N = 112) and ASD_coADHD group (r =−0.285, p = 0.045, n = 61), but not in the ASD_nonADHD group (p = 0.267, n = 51). Our regression analysis did not detect statistically significant correlation between alterations in the inter-iFC of the DMN-somatomotor network and ADI_R_social scores.
Discussion
Despite established diagnostic criteria for ASD or ADHD, the functional mechanisms in the brain responsible for comorbidity of the two disorders remain poorly understood. This study systematically investigated the brain functional connectivity of autism with and without ADHD comorbidity, and the association of this condition with autistic traits. In children with both ASD and ADHD, cognitive and social impairment may be more severe than those without comorbidity (Leitner, 2014). We analyzed the functional connectivity, and social deficits, of these in two groups systematically. Notably, our findings suggested that DMN may be a potential image trait marker with which to identify autism and ADHD comorbidity within a subgroup of patients with ASDs.
The DMN is a major functional brain system which has been implicated in a number of psychiatric disorders, including ASD (Padmanabhan et al., 2017) and ADHD (Castellanos et al., 2008). The DMN is important for the social understanding of others (Li et al., 2014), being engaged in tasks involving evaluative social processes (Gusnard and Raichle, 2001; Padmanabhan et al., 2017), mentalizing and theory of mind (Buckner et al., 2008; Schilbach et al., 2008). A rich body of literature has highlighted the structural abnormalities of DMN in ASD patients, including cortical thickness and volume (Haar et al., 2016; Valk et al., 2015), gray matter density (Uddin, 2011) and white matter abnormalities (Catani et al., 2016; Jou et al., 2011; Walker et al., 2012), which persist throughout development. Due to technical difficulties, few task-based fMRI studies have investigated the functional architecture of the DMN in children with ASD. Studies using theory of mind tasks have reported reduced activation of the dorsal mPFC, temporoparietal junction (TPJ), and PCC in children with ASD (Kana et al., 2015), but increased activation in adolescents with ASD (White et al., 2014), compared to age-matched controls. Resting-state fMRI has been used more extensively in ASD studies owing to the relative ease of acquiring data with this system. Our study systematically investigated connectivity within and between the functional architecture of the resting brain in patients diagnosed with both ASD and ADHD. We observed that ASD_coADHD patients had reduced intra-iFC in the bilateral PCC of the DMN and increased inter-iFC between the DMN and the somatomotor network compared to ASD_nonADHD patients. Furthermore, within the ASD group, we found that abnormal intra-iFC of the DMN was negatively related to the degree of autistic traits, as measured by ADI_R_social scores. Our results are consistent with a previous report which stated that disrupted intrinsic DMN organization was associated with social deficits in children and adults with ASD (Chen et al., 2016; Lynch et al., 2013; Yerys et al., 2015).
We observed decreased intra-iFC strength in the bilateral PCC of the DMN in ASD patients, which is consistent with previous studies using both region of interest (ROI) and ICA approaches (Assaf et al., 2010; Kennedy and Courchesne, 2008; Von dem Hagen et al., 2013). Our results of regression analysis suggest that intra-iFC strength of the DMN may underlie the severity of the autism spectrum traits, regardless of co-morbidity with ADHD. The PCC is highly connected, one of the core DMN nodes (Buckner et al., 2008; Leech and Sharp, 2014), and is implicated in both self-relevant and other-relevant processing (Spreng et al., 2009), and evaluating and processing the mental states of others (Gusnard and Raichle, 2001; Schiller et al., 2009). A previous structural MRI study reported altered PCC gray matter organization in children and adolescents with ASD; this observation was associated with symptom severity (Uddin, 2011) and accelerated thinning in the bilateral PCC between childhood and adulthood (7–39 years of age), and correlated with social deficits (Doyle-Thomas et al., 2013). The connectivity of the PCC has also been reported to show some changes during tasks from the four social fields: emotion perception, empathy, Theory of Mind (ToM), and morality (Li et al., 2014). Consistent with this notion, we also found that patients with ASD_coADHD demonstrated reduced connectivity in the bilateral PCC of the DMN compared to ASD_nonADHD patients. Our results of regression analysis suggest that this intra-iFC measure cannot only capture variability both between and within groups described by the ADI_R scores, but also underlie the level of autistic spectrum traits in ASD patients with or without ADHD co-morbidity. Our present study further suggests that co-morbid ADHD may exacerbate hypoconnectivity within the DMN of ASD patients and lead to an increased severity of social dysfunction, the core symptom of ASD.
Brain networks do not function independently; consequently, investigating the connectivity within one specific network may not be sufficient (Vissers et al., 2012). We identified increased levels of DMN-somatomotor network interaction in the ASD_coADHD group as compared with the ASD_nonADHD group. In addition, individuals with ASD showed increased functional connectivity between primary sensory networks and subcortical networks, and that the strength of such connections was associated with the severity of autistic traits in the ASD group (Cerliani et al., 2015). Our results also revealed that the ASD group exhibited several abnormal interactions between the RSN relative to the TD group, highlighting the significance of inter-network interactions in the pathophysiology of ASD.
Due to the paucity of prior research relating to the co-occurrence of ASD and ADHD, there is little evidence to support the involvement of abnormal DMN-somatomotor network interaction. A previous meta-analysis of 55 fMRI studies revealed dysfunction of the DMN in both children and adults with ADHD, and hyperactivation of the somatomotor networks in children with ADHD (Choi et al., 2012). The DMN-somatomotor overconnectivity we detected between groups in FNC are likely to reflect, at least in part, the characteristics and neurobiological features of the co-occurrence of ASD and ADHD, thus allowing us to distinguish this combined phenotype. We did not detect an association between DMN-somatomotor coupling and ASD trait level. Thus, such connections may reflect the ADHD-related psychopathic trait, and future task–based fMRI studies, specifically probing these motor processes, are required to test this hypothesis.
This study had several limitations. First, the use of multisite data from the ABIDE II dataset improved the statistical power of our results but limited the sensitivity for detecting small changes in the heterogeneous dataset due to differences in important data acquisition variables such as length of scan and scanning parameters. Future research needs to involve comparable sample sizes of Rs-fMRI data from a single site in order to replicate our results. Moreover, our study only took co-morbid diagnoses of ADHD into account, and neglected medication status (e.g. medication naive/not naive), and other diagnoses of co-morbidity (e.g. oppositional defiant disorder [ODD]). The major focus of our study was to identify the biological mechanisms underlying the co-occurrence of ASD and ADHD rather than to provide a new ASD classification.
Conclusion
In summary, our present data show that dysfunction of the DMN is a central feature in the co-occurrence of ASD and ADHD, including both decreased connectivity within the DMN and increased connectivity between the DMN and the somatomotor network. This decreased connectivity within the DMN was negatively related to the degree of autistic traits across the entire sample of individuals with ASD, and the examined individuals with both ASD and ADHD. Our results support the existence of a clinically combined phenotype (ASD + ADHD), in which dysfunction of the DMN has emerged as a key target for focused training, neuromodulation or pharmacotherapeutic approaches.
Supplemental Material
ANP836031_Supplementary_Materials – Supplemental material for Altered social cognition and connectivity of default mode networks in the co-occurrence of autistic spectrum disorder and attention deficit hyperactivity disorder
Supplemental material, ANP836031_Supplementary_Materials for Altered social cognition and connectivity of default mode networks in the co-occurrence of autistic spectrum disorder and attention deficit hyperactivity disorder by Kai Wang, Mingyu Xu, Yiting Ji, Lingli Zhang, Xiujuan Du, Jijun Li, Qiang Luo and Fei Li in Australian & New Zealand Journal of Psychiatry
Supplemental Material
Supplementary_Figure_1_ – Supplemental material for Altered social cognition and connectivity of default mode networks in the co-occurrence of autistic spectrum disorder and attention deficit hyperactivity disorder
Supplemental material, Supplementary_Figure_1_ for Altered social cognition and connectivity of default mode networks in the co-occurrence of autistic spectrum disorder and attention deficit hyperactivity disorder by Kai Wang, Mingyu Xu, Yiting Ji, Lingli Zhang, Xiujuan Du, Jijun Li, Qiang Luo and Fei Li in Australian & New Zealand Journal of Psychiatry
Supplemental Material
Supplementary_Figure_2 – Supplemental material for Altered social cognition and connectivity of default mode networks in the co-occurrence of autistic spectrum disorder and attention deficit hyperactivity disorder
Supplemental material, Supplementary_Figure_2 for Altered social cognition and connectivity of default mode networks in the co-occurrence of autistic spectrum disorder and attention deficit hyperactivity disorder by Kai Wang, Mingyu Xu, Yiting Ji, Lingli Zhang, Xiujuan Du, Jijun Li, Qiang Luo and Fei Li in Australian & New Zealand Journal of Psychiatry
Supplemental Material
Supplementary_Figure_3 – Supplemental material for Altered social cognition and connectivity of default mode networks in the co-occurrence of autistic spectrum disorder and attention deficit hyperactivity disorder
Supplemental material, Supplementary_Figure_3 for Altered social cognition and connectivity of default mode networks in the co-occurrence of autistic spectrum disorder and attention deficit hyperactivity disorder by Kai Wang, Mingyu Xu, Yiting Ji, Lingli Zhang, Xiujuan Du, Jijun Li, Qiang Luo and Fei Li in Australian & New Zealand Journal of Psychiatry
Footnotes
Acknowledgements
The authors would like to thank the numerous contributors at each site (http://fcon_1000.projects.nitrc.org/indi/abide/abide_II) and the NITRC (![]() ) for providing the data sharing platform for the ABIDE II initiative. F.L. and Q.L. designed this study. K.W., Y.T.J. and L.L.Z .performed data preprocessing and analysis. K.W., M.Y.X. and J.J.L. drafted the manuscript. F.L. and Q.L. provided critical revisions of the manuscript. The authors jointly discussed the experimental results throughout the duration of the study. All authors read and approved the final version to be published. K.W. and M.X. contributed equally to this work.
) for providing the data sharing platform for the ABIDE II initiative. F.L. and Q.L. designed this study. K.W., Y.T.J. and L.L.Z .performed data preprocessing and analysis. K.W., M.Y.X. and J.J.L. drafted the manuscript. F.L. and Q.L. provided critical revisions of the manuscript. The authors jointly discussed the experimental results throughout the duration of the study. All authors read and approved the final version to be published. K.W. and M.X. contributed equally to this work.
Declaration of Conflicting Interests
The authors declare that this research was conducted in the absence of any commercial or financial relationships that could be construed as a potential conflict of interest.
Funding
The work was financially supported by funding from Shanghai Municipal Commission of Health and Family Planning (No.s 2017ZZ02026, 2017EKHWYX-02 and GDEK201709), Shanghai Shenkang Hospital Development Center (No.16CR2025B), Shanghai Municipal Education Commission (No.20152234), National Natural Science Foundation of China (No.s 81571031, 81761128035, 81781220701 and 81873909) and Shanghai Committee of Science and Technology (No.s 17XD1403200, 18DZ2313505, 14DJ1400204, and 17ZR1444400), Natural Science Foundation of Shanghai (No.17ZR1444400, National Key Research and Development Program of China (No. 2018YFC0910500), Shanghai Municipal Science and Technology Major Project (No. 2018SHZDZX01).
Supplemental material
Supplemental material for this article is available online.
References
Supplementary Material
Please find the following supplemental material available below.
For Open Access articles published under a Creative Commons License, all supplemental material carries the same license as the article it is associated with.
For non-Open Access articles published, all supplemental material carries a non-exclusive license, and permission requests for re-use of supplemental material or any part of supplemental material shall be sent directly to the copyright owner as specified in the copyright notice associated with the article.