
Abstract
Objective:
The personality characteristics and symptoms observed in schizophrenia are postulated to lie on a continuum, with non-clinical manifestations referred to as schizotypy. High schizotypy behaviours are argued to correspond with the three main clusters of symptoms in schizophrenia: positive, negative and cognitive/disorganised symptoms, yet there is limited empirical evidence to support this. This study aimed to investigate whether schizotypy dimensions significantly correlate with their respective schizophrenia symptomatology in the largest sample to date.
Methods:
A total of 361 adults (103 patients with schizophrenia/schizoaffective disorder and 258 healthy controls) were assessed for schizotypy using the Oxford-Liverpool Inventory of Feelings and Experiences. The MATRICS Consensus Cognitive Battery supplemented by the Stroop task and Wisconsin Card Sorting Test was administered to all participants to obtain objective measurements of cognition. Schizophrenia symptomatology was assessed using the Positive and Negative Syndrome Scale in patients only.
Results:
The results demonstrated significant correlations between the Oxford-Liverpool Inventory of Feelings and Experiences positive and negative subscales and their respective Positive and Negative Syndrome Scale subscales only, indicating that positive and negative schizotypy dimensions across patients and controls accurately reflect the respective schizophrenia symptomatology observed in patients. Cognitive performance did not correlate with cognitive/disorganised symptom dimensions of the Oxford-Liverpool Inventory of Feelings and Experiences or the Positive and Negative Syndrome Scale, indicating that cognitive impairment is an independent symptom dimension that requires objective cognitive testing.
Conclusion:
Collectively, the findings provide empirical evidence for the continuum theory and support the use of schizotypy as a model for investigating schizophrenia.
Keywords
Introduction
The clinical and diagnostic perspective of schizophrenia views the psychosis phenotype as categorical and this is reflected in the current systems of classification such as Diagnostic and Statistical Manual of Mental Disorders (4th ed.; DSM-IV) and International Classification of Diseases (10th ed.; ICD-10; Linscott and Van Os, 2010). However, research has shown that the distribution of the psychosis phenotype is continuous in a clinical population and this challenges the dichotomous view of multifactorial disorders such as schizophrenia (Van Os et al., 2009). Furthermore, it is believed that symptoms can be expressed at lower levels than clinical manifestation (Claridge and Beech, 1995). These subclinical psychosis-like symptoms or personality characteristics are collectively referred to as psychosis-proneness or schizotypy (Van Os et al., 2000). Research has demonstrated that these symptoms are dimensional at the population level and lie on a continuum with schizophrenia spectrum disorders (Nelson et al., 2013). High levels of schizotypy are associated with behavioural, genetic and brain function patterns similar to those reported in schizophrenia, albeit to a milder degree (Ettinger et al., 2014). Schizotypy is also associated with an increased risk of developing psychosis and has been used to detect psychosis-prone subjects in the community (Debbané et al., 2014). Collectively, these findings demonstrate the phenomenological and aetiological continuity between clinical and subclinical phenotypes and the validity of schizotypy as a phenotypic indicator for the liability of psychosis spectrum disorders. In addition, this continuum theory recognises schizotypy as a suitable model for investigating the etiological factors of schizophrenia spectrum disorders, free from confounding factors such as medication and social isolation that could impact symptom presentation and brain function (Jones et al., 2000).
There are several conceptualisations of schizotypy; the quasi-dimensional model of schizotypy (i.e. with or without schizophrenia genes) proposes that schizotypy indicates a genetic predisposition to schizophrenia and applies only to a specific subgroup of the population (Rado, 1953). This is derived from the model proposed by Meehl (1962) that schizotypy is categorical or ‘taxonic’, with individuals either possessing genetic vulnerability in the form of a single gene (i.e. ‘schizogene’) for schizophrenia or not. A more recent schizotypy model is the fully dimensional approach, which proposes that schizotypy is a personality quality present in the general population, extending the quasi-dimensional view to include the healthy personality. There is conflicting research and several reviews exploring whether schizotypy is more consistent with a categorical or dimensional perspective at the population level. In their systematic and theoretical review of categorical versus continuum models in psychosis, Linscott and Van Os (2010) provide evidence that is consistent with continuum models of schizophrenia signs and symptoms, though ultimately support the categorical theory of schizotypy and suggest that discontinuous subpopulations are underlying the continuum. Other reviews of taxometric research have indicated that schizotypy corresponds to a continuous latent structure of schizophrenia, with psychosis symptoms lying on a continuum with normality (Haslam et al., 2012). While this remains a debatable topic, the fully dimensional approach is consistent with the theory of continuity between subclinical and clinical phenotypes and a review of current research suggests that it is the more appropriate and superior model of schizotypy (Nelson et al., 2013).
Research has consistently demonstrated that schizotypy is a multidimensional construct, although the number and content of each dimension remains less clear (Daneluzzo et al., 2005). Factorial structure analyses have shown that schizotypy traits have a minimum of three dimensions (Fonseca-Pedrero et al., 2018). These three main dimensions are defined as positive, negative and disorganised and are parallel to the model of schizophrenia symptoms, reflecting the key symptom clusters. Schizophrenia symptoms can be clustered into three main groups: positive symptoms, which include delusions, hallucinations and disordered speech; negative symptoms, which relate to reduction or loss of normal activity and include apathy, anhedonia and a lack of motivation or desire; and cognitive/disorganised symptoms, which encapsulate disorganisation, concrete thinking and neurocognitive deficits. Neurocognitive deficits in areas such as memory and executive function are widely reported in patients with schizophrenia (Mesholam-Gately et al., 2009), although there is still much debate in the literature relating to the extent that neurocognition is related to positive, negative and disorganised symptomatology (De Gracia Dominguez et al., 2009).
Schizotypy research has predominantly relied on self-report measures such as the Schizotypal Personality Questionnaire (SPQ; Raine, 1991), which has been one of the most replicated models. The SPQ was developed on the basis of the Diagnostic and Statistical Manual of Mental Disorders (3rd ed., rev.; DSM-III-R) schizotypal personality disorder diagnostic criteria and comprises Cognitive-Perceptual (positive), Interpersonal (negative) and Disorganised dimensions. Another schizotypy measure, the Oxford-Liverpool Inventory of Feelings and Experiences (O-LIFE) questionnaire (Mason and Claridge, 2006; Mason et al., 1995), measures similar dimensions, namely, Unusual Experiences (positive), Introvertive Anhedonia (negative) and Cognitive Disorganisation. A fourth factor, Impulsive Nonconformity, contains items relating to impulsive, antisocial and eccentric behaviour. To investigate the fully dimensional model of schizotypy, measures such as the O-LIFE have been more consistently used, allowing investigation of schizotypy traits at a behavioural level rather than measuring based on distinct schizotypal personality disorder criteria.
While the number of studies using schizotypy as a model for schizophrenia have increased exponentially in the last few years (Gurvich and Rossell, 2015), there is still a lack of empirical evidence for the schizotypy/schizophrenia continuum. There have been a number of longitudinal studies investigating clinical correlates of positive and negative schizotypy in large non-clinical samples. These studies have typically reported that schizotypy is associated with prodromal and schizophrenia spectrum symptoms and that positive and negative schizotypy predicted positive and negative schizophrenia symptoms, respectively (Barrantes-Vidal et al., 2013; Kwapil et al., 2013). However, limited cross-sectional studies have included a patient population to investigate clinical correlates across the broader schizophrenia continuum. Brosey and Woodward (2015) found that schizotypal personality traits correlated with general schizophrenia symptoms in a small sample of 59 healthy controls and 68 patients. In addition, the Physical and Social Anhedonia Scales significantly correlated with negative symptoms, and the Physical Anhedonia Scale and SPQ significantly correlated with cognitive performance, as measured by the Screen for Cognitive Impairment in Psychiatry. Another study conducted by Cochrane et al. (2010) specifically investigated whether schizotypy factors provide non-clinical analogues of schizophrenia symptoms in a sample of 20 patients and 38 controls using the Scale for the Assessment of Positive Symptoms (SAPS) and Negative Symptoms (SANS). While positive symptoms significantly correlated with positive schizotypy, negative and disorganised symptoms did not correlate with their respective schizotypy factors. From these studies, it is evident that there is inadequate empirical evidence for the continuum.
According to Van Os et al. (2009), there are several criteria that constitute evidence for this continuum: distributional, epidemiological and psychopathological validity checks. Distributional validity requires the demonstration of a continuous distribution as schizophrenia is a multifactorial disease that cannot be entirely dichotomous. Epidemiological validity requires evidence to be collected according to the distribution of the construct of interest. In this particular field, the majority of studies conduct research in either clinical or non-clinical populations rather than across the entire schizotypy/schizophrenia continuum (Cochrane et al., 2010; Fanous et al., 2001) and are therefore not in line with the fully dimensional model of schizotypy. Finally, psychopathological validity requires that subclinical symptoms are strongly associated with schizophrenia symptomatology to support the continuity between schizotypy and schizophrenia: to date, there has been no empirical support with this regard. Consequently, the relationship between schizotypy and schizophrenia symptoms remains unclear.
The current study aimed to provide empirical evidence for the schizotypy/schizophrenia continuum by exploring the manifestation of schizotypy symptoms from non-clinical individuals to patients with schizophrenia and using the aforementioned validity checks (Van Os et al., 2009). Furthermore, the study aimed to directly compare these schizotypy dimensions, as measured by the O-LIFE, across patients and controls with the respective schizophrenia Positive and Negative Syndrome Scale (PANSS) symptom factors observed in patients. It was hypothesised that (1) the distribution of schizotypy across the continuum would be continuous and (2) significant correlations would be observed between positive PANSS score and positive schizotypy, as well as between the negative PANSS score and negative schizotypy, demonstrating psychopathological validity. While the focus of the study was on the associations of the O-LIFE and PANSS in the patient sample, controls were still included in analyses to investigate distributional and epidemiological validity, as well as to address a secondary objective; to investigate whether objectively measured neurocognitive symptoms related to PANSS and O-LIFE symptom clusters, in particular the cognitive/disorganisation subscales. In this regard, it was hypothesised that the neurocognitive measures would be associated with both PANSS and O-LIFE cognitive/disorganisation subscales.
Material and methods
Participants
A total of 361 adults (103 patients with a primary DSM-IV diagnosis of schizophrenia or schizoaffective disorder and 258 healthy controls) between 18 and 64 years of age met inclusion criteria. Participants were all fluent English-language speakers. Participants were excluded from the study if they had a neurological illness, previous serious head injury or current substance abuse or dependence problem. Healthy controls were excluded if they had a first-degree biological relative with schizophrenia or schizoaffective disorder and/or if they met diagnostic criteria for any DSM-IV Axis 1 disorder, as per the Mini-International Neuropsychiatric Interview (MINI) screening module criteria. In addition, the presence and severity of depressive symptoms was assessed for all participants using the Montgomery Äsberg Depression Rating Scale (MADRS; Montgomery and Asberg, 1979).
All patients were self-referred outpatients with diagnosis confirmed with the MINI. The mean duration of illness since diagnosis in the patient cohort was 18.10 years (standard deviation [SD] = 10.72 years). Patients were relatively stable, community-based patients who were not acutely unwell and were on stable antipsychotic medication. Medication details were not clearly reported in 41% of patients. Of those who reported medication details, the following breakdown was obtained (for main antipsychotic): clozapine – 17%; quetiapine – 10%; olanzapine – 7%; aripiprazole – 6%; risperidone – 6%; paliperidone – 3%; zuclopenthixol – 3%; amisulpride – 2%; haloperidol – 1%; asenapine – 1%; flupentixol – 1%; lurasidone – 1%; and ziprasidone – 1%. In total, 17.6% of all patients were taking more than one antipsychotic.
The study was performed in accordance with the Declaration of Helsinki (World Medical Association, 2013) and received ethical approval from the Alfred Hospital Human Research Ethics Committee, Melbourne, Australia. Each participant provided written informed consent prior to assessment.
Clinical symptom assessment
All patients were assessed for positive, negative and cognitive symptoms using the PANSS (Kay et al., 1987). PANSS scorings were completed by different trained raters based at the Monash Alfred Psychiatry research centre. All raters completed internal standardised PANSS training as well as ongoing inter-rater reliability PANSS training sessions. The PANSS items were originally grouped into three factors: positive symptoms, negative symptoms and general psychopathology (Kay et al., 1987), with a follow-up study demonstrating the scale’s reliability, criterion-related validity and construct validity (Kay et al., 1988). However, more recent factor analyses and validity studies have indicated that PANSS data is better represented by five factors: positive, negative, disorganised/concrete, excited and depressed (Lancon et al., 2000). Therefore, the current study conducted analyses predominantly using a five-factor model.
Due to the lack of fit and consensus of published five-factor models (Van der Gaag et al., 2006), the current study used a five-factor PANSS model derived from 29 published factor analyses (Supplementary Table 1; Wallwork et al., 2012). For comparison with the analogous O-LIFE factors, only the positive, negative and disorganisation/concrete factors from the five-factor PANSS model were analysed. The three-factor model derived positive and negative factors were included in the initial analyses to validate the literature-derived five-factor model.
Schizotypy assessment
All participants were assessed for schizotypy factors using the O-LIFE, a 104-item self-report questionnaire developed to measure psychosis-proneness in non-clinical individuals (Mason et al., 1995). The O-LIFE measures four dimensions of schizotypy of relevance for this study: (1) the Unusual Experiences scale reflects positive symptomatology and contains 30 items related to hallucinations and magical thinking (e.g. ‘Can some people make you aware of them just by thinking about you?’), (2) the Introvertive Anhedonia scale reflects negative symptomatology and contains 27 items relating to lack of enjoyment from sources of pleasure (e.g. ‘Do people who try to get to know you better usually give up after a while?’), (3) the Cognitive Disorganisation scale reflects cognitive deficits and contains 24 items relating to social anxiety, poor attention and poor decision making (e.g. ‘Are you easily distracted when you read or talk to someone?’) and (4) the Impulsive Nonconformity factor contains 23 items relating to impulsive, antisocial and eccentric behaviour, suggesting a lack of self-control (e.g. ‘Do you often have an urge to hit someone?’). Previous studies have observed high internal consistency and good test–retest reliability across all four scales of the O-LIFE (Grant et al., 2013; Mason et al., 1995).
Cognitive assessment
Cognitive performance was assessed using the Measurement and Treatment Research to Improve Cognition in Schizophrenia Consensus Cognitive Battery (MATRICS Consensus Cognitive Battery [MCCB]; Nuechterlein et al., 2008). The Stroop task (Delis et al., 2001) and Wisconsin Card Sorting Test (WCST; Grant and Berg, 1948) were also included to supplement executive function assessment (see Supplementary Table 2 for cognitive tasks included and variables analysed). Premorbid intelligence was assessed using the Wechsler Test of Adult Reading (WTAR; Wechsler, 1997). The MCCB, Stroop task and WTAR was administered to all participants. Missing data (see Table 1) were due to fatigue or time constraints and not due to failure to understand or complete the task. The WCST was added to the cognitive battery at a later date and after a subset of participants had already finished testing, and therefore, this task was administered only to 37.7% of participants (Table 1). Cases were excluded pairwise in all analyses to include all available data. Given the focus of this study on neurocognition, the Mayer Salovey Caruso Emotional Intelligence Test measure of social cognition was excluded from analyses.
statistics for demographics, schizotypy factors and cognitive variables.
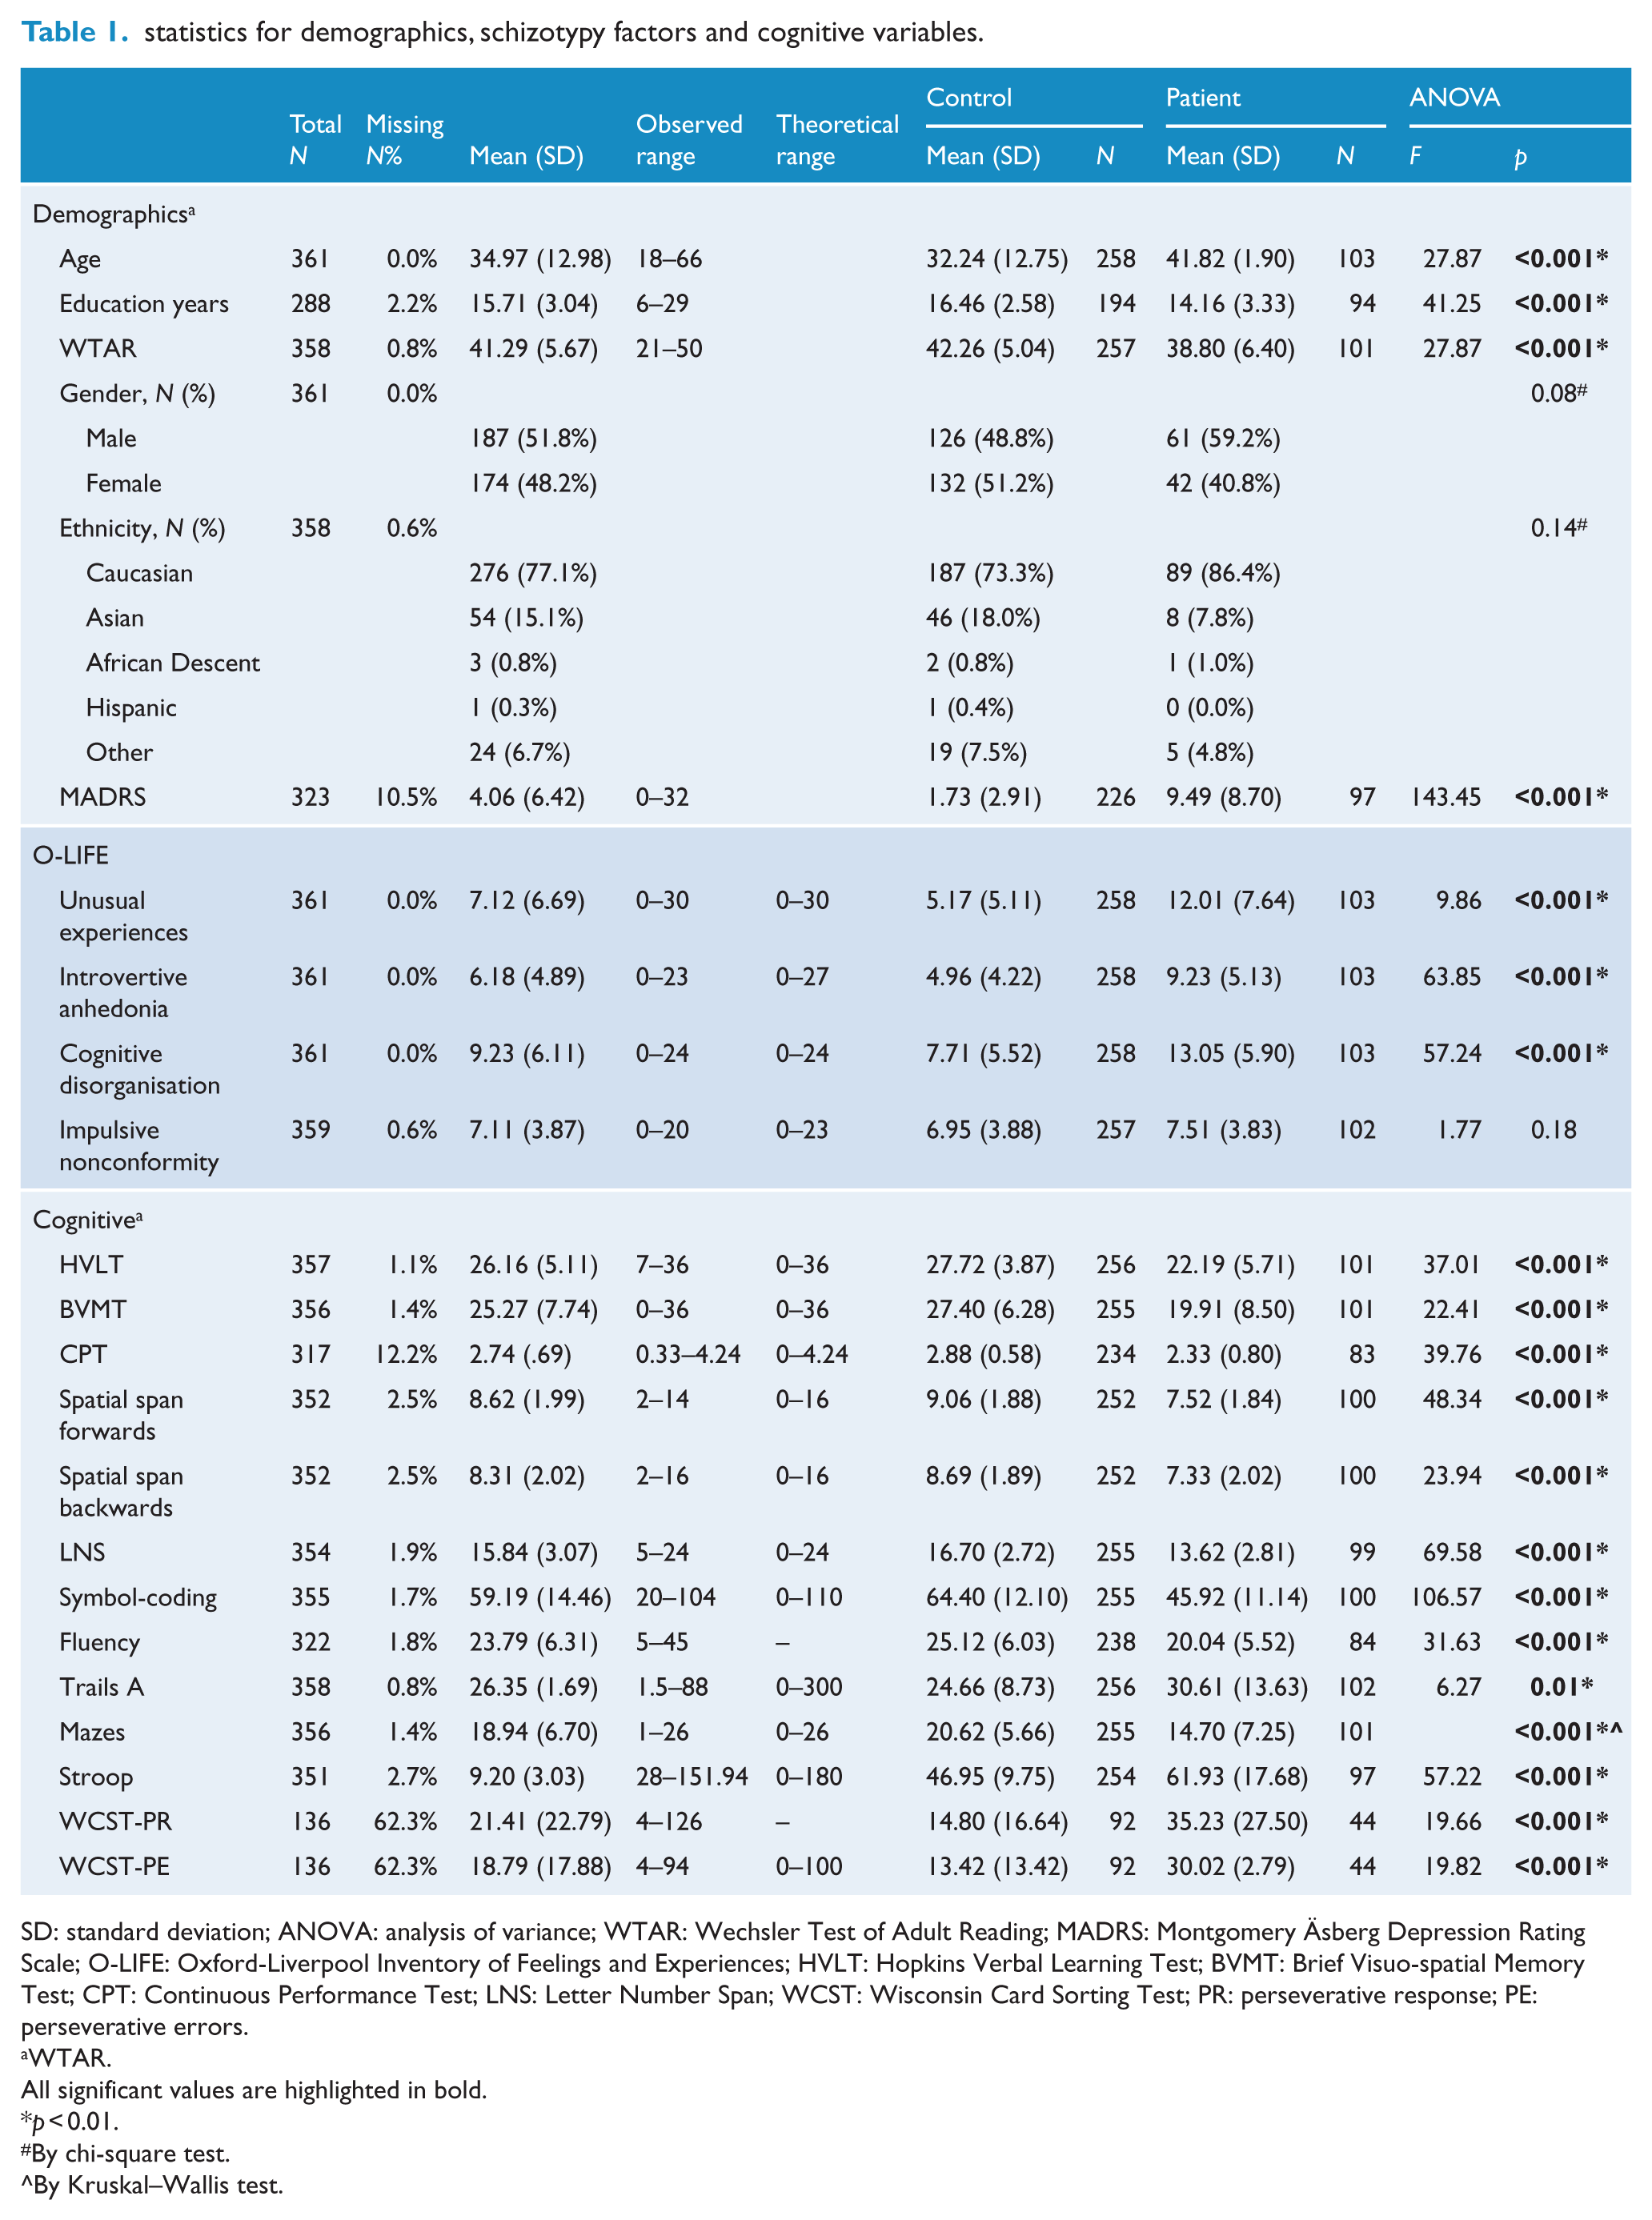
SD: standard deviation; ANOVA: analysis of variance; WTAR: Wechsler Test of Adult Reading; MADRS: Montgomery Äsberg Depression Rating Scale; O-LIFE: Oxford-Liverpool Inventory of Feelings and Experiences; HVLT: Hopkins Verbal Learning Test; BVMT: Brief Visuo-spatial Memory Test; CPT: Continuous Performance Test; LNS: Letter Number Span; WCST: Wisconsin Card Sorting Test; PR: perseverative response; PE: perseverative errors.
WTAR.
All significant values are highlighted in bold.
p < 0.01.
By chi-square test.
By Kruskal–Wallis test.
Statistical analyses
Data analyses were performed using SPSS (version 24). Cronbach’s coefficient (α) was used to determine scale reliability and internal consistency for both PANSS and O-LIFE subscales. High internal consistency was observed within all O-LIFE subscales (Supplementary Table 3), consistent with Cronbach’s coefficients reported in previous literature (Grant et al., 2013; Mason et al., 1995) Acceptable consistency was observed for both positive and negative PANSS subscales, although poor internal consistency for the disorganisation/concrete PANSS subscale was identified (Supplementary Table 3). Therefore, analyses were conducted using the three individual items that make up this factor (Supplementary Table 1) rather than the overall factor score. These items were (1) conceptual disorganisation, (2) difficulty in abstract thinking and (3) poor attention.
Study variables were assessed for normality and those that were not normally distributed were transformed (Supplementary Table 4). Individual disorganisation/concrete PANSS items and the MCCB Mazes raw score were not normally distributed after transformation; therefore, non-parametric tests were conducted on the non-transformed data when PANSS individual items or the Mazes raw score were analysed. No extreme outliers were identified for any variables.
First, to address distributional validity (Van Os et al., 2009), dot plots were generated for all four O-LIFE factor scores. Second, Pearson’s and Spearman’s rho correlations were conducted to assess the strength of the relationship between O-LIFE factors and PANSS subscale scores and to demonstrate psychopathological validity. Bonferroni corrections were made to account for multiple comparisons. Third, Pearson’s correlations were then conducted between the O-LIFE, PANSS and cognitive variables to determine whether neurocognitive symptoms relate to PANSS and O-LIFE factors. A conservative alpha level of 0.001 was adopted to account for the multiple correlations. All correlations analysing PANSS factors were conducted in the patient population only. All other correlations were conducted across the continuum, conforming to the epidemiological validity construct (Van Os et al., 2009).
Results
Demographics
The demographic characteristics of the patient and healthy control groups are described separately in Table 1. Missing data were due to fatigue or time constraints. Even though analyses indicated a significant difference between patients and controls on all demographic variables except gender, this study used a continuum approach and completed analyses across the whole cohort (unless indicated). Age and WTAR significantly correlated with the dependent variables. While age was used as a covariate in all analyses, WTAR was not controlled for as this would potentially remove too much variability in the measures of cognition (Dennis et al., 2009).
Comparison of O-LIFE subscale scores across entire study population
Analysis of variance (ANOVA) analyses revealed that all three key schizotypy subscale scores were significantly higher in the patient group compared to the controls (Table 1). In regard to the spread of the Unusual Experiences, Introvertive Anhedonia and Cognitive Disorganisation schizotypy subscale factors across the patients and controls, healthy controls were clustered towards the lower end of the range and more patients were at the upper end, with some degree of overlap (Figure 1). However, in regard to Impulsive Nonconformity, both the patients and control groups were both evenly spread from minimum to maximum schizotypy scores (Figure 1) and scores did not significantly differ between patients and controls.
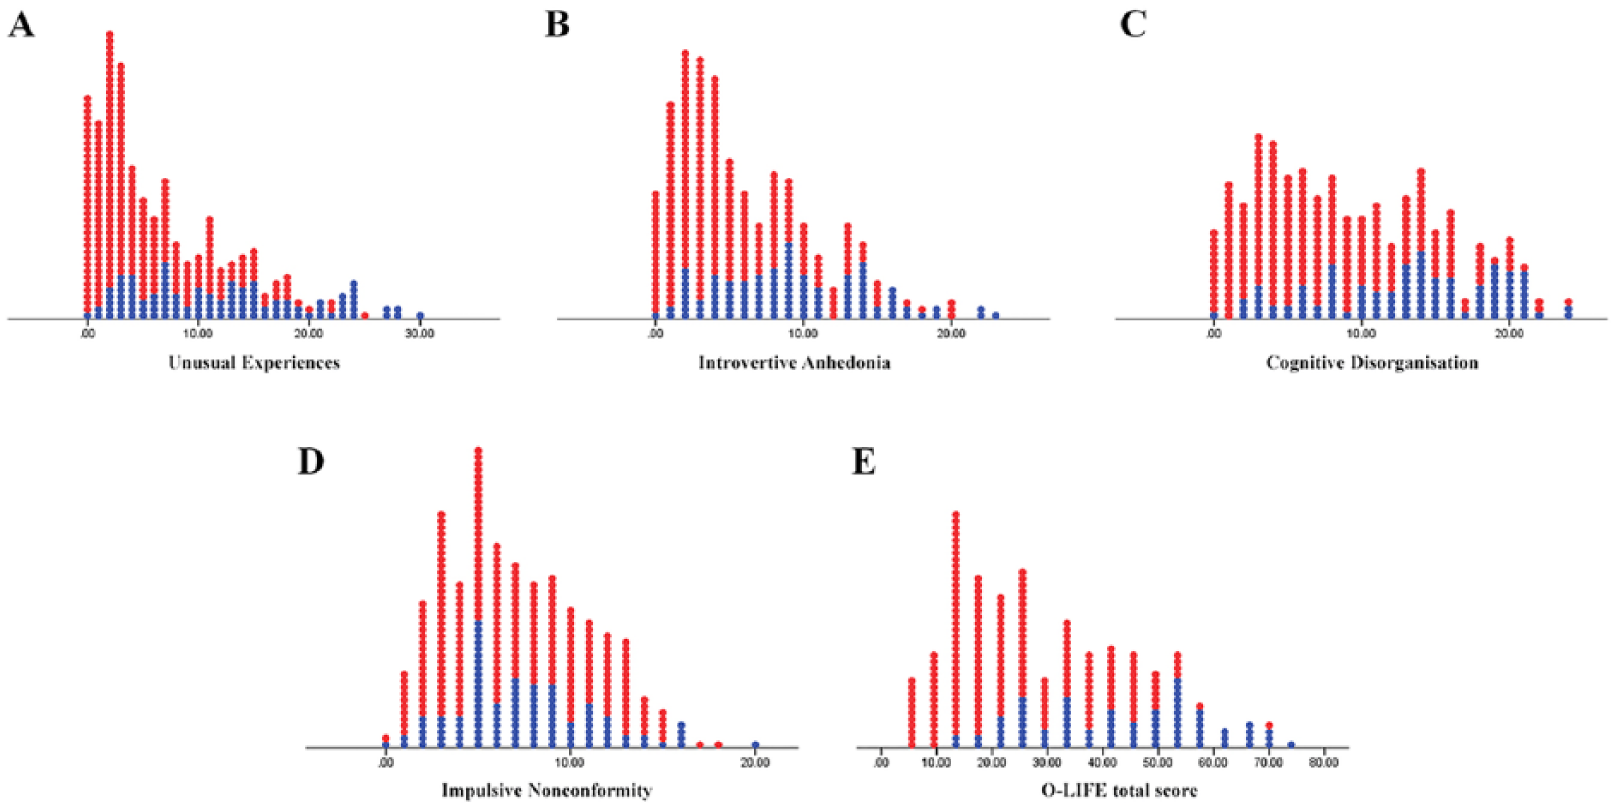
Dot plots depicting each (A) unusual experiences, (B) introvertive anhedonia, (C) cognitive disorganisation, (D) impulsive nonconformity and (E) total O-LIFE score across the entire sample. Patients are labelled in blue; controls are labelled in red.
Relationship between O-LIFE and PANSS in patient group only
The Unusual Experiences factor score was positively and significantly correlated with the overall positive PANSS score (medium effect size), but not the negative PANSS score or individual disorganisation/concrete items (Table 2). A significant correlation was also identified between the Introvertive Anhedonia subscale and the overall negative PANSS score (medium effect size), but not with the positive PANSS score or individual disorganisation/concrete items (Table 2).
Correlation coefficients for schizotypy factors and PANSS factors derived from the three- and five-factor models in patients only.
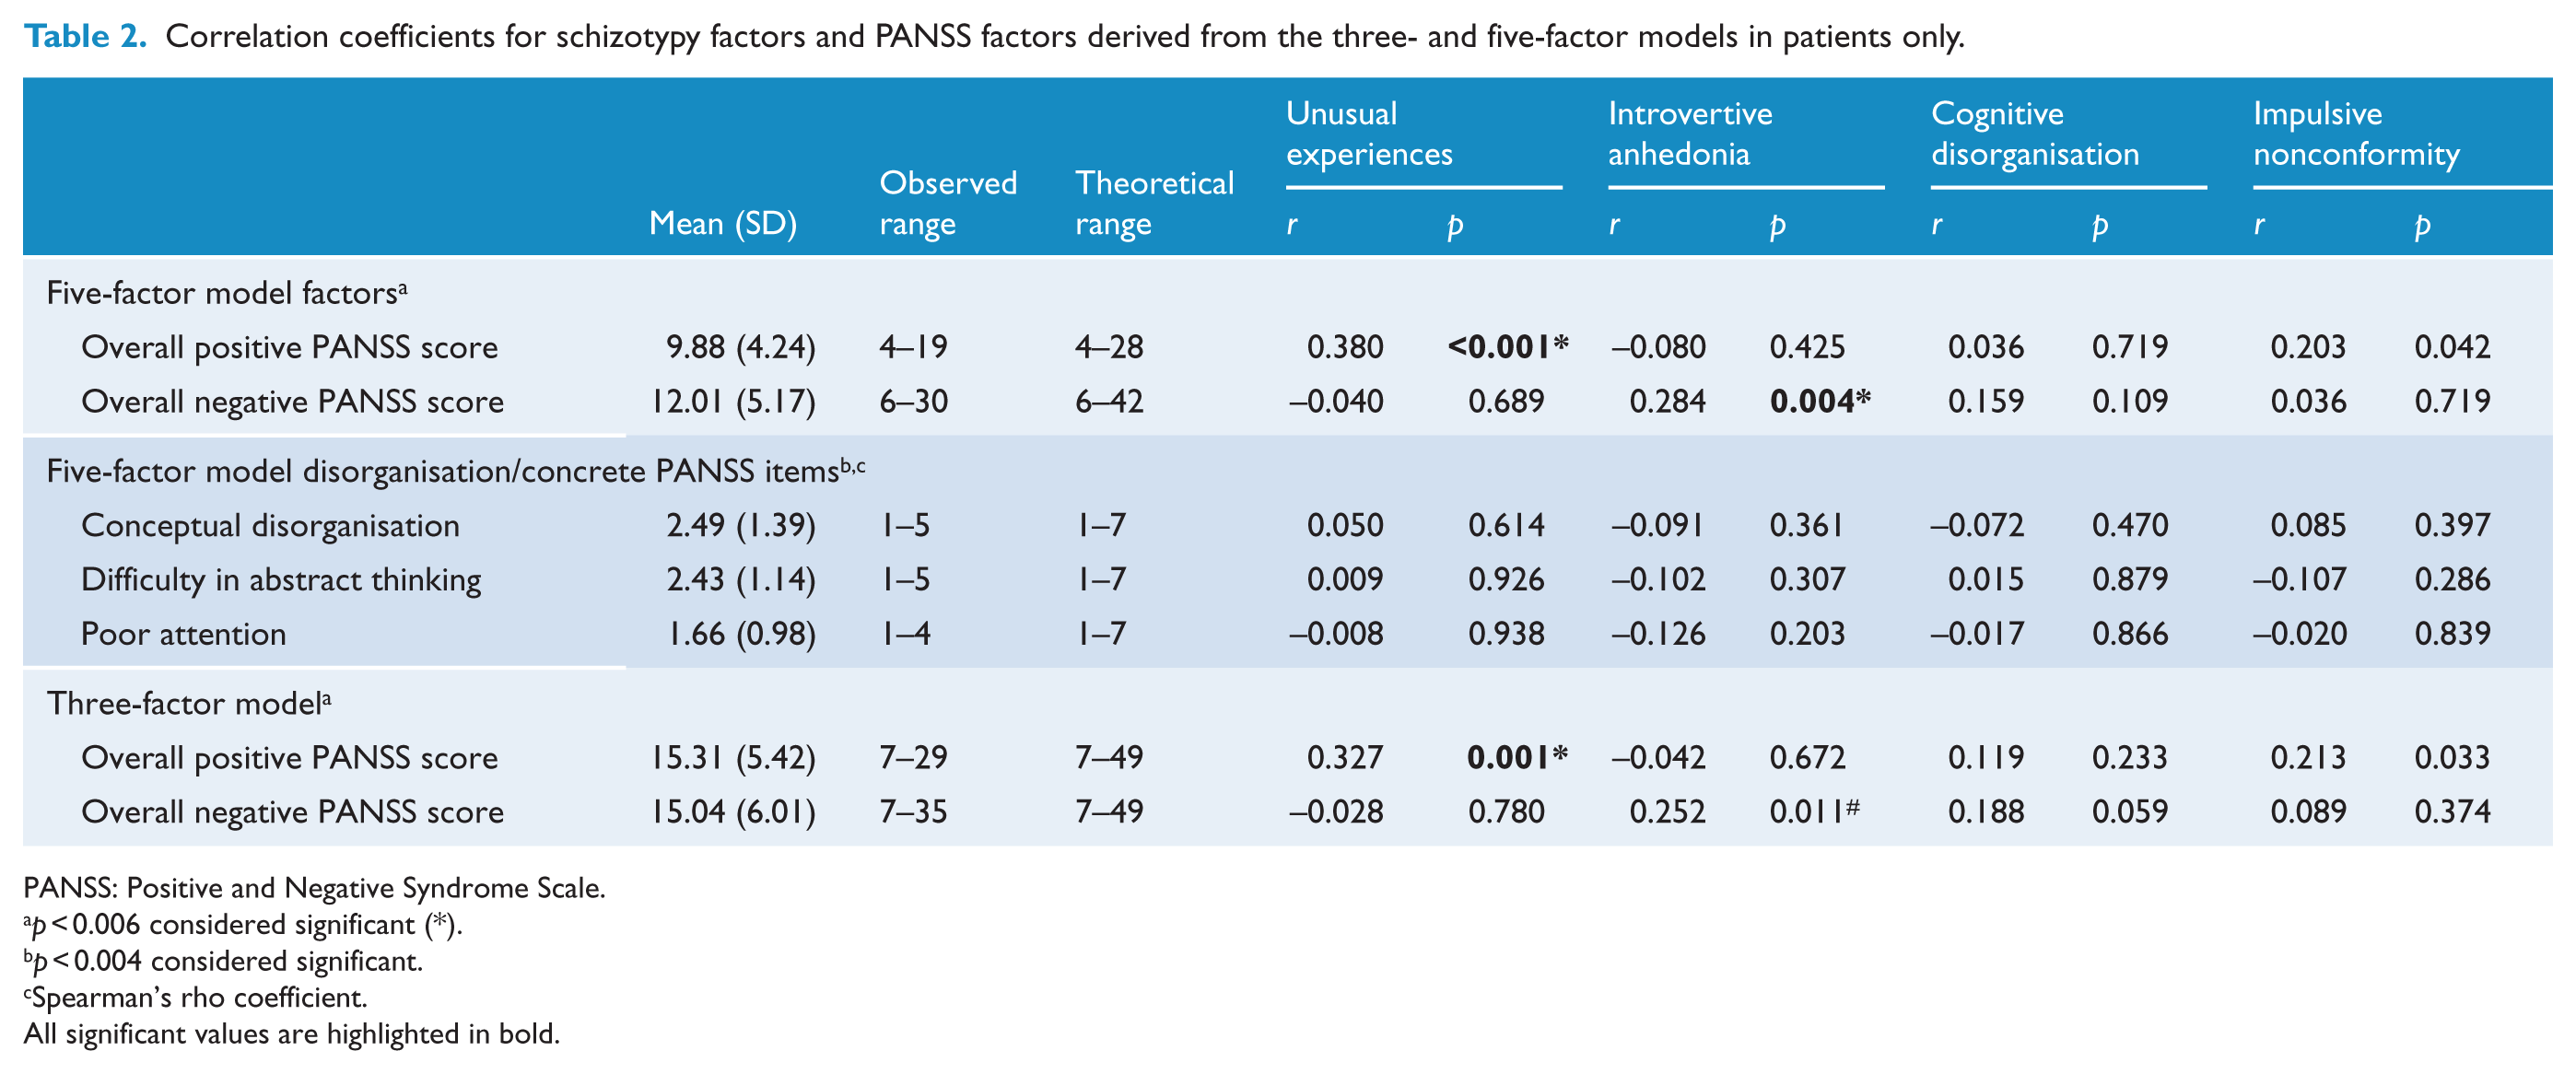
PANSS: Positive and Negative Syndrome Scale.
p < 0.006 considered significant (*).
p < 0.004 considered significant.
Spearman’s rho coefficient.
All significant values are highlighted in bold.
Correlations between O-LIFE subscale factor scores and positive and negative PANSS scores calculated from the three-factor model obtained similar results (Table 2), validating the literature-derived five-factor model. Hence, subsequent analyses were conducted using the five-factor model as the three-factor model does not have a clinical analogue of the Cognitive Disorganisation O-LIFE factor.
There were no significant correlations found between the Cognitive Disorganisation O-LIFE factor and any of the PANSS scores or individual disorganisation/concrete items (Table 2).
Relationship between PANSS, O-LIFE and cognitive performance
There were no significant correlations between the overall positive and negative PANSS factor scores and cognitive tasks in patients. Similarly, there were no significant correlations between individual disorganisation/concrete PANSS items and cognitive tasks. Looking at the O-LIFE factors across all participants, there were significant correlations between the Unusual Experiences factor and Hopkins Verbal Learning Test (HVLT), symbol-coding and Stroop performance (small effect sizes), between the Introvertive Anhedonia factor and HVLT, verbal fluency, Mazes and Stroop performance (small effect sizes) and between the Cognitive Disorganisation factor and Stroop performance (Table 3; small effect size).
Correlation coefficients for PANSS, O-LIFE and cognitive tasks.
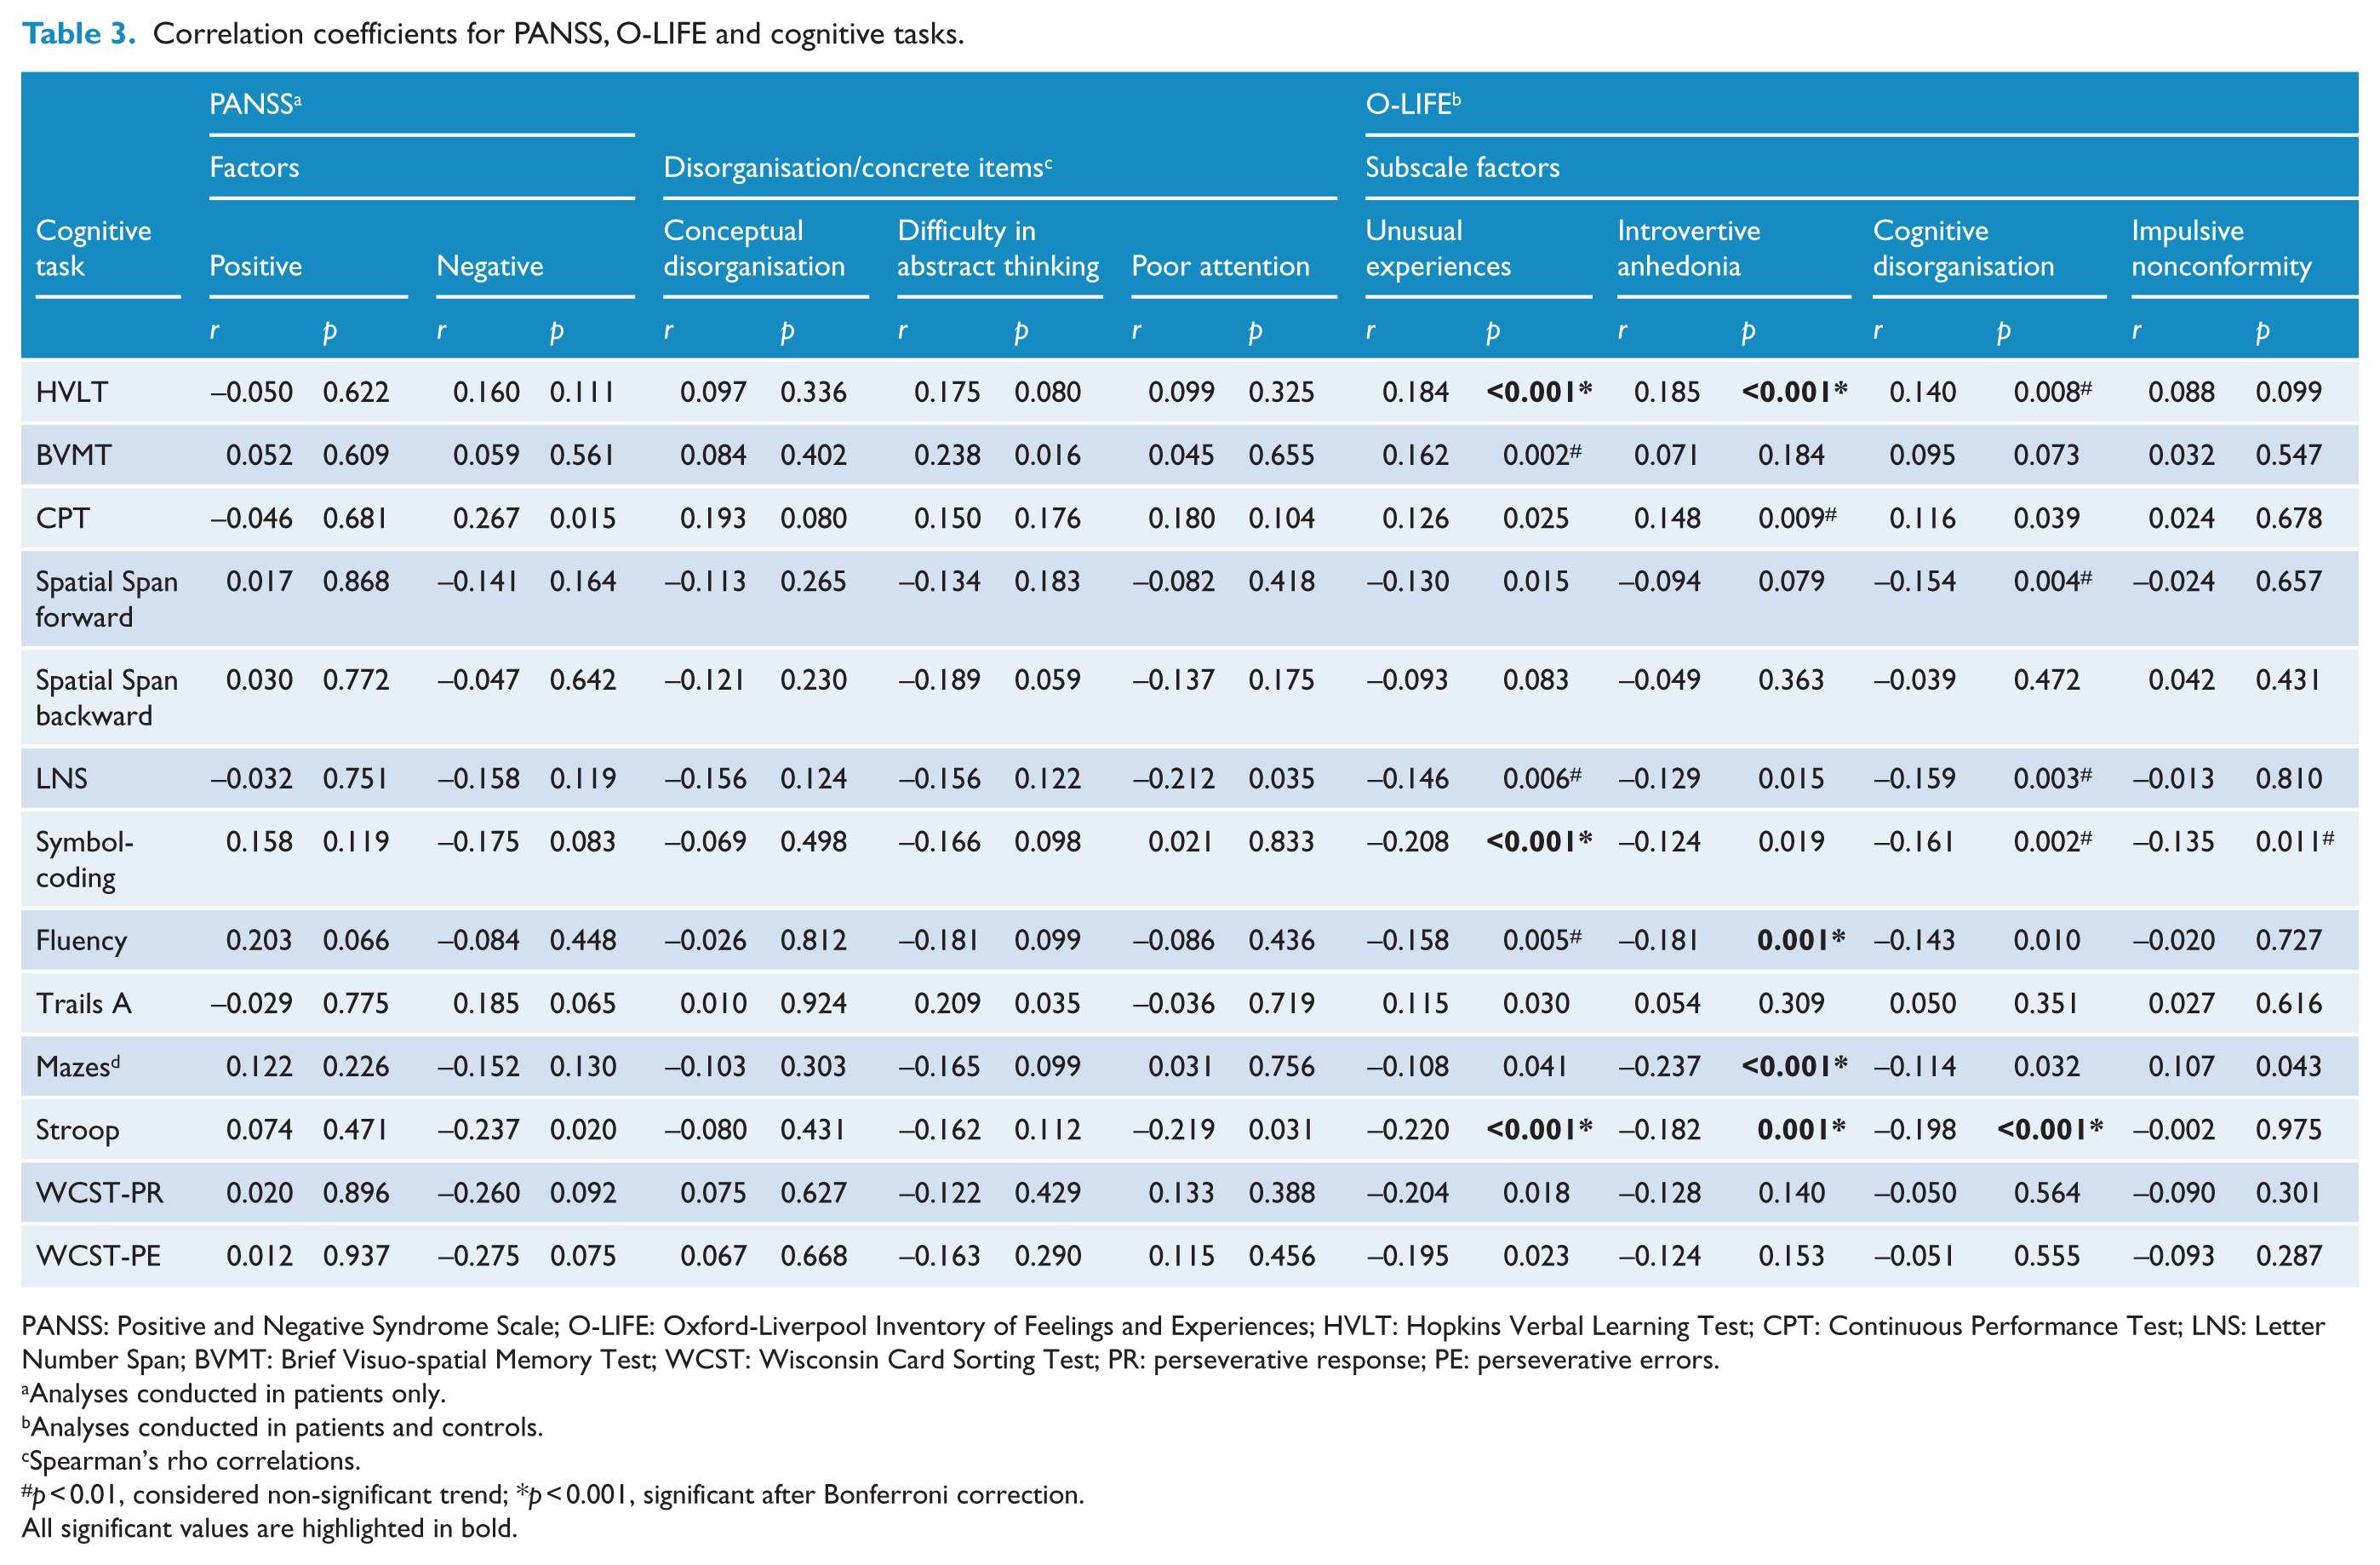
PANSS: Positive and Negative Syndrome Scale; O-LIFE: Oxford-Liverpool Inventory of Feelings and Experiences; HVLT: Hopkins Verbal Learning Test; CPT: Continuous Performance Test; LNS: Letter Number Span; BVMT: Brief Visuo-spatial Memory Test; WCST: Wisconsin Card Sorting Test; PR: perseverative response; PE: perseverative errors.
Analyses conducted in patients only.
Analyses conducted in patients and controls.
Spearman’s rho correlations.
p < 0.01, considered non-significant trend; *p < 0.001, significant after Bonferroni correction.
All significant values are highlighted in bold.
Discussion
Support for the schizotypy/schizophrenia continuum
This study provides empirical evidence for the fully dimensional theory of the schizotypy/schizophrenia continuum in relation to positive and negative symptoms. It also addresses the distributional, epidemiological and psychopathological validity benchmarks needed as evidence for a psychosis continuum (Van Os et al., 2009).
First, the distribution of schizotypy scores reflected a continuous phenomenon (Figure 1). Second, the study addresses the epidemiological validity construct as all correlations were conducted across the continuum. Third, in regard to psychopathological validity, this is the first cross-sectional study to have demonstrated that the positive and negative subclinical symptoms significantly correlate with the respective schizophrenia symptom scores they are assumed to reflect. The Unusual Experiences factor significantly correlated with the overall positive PANSS score (medium effect size), but not with the other PANSS subscales, consistent with the study by Cochrane et al. (2010) that found a significant relationship between positive schizotypy (scales they used) and positive symptoms. Similarly, the Introvertive Anhedonia factor significantly correlated with the overall negative PANSS score (medium effect size), but not with the other PANSS subscales. This is consistent with Brosey and Woodward (2015) who found a significant correlation between the Physical and Social Anhedonia Scales and negative PANSS symptoms. In contrast, the study conducted by Cochrane et al. (2010) did not find a significant relationship between Introvertive Anhedonia (as measured by the O-LIFE) and negative SANS symptoms. It is possible that the Cochrane et al. (2010) study was underpowered to detect effects, given their small sample size of 58 individuals compared to the 361 included in the current study. Consistent with previous research (Fanous et al., 2001; Klingberg et al., 2006), the current findings also provide evidence that positive and negative schizotypy represent discrete symptom dimensions.
Disorganisation and cognitive impairment as independent dimensions
The individual disorganisation/concrete PANSS items did not correlate significantly with any objective neurocognitive tasks. The significant variability across studies in the composition of the disorganisation/concrete PANSS factor (Wallwork et al., 2012) complicates a comparison of current findings with existing literature. While meta-analyses have shown a moderate relationship between clinical disorganisation and neurocognition (De Gracia Dominguez et al., 2009; Ventura et al., 2010), some literature (Klingberg et al., 2006), including the current study, support the position that disorganisation and cognitive impairment may represent different symptom dimensions. As the individual disorganisation/concrete PANSS items did not correlate with the Cognitive Disorganisation O-LIFE factor, the results also suggest that both scales are capturing different aspects of disorganisation. In addition, the Cognitive Disorganisation O-LIFE factor largely measures social anxiety and neuroticism, not specifically cognitive disorganisation, which is another explanation for the lack of association.
The finding that the majority of correlations between Cognitive Disorganisation and cognitive performance were not significant contradicts previous studies that demonstrate an association between poorer cognitive performance and higher Cognitive Disorganisation schizotypy scores (Louise et al., 2015; Rawlings and Goldberg, 2001). However, the current study, conducted with a large sample size and assessing multiple cognitive domains, provides consistent evidence that self-report (O-LIFE) or clinician rated (PANSS) disorganisation/concrete items do not reflect objective neurocognitive performance. This is consistent with previous research in non-clinical populations conducted using the SPQ and the Structure Interview for Schizotypy with assessing cognition with a battery of objective tasks (Fanous et al., 2001; Klingberg et al., 2006).
Cognition as a core independent symptom of schizophrenia
No significant correlations were found between any of the cognitive tasks and overall positive or negative PANSS scores, suggesting that cognitive deficits occur independently of other schizophrenia symptoms. This is consistent with previous studies that have failed to find a relationship between positive symptoms and cognitive deficits (De Gracia Dominguez et al., 2009; Ventura et al., 2010). In contrast, the relationship between negative symptoms and neurocognition appears to be more complex. Reflecting this, some studies have reported positive associations (De Gracia Dominguez et al., 2009), while other studies (Bell and Mishara, 2006), including the current findings, have failed to detect a relationship. While there is overlap between negative and cognitive symptoms in terms of onset, prevalence, course and correlations with other aspects of the illness, the literature and current findings suggests that they are conceptually independent (Harvey et al., 2006).
Similar to the Cognitive Disorganisation factor, the majority of correlations between Unusual Experiences and Introvertive Anhedonia and neurocognition were not significant. Interestingly, both factors significantly correlated with several cognitive tasks (with small effect sizes), consistent with previous research (Louise et al., 2015; Matheson and Langdon, 2008). This suggests that some O-LIFE items are broader than the PANSS items and are capturing experiences partly associated with neurocognition. The O-LIFE introduces concepts such as loneliness and social enjoyment not looked at individually in the PANSS. These psychosocial characteristics have been previously related to neurocognition (Flatt and Hughes, 2013; Wilson et al., 2007) and a key next step in this work would involve determining which specific aspects of the O-LIFE capture and predict cognition. While previous research has indicated that neurocognition is not associated with psychometrically assessed schizotypy, these studies were conducted in high functioning college student samples and were driven by Meehl’s (1962) taxonic theory of schizotypy (Chun et al., 2013). The current study considers the fully dimensional model of schizotypy and includes a wider range of non-clinical participants, both in age and education level. Therefore, these findings are novel in regard to neurocognitive deficits in schizotypy and warrant further investigation.
Limitations
The control sample had low mean schizotypy scores compared to published norms (Mason and Claridge, 2006). The control sample was also significantly younger and more educated compared to the patient population. Age could not be controlled for in Spearman’s Rho correlations involving the mazes raw score and individual disorganisation/concrete items, leaving the contributing role of age unclear. As the PANSS was only rated for patients, the sample size and spread in cognitive analyses involving the PANSS was smaller than those involving the O-LIFE. Unexpectedly, a large proportion of patients had lower schizotypy scores than controls. As all patients were outpatients on stable medication, this may have reduced their overt symptom presentation and severity, which also explains the relatively low PANSS scores. In addition, this study conducted a one-time assessment of schizotypy in patients, therefore only capturing schizotypy at clinically stable periods. These limitations necessitate the replication of these findings with a more acutely unwell patient population experiencing higher symptom severity and including inpatients, as well as using a matched control group. Examination of schizotypy scores longitudinally would also be beneficial, investigating whether schizotypy scores during clinically stable periods predict corresponding PANSS factors during future psychotic exacerbations.
Clinical implications and future research
A key clinical implication is that the findings of this study may help to reduce the stigma surrounding schizophrenia. This study demonstrates that schizophrenia is not a categorical diagnosis but rather a dimensional one, with schizotypy traits present as a continuum in the general population. Research has shown that continuum messages have a better effect on views of mental health in non-clinical individuals (Corrigan et al., 2017), as well as lower desire for social distance from patients with schizophrenia (Subramaniam et al., 2017).
This study also demonstrated that there is no significant difference in Impulsive Nonconformity scores between patients and controls. In addition, Impulsive Nonconformity did not correlate with Stroop (measuring inhibition) or any schizophrenia symptom cluster. This is inconsistent with a previous study that found significant positive correlations between Stroop measures and Impulsive Nonconformity (Louise et al., 2015); however, the previous study was conducted in a smaller sample and in healthy adults only. The current study demonstrated that Impulsive Nonconformity does not differentiate between patients and controls, does not follow a continuum (Figure 1) and does not capture cognitive inhibition (and therefore lack of self-control and impulsivity) or negative symptoms. This suggests that this factor is not following the fully dimensional model and not capturing impulsive or antisocial behaviour that it was constructed to measure. Therefore, this study favours the exclusion of Impulsive Nonconformity from the O-LIFE, consistent with previous studies that have also questioned the inclusion of this scale (Cochrane et al., 2010).
In regard to the accurate reflection of schizophrenia symptoms by schizotypy factors, cognitive impairment was found to be an independent dimension to positive, negative and disorganisation symptom clusters. This finding emphasises the need for unique treatment approaches to cognition. In addition, as disorganisation and neurocognition are independent, the O-LIFE Cognitive Disorganisation factors needs to be refined to capture these two symptom clusters separately and more accurately, again favouring the revision of the current schizotypy scale. In order to do this, further research needs to be conducted to determine which O-LIFE items are associated with cognitive deficits; in particular HVLT, symbol-coding, verbal fluency, Mazes and the Stroop task which significantly correlated with schizotypy factors in this study. Further research should also be conducted investigating other self-report questionnaires assessing schizotypy. Previous research has demonstrated that self-report questionnaires can be used to measure the familial risk of developing schizophrenia, though not as accurately as interview-assessed schizotypy (Catts et al., 2000). While it was suggested that self-report questionnaires should be supplemented with interviews, a revision of the O-LIFE and other self-report questionnaires assessing schizotypy may be useful in increasing the accuracy of detecting familial schizophrenia risk, which could then be administered on its own during screening.
In summary, this is the first study to use distributional, epidemiological and psychopathological validity checks to provide empirical evidence for the fully dimensional nature of schizotypy across the psychosis continuum. These findings confirm that schizotypy is present in both the clinical and non-clinical populations and is distributed along a severity continuum. In addition, this study demonstrates that subclinical positive and negative symptoms significantly correlate with and accurately reflect the positive and negative symptoms observed in patients with schizophrenia, supporting the use of schizotypy as a model for schizophrenia. This study also supports that neurocognition is a core independent symptom of schizophrenia and should not be considered an overlapping construct of positive, negative or disorganised symptoms, necessitating unique and separate treatment of cognitive impairment.
Supplemental Material
Supplementary_final – Supplemental material for Do schizotypy dimensions reflect the symptoms of schizophrenia?
Supplemental material, Supplementary_final for Do schizotypy dimensions reflect the symptoms of schizophrenia? by Elizabeth HX Thomas, Susan L Rossell, Eric J Tan, Erica Neill, Tamsyn E Van Rheenen, Sean P Carruthers, Philip J Sumner, Stephanie Louise, Kiymet Bozaoglu and Caroline Gurvich in Australian & New Zealand Journal of Psychiatry
Footnotes
Declaration of Conflicting Interests
The author(s) declared no potential conflicts of interest with respect to the research, authorship and/or publication of this article.
Funding
This work was supported by a National Health and Medical Research council project grant (National Health and Medical Research Council [NHMRC] APP1060664 awarded to S.L.R.). E.H.X.T. was supported by an Australian Postgraduate Award at Monash University. T.E.V.R. was supported by a NHMRC Early Career Fellowship (APP1088785). T.E.V.R. receives grant funding unrelated to the current paper from the Jack Brockhoff Foundation, the University of Melbourne, the Barbara Dicker Brain Sciences Foundation, the Rebecca L Cooper Foundation and the Society of Mental Health Research (SMHR Australia). C.G. was supported by a NHMRC Early Career Fellowship (546262). S.L.R. and T.E.V.R. received funding from Australian Rotary Health/Bipolar Expedition and the Helen McPherson Smith Trust, which partly funded some of the healthy control data in this paper.
References
Supplementary Material
Please find the following supplemental material available below.
For Open Access articles published under a Creative Commons License, all supplemental material carries the same license as the article it is associated with.
For non-Open Access articles published, all supplemental material carries a non-exclusive license, and permission requests for re-use of supplemental material or any part of supplemental material shall be sent directly to the copyright owner as specified in the copyright notice associated with the article.