
Abstract
Objectives:
Few adolescent-specific depression screening instruments have been developed in recent years using multi-method approaches (qualitative and quantitative), and some of those available have limitations with an adolescent audience. We describe the development of a potential measure – the Taouk Scale for Adolescent Depression.
Methods:
Draft items were informed by findings from focus groups and reviews by adolescents and healthcare professionals, resulting in a provisional 97-item scale. This was administered to a nation-wide sample of 3087 secondary students. Exploratory factor analysis was used in a development subset to examine dimensionality of items and reduce their number, with the final item set evaluated in a validation subset.
Results:
Four reliable factors – negative outlook, emotional distress, behavioural changes and cognitive and somatic disturbances – were obtained from the exploratory factor analysis, resulting in a 28-item instrument, which was corroborated by confirmatory factor analysis. The final scale includes a number of novel items not included in current measures, i.e., whether respondents wear more black clothing than usual, deliberately damage property, take more risks, ‘space out’ at school and are engaged in substance abuse and/or increased sexual activity.
Conclusion:
The Taouk Scale for Adolescent Depression demonstrated sound psychometric properties and may have utility for future screening and future epidemiological purposes. It appears to be a valid and reliable screening instrument for adolescent depression that includes a number of novel items. Further research is necessary to confirm its criterion validity in clinically depressed samples.
Background
Major depressive disorder (MDD) is a major contributor to years lived with disability globally and accounts for higher mortality and morbidity rates, as well as greater financial costs, than any other psychiatric disorder (Saluja et al., 2004; Vos et al., 2012). The age of onset for depressive disorders spans multiple decades of life, with a significant minority beginning in adolescence (Kessler et al., 2005; Merry, 2016). The recent second Australian Child and Adolescent Survey of Mental Health and Wellbeing shows a 2.8% 12-month prevalence of MDD in 4- to 17-year-olds, making it the third most common mental health disorder in this age group (Lawrence et al., 2016).
In Australia, suicide is the leading cause of death among 15- to 24-year-olds (Australian Bureau of Statistics, 2013). In total, 19.7% of Australian adolescents with MDD report a suicide attempt within the previous 12 months (Zubrick et al., 2016), which highlights the clear association between MDD and suicidal behaviours (Merry, 2016).
In view of the high associated morbidity and mortality, the capacity to screen for MDD at the epidemiological level is critical in order to appropriately refer at-risk youth for further evaluation (Siu and US Preventive Services Task Force, 2016). The US Preventive Services Task Force on Screening for Depression in Children and Adolescents recently reviewed the evidence on the benefits and harms of screening and treatments. This review shows that treatment of MDD detected through screening in adolescents was associated with moderate benefit (e.g. improved depression severity, depression symptoms and/or global functioning scores). On the basis of this evidence, the Task Force recommended screening for MDD in adolescents aged 12–18 years (Siu and US Preventive Services Task Force, 2016). However, it should be noted that screening also has potential disadvantages, including the possibilities that normal levels of ‘adolescent angst’ may be flagged through screening and that screening positive on an initial screening tool is not necessarily indicative of a need to receive treatment.
There are a number of screening options for adolescent depression. Some of the widely used measures are derivations of scales originally developed for depression in adults (Brooks and Kutcher, 2001; Parker and Roy, 2001), meaning that the symptoms assessed and the language used may not be the most appropriate for use with adolescents.
Examples of specific adolescent depression scales include the Reynolds Adolescent Depression Scale (RADS; Reynolds, 2002) and the Kutcher Adolescent Depression Scale (Brooks and Kutcher, 2001). These measures do not assess some of the symptoms that may be relevant to adolescent depression, such as academic decline, increased substance misuse and disruptive behaviour (Needham, 2007). Other scales that have been developed more recently include the Youth Self-Report Scale (Aebi et al., 2009) and the Depression Screener for Teenagers called DesTeen (Pietsch et al., 2011). The former was derived from the broader Child Behaviour Checklist designed to measure constructs such as aggression, hyperactivity, bullying, conduct problems, defiance and violence. The latter was specifically developed for use in primary care settings, is tailored to a narrow age bracket (13- to 16-year-olds) and was developed and written in German, although is also available and has been validated in English (Pietsch et al., 2011).
Another widely used measure of depression is the Short Mood and Feelings Questionnaire (SMFQ), which comprised 13 items and was developed for detecting clinically meaningful signs and symptoms of depressive disorders in children and adolescents by self-report (Angold et al., 1995). It is based on a longer 33-item scale. Both the SMFQ and the longer version have satisfactory reliability and internal consistency with an adolescent audience (Crowe et al., 2006; Messer et al., 1995; Ottenbreit and Dobson, 2004; Sharp et al., 2006). However, the recommended age group for this scale is 8–18 years – a very broad age band.
This brief overview shows that most existing scales are not developmentally specific to adolescents. We are not aware that any of the scales were developed using a qualitative methodology to derive items relevant to adolescents, and thus, item generation for the existing instruments has been theory-driven. To overcome this limitation, we used a qualitative methodology to ensure that items were informed by the lived experience of adolescents, included age-relevant questions and that the language and style used were age-appropriate and sufficiently meaningful to adolescents.
Aims of the study
The aim of this study was to develop a contemporary adolescent-specific and psychometrically valid scale (hereafter termed the Taouk Scale for Adolescent Depression [TSAD]) using both qualitative and quantitative methods. A decision was made to use an age range of 12–19 years to define adolescence, so as to include 19-year-old students attending participating schools. This definition is consistent with that used by Rao and Chen (2009). It was hypothesised that factor analyses would reveal some potentially novel items within a multidimensional scale to reflect a number of domains of adolescent depression identified by the authors from a literature review, i.e., motivation/outlook, emotional, cognitive, physical/somatic, behavioural and social/relational (Crowe et al., 2006; Kessler, 2012; Parker and Roy, 2001; Pietsch et al., 2011; Rottenberg and Gotlib, 2004; Thapar et al., 2012). It was also hypothesised that the TSAD would demonstrate strong positive correlations with other depression scales (the RADS and the Centre for Epidemiology Depression Scale [CES-D]) and exhibit only weak correlations with a divergent measure (the Child and Youth Resilience Measure [CYRM]). Finally, it was hypothesised that the TSAD would perform similarly to other depression scales with respect to gender differences in scores.
Methods
Scale construction
In addition to incorporating clinical features identified from the review of published studies of adolescent depression, findings from focus groups with 24 adolescents (17 secondary school students and 7 outpatients from an adolescent mental health service) and eight health professionals with clinical expertise in adolescent depression informed the development of an initial pool of items for the TSAD. The health professionals’ disciplines were psychiatry, psychology and social work, with years of experience working with adolescents ranging from 6 to 36 years. All participants were recruited via convenience sampling from the researchers’ professional networks.
Participants were asked to describe the symptoms of adolescent depression. The qualitative data analysis software package NVivo® 9 was used to categorise the transcripts into conceptually clustered trees and nodes according to inductively derived themes and compare themes across the three different participant groups. All symptoms suggested by focus group participants were able to be incorporated into at least one of the six symptom domains posited by the researchers after a review of the literature on adolescent depressive symptoms (see introduction above – a detailed methodology and results from these focus groups will be reported separately). At this stage, the initial item pool for the TSAD included 267 items, comprising about 45 items per depression domain to maximise content validity. These items were then provided to a convenience sample of adolescents (N = 41), which included 11 males and 30 females, aged 16–21 years (M = 18.4 years, standard deviation [SD] = 0.9) in order to obtain feedback on readability and appropriateness of items (Hogan, 2007).
A further convenience sample of expert reviewers (N = 16) was also recruited to advise on the content to be included in the TSAD. This sample comprised five males and 11 females (M = 42.3 years, SD = 12.0), who were selected based on their experience in test construction or adolescent development and adjustment. This group included psychologists, psychiatrists and other relevant disciplines. These expert reviewers evaluated the item pool for content, face and construct validity, and readability.
Focus group and expert reviewer suggestions were then assessed by the project steering committee, which consisted of the five authors of this paper. Over a series of meetings, the steering committee decided on which items to discard (because of poor face validity or redundancy with other items) or which items needed to be re-written. Particular attention was given to those symptoms that were mentioned by focus group participants and which were also identified during the literature review phase. An attempt was made to include a balanced number of positively and negatively worded items. This process resulted in a provisional 97-item scale that incorporated a number of novel items including items assessing music and clothing choice and the amount of time spent ‘online’.
Participants for main study
Participants were recruited for the main study if they met the following inclusion criteria: (1) secondary school students, (2) aged 12–19 years and (3) satisfactory English language skills.
Procedure
Institutional ethics approvals were obtained from eight relevant Human Research Ethics Committees. All research was conducted according to the World Medical Association Declaration of Helsinki. A total of 224 secondary schools across Australia were contacted by mailing an invitation letter to the school principals. In total, 17 of these schools agreed to participate in the study and were available during the data collection phase of the project. The schools involved were considered to be a good representation of secondary schools within Australia since the sample comprised both rural and urban schools that were Catholic, independent or government schools. These schools were also diverse in terms of the socioeconomic index of the suburbs in which they were geographically situated (Australian Bureau of Statistics, 2006). The majority of the 17 schools were also all-girls schools, indicating that male students may be underrepresented.
All students agreeing to participation were required to obtain written parental approval if they were under 16 years of age. Participants were given a Participant Information Statement and Consent Form, and a Parental Information Statement and Consent Form prior to the scheduled testing date. The survey took place using a group format in a supervised classroom during school hours. Students were not required to provide any identifying information. Depending on school resources, students completed either an online or paper version of the survey. The survey took approximately 45 minutes to complete. After completion of the survey, students received a debriefing document containing general information about mental health and researchers’ contact details.
Measures
The survey administered to participants included four measures:
TSAD: The preliminary 97-item TSAD asked respondents to indicate how truly each statement in the scale applied to them generally over the prior 2 weeks, on a 5-point Likert-type scale. Symptom presence ranged from 1 = ‘never true’ to 5 = ‘very true’.
RADS-2: This 30-item scale evaluates the current level of an adolescent’s depressive symptomatology (Reynolds, 2002). It was chosen because it is the most widely used adolescent-specific screening questionnaire (Brooks and Kutcher, 2001). The internal reliability of the RADS-2 was established using a sample of 2240 adolescents, with Cronbach’s α coefficient of 0.92 (Reynolds, 2002). Responses are provided on a 4-point scale ranging from 1 (‘almost never’) to 4 (‘most of the time’). Higher scores on the RADS-2 indicate more severe depressive symptoms (range on scale is 30–120).
CES-D: The CES-D was developed by the Centre for Epidemiologic Studies with adult samples and consists of 20 items, with responses provided on a 4-point scale ranging from 0 (‘rarely or none of the time’) to 3 (‘most or all of the time’) with a range of 0–60 (Radloff, 1977), with higher scores indicating more depressive symptoms. This scale was chosen for inclusion in the study as it is one of the most widely used depression scales for research with adolescents (Brooks and Kutcher, 2001). Previous research provides support for good psychometric properties with Cronbach’s α = 0.85 reported in an adult population (Hann et al., 1999; Radloff, 1977).
CYRM-28: This 28-item self-report component of the larger CYRM was developed for use with subjects aged 12–23 years to assess resilience (Ungar and Liebenberg, 2011). It was chosen for inclusion in this study as a measure of discriminant validity as it is a construct dissimilar to depression. Responses are formatted as a 5-point Likert-type set, ranging from 1 = ‘does not describe me at all’ to 5 = ‘describes me a lot’. Higher scores indicate greater resilience (range: 28–140).
Statistical analyses
Data were analysed using the Statistical Package for the Social Sciences (SPSS, version 20) and Mplus (version 7). The primary analysis of the TSAD was a series of exploratory factor analyses (EFAs), run in a development subset, with the aim of reducing the initial item pool and determining the TSAD factor structure. This was followed by a confirmatory factor analysis (CFA) in a validation subset. Due to the large sample of students, items were analysed as categorical in Mplus using the default WLSMV estimator. Not analysing symptom ratings as categorical can result in severe distortions of the true factor structure (Sharp et al., 2006). The majority of exploratory analyses used ANALYSIS with the TYPE = EFA option, although at some stages the exploratory structural equation modelling (ESEM) feature was also used. Rotation of factors used the default GEOMIN rotation with oblique factors. Survey responses with multiple unanswered questions were excluded from the analyses. Internal consistency reliability was assessed using Cronbach’s alpha coefficient for the overall scale and subscales. Bivariate correlations were used to assess convergent and discriminant validity. One-way analyses of variance (ANOVAs) were used to assess concurrent validity by testing for gender differences in total scores – to determine whether the TSAD performed similarly to the other measures of depression.
Results
Data sets
Overall, 3573 students were initially surveyed (1681 paper and 1892 online). However, some students did not complete a significant amount of the survey and thus had missing data on at least two of the four questionnaires included in the survey (i.e. more than 50% missing data). These surveys were excluded from the analysis set. This also extended to the exclusion of all online surveys that were simply skipped till the end with no questions answered and also paper version surveys that had less than 50% of questions completed (i.e. less than 88 questions answered). On a number of occasions, it was apparent that missing data were the result of a network connection issue that happened within a school during the survey completion. This resulted in some students not being able to access the survey site at the same time, so unfortunately a number of these students only partially completed the survey, and their data were therefore excluded from analyses. Overall, this process excluded 237 surveys from analysis due to incomplete answers, leaving the total number of surveys at 3336.
After this, surveys in which the TSAD (included as the first questionnaire in the survey) was not completed also had to be discarded from analyses since there would be no data with which to correlate the other scales (RADS-2, CES-D and CYRM-28). Thus, a further 21 of the remaining surveys were excluded at this stage, leaving 3315 surveys. A number of surveys had missing data on the TSAD, and while Mplus is able to utilise all data via full information maximum likelihood (FIML) – there is no need to delete subjects – some issues regarding the handling of missing data still need to be considered. First, missing data are suggestive of inattention by the subject or poor compliance. Second, any questions about the performance of FIML in the presence of substantial missing data are not easily dealt with. Finally, substantial missing data can complicate subsequent analyses if they require significant imputation of missing values or involve deletions of subjects that vary sample sizes. Consequently, a decision was made by the steering committee to reduce the number of missing values by excluding all surveys where no responses were provided to more than six items of the TSAD. Given the sample size available, this was not seen to be affecting the proposed analyses.
A further 195 surveys were thereby flagged and excluded from a new database. Finally, after further exclusion of students outside the 12–19 years age range, 3,087 surveys were deemed suitable for inclusion in the EFA and CFA. Consistent with other research (Pai et al., 2007), the dataset was randomly split using the randomisation function in SPSS into a development dataset (N = 2469) and a validation dataset (N = 618) for factor analyses.
Participant descriptive information
Table 1 provides demographic details of the 3087 participants according to type of educational institution attended. To the best of the knowledge of the researchers, no student who met the selection criteria and was present at school on the day of the survey declined participation in the study.
Demographic details by type of secondary school.
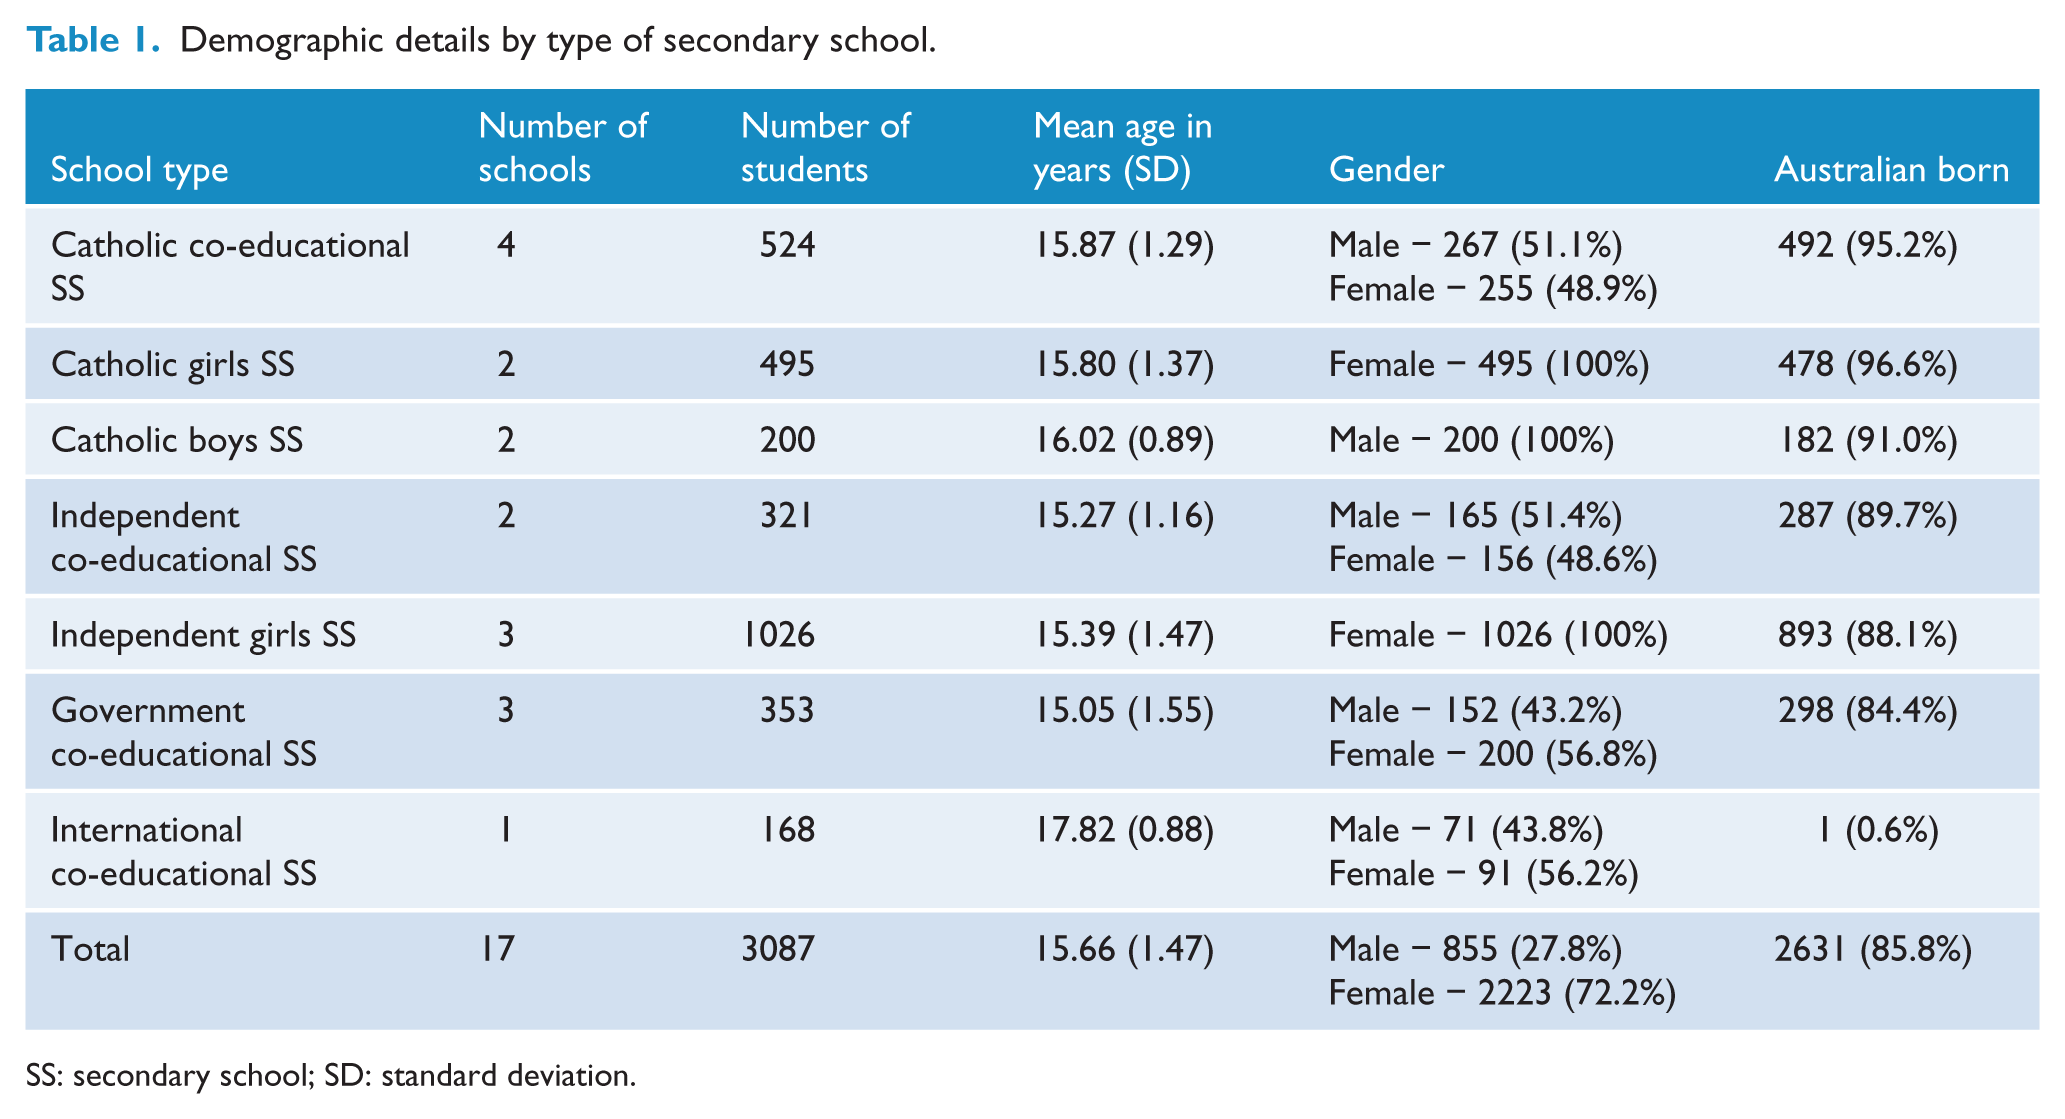
SS: secondary school; SD: standard deviation.
The sample included 855 male (28.0%) and 2223 female students (72.0%). The average age of students was 15.7 years (SD = 1.47, range: 12–19). The majority of participants were drawn from secondary school Year 9 (15.8%), Year 10 (14.6%), Year 11 (34.0%) and Year 12 (24.4%) (Australian secondary schools comprise Years 7–12, with Year 12 being the matriculation year). In total, 2543 (82.4%) were attending an urban school and 544 (17.6%) a rural school.
The development subset comprised 1785 females (72.5%) and 676 males (27.5%), with a mean age of 15.7 years (SD = 1.47). The validation subset comprised 438 females (71.0%) and 179 males (29.0%), with a mean age of 15.6 years (SD = 1.46).
EFA
For the EFA, item retention or removal was based on predetermined criteria in order to establish which number of factors would provide the most interpretable solution. Through an iterative process, items were deleted from the model if they did not load onto any factor or had low factor loadings (below 0.30), had split-loadings (where an item loaded substantially on more than one factor) or if similar but differently worded items loaded onto the same factor, in which case the item with the lower loading was eliminated from further analyses.
An issue that emerged was a method factor related to the positively worded items. The presence of a method factor potentially complicates item reduction because items load strongly on the method factor and weakly on other factors, thus leading to uncertainty over which items to retain. To facilitate item reduction, the ESEM option in Mplus was used as this allowed for (1) positively worded items to be assigned to a single factor (the method factor) and (2) all items to freely load on other factors as usual in EFA. It was found that positively worded items largely met criteria for exclusion, so the final questionnaire was restricted to negatively worded items.
The initial EFA solution for 97 items suggested a 12-factor solution (based on the number of eigenvalues > 1) accounting for 67.6% of the variance (pre-rotation). The final solution comprised 28 items and four oblique factors which accounted for 64.1% of the variance prior to rotation. Table 2 summarises the results from the four-factor obliquely rotated model on the final 28-item TSAD, re-ordered by factor and loadings on other factors suppressed.
Obliquely rotated loadings of TSAD with 28 items re-ordered by factor, and eigenvalue, variance explained and score range for each TSAD factor.
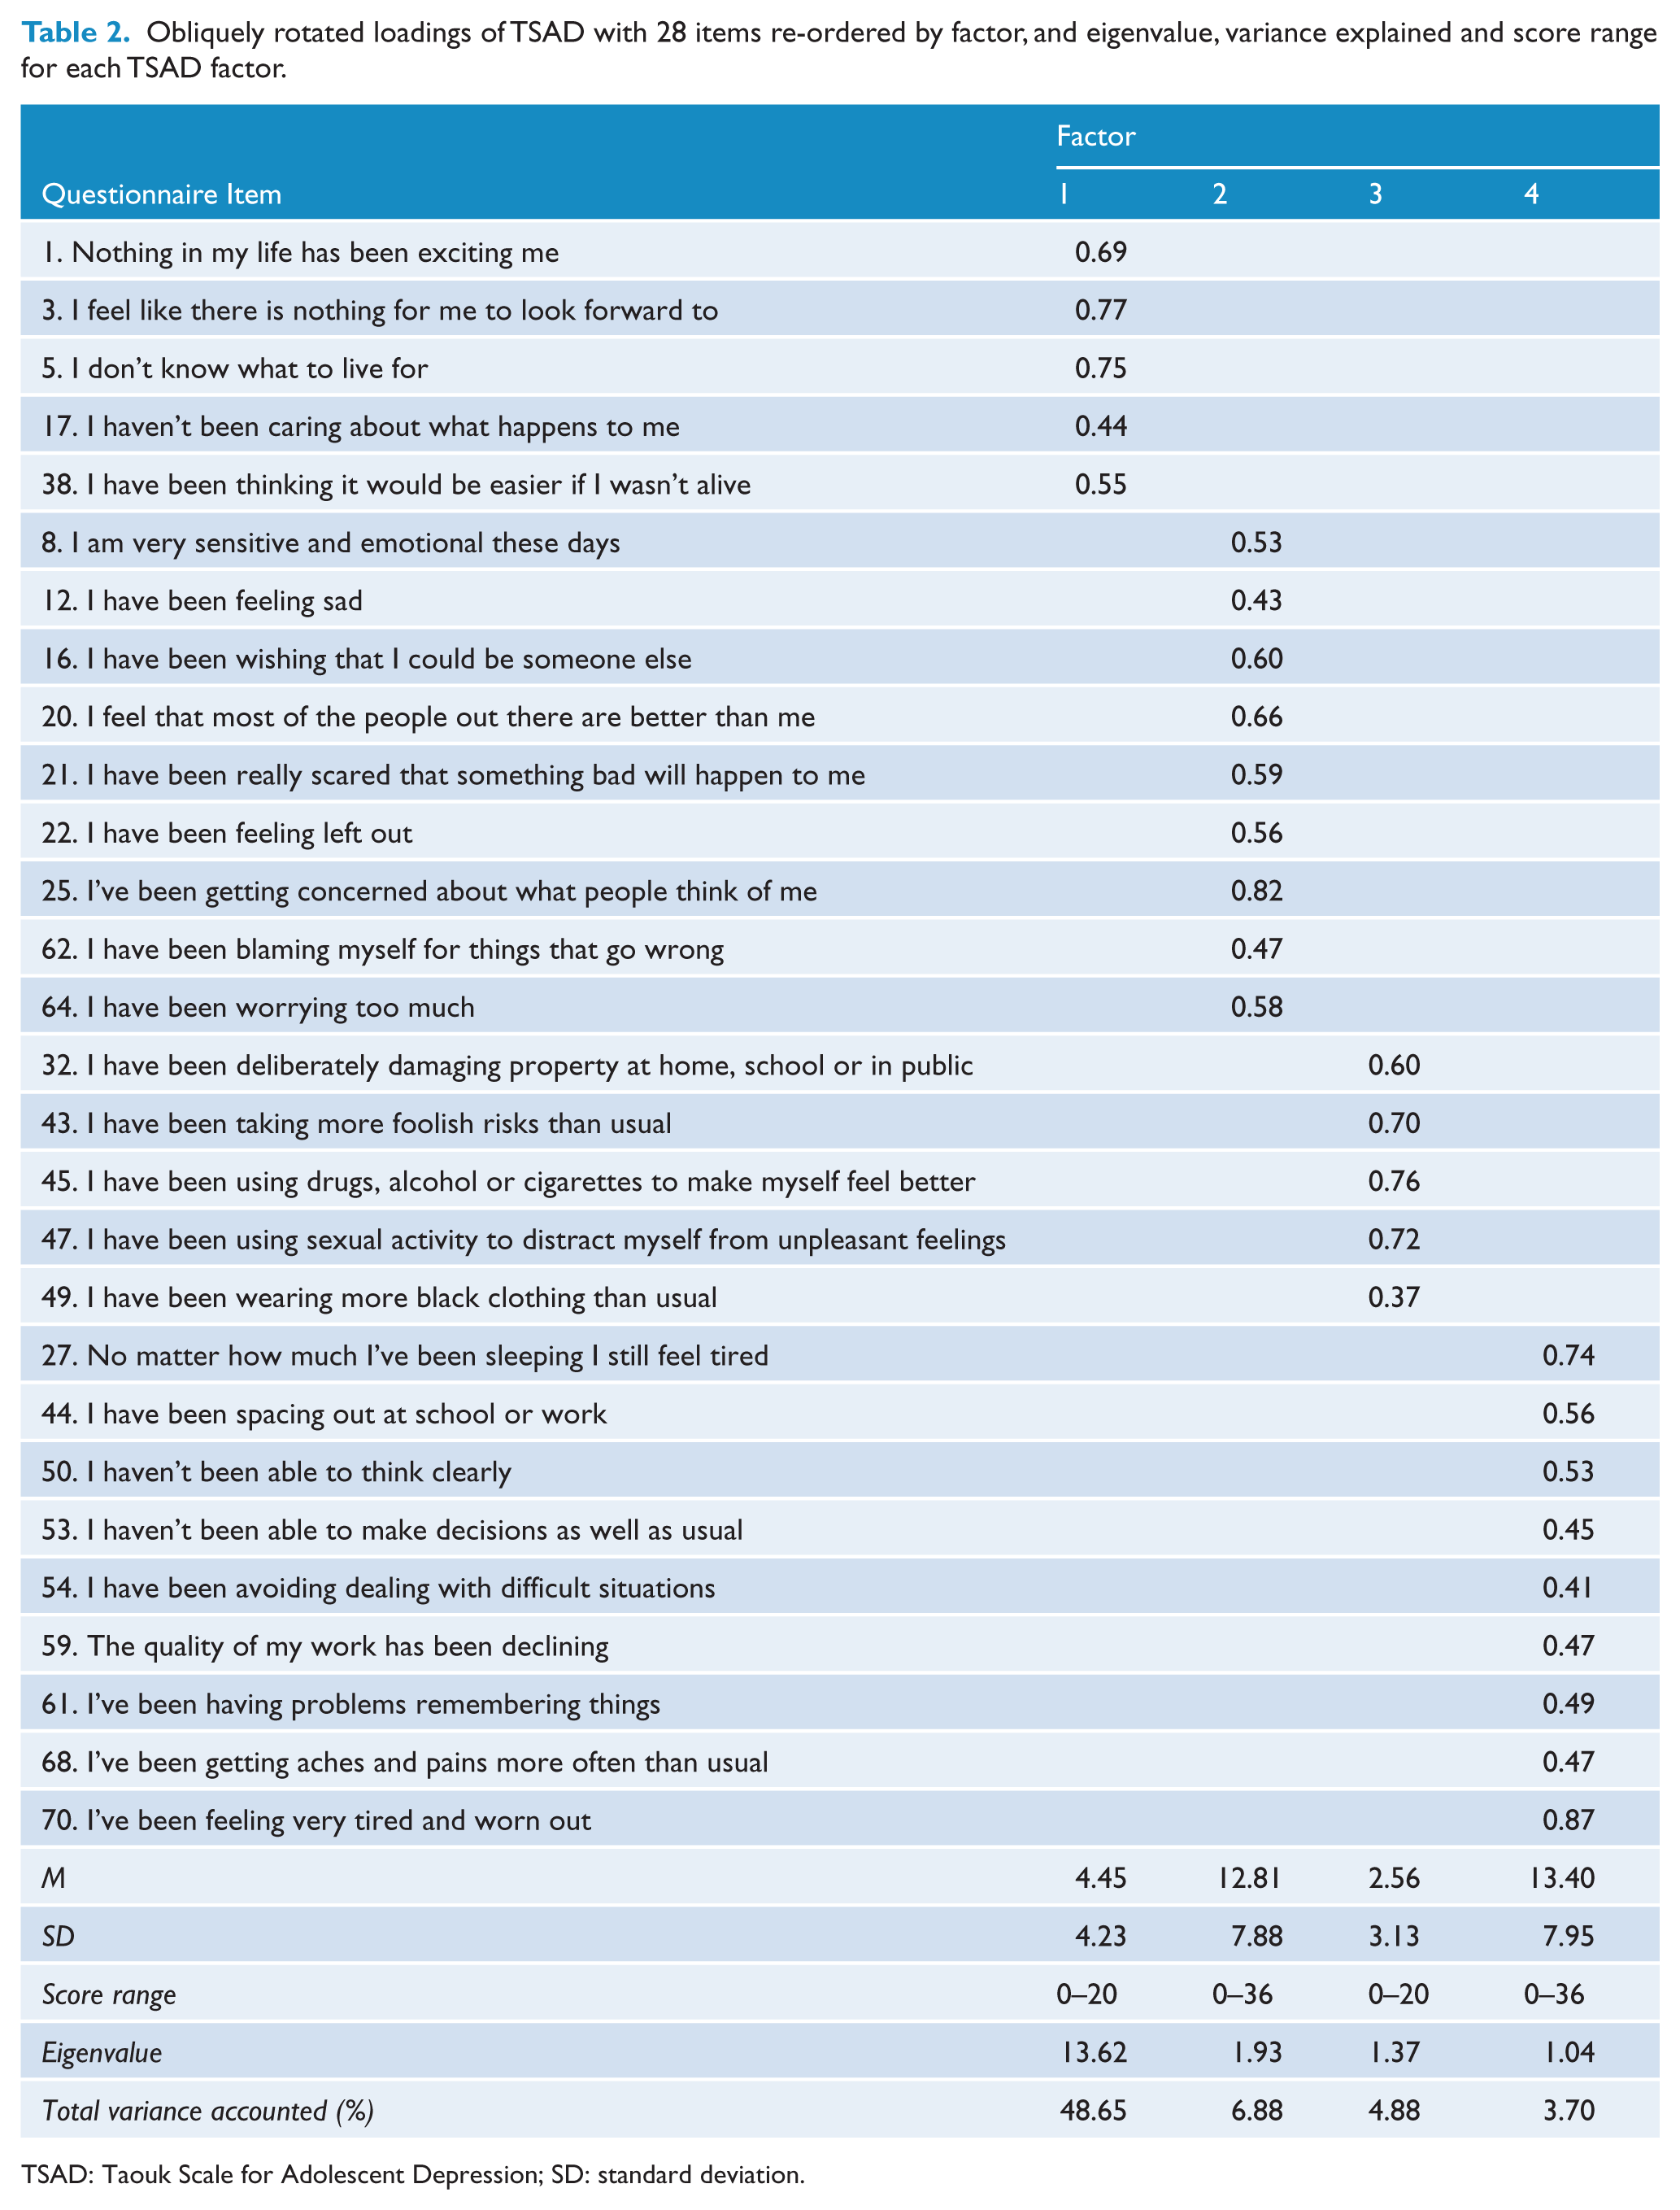
TSAD: Taouk Scale for Adolescent Depression; SD: standard deviation.
The mean total TSAD score for this sample was 33.0 (SD = 20.1). Table 3 displays the mean values and SD for the TSAD subscales, as well as for the other scales used in the study.
Score ranges, means and standard deviations for the TSAD total and subscales and for the RADS-2, CES-D and CYRM-28.
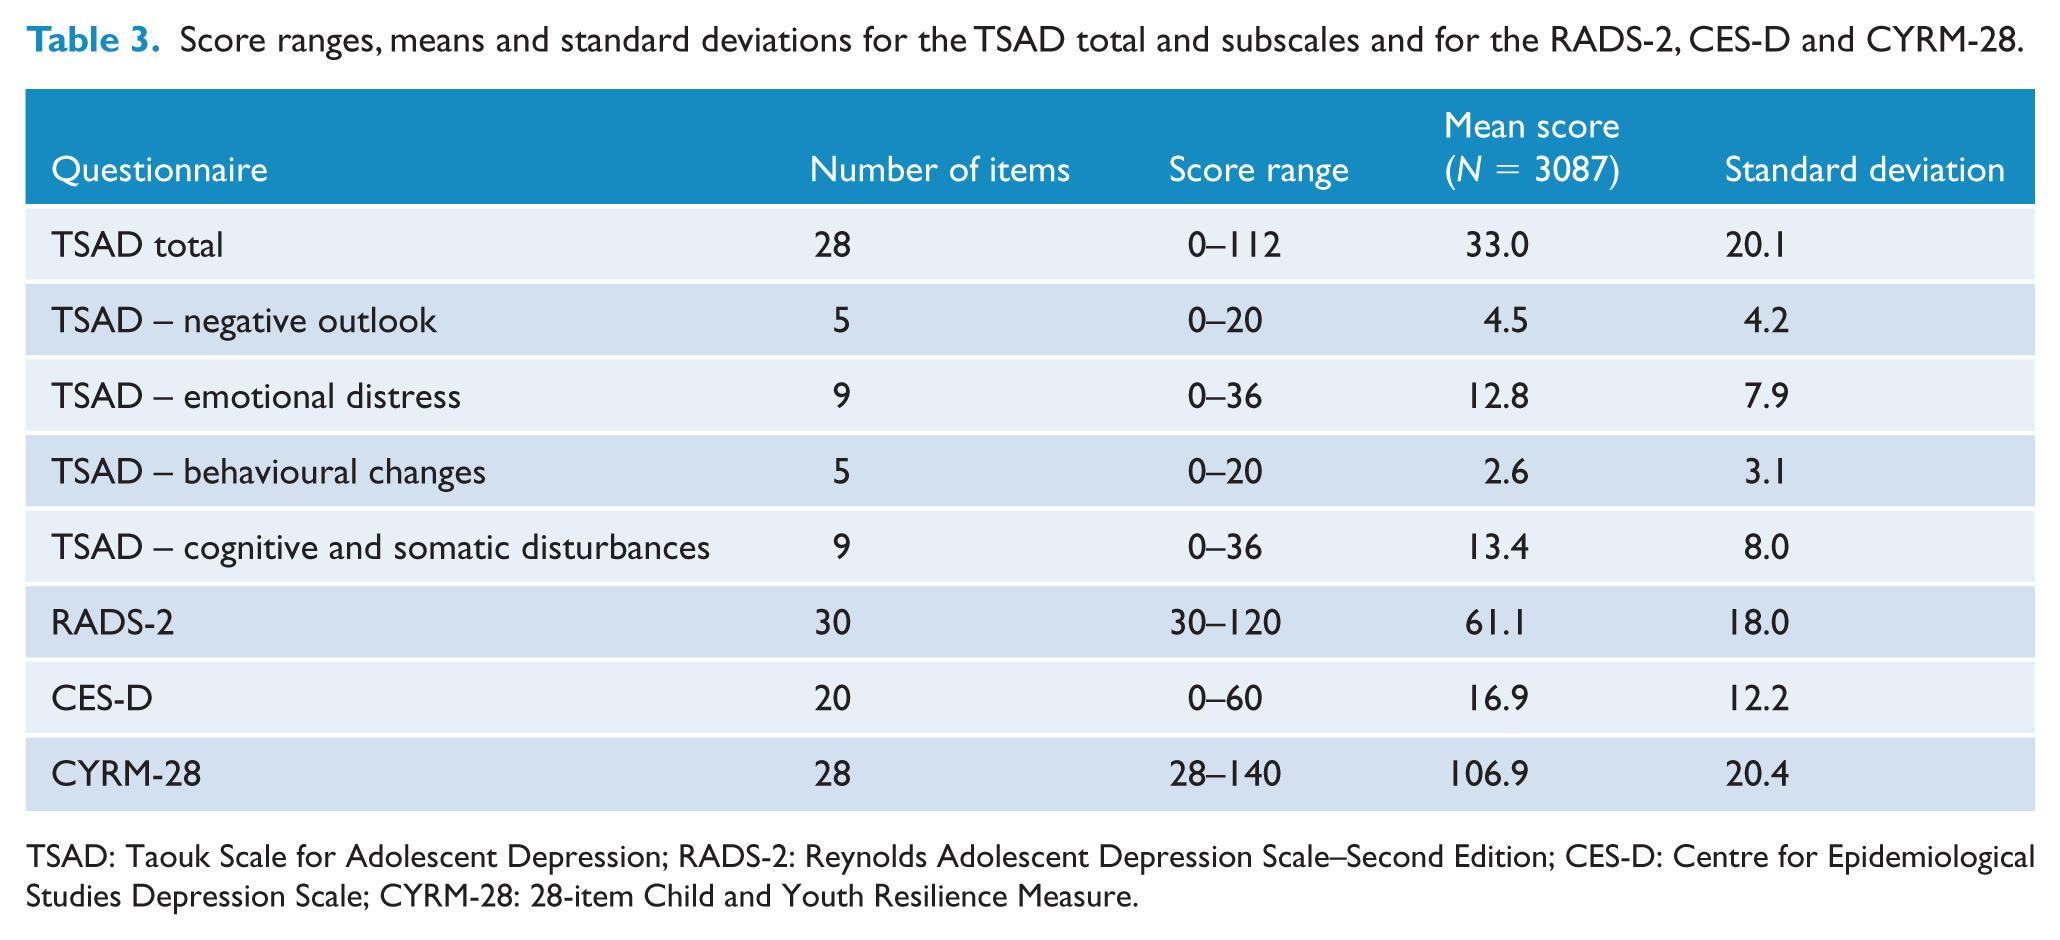
TSAD: Taouk Scale for Adolescent Depression; RADS-2: Reynolds Adolescent Depression Scale–Second Edition; CES-D: Centre for Epidemiological Studies Depression Scale; CYRM-28: 28-item Child and Youth Resilience Measure.
Based on the items with the highest loadings, the factors were named as follows:
Factor 1 – Negative Outlook (five items, e.g., ‘Nothing in my life has been exciting me’);
Factor 2 – Emotional Distress (nine items, e.g., ‘I am very sensitive and emotional these days’);
Factor 3 – Behavioural Changes (five items, e.g., ‘I have been taking more foolish risks than usual’);
Factor 4 – Cognitive and Somatic Disturbances (nine items, e.g., ‘I haven’t been able to think clearly’).
Cronbach’s alpha for the overall TSAD was 0.95. Values for individual domains were as follows: negative outlook = 0.86; emotional distress = 0.90; behavioural changes = 0.71; and cognitive and somatic disturbances = 0.90. Each of the subscales reached or exceeded an alpha level of 0.70, revealing high internal consistency (Tabachnick and Fidell, 2007). Table 4 displays correlations between TSAD subscales.
Pearson product moment correlations between TSAD subscale scores.
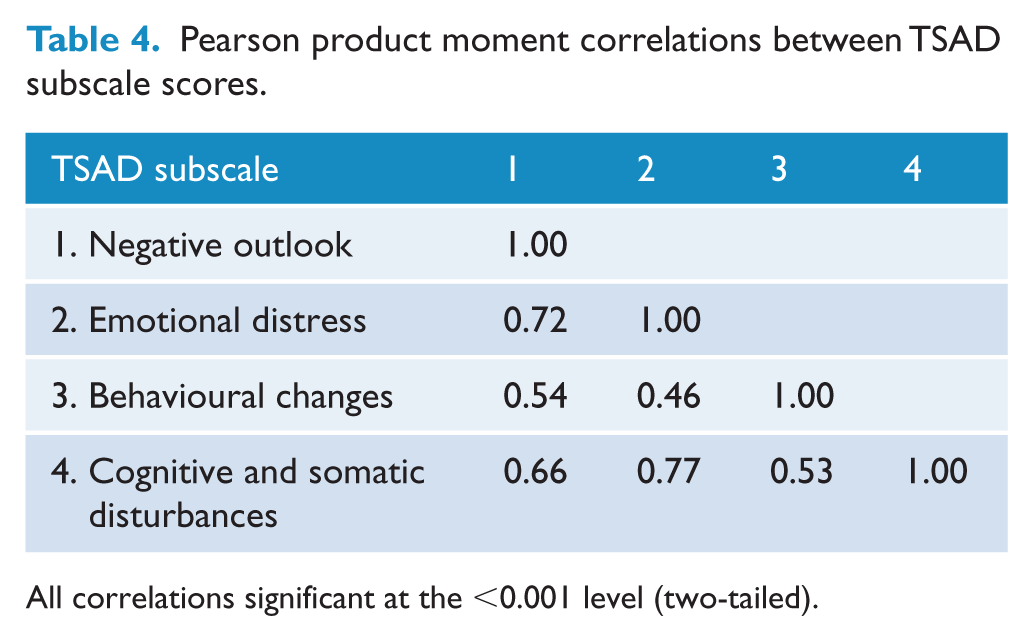
All correlations significant at the <0.001 level (two-tailed).
These findings suggested that the factors were likely to be measuring distinct but related components.
Indices of fit and CFA
The four-factor solution derived from the EFA in the development subset was then cross-validated using the confirmatory sample (N = 618). The CFA in the validation subset of the 28 items in the final solution was very similar to the results obtained in the EFA. To determine how well a solution fits the data, a number of indices of fit have been suggested as alternatives to the standard χ2 test for goodness of fit, including the root mean square error of approximation (RMSEA; <0.08 acceptable, <0.05 excellent) (Brown and Cudeck, 1993); the comparative fit index (CFI) and Tucker–Lewis Index (TLI), for both of which values of 0.95 or higher are considered excellent (Bentler, 1990; Tucker and Lewis, 1973). These criteria are quite stringent for models fitted to item data.
The EFA in the development subset had the following results: χ2 = (df = 272) = 2080.14, p < 0.0001; RMSEA = 0.05, CFI = 0.98 and TLI = 0.97. The CFA in the validation subset produced the following results: χ2 (df = 344) = 1232.90, p < 0.0001; RMSEA = 0.07, CFI = 0.95 and TLI = 0.95.
Tests of convergent and discriminant validity: bivariate correlations
Table 5 details correlations based on scores of the total sample (N = 3087) between the TSAD (total score and factor scores) and the measures used to establish convergent and discriminant validity: (1) convergent measures – RADS-2 and CES-D and (2) divergent measure – CYRM-28. All correlations were significant at the p < 0.001 level (two-tailed).
Correlations between TSAD (total and factors) and other scales.
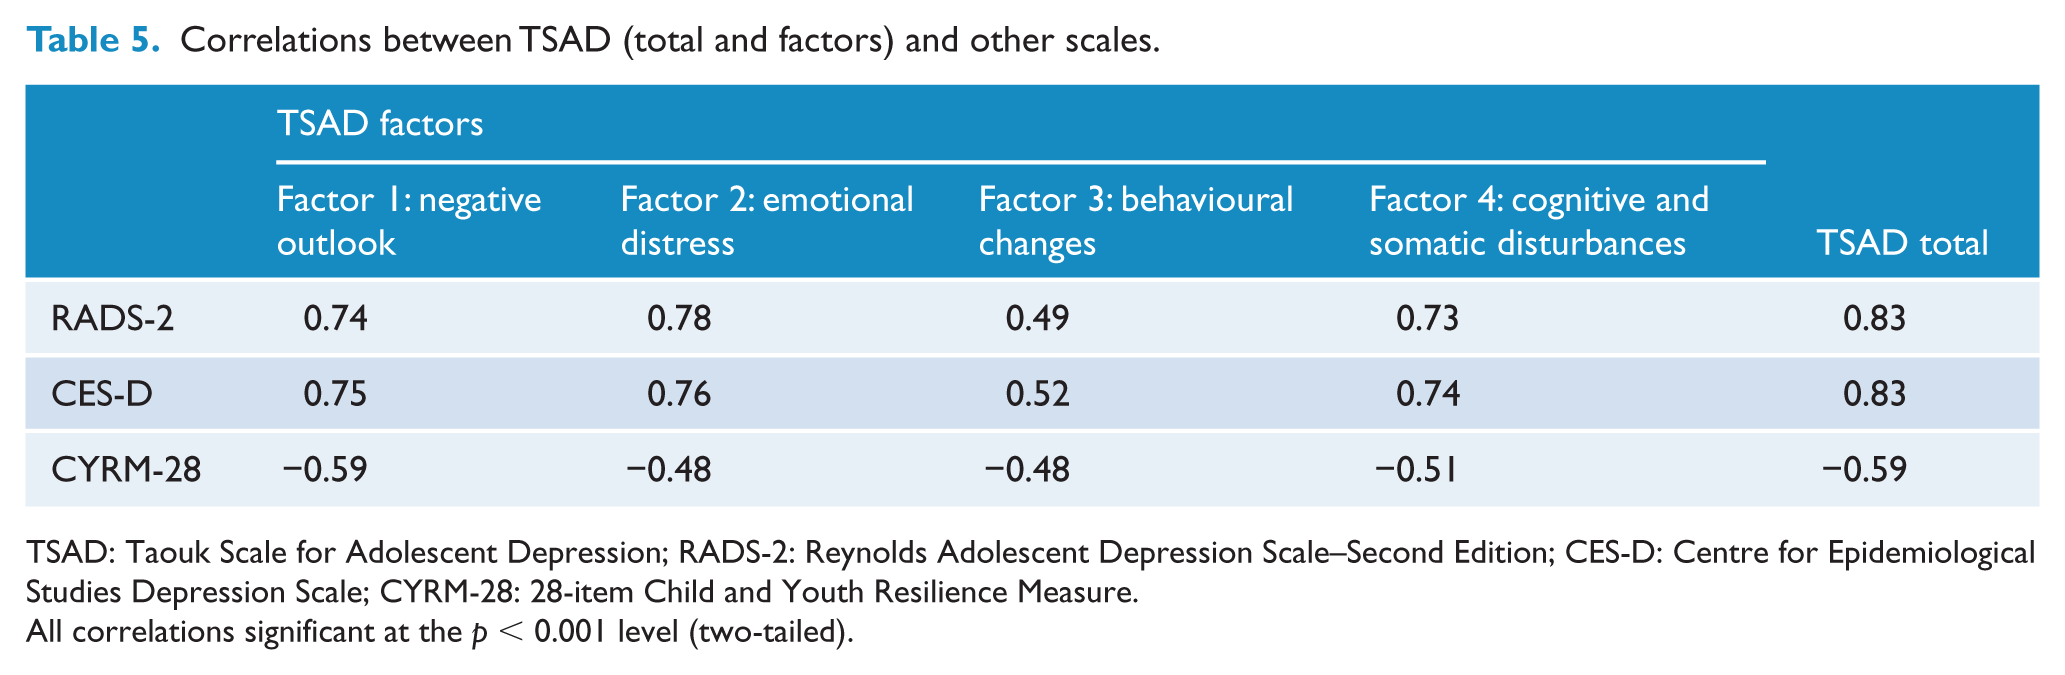
TSAD: Taouk Scale for Adolescent Depression; RADS-2: Reynolds Adolescent Depression Scale–Second Edition; CES-D: Centre for Epidemiological Studies Depression Scale; CYRM-28: 28-item Child and Youth Resilience Measure.
All correlations significant at the p < 0.001 level (two-tailed).
The TSAD total score and all factor scores with the RADS-2 and CES-D total scores were significantly and positively correlated. Total and subscale TSAD scores and the measure of resilience – the CYRM-28 – were significantly and negatively correlated.
Relationships between TSAD total scores/factors and gender
A one-way ANOVA found that overall TSAD scores differed significantly between females (M = 34.92; SD = 20.23) and males (M = 28.07; SD = 18.96) (F(1, 2961) = 70.38, p < 0.001; Δ95% confidence interval [CI] = [5.25, −8.45]). This gender difference was also consistent across each of the TSAD subscales, except for ‘behavioural changes’. For this subscale, males (M = 3.08; SD = 3.30) had significantly higher scores than females (M = 2.35; SD = 3.02) (F(1, 3058) = 33.92, p < 0.001; Δ95% CI = [−0.97, −0.48]).
Gender differences were also explored for the validating depression measures. Females had higher scores on both the RADS-2 (females [M = 63.04; SD = 18.08] vs males [M = 55.74; SD = 16.90]) (F(1, 2808) = 94.65, p < 0.001; Δ95% CI = [5.83, −8.77]) and the CES-D (females [M = 17.98; SD = 12.61] and males [M = 13.94; SD = 10.52]) (F(1, 2744) = 60.38, p < 0.001; Δ95% CI = [3.02, −5.05]).
Discussion
This paper describes the development of a new proposed screening measure for adolescent depression – the TSAD. The most parsimonious factor solution for the scale was a four-factor solution consisting of 28 items. While the hypothesised six-factor structure was not confirmed, all six a priori domains were reflected in the multidimensional construct represented in the TSAD.
The first factor – ‘negative outlook’ – was the dominant factor and accounted for most of the variance (48.65%) in the factor solution. This factor included some standard symptoms of depression, i.e., loss of interest, not being excited by anything and having no hope for the future. These items are consistent with previous research indicating the centrality of changes in motivation and outlook, including reduced ability to experience pleasure and hopelessness (Kessler, 2012; King et al., 2006; Weller and Weller, 1985). Items encompassing negative outlook are incorporated in many depression scales, including the Beck Depression Inventory (BDI-II; Beck et al., 1996). Although overt suicidal ideation items were not retained in the final TSAD factor solution, two items that implicitly assess suicidal ideation were retained: ‘I don’t know what to live for’, and ‘I have been thinking it would be easier if I wasn’t alive’.
The second factor – ‘emotional distress’ – included nine items, each of which assessed common symptoms of depression, such as feeling sad and/or emotional, irrational fear and self-blame. This factor is consistent with previous research indicating the importance of emotional disturbances in depression (American Psychiatric Association, 2000; Beck et al., 1996; Rottenberg and Gotlib, 2004). This domain also included items assessing social withdrawal and interpersonal difficulties, such as ‘I feel that most of the people out there are better than me’ and ‘I have been feeling left out’. These items align with research describing the close relationship between depression and peer relationship difficulties in adolescence (Thapar et al., 2012).
The third factor – ‘behavioural changes’ – included items assessing behavioural changes and risk-taking, which are typically associated with adolescent depression (Bennett et al., 2005; Hallfors et al., 2004; Needham, 2007), although not strongly represented in extant adolescent depression measures. Along with substance abuse, other risk-taking behaviours that are linked with adolescent depression include inappropriate sexual promiscuity, antisocial behaviours and general ‘acting-out’ (Hallfors et al., 2004; Nease and Malouin, 2003; Stringaris et al., 2012). Although items to assess reduced libido were included in the provisional 97-item list, these failed to load significantly in the final factor solution. This may be because libidinal disturbance manifests more as an increase in sexual behaviour (i.e. as a form of risk-taking) in adolescent depression, in contrast to the loss of libido more commonly reported by depressed adults. The concept of irresponsible sexual activity has been reported previously in the literature in relation to adolescent depression (Hallfors et al., 2004). Another unique item retained in the final factor solution was ‘I have been wearing more black clothing than usual’. This behaviour has not previously been reported in the adolescent depression literature.
The fourth factor – ‘cognitive and somatic disturbances’ – is consistent with prior research, particularly observed when depressive severity reaches a clinical level (Crowe et al., 2006). This factor included items that assess biological and cognitive changes, according to prior adolescent depression literature, which posits that some of the most frequently reported characteristics of depression in adolescents are ‘thought-processing’ symptoms, such as reduced concentration and indecisiveness and decreased school performance (Crowe et al., 2006; Weller and Weller, 1985). Furthermore, depression has long been associated with academic impairment (Mackenzie et al., 2011; Weller and Weller, 1985). This was assessed by a number of TSAD items in this factor, such as ‘The quality of my work has been declining’.
The novelty of some of the items included in the TSAD – particularly those that assess clothing choice and risk-taking behaviour such as substance use and increased sexual activity – distinguish this scale from other depression measures used in the field. Furthermore, the validity of the four-factor EFA solution in the development sample was underscored by the verification of these in the CFA (Milfont et al., 2008).
The content validity of the TSAD was supported by the review of the provisional items by experts in the field of adolescent depression and a focus group of adolescents. The factor analyses supported the sound construct validity of the TSAD. Furthermore, subscale correlations were reasonably high, indicating substantial shared variance among factors.
The convergent and discriminant validity of the TSAD were determined by examining the relationship between the TSAD and convergent (RADS-2 and CES-D) and divergent (CYRM-28) measures. The TSAD demonstrated a strong positive relationship with the RADS-2 (r = 0.83) and the CES-D (r = 0.83), which suggests acceptable convergent validity (Hogan, 2007). Contrary to what was hypothesised, the TSAD total scale and subscales exhibited a significant, negative correlation (r = −0.59) with CYRM-28. This result provides no support for discriminant validity (Hogan, 2007), given that discriminant validity refers to a low degree of correlation between a measure and variables with which it should theoretically differ (Anastasi, 1990).
Concurrent validity was supported by the finding of similar gender differences on scores to those demonstrated with the RADS-2 and the CES-D.
Strengths and limitations
The major strengths of the study were the prior detailed qualitative methodology to ascertain suitable scale items and the large sample of over 3000 secondary school students across Australia for the main study. One limitation of the study was that the schools invited to participate represented a convenience sample and that the adolescent sample was predominantly female; both factors may impact the generalisability of the findings. In addition, the sole use of self-report in collecting data from an adolescent sample may have affected accuracy of results since there may be variation in participants’ willingness to report negative feelings and issues with self-worth or depressed mood. A further potential limitation was the choice of a measure of resilience as the index of discriminant validity, as it could be argued that lack of resilience can be a risk factor for depression, i.e., resilience is not a construct orthogonal to depression. Comparisons with scales measuring constructs one would expect to be unrelated, such as conduct disorder or physical illness, would be better suited to demonstrate discriminant validity.
Conclusion
We have described the development of a new screening measure for adolescent depression – the TSAD – which included a number of novel items, which may assist in improving identification of depression in this age group. These items assessed whether respondents wore more black clothing than usual, deliberately damaged property, took more foolish risks, ‘spaced out’ at school and were engaged in substance abuse and/or increased sexual activity. These items are not included in any of the current adolescent depression measures (Hallfors et al., 2004; Needham, 2007).
A next critical step in the development of the TSAD will be to determine the criterion validity of this instrument against a gold standard instrument, such as a structured clinical interview, and to assess the instrument’s predictive validity by ascertaining whether the instrument can assess adolescents who will in the future develop depression. Following further validation, the TSAD may be used to aid clinical assessment and is likely to be a useful instrument for improving early detection of adolescent depression in community samples.
Footnotes
Acknowledgements
We are grateful to all the participants as well as the staff of the participating schools.
Declaration of Conflicting Interests
The author(s) declared no potential conflicts of interest with respect to the research, authorship, and/or publication of this article.
Funding
The author(s) disclosed receipt of the following financial support for the research, authorship, and/or publication of this article: The researchers would like to thank the Anika Foundation which supports research into adolescent depression and suicide, and the Macquarie Group Foundation for funding this research. Bettina Meiser is supported by a Senior Fellowship from the National Health and Medical Research Council of Australia (ID 1078523). Philip Mitchell’s research is supported by a NHMRC Program Grant (1037196).